effect of cyclodextrins on the flavour of goat milk and its yoghurt
TRANSCRIPT

Effect of cyclodextrins on the flavour of goat milk and its yoghurt
Rajni Bala Gupta
Thesis submitted in fulfilment
for
Postgraduate Diploma in Applied Science (Research)
Auckland University of Technology
Auckland
November, 2004
The results in this thesis are confidential as described on page (iii). The thesis must not
be given to anyone who is not directly involved in its examination.

CONFIDENTIAL
ii
Acknowledgements
First of all, I pay my sincere thanks to my supervisor, Associate Professor Owen Young,
for his valuable supervision. A key factor behind this research was his encouraging,
appreciative and tolerant attitude.
I would also like to thank Thought Group Limited and Technology New Zealand for
funding this research, under Enterprises Scholarship scheme.
Also, I am thankful to Clyde Langford and Adam Hampson, who supplied free goat
milk for this research.
I would like to thank AUT laboratory technicians for their time and support.
I am thankful to Applied Science and Engineering staff and students for being panellists
on the sensory experiments held frequently during this study.
I pay my sincere gratitude to my brother, Darshan Agarwal, for encouraging me to
become qualified in food sciences.
I appreciate the support and patience I got from my husband Sukhdarshan Gupta, and
my son Vikram during my study.
CONFIDENTIAL
iii
Confidential Material
The contents of this thesis are confidential because of a commercial agreement with
Thought Group Limited Auckland, and Technology New Zealand, parties that helped
fund this work. The results have significant commercial value. However, it was agreed
that confidentiality would lapse two years from submission of this thesis, after which
time the author would be free to publish the results.

CONFIDENTIAL
iv
Abstract
Background and aim: A previous study showed that addition of β-cyclodextrin to goat
milk made a difference to its flavour, but in an undescribed way. Cyclodextrins (CDs,
comprising α- β- and γ-CD) may be able to bind the free branched chain fatty acids in
goat milk responsible for the largely undesirable ‘goaty’ flavour. The primary aim was
to test the effect of CDs on this flavour in goat milk and its products with a view to
marketing goat milk products with reduced flavour intensity. A secondary aim was to
test the effect of β-CD on skatole flavour, a characteristic flavour of milk from pasture-
fed ruminants.
Study design and methods: The present study evaluates addition of mainly β-CD to
goat milk, cow milk and their products to reduce undesirable flavours. The methods
applied were mainly ranking and hedonic assessment in sensory experiments. The tests
done were with CDs added to buffers and milks, some of which were flavour-enhanced
with 4-methyloctanoic acid as a representative goaty fatty acid, or with skatole. Goat
milk yoghurts were also tested.
Free fatty acid concentrations, which may be affected by CD binding, were measured
after separating cream and skim milk. The methods applied were standard dairy
procedures: titration of free fatty acids in milk fat and the copper-salt method for
measuring fatty acids in skim milk.
A fungal lipase was added to milks to accelerate fat hydrolysis (lipolysis). This was
done to increase the concentration of free fatty acids for several experimental purposes.
Some minor experiments studies were also done, for example the comparative effect of
lipases on goat milk and cow milk, and the lipolytic activity at different temperatures
over different times.

CONFIDENTIAL
v
Results: The results of skatole experiments were inconclusive.
The odour of 4-methyloctanoic acid was reduced in acidic buffers by addition of α- and
β-CD, particularly the former. Alpha and β-CD were both effective in goaty flavour
reduction in goat milk. γ-CD was not effective. In all this work differences were
statistically significant to varying levels. Goaty flavour was reduced by addition of
β-CD to goat milk yoghurt, but only when added before fermentation (P < 0.001), not
after (P = 0.09).
The liking scores for goat milk yoghurts for both plain and flavoured yoghurts increased
with β-CD treatment (both P < 0.001 for 59 panellists).
The chemistry experiments revealed a reduction of free fatty acid concentration in the
fat phase when β-CD treatment was added to full cream cow milk. However, analysis
of skim milk did not show a corresponding increase in concentration. Further
experiments are required to reveal the fate of the ‘missing’ fatty acids.
Conclusion: Overall it was shown that under certain conditions, CDs were effective in
reducing goaty flavour in milk and yoghurts. Whereas CDs are approved for addition to
foods in many countries – including the bellwether U.S.A. – formal approval by Food
Standards Australia New Zealand has not yet been finalized. When it is, the way should
be clear to market a range of more consumer-acceptable goat milk products in New
Zealand as a primary market. In short, this research has significant commercial
relevance.
CONFIDENTIAL
vi
Table of Contents
Title page i
Acknowledgements ii
Confidential Material iii
Abstract iv
Table of Contents vi
List of Tables xi
List of Figures xiii
Statement of Originality xiv
1 Introduction 1
1.1 Research aims 1
1.2 Background 1
1.3 Health related aspects of goat milk proteins 2
1.3.1 Caseins 2
1.3.2 β-Lactoglobulin 4
1.3.3 α-Lactalbumin 4
1.3.4 Taurine 4
1.4 Health related aspects of goat milk fats and vitamins 4
1.5 Health related aspects of other goat milk components 6
1.5.1 Lactose 6
1.5.2 Minerals 7
1.5.3 Vitamins, enzymes and other components 7
1.5.4 Summary of validity of health claims for goat milk 7
CONFIDENTIAL
vii
1.6 The characterising flavour of goat milk 8
1.6.1 Free fatty acids 8
1.6.2 Milk triacylglycerols and hydrolysis 9
1.6.3 Goat milk fatty acids profile 9
1.7 Cyclodextrins 13
1.8 How CDs may reduce goaty flavour 16
1.9 Skatole odour in NZ milk 17
1.10 Analytical methods to demonstrate inclusion of BCFAs or skatole with cyclodextrin 17
1.11 Conclusion 18
2 Materials and development of methods 20
2.1 Introduction 20
2.2 Materials and equipment 20
2.3 Ethics 21
2.4 Method development to spike fluids with fatty acids 21
2.5 Preliminary discrimination experiments and panellist repeatability 22
2.6 Odour generation in goat milk 23
2.7 Development of formal sensory methods 24
2.8 Data analysis 25
3 Effect of cyclodextrins on the odour intensity of 4-methyloctanoic acid in buffer and on the odour of goat milk 27
3.1 Introduction 27
3.2 Main aim of the experiments 27
3.3 The effect of different concentrations of β-CD on the odour intensity of buffer spiked with different concentrations of 4-MeO 28
3.3.1 Design and methods 28
3.3.2 Results 28
3.4 Preliminary trial to test the effect of β-CD on the odour intensity of goat milk 31
3.4.1 Materials and methods 31
3.4.2 Results 32
3.5 Definitive trial to test the effect of β-CD on the odour intensity of goat milk 32
3.5.1 Design and methods 32
3.5.2 Results 33
CONFIDENTIAL
viii
3.6 Effect of lipase treatment and β-CD on the odour intensity of goat milk 33
3.6.1 Design and methods 34
3.6.2 Results 34
3.7 Effect of different CDs on odour intensities in spiked buffer, lipased goat milk, and cow milk spiked with skatole. 35
3.7.1 Material and methods 36
3.7.2 Results 37
3.8 Further work to study the effect of CDs on odour intensity of lipased goat milk and on skatole odour in goat milk 38
3.8.1 Material and methods 39
3.8.2 Results 40
3.9 Further Experiments with β-CD and skatole in cow milk 41
3.9.1 Materials and methods 41
3.9.2 Results 42
3.10 Discussion 42
4 Effect of β-CD on odour and flavour of goat milk yoghurt 45
4.1 Aim of the experiments 45
4.2 Development of yoghurt 46
4.3 Preliminary trials 46
4.4 Effect of β-CD on odour intensity of goat and cow milk yoghurts 46
4.4.1 Design and methods 46
4.4.2 Results 47
4.5 Effect of time of addition of β-CD on flavour of goat milk yoghurt 47
4.5.1 Methods and design 48
4.5.2 Results 48
4.6 Discussion 49
5 Effect of β-CD on the partitioning of free fatty acids in milk 51
5.1 Introduction 51
5.2 Summary of gas chromatography work to detect free fatty acids in headspace Error! Bookmark not defined.
5.3 The effect of β-CD on partitioning of fatty acids in milk 51
5.3.1 Method development and preliminary trials 51

CONFIDENTIAL
ix
5.4 Preliminary experiment to study effect of β-CD on milk fat and skim milk 52
5.4.1 Materials and method 53
5.4.2 Results 53
5.5 Effect of β-CD on the acid value of anhydrous fat with increasing milk storage time 53
5.5.1 Materials and methods 54
5.5.2 Results 54
5.6 Effect of β-CD on the acid value of lipased milk fat 55
5.6.1 Material and methods 55
5.6.2 Results 56
5.7 Free fatty acid concentration in skim milk by the copper salt method 56
5.7.1 Results 57
5.8 Monitoring of lipase activity by the copper salt method 60
5.8.1 Methods and results 60
5.9 Discussion 62
6 Effect of β-CD on liking of goat milk yoghurt 65
6.1 Aim of the experiment 65
6.2 Development of yoghurts 65
6.3 Preliminary experiment 66
6.4 Effect of β-CD on flavour liking scores for plain and flavoured goat milk yoghurts 66
6.4.1 Design and methods 66
6.4.2 Results 67
6.5 Discussion 67
7 Conclusion 69
7.1 Summary of project results and gaps in knowledge 69
7.2 Future fundamental and commercial experiments 70
7.3 Consumer perceptions of cyclodextrins 71
7.4 Concluding remarks 71

CONFIDENTIAL
x
Appendix I - Ethics approval form 72
Appendix II - Typical questionnaire used in milk and buffer sensory experiments
73
Appendix III - Design of yoghurt flavour sensory 74
Appendix IV - Questionnaire for yoghurt flavour sensory experiment 76
Appendix V - Design of liking experiment (hedonic sensory) 77
References 78
CONFIDENTIAL
xi
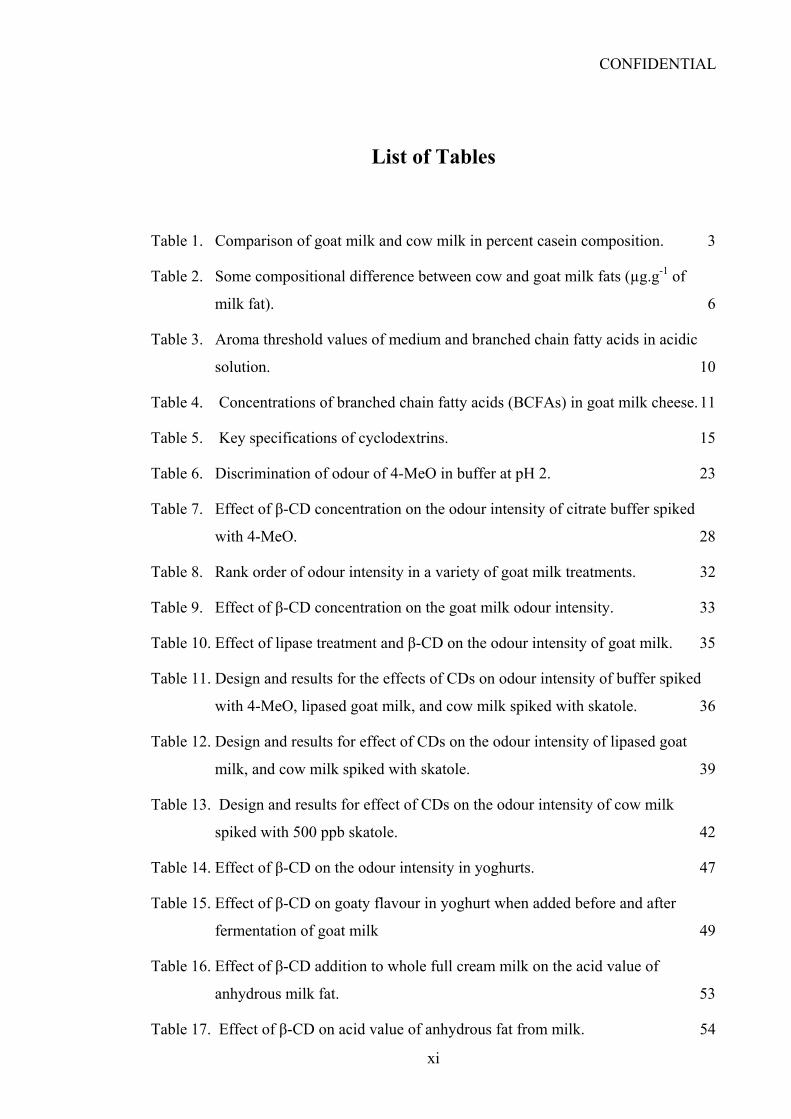
List of Tables
Table 1. Comparison of goat milk and cow milk in percent casein composition. 3
Table 2. Some compositional difference between cow and goat milk fats (µg.g-1 of
milk fat). 6
Table 3. Aroma threshold values of medium and branched chain fatty acids in acidic
solution. 10
Table 4. Concentrations of branched chain fatty acids (BCFAs) in goat milk cheese. 11
Table 5. Key specifications of cyclodextrins. 15
Table 6. Discrimination of odour of 4-MeO in buffer at pH 2. 23
Table 7. Effect of β-CD concentration on the odour intensity of citrate buffer spiked
with 4-MeO. 28
Table 8. Rank order of odour intensity in a variety of goat milk treatments. 32
Table 9. Effect of β-CD concentration on the goat milk odour intensity. 33
Table 10. Effect of lipase treatment and β-CD on the odour intensity of goat milk. 35
Table 11. Design and results for the effects of CDs on odour intensity of buffer spiked
with 4-MeO, lipased goat milk, and cow milk spiked with skatole. 36
Table 12. Design and results for effect of CDs on the odour intensity of lipased goat
milk, and cow milk spiked with skatole. 39
Table 13. Design and results for effect of CDs on the odour intensity of cow milk
spiked with 500 ppb skatole. 42
Table 14. Effect of β-CD on the odour intensity in yoghurts. 47
Table 15. Effect of β-CD on goaty flavour in yoghurt when added before and after
fermentation of goat milk 49
Table 16. Effect of β-CD addition to whole full cream milk on the acid value of
anhydrous milk fat. 53
Table 17. Effect of β-CD on acid value of anhydrous fat from milk. 54
CONFIDENTIAL
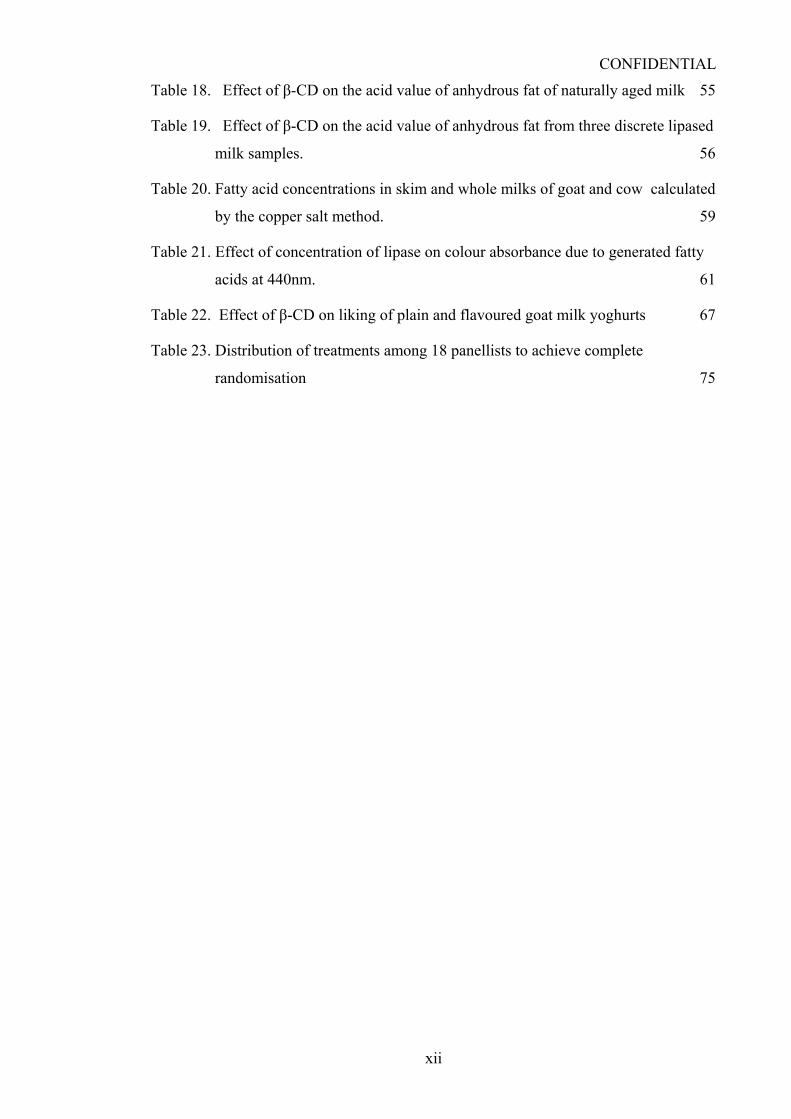
xii
Table 18. Effect of β-CD on the acid value of anhydrous fat of naturally aged milk 55
Table 19. Effect of β-CD on the acid value of anhydrous fat from three discrete lipased
milk samples. 56
Table 20. Fatty acid concentrations in skim and whole milks of goat and cow calculated
by the copper salt method. 59
Table 21. Effect of concentration of lipase on colour absorbance due to generated fatty
acids at 440nm. 61
Table 22. Effect of β-CD on liking of plain and flavoured goat milk yoghurts 67
Table 23. Distribution of treatments among 18 panellists to achieve complete
randomisation 75
CONFIDENTIAL
xiii
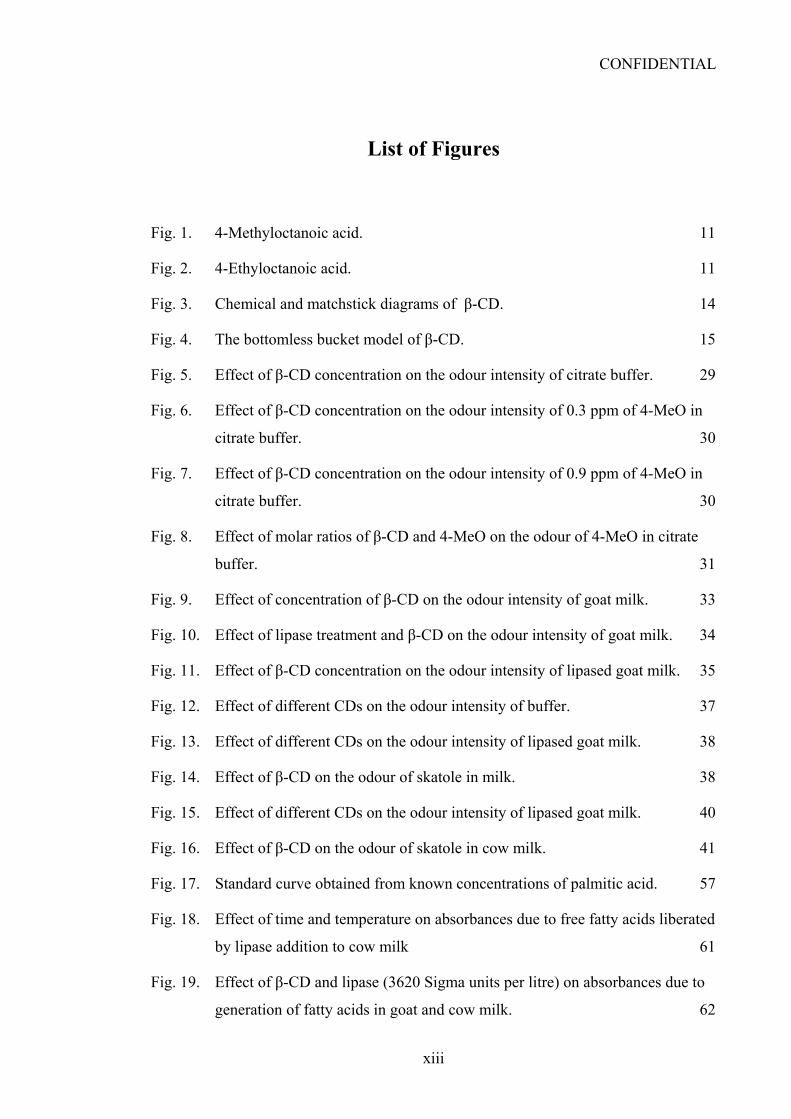
List of Figures
Fig. 1. 4-Methyloctanoic acid. 11
Fig. 2. 4-Ethyloctanoic acid. 11
Fig. 3. Chemical and matchstick diagrams of β-CD. 14
Fig. 4. The bottomless bucket model of β-CD. 15
Fig. 5. Effect of β-CD concentration on the odour intensity of citrate buffer. 29
Fig. 6. Effect of β-CD concentration on the odour intensity of 0.3 ppm of 4-MeO in
citrate buffer. 30
Fig. 7. Effect of β-CD concentration on the odour intensity of 0.9 ppm of 4-MeO in
citrate buffer. 30
Fig. 8. Effect of molar ratios of β-CD and 4-MeO on the odour of 4-MeO in citrate
buffer. 31
Fig. 9. Effect of concentration of β-CD on the odour intensity of goat milk. 33
Fig. 10. Effect of lipase treatment and β-CD on the odour intensity of goat milk. 34
Fig. 11. Effect of β-CD concentration on the odour intensity of lipased goat milk. 35
Fig. 12. Effect of different CDs on the odour intensity of buffer. 37
Fig. 13. Effect of different CDs on the odour intensity of lipased goat milk. 38
Fig. 14. Effect of β-CD on the odour of skatole in milk. 38
Fig. 15. Effect of different CDs on the odour intensity of lipased goat milk. 40
Fig. 16. Effect of β-CD on the odour of skatole in cow milk. 41
Fig. 17. Standard curve obtained from known concentrations of palmitic acid. 57
Fig. 18. Effect of time and temperature on absorbances due to free fatty acids liberated
by lipase addition to cow milk 61
Fig. 19. Effect of β-CD and lipase (3620 Sigma units per litre) on absorbances due to
generation of fatty acids in goat and cow milk. 62
CONFIDENTIAL
xiv
Statement of Originality
‘I hereby declare that this submission is my own work and that, to the best of my
knowledge and belief, it contains no material previously published or written by another
person nor material which to a substantial extent has been accepted for the qualification
of any other degree or diploma of a university or other institution of higher learning,
except where due acknowledgement is made in the acknowledgments.’
_______________(signed)
__________(date)

CONFIDENTIAL
1
1 Introduction
1.1 Research aims
Over the past few years goat milk has become more popular in affluent societies due to
some reduction in ‘goaty’ flavour and perceived health advantages [1, 2]. Though
efforts to reduce the goaty flavour to some extent, they are either costly (special feeds)
or time consuming (genetic selection). Addressing this goat flavour problem at a food
technology level with some robust solution is the main aim of this work. Another aim is
to review health claims for goat milk. If goat milk flavour can be reduced in a cost-
effective way and if health claims were proven, then the way should be clear to market
an essentially ‘functional’ food to a wide consumer base.
A typical definition of a functional food is: Functional foods are similar in appearance
to conventional foods and are intended to be consumed as part of a normal diet, but
have been modified to serve physiological roles beyond the provision of simple nutrient
requirements.
In the case of goat milk, it would not be necessarily modified, rather promoted on the
basis of its health advantages.
1.2 Background
The worldwide production of goat milk is about 12 million tonnes per year [3, 4].
Europe produces 17% of the world goat milk, and the number of goats in Europe and
hence goat milk production have been increasing for the last ten years [5]. In developing
countries, goat milk is used for direct consumption while in Europe as an example of
Western society, goat milk is used principally for cheese production. The flavour of
these cheeses is goaty, a sensory property that is sought after in gourmet and traditional
market segments [3, 6]. However, a goaty flavour is not sought in milk [6], and
probably not in cheeses destined for mainstream markets.
CONFIDENTIAL
2
New Zealand’s dairy industry is clearly dominated by cow milk. The popularity trend
for goat milk consumption could be true in N.Z. but no production data are available
from the Food and Agriculture Organisation of the United Nations. However, Dubef et
al. [4] has reported that in N.Z., 14 million litres are annually supplied to the New
Zealand Dairy Goat Co-operative, the largest in N. Z. Sales of goat milk and products
are limited to health food outlets and the specialty gourmet market.
There are perceived and possibly real health advantages with the consumption of goat
milk. Goat milk has provoked a newly developed interest in cases where allergies and
gastrointestinal disorders are common reactions to cow milk because goat milk is often
thought to be well tolerated [1, 7].
However, the scientific basis for the claimed health advantages is limited. Anecdotes
have prevailed more than facts. On the other hand, goat milk does have a biochemical
profile distinct from that of cow milk, so the potential for different human reaction
certainly exists. This potential may be used to exploit goat milk and products
consumption for commercial benefits.
1.3 Health related aspects of goat milk proteins
The five principle goat milk proteins are α-lactalbumin, β-lactoglobulin, κ-casein,
β-casein and α-S2 casein. However, Hanelein [1], citing the research by four others,
stated that each of these differ slightly between different goat populations, arising from
subtle differences in the amino acid sequence (primary structure). These in turn can be
responsible for differences in digestibility.
Because proteins are frequently implicated in allergic responses (e.g. coeliacs are
allergic to gluten in flour), milk proteins are similarly implicated as allergens, either for
promotional purposes of soy and goat milk over cow milk, or for good biomedical
reasons (O.A. Young, pers. comm.).
1.3.1 Caseins
Internet-based promotional sites claim that overall primary structure of goat milk
caseins is more similar to human milk than cow milk. These claims include shortness
of rennin clotting times, as they are for human milk, a higher curd pH and a weaker curd

CONFIDENTIAL
3
structure, than for cow milk. Possibly as a result of these factors, goat milk is more
easily digested by humans than cow milk [1, 8, 9].
Table 1. Comparison of goat milk and cow milk in percent casein composition.
α-S1 Casein
α-S2 Casein
β-Casein κ-Casein
Cow 38.5 9.8 38.5 13.3 Goat (1) 19.7 12.3 53.0 13.7 Goat (2) 0.1 16.7 59.3 17.5
Data source: Adapted from [10].
1.3.1.1 Caseins α-S1 and α-S2
α-S1 Casein in cow milk has received particular attention as a potential allergen.
From Table 1, and also in agreement to other researchers [11-13], it is clear that
goat milk contains only trace or lower amounts of α-S1, which may be helpful in
digestibility [14, 15].
In guinea pig experiments, goat milk containing only α-S1 casein caused an
allergic reaction in all test animals, but when that casein was substituted by α-S2
casein, an allergic reaction occurred only 40 % of animals [1]. This is indirect
evidence that goat milk with only traces of α-S1 casein is less allergenic than goat
milk with higher concentration [1].
Human milk contains no α-S2 casein [7], making α-S2 caseins in milks of other
species a possible cause of allergenicity. A rare mutation in some goats yields
milk with no α-S2 casein [7], but when the casein fraction was tested for
allergenicity, only a small decrease in allergenicity was detected.
Overall, the role of the α-S caseins in allergenicity is not clear.
1.3.1.2 β-Casein
β-Casein is quantitatively the major protein component of goat milk (Table 1). In
cow milk there are two variants, β-A1 casein and β-A2 casein, first discovered in
1955, as reported by Moioli [16]. Hanelein [1] reported that 40 % cent of milk in
Greece was goat or sheep milk, which contains no goat milk equivalent to cow
β-A1 casein. The milk from New Zealand cows is dominated by β-A1 casein [17,
18]. On the basis of a biochemical model and strong correlations between per
CONFIDENTIAL
4
capita consumption of β-A1 casein and cardiovascular disease and diabetes rates
[17], a New Zealand company (A2 Corporation Limited) has been formed to
market A2-only cow milk in New Zealand and now in the U.S.A. [17].
This has been predictably accompanied by extensive promotion. However,
Fonterra, the dominant dairy organisation in New Zealand perhaps predictably
refutes these disease-link claims to milk and milk products that contains A1 as
well as A2. No conclusion can be drawn at this time.
1.3.2 β-Lactoglobulin
Goat milk is similar to cow milk in its primary structure of a 162-amino acid
polypeptide chain, but it differs from cow β-lactoglobulin at six residues including both
the amino and carboxyl residues [12]. Because β-lactoglobulin is absent from human
milk [1], it has been assumed to be an offending allergenic protein in cow milk.
However, in people who are allergic to cow milk, but not to goat milk, β-lactoglobulin
is unlikely to be the offending protein unless the six amino acid differences between the
species are responsible (O.A. Young, pers. comm.).
1.3.3 α-Lactalbumin
The α-lactalbumin of cow milk elicits an allergic response from many people. These
people are often able to consume goat milk without suffering that reaction, an effect
attributed to differences in structure of that protein from the two species [1].
1.3.4 Taurine
Domagala [19] found that the concentration of the non-protein, sulphur-containing
amino acid taurine, is about 20 times higher in goat milk than in cow milk, and is almost
equal to the concentration in human milk. Therefore both goat milk and goat-milk
products can be an excellent source of this amino acid. However, no specific health
claims have been found for this amino acid.
1.4 Health related aspects of goat milk fats and vitamins
Milk fat globules in goat milk are smaller (typically ranging 0.73 to 8.6 μm) than in cow
milk (0.92 to 16 μm) and the average diameter of goat milk globules is 2.76 μm versus
3.51 μm for cow milk [20]. Stokes’ Law dictates that the tendency to cream is

CONFIDENTIAL
5
proportional to the square of the (globule) radius and on these grounds alone goat milk
fat globules are more likely to be dispersed. This makes goat milk easier to digest [21].
Goat milk is thus said to be ‘naturally homogenized’. This intrinsic homogenization of
goat milk is, from a human health standpoint, purportedly better than mechanically
homogenized cow milk, the dominant commercial form. According to a promotional
website [21], when the fat globules are broken by mechanical means, a particular milk
fat globule membrane enzyme, xanthine oxidase, is liberated and in this state is capable
of accelerating atherosclerosis. This claim is consistent with a study done on
hypercholesterolemic guinea pigs, where enhanced xanthine oxidase activity was
associated with coronary dysfunction [22].
According to Alfrez et al. [23], goat milk fats have a unique metabolic ability to limit
cholesterol deposits in arteries. This work with animals showing malabsorption
symptoms indicated that the consumption of goat milk reduced overall concentration of
blood cholesterol, while concentration of triglycerides and high density lipoproteins
remained within the normal ranges.
Capric, caprylic acids and caproic acid (as triglycerols) are present in higher
concentrations in goat milk than in cow (Table 2). Goat milk fatty acids have become
established medical treatments for an array of clinical disorders [1], including
malabsorption syndromes, chyluria, steatorrhea, hyperlipoproteinemia, intestinal
resection, premature infant feeding and non-thriftiness of children. The claimed
mechanism is their unique metabolic ability to provide direct energy instead of being
deposited in adipose tissues, and because of their actions of lowering serum cholesterol
concentration, and limiting cholesterol deposition.
The new concept of tailor making foods to better fit human needs – so-called functional
foods – has not yet been applied to goat milk and its products. The enrichment of short
and medium chain fatty acids in goat butter compared to cow butter could be exploited
as a functional food. Against this purported therapeutic value, it could be argued that
cow milk also contains appreciable concentrations of these fatty acids, only just at a
lower concentration (Table 2). (The lower three fatty acids in Table 2 are discussed
later.)

CONFIDENTIAL
6
Table 2. Some compositional difference between cow and goat milk fats (µg.g-1 of milk fat).
Goat milk Cow milk
C4 Butyric 30,000 33,000 C6 Caproic 20,000 16,000 C8 Caprylic 20,000 13,000 C10 Capric 61,000 30,000 4-Methyloctanoic 223 3 4-Ethyloctanoic 55 Not detected 4-Methylnonanoic 27 3
Data source: Adapted from [24]
Viewed this way, the difference between goat and cow milk is merely one of degree, a
quantitative rather than a qualitative difference.
1.5 Health related aspects of other goat milk components
1.5.1 Lactose
Lactose intolerance is the inability to digest the milk sugar lactose. This condition is due
to a genetic predisposition of some adults and maturing children to produce low levels
of the gut enzyme lactase, which hydrolyses lactose to galactose and glucose, both of
which can be absorbed from the human gut. The condition particularly occurs in some
Asian populations where milk was not an important nutrient source in the past few
millennia. For example, most adults in the Philippines are lactose intolerant which can
be traced to the historically low consumption of milk [25].
Goat milk has a lower concentration of lactose than cow milk (≈ 4.1% [26] , 4.4% [27]
against ≈ 4.8% in cow milk) and is purportedly better tolerated by lactase-deficient
persons as is reported by Carol in Ontario Goat Milk Production website literature [27,
28].
This promotional claim is highly questionable because differences around 10 % are not
large.

CONFIDENTIAL
7
1.5.2 Minerals
The mineral content of goat and cow milk is generally similar, but websites promoting
the dietary advantages of goat milk promote any higher concentration in goat milk as a
major advantage [28]. As always the data are confounded by various factors e.g. age,
diet and stage of lactation [27, 29].
1.5.3 Vitamins, enzymes and other components
Goat milk is claimed to have higher concentrations of vitamins A and B [28]. However,
the same quantitative versus qualitative argument (see previous section) can be applied
to other vitamins too. Moreover, these data may also be confounded by other factors.
Superiority claims can also be made for cow milk. According to analyses done in
Ontario [28], cow milk contains five times the concentration of vitamin B12 than goat
milk and 10 times the concentration of folic acid. Again, the factors responsible for
these claims are not stated.
1.5.4 Summary of validity of health claims for goat milk
Goat and cow milks do have a different chemical and physical profile, and the
differences have been used to enhance the popularity of goat milk and products. It has
proved difficult to differentiate fact from anecdote. Whatever the truth or otherwise of
these claims, the perception that goat milk is better for human nutrition than cow milk is
widespread in Western societies, New Zealand included [9].
Health value is one thing, but consumer acceptability is another. Goat milk has a
particular flavour profile that many find unattractive. This is the subject for next section.
CONFIDENTIAL
8
1.6 The characterising flavour of goat milk
It is important to define flavour, taste and odour. From a sensory perspective, flavour is
the total non-textural, non-visual and non-aural perception of food as it is eaten. It
comprises taste, which is governed by sensors on the tongue, and odour, which is
governed by sensors in the olfactory system on the upper surface of the nasal cavity
[30]. A major part of flavour is odour although we are generally not aware of this.
(Note that from a sensory perspective, the terms ‘odour’ and ‘aroma’ are identical. The
two terms derive from hedonic tests. Odour will be mostly used throughout this thesis).
Odour compounds are by definition volatile. Although we sense these odour
compounds by direct nasal sniffing before we eat, the major part of odour sensation
occurs by way of the retronasal passage at the back of our mouth. This passage is
crucially important in odour perception. This is shown by the apparent loss of flavour
when a heavy cold blocks the nasal passages. Thus odour from a food is a good guide
to flavour.
According to Namibian researchers, the main reason for not liking goat milk products is
the ‘goaty’ flavour/odour [31]. Another example for this is that goat milk is not well
accepted in the Philippines due to its unappealing goaty flavour/odour [25].
Though formal studies have not been done in New Zealand it seems likely that the same
reason would prevail in New Zealand. This would be compounded by low habituation,
because goat milk is not widely available. In general, flavour/odour is a major attribute
that influences the selection and consumption of beverages such as milk [32].
Goaty odour is not the same as the rancid milk defect and the oxidation odour that can
occur in any milk. It is a flavour characteristic of goats (and sheep). The particular
odour/flavour compounds comprise a particular class of fatty acids [6], the branched
chain fatty acids (BCFAs). As isolated molecular species, these particular (free) fatty
acids are volatile and are sensed as goaty odour during milk or cheese consumption.
BCFAs will be discussed in detail below.
1.6.1 Free fatty acids
Free fatty acids are organic compounds consisting of a hydrocarbon chain and a
terminal carboxyl group, with representative structure of ROOH where R can range
from one carbon (formic acid, HCOOH) to 30 carbon atoms or more. Fatty acids are
CONFIDENTIAL
9
weak acids. Depending on the chain length, they are classed as short chain (say up to
C6), medium chain (C7 to C12) and long chain (> C12) fatty acids. Long chain fatty
acids dominate fatty foods like seed oils, animal and dairy fats where they are esterified
as triacylglycerols. Any fat in this form cannot be sensed as an odour. To be sensed,
fatty acids have to be unesterified: a free fatty acid.
Nearly all fatty acids in milk fats are esterified as triacylglycerols, but a fraction exists
in the free form in which they are available for sensing. Fresh cow or goat milk
contains about 0.09 g.l-1 of the fatty acids in the free form, potentially available for
sensing.
1.6.2 Milk triacylglycerols and hydrolysis
When milk is stored, the triglycerols slowly hydrolyse to produce free fatty acids and
glycerol. This happens spontaneously but is also catalysed by lipases that occur
naturally in milk or are derived from contaminating microbes [24]. The higher the
concentration of free fatty acids, the greater the potential for these to have a flavour
impact through odour. This process is very important in the flavour perception of goat
milk and its products, because the BCFA class of fatty acids is liberated along with
other non-characterizing fatty acids.
In the case of goat cheese, hydrolysis of triacylglycerols liberates free fatty acids,
including BCFAs, in quantities that make goat cheese so distinctively flavoured [3].
Odour impact plays a major role here. All fatty acids in milk do not have the same
odour impact [33, 34]. Short and medium chain fatty acids have more impact on both a
molar and weight basis, and the characterising class in goat milk, the BCFAs, is
particularly odorous with low threshold values (the lower five fatty acids in Table 3).
1.6.3 Goat milk fatty acids profile
Consider fatty acids C4 to C10 (Table 2). The compositional differences between goat
and cow milk for the straight chain fatty acids are significant but are nowhere near as
marked as the differences between the BCFAs in goat and cow milk. Although the
BCFAs have a major flavour impact (Table 3), they are not usually shown in goat milk
fatty acid profiles because they are present in such low concentrations, typically 300
times lower than medium and straight chain fatty acids (Table 2).

CONFIDENTIAL
10
BCFAs are well exemplified by 4-methyloctanoic acid (4-MeO, Fig. 1) and
4-ethyloctanoic acid (Fig. 2).
Brennand et al. [35] reported that the straight chain fatty acids (C6 to C10) have a goaty
note (Table 3). This implies that when cow milk suffers hydrolytic rancidity it should
develop a goaty note. Whereas rancid cow milk has a distinctive odour/flavour
character, it is not generally described as goaty. The possibility remains that the fatty
acids used to determine thresholds (as reported by Brennand et al. [35]) were impure
(O.A. Young, pers. comm.). If they were derived from goat milk fat there is always the
possibility that they may be contaminated with traces of BCFAs (Table 2), which have a
much lower detection threshold.
Table 3. Aroma threshold values of medium and branched chain fatty acids in acidic solution.
Fatty acid Descriptor Threshold
value (μg.g-1)
pH
Hexanoic (caproic) Goat 6.7 3.2 Octanoic (caprylic) Pungent, goaty 2.2 3.2 Nonanoic Goat 2.4 2.0 Decanoic (capric) Goat 1.4 3.2 4-Methyloctanoic Goaty, muttony, waxy 0.02 2.0 4-Ethyloctanoic Goaty, very goaty 0.006 2.0 4-Methylnonanoic Muttony, soapy 0.65 2.0 4- Methylnonanoic Muttony, soapy 0.66 2.0 2-Ethyldecanoic Soapy, waxy 0.02 2.0
Data source: Adapted from [35] by their experimentation and by reporting earlier authors
Whatever the true odour of the straight chain fatty acids, the purity of the BCFAs used
by Brennand et al. [35] is the clearest explanation of the cause of goaty flavour. They
are present in goat milk, but hardly at all in cow. Another example of proving the
BCFAs as the real culprits for goaty odour is the work done by Ha & Lindsay [36]. In
that work, a comparison of the fatty acid profile of sheep, goat and cow milk cheeses
found that 4-MeO and 4-ethyloctanoic acids were relatively abundant in sheep and goat,
but not cow milk cheeses. Brennand et al. [35] showed that 4-ethyloctanoic was
extremely potent, with the lowest threshold (6 ppb) of all those tested (Table 3).
Brennand et al. [35] also reported that addition of 4-ethyl-2-octenoic acid to milk

CONFIDENTIAL
11
resulted in a goaty flavour, but they also reported that this compound has never been
verified as occurring in goat or other milk fats.
Fig. 1. 4-Methyloctanoic acid (4-MeO).
Fig. 2. 4-Ethyloctanoic acid.
The concentrations of these BCFAs in goat milk fats indicate the magnitude of the
reservoir that can be released by lipases in whole milk or especially in cheeses [24],
resulting in characteristic flavours that depend on concentration (Table 4) and their
threshold values [3, 24, 37].
Table 4. Concentrations of branched chain fatty acids (BCFAs) in goat milk cheese.
BCFA Range as detected from four different samples of cheeses in μg.g-1 of cheese
4-Methyloctanoic 0.02 – 0.26 4-Ethyloctanoic 0.01 – 0.05 4-Methylnonanoic 0.05 – 0.99 8- Methylnonanoic 0.00 – 0.41 2-Ethyldecanoic 0.00 – 0.07
Data source : Adapted from [35, 36]
In short, the popularity of goat milk is enhanced because of real or perceived health
advantages, but species characteristic flavour negates a market wider than the dedicated

CONFIDENTIAL
12
gourmet and health food market. Removal or reduction of BCFAs or their perception
could be the effective solution to this problem.
1.6.3.1 On-farm factors affecting goaty flavour
Goat breed is likely to have an influence on goat milk flavour due to BCFAs.
According to Skjevdal [6], milk from Sannen goats has a flavour closer to that of
cow milk. Native Norwegian goats have a flavour that is significantly higher.
Crosses of the two breeds have an intermediate flavour.
Genetic factors could affect both the concentration of BCFAs and their liberation
from the milk fat globule by way of lipoprotein lipase activity. This activity,
although lower in goat than in cow milk, is more bound to the fat globules in goat
milk and better correlated to spontaneous lipolysis [37]. Goat milk lipolysis
activity varies considerably across goat breeds [37]. The idea of breeding goats
low in BCFAs and/or lipoprotein lipase activity was discussed with AgResearch
Limited1 scientists (O.A. Young, pers. comm.). It was concluded that the time
frames (years) and costs (millions of dollars) would render the concept
impractical at this time. Besides, the heritability of the attributes is unknown.
There is anecdotal evidence are that when male goats (bucks) are within odour-
sensing distance of milking goats, the goat flavour in milk increases [21]. Bucks
emit a pungent odour from sebaceous glands on the head and neck. However,
Skjevdal [6] got a different opinion and reported that earlier work did not find any
significant influence. Moreover, it is already standard production practice to keep
bucks away from the milking herd, so no further reduction in goat flavour can be
anticipated.
Feeding unsaturated fatty acids tends to decrease goat milk flavour [37].
Similarly, when animals are underfed or receive a diet supplemented with
protected or unprotected vegetable oils, flavour is reduced [37]. However cost is
an issue, because supplementation is much more expensive than pure pasture
feeding. In another study with cow milk, Lacount et al. [38] reported a decrease in
medium chain fatty acid concentrations achieved by feeding high oleic oils.
Similar diet treatments with goats may result in reduced goaty flavour. Caponio
[39] showed that trans-esterification of goat milk with long chain fatty acids
1 AgResearch Limited, Ruakura, Hamilton, New Zealand

CONFIDENTIAL
13
resulted in a significant decrease in the total amount of short and medium chain
fatty acids, and a reduced flavour in goat milk cheese.
Goat milk flavour is reportedly stronger in mid-lactation [6, 37]. However, given
the scale of current goat milk production in New Zealand, it is not practicable to
produce particular products at only one time of the year.
In summary, there are on-farm interventions that could minimize goaty flavour in
goat milk, but they cost too much, are unproven or take too long to achieve results
if at all. Off-farm factors may offer the only realistic way of minimizing goat
flavour.
1.6.3.2 Off-farm factors affecting goaty flavour
Milk handling and pasteurization are believed to affect goaty flavour. The reason
could be that though the overall lipolytic activity is lower in goat milk than cow
milk, the smaller size and larger number of fat globules may make fat more prone
to hydrolysis [37]. Handling practises like avoiding unnecessary agitation,
maintaining low temperatures, and early pasteurization can reduce hydrolysis of
goat milk fat and so reduce goaty flavour.
Other strong flavours like vanilla, strawberry etc. can be used to mask goaty
flavour. The use of cyclodextrins may be another solution.
1.7 Cyclodextrins
A literature search by Mr M.J. Agnew and Dr O.A.Young suggested cyclodextrins as a
possible way of reducing the goaty flavour in milk and milk products. A single research
paper from Brazil by Meier et al. [32] showed that goat milk flavour was modified by
cyclodextrin addition. The paper implied that this occurred by the binding of free fatty
acids in a cyclodextrin complex.

CONFIDENTIAL
14
Fig. 3. Chemical and matchstick diagrams of β-CD.
Source: Belitz and Grosch [33]
Cyclodextrins (CDs, Fig. 3) are carbohydrates composed of α-1,4-linked glucopyranose
subunits (the formal name for glucose), where the glucopyranose molecules are
arranged in a ring much like bottomless bucket (Fig. 4). The outer side of this bucket
has a molecular structure that favours solubility in water (much like other simple
carbohydrates) while the inside – the core – repels water, favouring instead molecules
that are insoluble in water. These become trapped in the core in preference to being
dissolved or dispersed in water [40, 41]. Binding in the guest:host relationship is due to
atomic (Van der Waals), thermodynamic (hydrogen bonding), and solvent
(hydrophobic) forces in the hydrophobic environment of the CD cavity [42]. The
complex exists in an equilibrium depending upon the relative concentrations of the host
CD and the potential guest chemical. The rate at which the associated complex is
formed is determined by the accessibility of the guest molecule to the CD cavity and the
magnitude of the thermodynamic driving force. Water molecules that are initially
associated with the hydrophobic CD cavity return to the larger pool as they are
displaced, while the hydrophobic guest molecule is removed from the aqueous
environment. Thus binding is energetically favourable [42, 43].
CDs as bought are stable, white, crystalline powders. They form inclusion complexes
with a variety of molecules including flavours and colours. The criteria for a successful
guest:host relationship are size and hydrophobicity .

CONFIDENTIAL
15
Table 5. Key specifications of cyclodextrins.
Cyclodextrin α-CD β-CD γ-CD
Number of glucose molecules 6 7 8
Cavity dimensions Height (nm) 0.79 0.79 0.79 Diameter (nm) 0.47 – 0.53 0.60 – 0.65 0.75 – 0.83Volume (nm3) 0.17 0.26 0.43
Molecular weight (g.mole-1) 973 1135 1297 Water solubility at 25°C(g.100 ml-1) 14.5 1.8 23.2
Data source: Adapted from [42]
The bottomless bucket model of β-CD is shown below (Fig. 4).
Fig. 4. The bottomless bucket model of β-CD.
Source : Scanned from [33] and edited.
The complex forming abilities of cyclodextrins have long been known but cyclodextrins
were available only as chemicals in small amounts at prices that impeded their
application. Developments in past decade in industrial production of β-CD have
lowered the price. As a result, application of β-CD is now possible in the
pharmaceutical, food and chemical industries [44]. A search of the Internet has shown
that β-CD is available at around US$5-6 a kg. Though CDs are much more expensive
than starch or glucose, if they are used in low concentrations in higher value foods like
yoghurt, they may be cost effective.
Cyclodextrins have found numerous applications in food industry [40, 42-45]. CDs are
used for the removal and masking of undesirable components and control release of
desired food constituents and flavours. They are also used as an alternative conventional
0.65nm
CONFIDENTIAL
16
encapsulation technology for flavour protection protecting the flavour throughout many
rigorous food-processing methods of freezing, thawing and microwave cooking [45].
Other applications arise from their ability to reduce bitterness, bad odours and tastes,
and to stabilise flavours when subjected to long-term storage [42].
When ingested, CDs are completely metabolized by the colon microflora, and have had
Generally Recognized As Safe (GRAS) status in some countries since 1998 [45]. Some
earlier work spread a notion of toxicity of β-CD [46] but now that has been disproved.
Where local regulations allow, the international food industry is now accepting the
World Health Organization (WHO) standard for consumption of β-CD which was set as
6 mg/kg /day of body weight in the 1980s.
In Japan, cyclodextrins have been approved as ‘modified starch’ for food applications
for more than two decades, serving to mask odours in food [42, 43]. The draft for γ-CD
approval is already in progress in Australia and New Zealand, but GRAS status by Food
Standards Australia New Zealand has not been approved on the basis of insufficient
supporting evidence. However, its approval by WHO and its GRAS status in the U.S.A.
suggests it is only a matter of time before all CDs are approved for food use in Australia
and New Zealand.
1.8 How CDs may reduce goaty flavour
In CDs, all hydroxyl groups are oriented to the outside of the ring while the glucosidic
oxygen and two rings of the covalently bound hydrogen atoms are directed towards the
interior of the cavity [42]. This combination gives CDs a hydrophobic inner cavity and a
hydrophilic exterior that can accommodate the hydrophobic chain of fatty acids. The
maximum diameter of an alkyl chain of an unbranched fatty acid was calculated (O.A.
Young, pers. comm.) to be 0.405 nm, which would fit comfortably in the cavity of α-, β-
or γ-CD (Table 5).
As fatty acids are liberated from the milk fat globule, they might be ‘mopped up’ by
CDs that bind fatty acids of this size and render them unavailable for sensing. That is
the theory. However, in the case of milk, which is a complex matrix, binding will
depend on a number of factors beyond simple thermodynamics. According to
O.A.Young, the free fatty acids must reach the CD molecules from the site of their
formation, which is probably the outer membrane of the fat globule. Second, since the
CONFIDENTIAL
17
pH of goat milk is around (6.6-6.8), the fatty acids of interest will be largely present in
solution as anions (the pKa of C8 and C9 fatty acids is around 4.8 [47]), which by
definition have substantial hydrophilic character. Third, BCFAs will not be only small
hydrophobic molecules able to form a guest:host complex. Longer chain fatty acids and
others may also be bound by CDs and since their abundance is much greater (Table 2)
they may successfully compete with the more scarce BCFAs for CD binding. Another
compound of interest in this respect is skatole.
1.9 Skatole odour in New Zealand milk
Goaty flavour as perceived probably includes that of skatole. Pasture is an inexpensive
ruminant feed and much effort has gone into maximising ruminant production from it in
New Zealand. However, the high protein to carbohydrate ratio in pasture compared
with grain diets results in the formation of an extremely odorous compound in the
ruminant gut [48], which to a minor extent is absorbed through the intestinal tract.
Although this toxic product is metabolised in the liver before kidney excretion, some
inevitably partitions into fat, where the consumer can detect it. Some international
markets that are more accustomed to meat and dairy items from grain-finished animals
tend to reject this flavour.
Although skatole has not been measured in goat milk, it certainly occurs in cow milk.
Data on its presence in New Zealand cow milk are confidential to Fonterra (O. A.
Young, pers. comm.). Skatole is certainly present in fat from sheep raised on New
Zealand pasture [49]. As a ruminant, goat products in New Zealand will almost
certainly contain skatole in consumer-detectable concentrations.
Whereas skatole is generally hydrophobic and could fit in a CD cavity, the same issues
of competition for binding and transfer of the molecule from one phase (milk fat) to the
other (CD) apply here too.
1.10 Analytical methods to demonstrate inclusion of BCFAs or skatole with cyclodextrin
CDs have some commercial applications in milk fat for removal of cholesterol and free
fatty acids, mainly to improve frying properties of fat [42], but there are no commercial
applications of cyclodextrins in raw milk and there is only one known reference to goat
CONFIDENTIAL
18
milk [32]. In that work, a triangle test was used to detect CD-treated goat milk samples.
Though the untrained panellists could detect the treated samples at statistically
significant levels, there were no data on the effect of intensity of flavour. By nuclear
magnetic resonance, Meier et al. [32] also demonstrated that medium chain fatty acids
formed inclusion complexes of β-CD. BCFAs were not tested, but the implication from
the limited sensory trials is that they too would be complexed. The inclusion complexes
of medium chain fatty acids and β-CD could have been explained by the use of
ultraviolet, infrared, X-ray spectroscopy chromatography [32] or by measuring the
decrease in oil/water interfacial tension according to the Gibb’s equation as was done in
[40], but in a complex medium like milk, any of these tests would be difficult to apply.
The approach taken here was different. An attempt was made to measure BCFAs as
volatiles in the headspace above fluids treated with CD, as is sometimes done with
cheeses and butter, and which can be done cheaply using SPME2 probes [41]. In the
event this approach was unsuccessful because of unforeseen problems.
An alternative successful approach was to partition milk, with and without CDs, into
two phases, fat and skim, and to measure the free fatty acids in each.
1.11 Conclusion
The commercial value of goat milk can be enhanced, especially for higher value milk
products, if its goaty flavour can be eliminated or reduced to an unobjectionable level.
In the case of goat milk and goat milk products, the characterizing odorous compounds
are the branched chain fatty acids, with about eight, nine and 10 carbon atoms. The
odour threshold of these BCFAs is very low, so people can often detect a goaty odour in
goat milk. It becomes much more obvious in goat cheese, where they become liberated
by hydrolysis from the fats they ‘belong’ to, and create the characteristic goaty note of
goat fetta, for example. Yoghurts made from goat milk may be similarly affected.
Mr Berri Schroder of Thought Group Limited believes that if the odour/flavour problem
of goat milk can be overcome or minimized, there is potential to create a range of goat
milk products – to be sold on health basis – with wider consumer appeal than is current.
Cyclodextrins (CDs) were suggested as a means of reducing goaty flavour, presumably
by ‘mopping up’ BCFAs. CDs are likely to have the ability to bind small molecules
2 Solid Phase Micro Extraction
CONFIDENTIAL
19
like BCFAs in inclusion complexes, which theoretically should render the BCFAs
incapable of sensory detection. β-CD being the cheapest among the three common CDs
could be the cost effective solution. The only prior study [32] with β-CD and goat milk
showed that β-CD altered the flavour quality of goat milk flavour (in what way was not
stated) but did not alter the basic composition of milk in respect to fat, total solids,
proteins, density etc. That study emphasized the inclusion process over the perception
of goat milk flavour.
In the present research the emphasis is on flavour. The research involves smelling and
tasting of milk/milk yoghurts (Chapter 3 and Chapter 4). Inclusion complexes of CD
and fatty acids in milk are demonstrated by partitioning experiments (Chapter 5).
Chapter 6 reports a hedonic sensory trial, while Chapter 7 summarizes the research and
future opportunities.
The following Chapter 2 details the material, equipment and development of methods
used for this study.
CONFIDENTIAL
20
2 Materials and development of methods
2.1 Introduction
The concept that goat milk flavour could be altered by cyclodextrins (CDs) binding
species-characterizing free fatty acids (BCFAs) was supported by one prior publication
[32]. In that work, panellists were asked to discriminate the odd-sample out in a
conventional triangle test but it was not reported whether β-CD increased or decreased
flavour intensity. The former possibility seems unlikely but could not be ruled out in
respect of the current project. Therefore the guiding principle in assessment here was
intensity of odour and flavour. It was required to develop experimental methods where
intensity could be assessed in statistically valid ways. This required series of trial-and-
error experiments reported here.
Finally, the major statistical methods used are also discussed.
2.2 Materials and equipment
The main materials used in this study were cow milk, goat milk and cyclodextrins. So-
called ‘Bluetop’ pasteurized, homogenized cow milk (3.3 % fat) (Anchor, New Zealand
Dairy Foods) was obtained as required from supermarkets. Pasteurized,
unhomogenized full cream cow milk (average fat 4.2 %) (Meadowfresh, Tararua) was
similarly bought as required. Mr Clyde Langford who is linked to Delago Limited, a
fetta maker, donated limited volumes of unpasteurized goat milk. When received, it was
immediately heated to 72°C and frozen in aliquots to be thawed as required. Spray-
dried whole goat milk powder (Healtheries, New Zealand) and UHT whole goat milk
(Nanny Goat Lane) was obtained from a supermarket. The unflavoured cow milk
yoghurt used as a starter culture for yoghurts was the supermarket item De winkel and
Cyclops.
CONFIDENTIAL
21
Cyclodextrins (α-, β- and γ-) were purchased from Cyclodextrin Technologies
Development Inc., High Springs, Florida. The prices per gram excluding delivery were
US$ 0.75, 0.10 and 1.5 respectively.
Most of branched chain fatty acids (BCFAs) used were either a gift from AgResearch
Limited, Hamilton, or purchased from Sigma Chemical Co. (Sydney). Lipase (Sigma
L-1754) was from Candida rugosa (724 Sigma units.mg-1)
Skatole (4-methylindole) was a gift from AgResearch. Other chemicals and reagents
were sourced from the general laboratory inventories, Auckland University of
Technology (AUT).
Centrifuges used were a Sorvall RC5B (refrigerated) for preparative scale work, and a
benchtop clinical centrifuge for analytical scale work. The spectrophotometer was an
Ultrospec 2100 Pro (Biochrom, U.K.).
All experiments were conducted at AUT, Wellesley Campus.
2.3 Ethics
Ethics approval to work with human subjects was sought and obtained (Appendix I).
2.4 Method development to spike fluids with fatty acids
The main aim was to test the effect of cyclodextrins on goat milk flavour. However,
sourcing goat milk was surprisingly difficult, so research was started with Bluetop cow
milk, which was ‘spiked’ with the fatty acids, including BCFAs, that would
approximate the free fatty acids concentration in goat milk after several days of chill
storage [24]. This assumed that fatty acids would be released in proportion to their
abundance in triacylglycerols.
The fatty acids were dissolved in ethanol and small aliquots then added with shaking to
Bluetop milk. When informal testing showed that this approach did little to change
odour, concentrations were increased up to three fold and in different ratios. Nothing
worked and problems arose from ethanol addition. It was then noticed that the fatty
acids tended to float on the milk surface in globules instead of mixing with milk
homogeneously.
Saponification was attempted by adding sodium hydroxide solution to fatty acids
dissolved in ethanol, followed by ethanol evaporation. The soaps were then added to
CONFIDENTIAL
22
the milk. This approach was also unsuccessful and it was not clear as what was
happening to the soaps in the milk matrix, although there was an indication that the
soaps adhered to the glass container.
To simplify the problem, research was diverted to a simpler aqueous of acidic buffers
instead of milk. Generally, efforts to disperse soaps in buffers at pH 3.6, 4.4, 5.0 and 6.6
to produce an odour effect were fruitless.
Dispersion of fatty acids in sodium bicarbonate was much more successful. 4-
Methyloctanoic acid (4-MeO) was dispersed in 1M-NaHCO3, and then sonicated for 15
minutes in citric/citrate buffer at pH 2.6, a method used by Brennand et al. [35]. The
odour due to fatty acids was obvious.
2.5 Preliminary discrimination experiments and panellist repeatability
Brennand et al. [35] found the threshold of 4-MeO in buffer at pH 2.0 was 0.02 ppm.
For the first discrimination experiment, a rapid method named E 679-91 (ASTM 1991a,
1991b) was followed [30]. This test is performed in ascending series and with forced
choice. A geometric concentration range of 0.05, 0.12, 0.30, 0.73, 1.8 and 4.4 ppm was
prepared in buffer by the NaHCO3 method. In the first of six bays, six panellists were
asked to segregate the three glasses with odour from three glasses without. In Bay 2,
the segregation task was supposedly easier, 0.12 ppm compared with buffer alone. And
so on for the remaining four bays. Each bay was supervised such that panellists were
asked to stop at the concentration level where they matched all three treatments
correctly. No formal statistical analysis was done with these data. Only one panellist
could discriminate the odour at 0.05 ppm, but all were successful by Bay 5, 1.8 ppm.
In a similar experiment, four treatments of 0.12, 0.30, 0.73 and 1.8 ppm were prepared
and presented in six wine glasses (three buffer, three treatment) in four bays with
ascending concentration. Thirty six panellists were asked, as in the previous
experiment, to segregate the treatments in all four bays. The success rate was high for
each concentration as shown in Table 6.

CONFIDENTIAL
23
Table 6. Discrimination of odour of 4-MeO in buffer at pH 2.
4-MeO concentration (ppm) 0.12 0.3 0.73 1.8
P = 0.05 for each bay
Percent correct segregation into two groups of three glasses
42 72 69 57
Inspection of individual responses in these two discrimination experiments strongly
suggested that some panellists were better at discrimination than others. The
experiment reported in Table 6 was partially repeated with 13 panellists invited to
participate on the basis of Table 6 results. At 0.3 and 0.73 ppm, the success rate
changed from 72 to 90 % and from 69 to 85 %, respectively.
About this time in the research, it was realised that while pH 2.0 is a useful pH to ensure
protonation and therefore volatility of the fatty acids, there was the chance that
cyclodextrins would slowly hydrolyse, and thus be unavailable for binding BCFAs and
other small hydrophobic compounds. So finally a system using citric/citrate buffer at
pH 4.8 was devised, where about half of the BCFAs would be protonated [47]. This pH
also approximates that of yoghurt, a food to be examined in this project.
2.6 Odour generation in goat milk
To experience a typical odour in the goat milk as supplied was difficult. Several factors
(discussed in Chapter 1; breed, hygiene, milking technique) can affect this,
pasteurization included. The hygiene reasons, the goat milk used was pasteurized as
soon as received. Pasteurization denatures the enzyme lipoprotein lipase, which would
otherwise slowly hydrolyse milk fat. However, by stirring goat milk at room
temperature and above, it was hoped to develop the goaty odour. This approach did not
work well, because fermentation occurred more quickly than lipolysis. In all this work
treatments with added β-CD were conducted in parallel to see if differences developed.
None did. Moreover, a clear goaty odour could not be detected in goat milk powder nor
in UHT goat milk.
More positive results were obtained when frozen, pasteurized goat milk was thawed.
This is likely to be due to damage of fat globule membrane, rendering the fat more
prone to lipolysis. The low temperatures involved would also minimize the potential
for fermentation.
CONFIDENTIAL
24
However, trials were also conducted to develop a quick method to generate free fatty
acids in milk – cow or goat – as needed.
Success was achieved when a fungal lipase was added to milk. Trials were done with
Bluetop cow milk and goat milk with different concentrations for different incubation
time. This enhanced the odour in milk as measured by sensory experiment (Chapter 3)
and increased the free fatty acid concentrations as measured by a chemical test
(Chapter 5), the so-called copper salt method.
2.7 Development of formal sensory methods
The effect of β-CD on goaty odour was measured by sensory experiments done in
buffer and goat milk (Chapter 3) and yoghurts (Chapter 4).
The choice of sensory method presented some challenges. Many procedures for testing
intensity of odour/flavour – scaling, category scaling, line scaling, magnitude
estimation, triangle or ranking etc. [30] – could have been used. Most of these tests
require trained panellists. No such panel was available, at least in the early stages of
this project. The triangle test, another common alternative procedure with many
untrained panellists has the drawback that testing more than two treatments is complex.
Moreover, a pure triangle test does not rank intensity because it is fundamentally a
qualitative test. It was therefore decided to use ranking. Ranking tests are rapid and
demand less training than other tests [30]. In this procedure, large numbers of untrained
panellists were usually asked to rank the odour – whatever they perceived it to be – in
intensity. With the exception of one test where only 37 panellists took part, more than
50 panellists were used in each definitive sniffing experiment, and the final tasting trial.
For two reasons, all the buffer and milk sensory experiments involved sniffing only.
First, only a few panellists were likely to be willing to drink buffer or milk, especially
goat milk. Second, aroma evaluation (by sniffing) is probably effective as flavour
evaluation, as reported by Brennand et al. [35].
The panellists were mostly students and staff on the Wellesley campus of mixed ages
and both genders. A summary of conditions that were generally constant in all sensory
experiments follows.
Most of the sensory trials were multiple designs of two or three experiments, each in a
separate bay, which was a designated laboratory bench area. Within a bay, the
CONFIDENTIAL
25
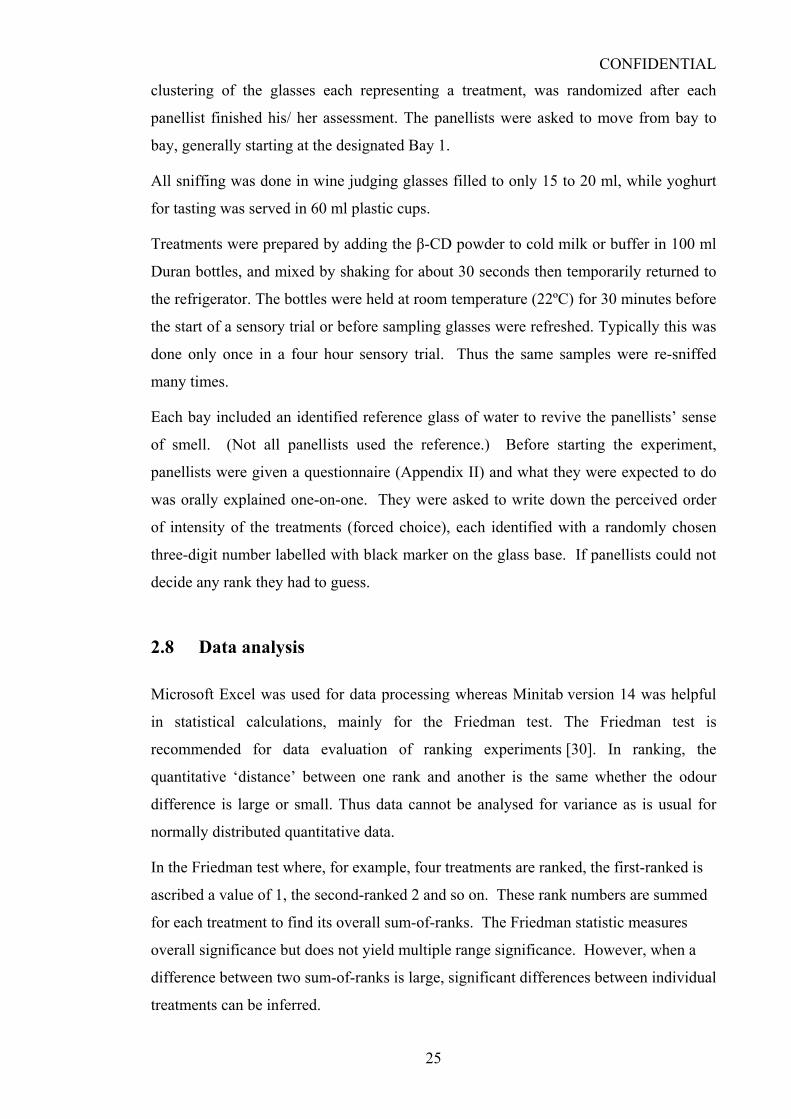
clustering of the glasses each representing a treatment, was randomized after each
panellist finished his/ her assessment. The panellists were asked to move from bay to
bay, generally starting at the designated Bay 1.
All sniffing was done in wine judging glasses filled to only 15 to 20 ml, while yoghurt
for tasting was served in 60 ml plastic cups.
Treatments were prepared by adding the β-CD powder to cold milk or buffer in 100 ml
Duran bottles, and mixed by shaking for about 30 seconds then temporarily returned to
the refrigerator. The bottles were held at room temperature (22ºC) for 30 minutes before
the start of a sensory trial or before sampling glasses were refreshed. Typically this was
done only once in a four hour sensory trial. Thus the same samples were re-sniffed
many times.
Each bay included an identified reference glass of water to revive the panellists’ sense
of smell. (Not all panellists used the reference.) Before starting the experiment,
panellists were given a questionnaire (Appendix II) and what they were expected to do
was orally explained one-on-one. They were asked to write down the perceived order
of intensity of the treatments (forced choice), each identified with a randomly chosen
three-digit number labelled with black marker on the glass base. If panellists could not
decide any rank they had to guess.
2.8 Data analysis
Microsoft Excel was used for data processing whereas Minitab version 14 was helpful
in statistical calculations, mainly for the Friedman test. The Friedman test is
recommended for data evaluation of ranking experiments [30]. In ranking, the
quantitative ‘distance’ between one rank and another is the same whether the odour
difference is large or small. Thus data cannot be analysed for variance as is usual for
normally distributed quantitative data.
In the Friedman test where, for example, four treatments are ranked, the first-ranked is
ascribed a value of 1, the second-ranked 2 and so on. These rank numbers are summed
for each treatment to find its overall sum-of-ranks. The Friedman statistic measures
overall significance but does not yield multiple range significance. However, when a
difference between two sum-of-ranks is large, significant differences between individual
treatments can be inferred.

CONFIDENTIAL
26
In many instances, panellist responses are shown also as bar graphs. In a typical bar
graph the responses for each treatment are distributed as percentages among the four
categories: least intense, less intense, more intense and most intense. In this way finer
detail can be resolved than in the Friedman test.

CONFIDENTIAL
27
3 Effect of cyclodextrins on the odour intensity of 4-methyloctanoic acid in buffer and on the odour of goat milk
3.1 Introduction
After establishing the ability of panellists to discriminate the odour of 4-methyloctanoic
acid (4-MeO) in buffer, the time had come to study the effect of cyclodextrins (CDs) on
this odour and on the odour of goat milk.
This chapter deals with sensory experiments to study the effect of CDs on the odour of
buffer spiked with 4-MeO, on the odour of goat milk, and on the odour of goat milk
containing added lipase intended to liberate odorous free fatty acids.
The general conditions of the experiments were same as for the discriminatory
experiments. However, for work with buffer, a citrate buffer at pH 4.8 was used instead
of one at pH 2. There were several reasons for making this change. First, the potential
for CDs to hydrolyse under strongly acidic conditions was avoided [50]. Second, at pH
4.8 about 50% of the branched chain fatty acids (BCFAs) would still be protonated (as
discussed earlier [47]) and therefore volatile and able to be sensed by odour. Third, this
pH approximated that of fermented milk products, a likely vehicle for CD inclusion
should CDs be effective.
3.2 Main aim of the experiments
The main aim of these experiments was to study effect of β-CD on odour of goat milk.
This CD was chosen on the basis of its relatively low price [35, 44] and the positive
experience of researchers working with other foods [32, 45, 51]. Another aim was to
find which type of CD (α, β, or γ) was the most effective in reducing odour of BCFAs
and goat milk. To achieve these aims, experiments were done with buffer spiked with
CONFIDENTIAL
28
4-MeO, goat milk, and goat milk previously treated with a lipase. The effect of β-CD
on skatole odour was also tested.
3.3 The effect of different concentrations of β-CD on the odour intensity of buffer spiked with different concentrations of 4-MeO
3.3.1 Design and methods
As discussed in Chapter 2, 4-MeO dispersed in NaHCO3 solution was added to citrate
buffer of pH 4.8. The final 4-MeO concentrations achieved were 0, 0.3 and 0.9 ppm.
Each treatment was then sonicated for 15 minutes. β-CD was added (0, 0.18, 0.25 and
0.32 % [w/v]) to give a total of 12 (3 x 4) treatments. These were ranked for odour
intensity by panellists, each sniffing in three bays. A different concentration of 4-MeO
was progressively sniffed in each bay (Table 7). Thus, each bay had four glasses plus a
designated reference of buffer.
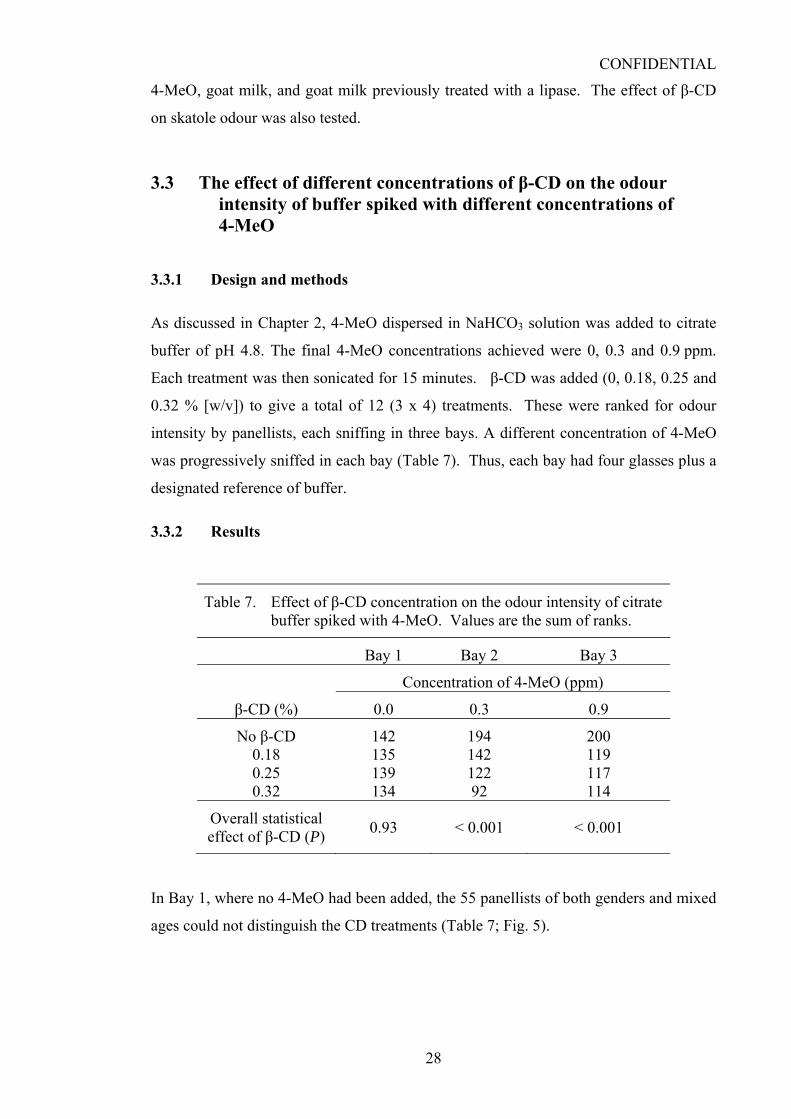
3.3.2 Results
Table 7. Effect of β-CD concentration on the odour intensity of citrate buffer spiked with 4-MeO. Values are the sum of ranks.
Bay 1 Bay 2 Bay 3 Concentration of 4-MeO (ppm)
β-CD (%) 0.0 0.3 0.9
No β-CD 142 194 200 0.18 135 142 119 0.25 139 122 117 0.32 134 92 114
Overall statistical effect of β-CD (P) 0.93 < 0.001 < 0.001
In Bay 1, where no 4-MeO had been added, the 55 panellists of both genders and mixed
ages could not distinguish the CD treatments (Table 7; Fig. 5).

CONFIDENTIAL
29
0.0% 20.0% 40.0% 60.0% 80.0% 100.0%
Least Intense
Less Intense
More Intense
Most Intense
Inte
nsity
of o
dour
Fraction judgment
0.32% β-CD0.25% β CD0.18% β-CDNo β-CD
0.32% β-CD
No β-CD
Fig. 5. Effect of β-CD concentration on the odour intensity of citrate buffer.
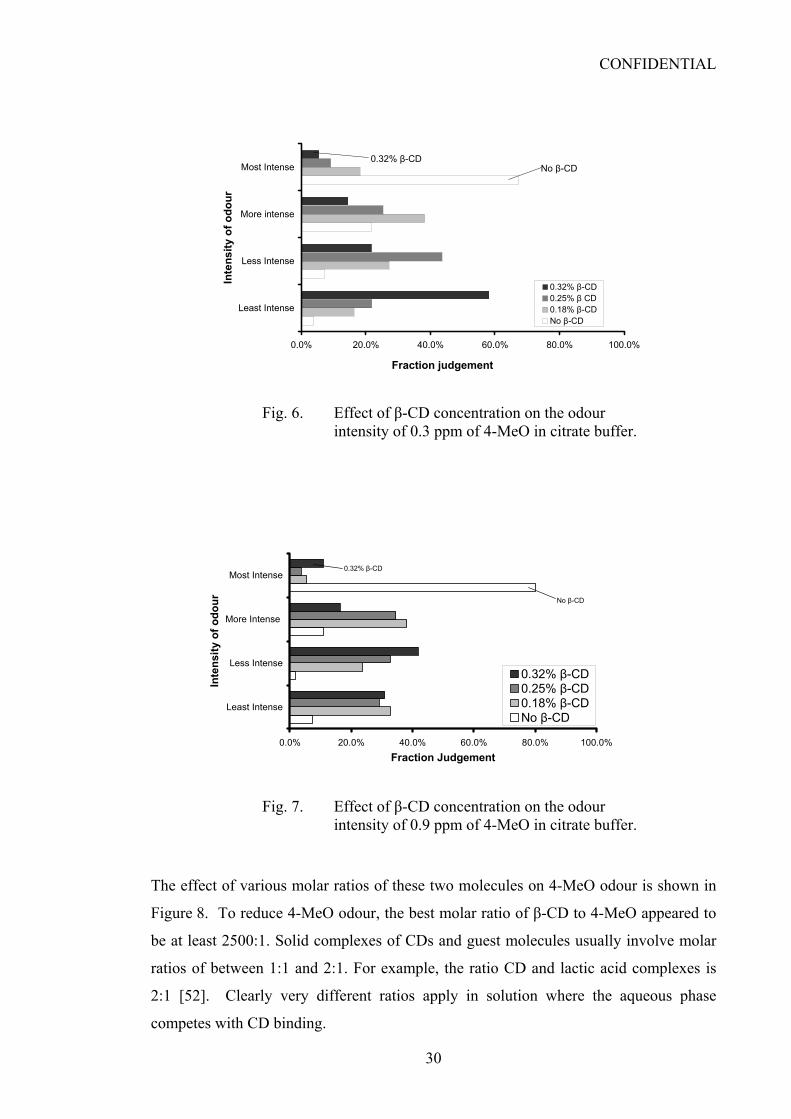
In Bays 2 and 3, where all glasses except the reference contained 4-MeO, the same
panellists picked the differences easily (Table 7; Fig. 6; Fig. 7), and the rank orders
were highly significant. The data suggest that the highest concentration of β-CD
performed the best. However, even the lowest concentration (0.18 %) appeared to be
effective at the highest concentration of 4-MeO (Bay 3) where the sum of ranks was
119. In Bay 3, the panellists failed to rank the treatments as they did in Bay 2. Whereas
this may have been caused by panellist fatigue, an alternative explanation appears more
likely: at the highest concentration of 4-MeO, the odour of the No β-CD treatment may
have made all other treatments appear very weak by comparison.
CONFIDENTIAL
30
0.0% 20.0% 40.0% 60.0% 80.0% 100.0%
Least Intense
Less Intense
More intense
Most Intense
Inte
nsity
of o
dour
Fraction judgement
0.32% β-CD0.25% β CD0.18% β-CDNo β-CD
0.32% β-CDNo β-CD
Fig. 6. Effect of β-CD concentration on the odour intensity of 0.3 ppm of 4-MeO in citrate buffer.
0.0% 20.0% 40.0% 60.0% 80.0% 100.0%
Least Intense
Less Intense
More Intense
Most Intense
Inte
nsity
of o
dour
Fraction Judgement
0.32% β-CD0.25% β-CD0.18% β-CDNo β-CD
No β-CD
0.32% β-CD
Fig. 7. Effect of β-CD concentration on the odour intensity of 0.9 ppm of 4-MeO in citrate buffer.
The effect of various molar ratios of these two molecules on 4-MeO odour is shown in
Figure 8. To reduce 4-MeO odour, the best molar ratio of β-CD to 4-MeO appeared to
be at least 2500:1. Solid complexes of CDs and guest molecules usually involve molar
ratios of between 1:1 and 2:1. For example, the ratio CD and lactic acid complexes is
2:1 [52]. Clearly very different ratios apply in solution where the aqueous phase
competes with CD binding.

CONFIDENTIAL
31
0.0
0.1
0.2
0.3
0.4
0.5
0.6
0.7
0.8
0.9
1.0
0 1000 2000 3000Molar ratio β-CD/FFA
Frac
tion
Judg
emen
ts
Judged on lowestintensity scale
Judged onhighest intensityscale
Fig. 8. Effect of molar ratios of β-CD and 4-MeO on the odour of 4-MeO in citrate buffer.
3.4 Preliminary trial to test the effect of β-CD on the odour intensity of goat milk
3.4.1 Materials and methods
Unpasteurized goat milk was heat treated and frozen as described in Chapter 2. A
volume was thawed after 11 days of frozen storage and treated with β-CD and 4-MeO
as shown in Table 8. Goat milk that had never been frozen was also tested. After one
day, 0.35 % β-CD was added to this milk, which was stored chilled for a further 10
days. Ten panellists, all of whom were skilled at detecting BCFA odour in citrate buffer
experiments, were asked to rank four blind treatments for odour intensity.

CONFIDENTIAL
32
Table 8. Rank order of odour intensity in a variety of goat milk treatments. There were 10 panellists.
Treatment Sum of ranks Storage β-CD added
(0.35 %) 4-MeO added
(0.3 ppm)
Frozen Yes Yes 29 Frozen No Yes 33 Frozen No No 26 Chilled Yes No 12
3.4.2 Results
The low sum of ranks (12) from CD-treated chilled milk with compared with frozen
containing no CD (26) suggests an odour reduction by β-CD (Table 8), because on the
face of it, milk stored chilled should undergo more lipolysis than milk stored frozen at
12°C. However, this analysis is speculative because enzymes are still active in frozen
foods [53], and the damage caused to food structure by ice crystals and the attendance
increase in reactant concentrations may actually accelerate lipolysis. Ha & Lindsay [24]
used a blender to damage fat globules so to achieve enhancement of lipolysis.
Turning now to the frozen milk alone, there was a slight suggestion that β-CD was
effective in binding added 4-MeO, prompting a more definitive trial.
3.5 Definitive trial to test the effect of β-CD on the odour intensity of goat milk
The aim of this trial was also to see the most effective concentration level of β-CD on
odour of goat milk.
3.5.1 Design and methods
The goat milk, approximately two month old by this time, was thawed first in
refrigerator (two days) and then at room temperature (two hours). β-CD was added to
this milk at the rate of 0, 0.15, 0.25, or 0.35 % on the day of the sensory trial. This was
accomplished by gentle mixing in 100 ml capped bottles (Duran) about one hour before
the sensory trial began.
As usual, the panellists were asked to rank the treatments in order of perceived odour.
CONFIDENTIAL
33
3.5.2 Results
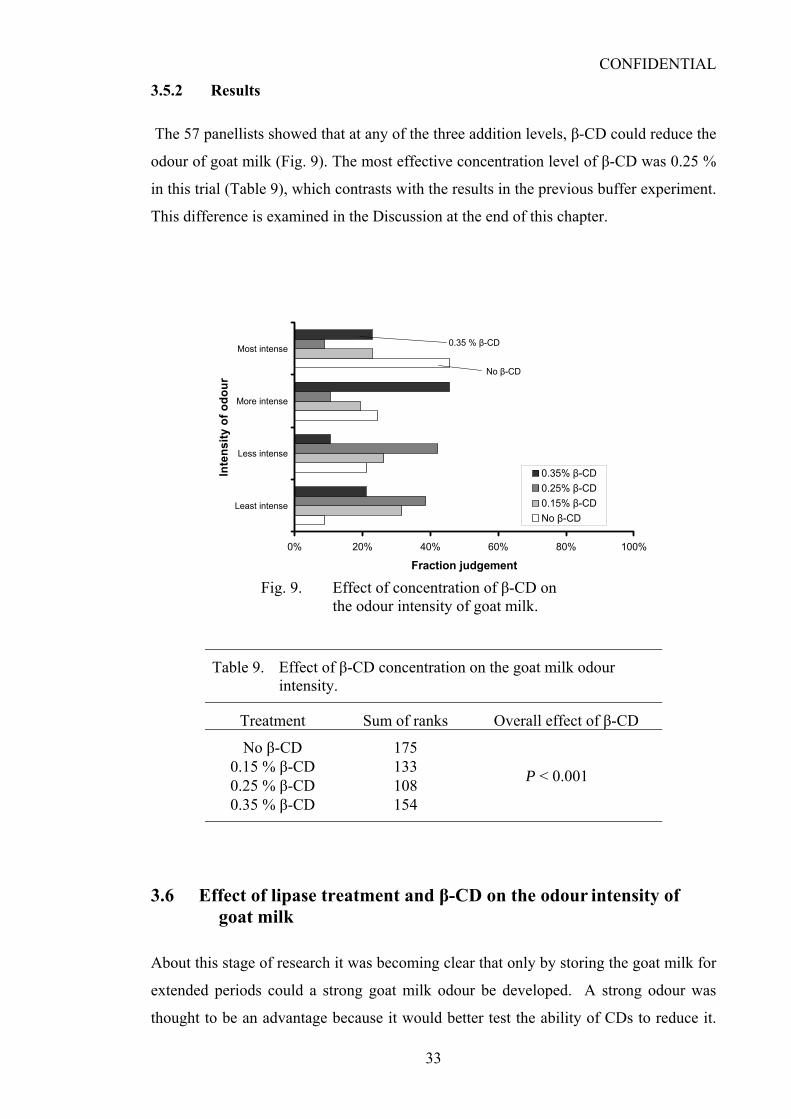
The 57 panellists showed that at any of the three addition levels, β-CD could reduce the
odour of goat milk (Fig. 9). The most effective concentration level of β-CD was 0.25 %
in this trial (Table 9), which contrasts with the results in the previous buffer experiment.
This difference is examined in the Discussion at the end of this chapter.
0% 20% 40% 60% 80% 100%
Least intense
Less intense
More intense
Most intense
Inte
nsity
of o
dour
Fraction judgement
0.35% β-CD0.25% β-CD0.15% β-CDNo β-CD
No β-CD
0.35 % β-CD
Fig. 9. Effect of concentration of β-CD on the odour intensity of goat milk.
Table 9. Effect of β-CD concentration on the goat milk odour intensity.
Treatment Sum of ranks Overall effect of β-CD
No β-CD 175
P < 0.001 0.15 % β-CD 133 0.25 % β-CD 108 0.35 % β-CD 154
3.6 Effect of lipase treatment and β-CD on the odour intensity of goat milk
About this stage of research it was becoming clear that only by storing the goat milk for
extended periods could a strong goat milk odour be developed. A strong odour was
thought to be an advantage because it would better test the ability of CDs to reduce it.

CONFIDENTIAL
34
A fungal lipase was therefore chosen to accelerate lipolysis (O.A. Young, pers. comm.)
and experiments with lipase were coupled to experiments with β-CD.
3.6.1 Design and methods
The Sigma lipase described in Chapter 2 was added to thawed goat milk at the rate of
3620 units per litre of milk, and incubated at room temperature for three hours and then
held overnight in a refrigerator. (As was common with experiments involving lipase,
samples were taken for free fatty acid analysis by the copper salt method. These results
are reported in Chapter 5.)
A volume of milk that had no lipase added was the control. β-CD was then added to the
control and lipased milk in a number of combinations (see Table 10 for design) that
were sniffed in two bays as in other trials. As usual a reference glass, water in this case,
was provided in each bay.
3.6.2 Results
In Bay 1, the result from 60 panellists showed a highly significant overall difference (P
< 0.001), and inspection of the rank sums strongly suggests that β-CD was particularly
effective where the milk had been treated with lipase. Also, lipase treatment clearly
increased odour intensity (187 versus 144) (Fig. 10).
0% 20% 40% 60% 80% 100%
Least intense
Less Intense
More Intense
Most intense
Inte
nsity
of o
dour
Fraction judgement
Lipase No β-CDLipase + β-CDNo lipase No β-CDNo lipase + β-CD
Lipase+0.35% β-CD
No Lipase +0.35% β-CD
Lipase No β-CD
Fig. 10. Effect of lipase treatment and β-CD on the odour intensity of goat milk.

CONFIDENTIAL
35
Table 10. Effect of lipase treatment and β-CD on the odour intensity of goat milk.
Treatment Sum of ranks
Lipase β-CD Bay 1 Bay 2
No No 144 No Yes, 0.35 % 130 Yes No 187 154 Yes Yes, 0.35 % 139 154 Yes Yes, 0.25 % 138 Yes Yes, 0.15 % 154
Overall statistical effect on odour intensity (P)
< 0.001 0.59
In Bay 2 (Fig. 11), the same panellists decided the difference in treatments was not at all
obvious (P = 0.59) (Table 10). Discussion of this result is deferred to the end of this
chapter.
0% 20% 40% 60% 80% 100%
Least intense
Less Intense
More Intense
Most intense
Inte
nsity
of o
dour
Fraction judgement
N0 β-CD0.15% β-CD0.25% β-CD0.35% β-CD
No β-CD
0.35% β-CD
Fig. 11. Effect of β-CD concentration on the odour intensity of lipased goat milk.
3.7 Effect of different CDs on odour intensities in spiked buffer, lipased goat milk, and cow milk spiked with skatole.
The previous experiment suggested that under some circumstances, β-CD was effective
in reducing goat milk odour. This work was continued comparing the effect of different,
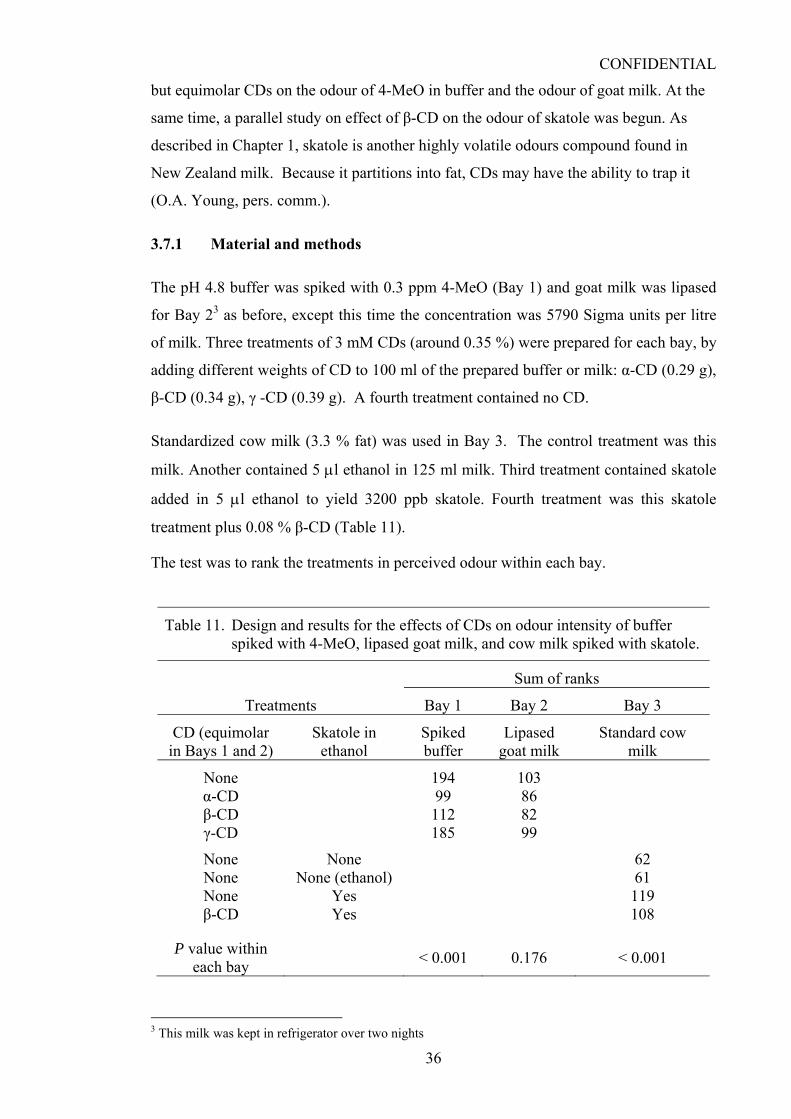
CONFIDENTIAL
36
but equimolar CDs on the odour of 4-MeO in buffer and the odour of goat milk. At the
same time, a parallel study on effect of β-CD on the odour of skatole was begun. As
described in Chapter 1, skatole is another highly volatile odours compound found in
New Zealand milk. Because it partitions into fat, CDs may have the ability to trap it
(O.A. Young, pers. comm.).
3.7.1 Material and methods
The pH 4.8 buffer was spiked with 0.3 ppm 4-MeO (Bay 1) and goat milk was lipased
for Bay 23 as before, except this time the concentration was 5790 Sigma units per litre
of milk. Three treatments of 3 mM CDs (around 0.35 %) were prepared for each bay, by
adding different weights of CD to 100 ml of the prepared buffer or milk: α-CD (0.29 g),
β-CD (0.34 g), γ -CD (0.39 g). A fourth treatment contained no CD.
Standardized cow milk (3.3 % fat) was used in Bay 3. The control treatment was this
milk. Another contained 5 μl ethanol in 125 ml milk. Third treatment contained skatole
added in 5 μl ethanol to yield 3200 ppb skatole. Fourth treatment was this skatole
treatment plus 0.08 % β-CD (Table 11).
The test was to rank the treatments in perceived odour within each bay.
Table 11. Design and results for the effects of CDs on odour intensity of buffer spiked with 4-MeO, lipased goat milk, and cow milk spiked with skatole.
Sum of ranks
Treatments Bay 1 Bay 2 Bay 3
CD (equimolar in Bays 1 and 2)
Skatole in ethanol
Spiked buffer
Lipased goat milk
Standard cow milk
None 194 103 α-CD 99 86 β-CD 112 82 γ-CD 185 99
None None 62 None None (ethanol) 61 None Yes 119 β-CD Yes 108
P value within each bay < 0.001 0.176 < 0.001
3 This milk was kept in refrigerator over two nights
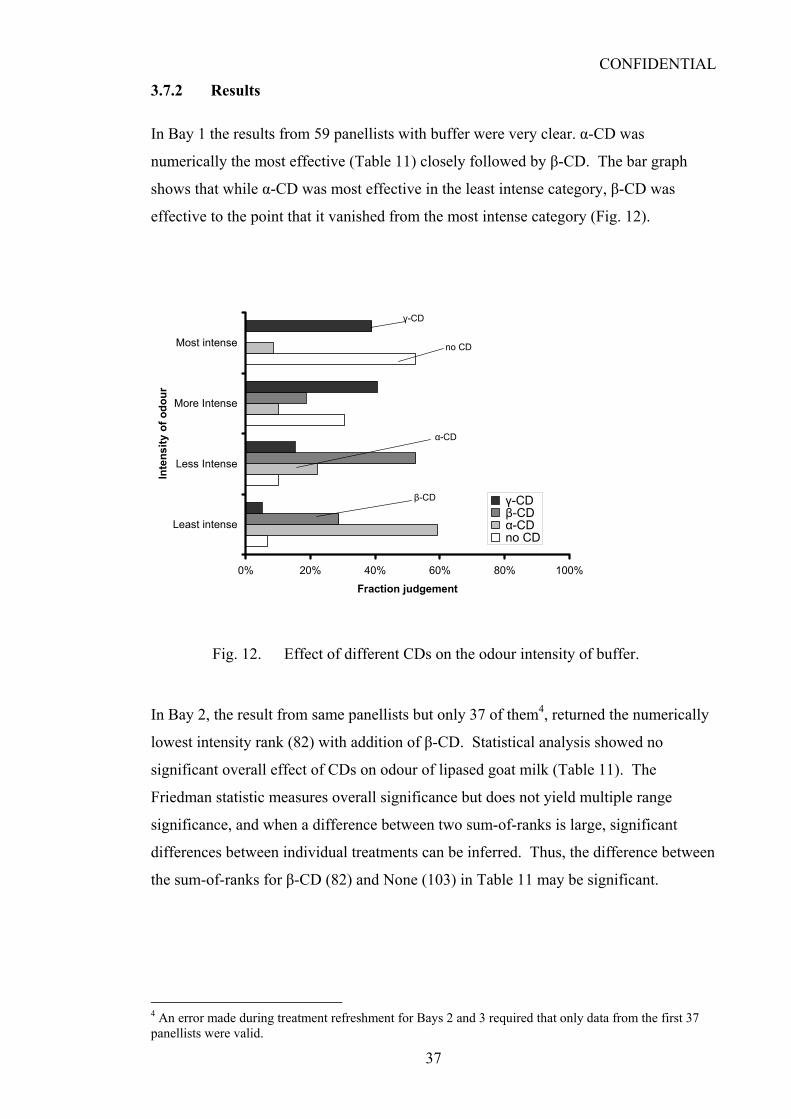
CONFIDENTIAL
37
3.7.2 Results
In Bay 1 the results from 59 panellists with buffer were very clear. α-CD was
numerically the most effective (Table 11) closely followed by β-CD. The bar graph
shows that while α-CD was most effective in the least intense category, β-CD was
effective to the point that it vanished from the most intense category (Fig. 12).
0% 20% 40% 60% 80% 100%
Least intense
Less Intense
More Intense
Most intense
Inte
nsity
of o
dour
Fraction judgement
γ-CD β-CD α-CD no CD
no CD
γ-CD
α-CD
β-CD
Fig. 12. Effect of different CDs on the odour intensity of buffer.
In Bay 2, the result from same panellists but only 37 of them4, returned the numerically
lowest intensity rank (82) with addition of β-CD. Statistical analysis showed no
significant overall effect of CDs on odour of lipased goat milk (Table 11). The
Friedman statistic measures overall significance but does not yield multiple range
significance, and when a difference between two sum-of-ranks is large, significant
differences between individual treatments can be inferred. Thus, the difference between
the sum-of-ranks for β-CD (82) and None (103) in Table 11 may be significant.
4 An error made during treatment refreshment for Bays 2 and 3 required that only data from the first 37 panellists were valid.
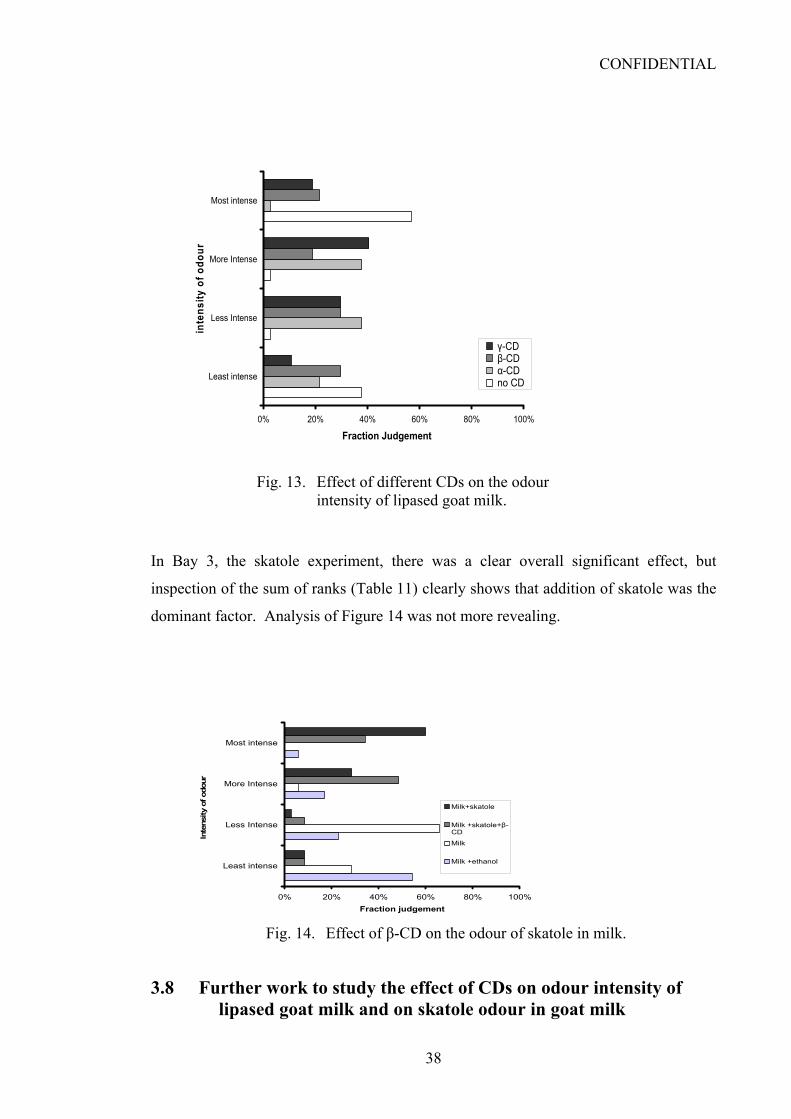
CONFIDENTIAL
38
0% 20% 40% 60% 80% 100%
Least intense
Less Intense
More Intense
Most intensein
tens
ity o
f odo
ur
Fraction Judgement
γ-CD β-CD α-CD no CD
Fig. 13. Effect of different CDs on the odour intensity of lipased goat milk.
In Bay 3, the skatole experiment, there was a clear overall significant effect, but
inspection of the sum of ranks (Table 11) clearly shows that addition of skatole was the
dominant factor. Analysis of Figure 14 was not more revealing.
0% 20% 40% 60% 80% 100%
Least intense
Less Intense
More Intense
Most intense
Inte
nsity
of o
dour
Fraction judgement
Milk+skatole
Milk +skatole+β-CD
Milk
Milk +ethanol
Fig. 14. Effect of β-CD on the odour of skatole in milk.
3.8 Further work to study the effect of CDs on odour intensity of lipased goat milk and on skatole odour in goat milk

CONFIDENTIAL
39
The previous experiment (Section. 3.7) showed no clear effect of CDs on goat milk
odour intensity where the milk had previously been treated with lipase to liberate free
fatty acids. This was possibly because of excessive lipolysis placing big demands on
added CDs or because of panellist exhaustion in Bay 2 (and Bay 3).
Therefore the experiment was repeated except that the degree of lipolysis was less and
the lipased treatments were compared in Bay 1. At the same time the skatole experiment
was repeated with minor changes. There were 60 panellists in this experiment.
3.8.1 Material and methods
Lipased goat milk was prepared this time with lipase concentration as 724 Sigma units
per litre of milk. The treatments (Table 12) were prepared from this milk by adding
different CDs as in the previous experiment (Section 3.7.1).
The concentration level of skatole was retained at 3200 ppb, but this time two β-CD
concentrations were included in the design (Table 12).
Table 12. Design and results for effect of CDs on the odour intensity of lipased goat milk, and cow milk spiked with skatole.
Sum of ranks
Treatments Bay 1 Bay 2
CD (equimolar in Bay 1) Skatole in ethanol Lipased goat
milk Standard cow
milk
None 162 α-CD 157 β-CD 126 γ-CD 165
None None (ethanol) 108 None Yes 166
β-CD, 0.08 % Yes 155 β-CD, 0.16 % Yes 181
P value within each bay < 0.001 < 0.001

CONFIDENTIAL
40
3.8.2 Results
In Bay 1, CDs had a highly significant overall effect (P < 0.001) on odour intensity
(Table 12). Inspection of the ranks and the fraction judgements in Figure 15 indicates
that the most effective CD was β-CD.
0% 20% 40% 60% 80% 100%
Least intense
Less Intense
More Intense
Most intense
Inte
nsity
of o
dour
Fraction judgement
γ-CD β-CD α-CD no CD
γ-CD
β-CD
α-CD
No-CD
Fig. 15. Effect of different CDs on the odour intensity of lipased goat milk.
In Bay 2 (Fig. 16), where skatole odour was evaluated, there was a significant overall
effect (P < 0.001), but this was clearly due to skatole rather than β-CD.

CONFIDENTIAL
41
0% 20% 40% 60% 80% 100%
Least intense
Less Intense
More Intense
Most intenseIn
tens
ity o
f odo
ur
Fraction judgement
Skatole no β-CD
Skatole + 0.16% β-CDSkatole + 0.08% β-CDNo skatole no β-CD
Fig. 16. Effect of β-CD on the odour of skatole in cow milk.
Attention is drawn to the fact that overall, panellists judged the no-skatole treatment to
be in the highest intensity category about 15 % of the time and in the lowest category
about 65 % of the time. Given the known potency of this compound the 15 % result
suggests confusion due to panellist exhaustion (Bay 2) or carry-over effects from glass
to glass (four to sniff in random order).
Thus, the results for skatole were inconclusive, so a final skatole experiment was
designed where only two treatments (plus a water reference) were presented.
3.9 Further experiments with β-CD and skatole in cow milk
This experiment was carried out at the same time as a yoghurt experiment (see
Chapter 4, Section 4.4) but the results were abstracted into this chapter.
3.9.1 Materials and methods
The methods were as described in the previous two skatole experiments except that
concentrations were as described below (Table 13).

CONFIDENTIAL
42
Table 13. Design and results for effect of CDs on the odour intensity of cow milk spiked with 500 ppb skatole.
Treatment Sum of ranks Effect of β-CD
No β-CD 92 P = 0.36 Plus β-CD (0.35 %) 85
3.9.2 Results
Table 13 indicates no significant effect of β-CD.
3.10 Discussion
At a single concentration, 3 mM, α-CD was the most effective CD in reducing the odour
of 4-MeO in buffer, and γ-CD the least effective (Table 11). Table 5 in Chapter 1 shows
that γ-CD has the largest cavity, and may be too wide to bind fatty acids strongly, also
suggested by Reineccius et al. [51] and Duchene et al. [40].
Duchene et al. [40] also reported two researchers noting that α-CD has the highest
affinity for short chain fatty acids due to a smaller gap between atoms of host and guest
molecules that results in stronger interactions. The diameter of alkyl chain of an
unbranched fatty acid was calculated (O.A. Young) to be 0.405 nm. α-CD has a cavity
diameter between 0.47 and 0.53 nm, dimensions perhaps optimal for binding.
The fatty acids characterizing goat milk introduce a complexity. They are branched at
carbon 4 numbering from the carboxyl end of the molecule, which means that the
branch methyl- or ethyl- groups may be trapped, or the butyl- or pentyl- groups (from
branched octanoic and nonanoic respectively). Alternatively the trapping may involve
both branches of the molecule. Whatever the manner of binding, the superior results
obtained with α-CD in buffer probably indicates a tight binding due to hydrophobicity
and molecular dimensions (O.A. Young)
However, in the much more complex medium of milk, and at a different pH, β-CD was
the most effective. α-CD and γ-CD were comparatively ineffective, particularly γ-CD
probably because of the much wider cavity.
The reason for α-CD being less effective may be competition among hydrophobic
molecules in goat milk. It cannot be said that α-CD is incapable of binding BCFAs.
CONFIDENTIAL
43
Rather BCFAs are not the only small hydrophobic molecules in goat milk, and what
binds to what, will be governed by binding equilibria for the different molecular species
and the relative rate at which the complexes are formed (O.A. Young, pers. comm.).
The latter depend on the energy barriers to be overcome in the pathway to successful
binding. There is no information about these factors in milk, so for the moment the
empirical observation that β-CD performs best will dictate commercial application.
Now discussing the theory behind different concentration levels, two experiments show
that of three concentrations examined in goat milk, 0.25 % β-CD was the most effective,
while the highest concentration, 0.35 %, appeared the least effective. By contrast, the
highest concentration used in buffer (0.32 %) was the most effective. One possible
explanation for this is that 0.35 % β-CD in milk may bind BCFAs and other fatty acids
so well, that the qualitative odour profile of the milk changes, due to other volatile
molecules dominating the headspace above milk. Panellists may have perceived a
change in odour as an increase in odour intensity.
In simple aqueous solutions like buffers, the panellist decisions were usually clear cut,
but with food as complex as milk they found the task more difficult.
Panellist fatigue was a complication in all this sensory work. The first fatigue factor
could be that in these experiments panellists had to rank four samples in each bay. This
is a more difficult task than a triangle test where panellists have to choose the different
one in a group of three. (Triangle tests would have little value here, because odour
intensity was of more interest.) A second fatigue factor was the multiple bays. Faced
typically, with the difficulty of accessing 50 plus people for a trial that was not
intrinsically popular – sniffing goat milk – it was decided to conduct more than one test
at each session. Up to three bays were therefore used. As testing proceeded, the clear
impression was gained that the effort spent in Bays 2 and 3 was less than in Bay 1.
Adaptation may also play a part here. According to Meilgaard et al. [30], adaptation –
which is a change in sensitivity from repeated exposure – is very common in intensity
ratings. Third, a new base material was often presented in each bay, requiring
relearning. Thus the quality of the data in Bays 2 and 3 may be lower than that in
Bay 1.
Skatole presented further complications. Fatty acids were the compounds of primary
interest study in this project and most of the panellists were part of a group that
routinely participated in the sensory evaluations. Thus they would have become
experienced in their detection. By contrast, skatole was presented much less often and
CONFIDENTIAL
44
has a particularly unpleasant odour. Another complication with skatole was the carry-
over effect that is a feature of this compound. People working with skatole often
comment on this feature.
Although the simple answer maybe that CDs are not effective in reducing skatole odour,
the results from the three skatole trials were nontheless encouraging. β-CD nearly
always reduced skatole odour, but to a statistically insignificant degree within each trial.
As the experiments progressed it became clear that only about half the population
tested, of mixed ages and gender, were sensitive to BCFA odours. This makes the
statistically significant results obtained all the more important, because the groups used
were more like a consumer panel than a trained analytical panel.
Identification of a subpopulation of AUT staff members and postgraduate students who
were sensitive to BCFAs was useful, because it opened the way to do more formal
analytical trials with yoghurt in particular, the next topic.

CONFIDENTIAL
45
4 Effect of β-CD on odour and flavour of goat milk yoghurt
Sensory experiments done with milk and buffer showed that cyclodextrins were
effective in reducing the intensity of goat milk odour and, by implication, goat milk
flavour. These experiments led the way to a study of the effect of β-CD on odour and
flavour of goat milk yoghurt.
4.1 Aim of the experiments
The aims of these yoghurt sensory experiments were to evaluate the effect of β-CD on
panellist perceptions of odour and flavour, and to find out if the time of β-CD addition
affected its performance.
For several reasons, CDs and fatty acids may interact differently in yoghurt compared
with milk.
First, the pH of goat milk is about 6.7 whereas the pH of typical yoghurts is about 4.5,
which is just below the pKa of the shorter chain fatty acids [47]. Thus more than half of
the free fatty acids will be protonated. Only in this form are they detectable as an
odour/flavour. Thus at say, pH 4.5, the free fatty acids will be more obvious as a
flavour and any binding by β-CD may be swamped. Alternatively, the non-ionic
protonated form of the fatty acids may assist the hydrophobic interaction of acid and
β-CD. Low pH may also have another effect (O.A. Young, pers. comm.). The α-1,4
bonds of starches in general are increasingly prone to hydrolysis with lower pH levels
[54]. Hydrolysis would break rings, producing the fragments unable to bind small
molecules. However, this effect is probably not of concern because CDs are stable at
pH 3.0 and higher [54].
Second, the organisms responsible for fermenting lactose to lactic acid may also
metabolise CDs, again negating binding of small molecules.
CONFIDENTIAL
46
Third, during fermentation at 45°C, lipolysis will be accelerated, hence generating
higher concentrations of free fatty acids requiring trapping by CDs. BCFAs are a
minor fraction of the total fatty acid profile and there is no obvious reason why they
should be bound in preference to say caproic and capric acids, or indeed any others. On
the other hand, methyl and ethyl side chains of the BCFAs may confer greater
hydrophobicity in the CD environment, so favouring preferential binding.
4.2 Development of yoghurt
For pilot experiments, goat milk powder (Chapter 2) was added to thawed, pasteurised
goat milk at the rate of 10 g per litre. The mixture was heated to 48°C, inoculated with
commercial yoghurt, DeWinkel fermented with Lactobacillus acidophilus. It was then
incubated for 4 hours at 45°C and cooled. Yoghurt made in this way was more liquid
than expected, and further trials to achieve better setting by increasing the solids content
and incubation time made no basic different to the consistency obtained. Parallel trials
with cow milk showed that the liquid consistency of goat milk yoghurt was intrinsic to
the raw material, apparently due to the structure of α-S1 casein [55]. Attempts to
thicken the goat milk yoghurt were therefore discontinued. The measure of success was
defined as titratable acidity of more than 0.85 % lactic acid [56].
4.3 Preliminary trials
For informal trials, goat milk yoghurt samples were prepared as described above and
β-CD added as follows: a control with no addition, and β-CD added (0.35 %) before the
milk was heated. The measured acidity of the final yoghurt was 1.05 % lactic acid. An
informal panel of four persons decided that the odour and flavour of the treated yoghurt
was lower than that of the control. This result prompted formal sensory trials.
4.4 Effect of β-CD on odour intensity of goat and cow milk yoghurts
4.4.1 Design and methods
For this work three sensory bays were used. In Bay 1, goat milk yoghurt prepared as
above with acidity of 0.85 % was tested. Bay 2 compared parallel treatments of cow
milk yoghurt. Cow milk yoghurt was made in a parallel way to goat milk yoghurt,
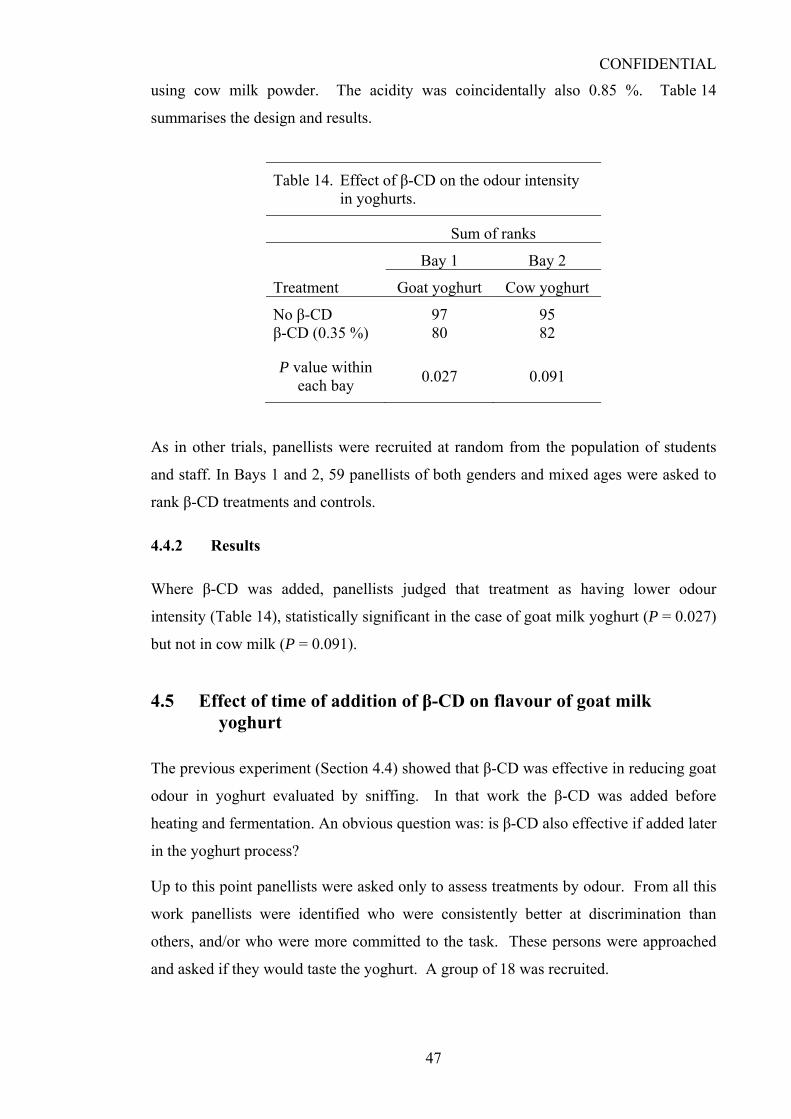
CONFIDENTIAL
47
using cow milk powder. The acidity was coincidentally also 0.85 %. Table 14
summarises the design and results.
Table 14. Effect of β-CD on the odour intensity in yoghurts.
Sum of ranks
Bay 1 Bay 2
Treatment Goat yoghurt Cow yoghurt
No β-CD 97 95 β-CD (0.35 %) 80 82
P value within each bay 0.027 0.091
As in other trials, panellists were recruited at random from the population of students
and staff. In Bays 1 and 2, 59 panellists of both genders and mixed ages were asked to
rank β-CD treatments and controls.
4.4.2 Results
Where β-CD was added, panellists judged that treatment as having lower odour
intensity (Table 14), statistically significant in the case of goat milk yoghurt (P = 0.027)
but not in cow milk (P = 0.091).
4.5 Effect of time of addition of β-CD on flavour of goat milk yoghurt
The previous experiment (Section 4.4) showed that β-CD was effective in reducing goat
odour in yoghurt evaluated by sniffing. In that work the β-CD was added before
heating and fermentation. An obvious question was: is β-CD also effective if added later
in the yoghurt process?
Up to this point panellists were asked only to assess treatments by odour. From all this
work panellists were identified who were consistently better at discrimination than
others, and/or who were more committed to the task. These persons were approached
and asked if they would taste the yoghurt. A group of 18 was recruited.
CONFIDENTIAL
48
4.5.1 Methods and design
The samples and treatments for this sensory trial were also prepared as above except
that starter used was Cyclops yoghurt described as containing active Lactobacillus
acidophilus and Bifidobacterium bifidus. The final acidity was 1.5% lactic acid.
The treatments were as follows:
A No β-CD in fermented goat milk yoghurt
B β-CD (0.35 %) added before heating and fermentation of goat milk yoghurt
C β-CD (0.35 %) added after fermentation and cooling of goat milk yoghurt
The yoghurts were prepared from thawed goat milk and goat milk powder as before.
For B (750 ml), β-CD was added before heating milk to 48°C and for A and C (1500
ml) no β-CD was added; after fermentation and cooling, half the yoghurt was treated
with β-CD 30 minutes before the sensory trial began (C). β-CD was added and mixed in
with a stirring rod. A was left untreated.
The 18 panellists appeared in three groups of six people to make the trial manageable.
For each group a given panellist was presented with three trays representing the three
tests: A compared with B, A with C, and B with C.
The treatments were provided in 60 ml portion cups with a sample size between 15 and
20 ml. Because panellists (unknowingly) tasted yoghurts more than once, two three-
digit codes were used for each treatment. This meant that each panellist saw six
different numbers, thus avoiding inferences from a prior taste.
Further details of the design and the questionnaire are presented in Appendix III and
Appendix IV. The outcome was a completely randomized design for blinding codes,
order of test, and order of presentation within test. Randomizing the order of test was
particularly important because it eliminated bias due to exhaustion.
4.5.2 Results
In the first comparison, A with B, one panellist did not respond. The data from 17
panellists concluded that β-CD does have a highly significant effect (P < 0.001) on
flavour when added before fermentation (Table 15).
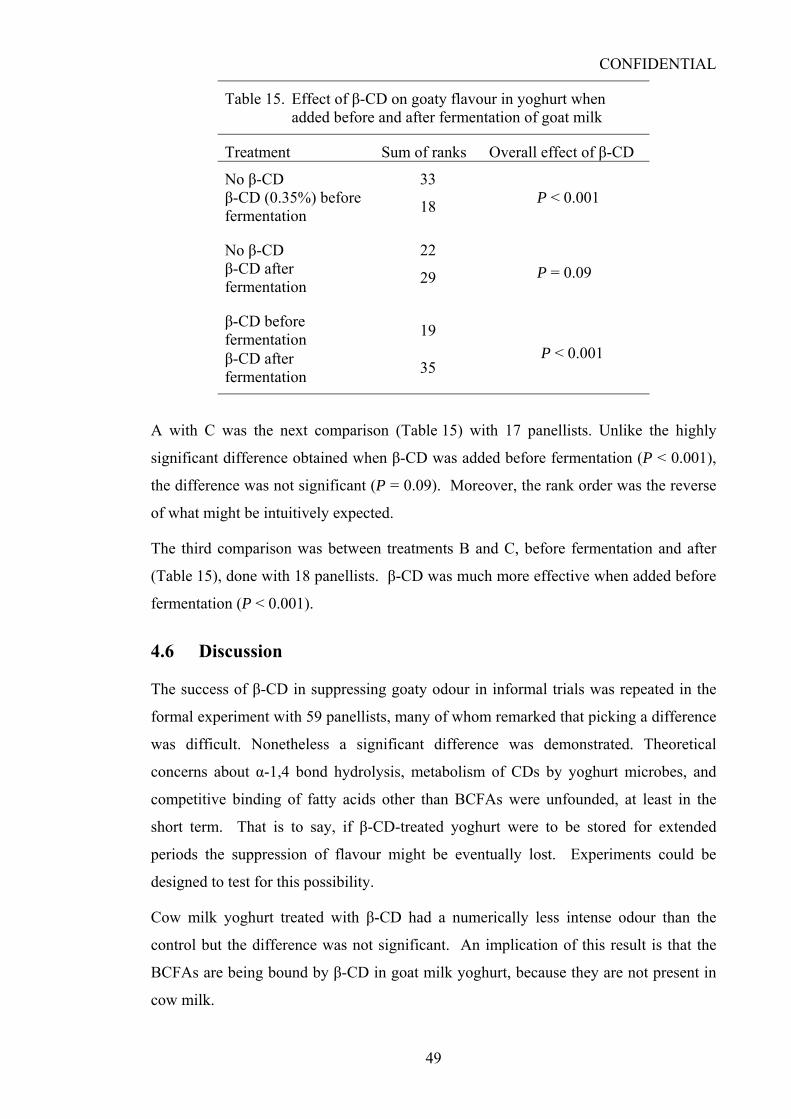
CONFIDENTIAL
49
Table 15. Effect of β-CD on goaty flavour in yoghurt when added before and after fermentation of goat milk
Treatment Sum of ranks Overall effect of β-CD
No β-CD 33 P < 0.001 β-CD (0.35%) before
fermentation 18
No β-CD 22 P = 0.09 β-CD after
fermentation 29
β-CD before fermentation 19
P < 0.001 β-CD after fermentation 35
A with C was the next comparison (Table 15) with 17 panellists. Unlike the highly
significant difference obtained when β-CD was added before fermentation (P < 0.001),
the difference was not significant (P = 0.09). Moreover, the rank order was the reverse
of what might be intuitively expected.
The third comparison was between treatments B and C, before fermentation and after
(Table 15), done with 18 panellists. β-CD was much more effective when added before
fermentation (P < 0.001).
4.6 Discussion The success of β-CD in suppressing goaty odour in informal trials was repeated in the
formal experiment with 59 panellists, many of whom remarked that picking a difference
was difficult. Nonetheless a significant difference was demonstrated. Theoretical
concerns about α-1,4 bond hydrolysis, metabolism of CDs by yoghurt microbes, and
competitive binding of fatty acids other than BCFAs were unfounded, at least in the
short term. That is to say, if β-CD-treated yoghurt were to be stored for extended
periods the suppression of flavour might be eventually lost. Experiments could be
designed to test for this possibility.
Cow milk yoghurt treated with β-CD had a numerically less intense odour than the
control but the difference was not significant. An implication of this result is that the
BCFAs are being bound by β-CD in goat milk yoghurt, because they are not present in
cow milk.

CONFIDENTIAL
50
The experiment about time of β-CD addition clearly showed early addition was
effective while addition after fermentation was not. There are several possible reasons
for this. Heating of the milk before fermentation and incubation at 45°C will help
overcome the energy barrier required to replace water in the CD core with the guest
molecule, putatively the BCFAs. Heating CD and guest molecule mixtures is a standard
way of forming complexes [51].
The results got from the experiment ‘effect of β-CD on goat yoghurt flavour’ were
spectacular for Bay 1 and Bay 3 (P < 0.001). One reason for these clear results could be
the panel selection for good discrimination ability with BCFAs. But the other reason
could be the act of tasting of yoghurt rather than just smelling. Volatile fatty acids may
be perceived more easily during tasting. This was the first trial with taste.
Whatever is true, the obvious result was that β-CD reduced the goaty flavour when
added before fermentation. The ranking experiments done so far have not measured the
degree of difference caused by β-CD. This was done by another experiment, detailed in
Chapter 6, which, critically, also revealed whether the β-CD-treated goat milk yoghurt
affected liking.

CONFIDENTIAL
51
5 Effect of β-CD on the partitioning of free fatty acids in milk
5.1 Introduction
Many of the sensory experiments reported in previous chapters indicated that β-CD was
effective in reducing the headspace odour from goat milk. If true, a reduced
concentration of BCFAs and other volatile fatty acids in the headspace should be
measurable by chemical methods. Moreover, complex formation with fatty acids would
be likely to affect the partitioning of free fatty acids between the aqueous phase and the
lipid phases of milk. Again, this should be detectable chemically. This chapter
examines partitioning.
5.2 The effect of β-CD on partitioning of fatty acids in milk
The research path was diverted to study the interaction of β-CD and free fatty acids in
milk. The principal of this method was that if free fatty acids were trapped in the
hydrophobic core of CDs, their solubility in the aqueous skim milk phase would
theoretically increase and the solubility in the fat phase of milk would theoretically
decrease. The basis of this model is that the outer surface of the CDs is hydrophilic,
thus partitioning free fatty acids, including free BCFAs, in the skim milk fraction.
To test this model, milk was separated into cream and skim milk. The fatty acid
concentration in the anhydrous fat phase (also known as ghee), and in skim milk, were
measured by standard dairy methods generally known as free fatty acid value in fat and
the copper salt method [57], respectively.
5.2.1 Method development and preliminary trials
The original intention was to apply these methods to goat milk, but centrifugation trials
were unproductive. Similarly, centrifugation of standard homogenized cow milk was
largely unsuccessful. The reason for these failures may be due to the small average
diameter of the fat globules in goat milk [20] and homogenized cow milk [26].

CONFIDENTIAL
52
Moreover, a dedicated dairy centrifuge, which is efficient at separating skim milk and
cream, was not available. It was decided to switch to unhomogenized full fat cream
cow milk (Meadowfresh, Tararua), which has a natural tendency to cream. Whereas
cow milk is not goat milk, the principles of partitioning free fatty acids should apply to
any milk.
The first successful separation was done with a Sorvall RS5 centrifuge fitted with a
GSA head (3-5°C, 16,000 gravities (average), 10 minutes). Under these conditions fat
globules accumulated at the top of the one litre of milk that could be centrifuged, and
there was no obvious tendency for casein micelles to precipitate. No attempt was made
to optimize the quantity of fat separated. (At the same time it must be pointed out that
the so-called skim milk would contain an unquantified fraction of the fat).
The fat layer was substantially recovered with a spatula, but ultimately yielding no more
than 14 g of anhydrous milk fat from a litre. The stated fat content of this cow milk is
about 4.2 %, meaning that yield of anhydrous fat was no more than 30 %. The weight
of free fatty acids (expressed as palmitic acid) present in the anhydrous fat was
determined by an alkali titration method. In outline, the cream is carefully heated to
break the phases, evaporate the moisture, and denature milk proteins. The liquid fat is
recovered by filtration through cotton wool that retained a residue. To 4.5 g of
anhydrous fat, 25 ml of neutralised 95 % ethanol is added and the mixture is heated to
boiling temperature and then cooled to approximately 85°C. While still around 85°C,
this solution is immediately titrated to a phenolphthalein endpoint with NaOH [58].
In developmental trials, a value of 0.15 % free fatty acid in anhydrous was obtained,
here termed the acid value. When this value was converted to free fatty acid per litre of
milk (assuming the stated fat content of 4.2 %), a plausible value of 0.07 g of free fatty
acid per litre was obtained. This calculation assumes the bulk of the free fatty acids
were present in the fat phase, as indeed was later shown to be the case.
The method was then applied to milk treated with β-CD.
5.3 Preliminary experiment to study effect of β-CD on milk fat and skim milk
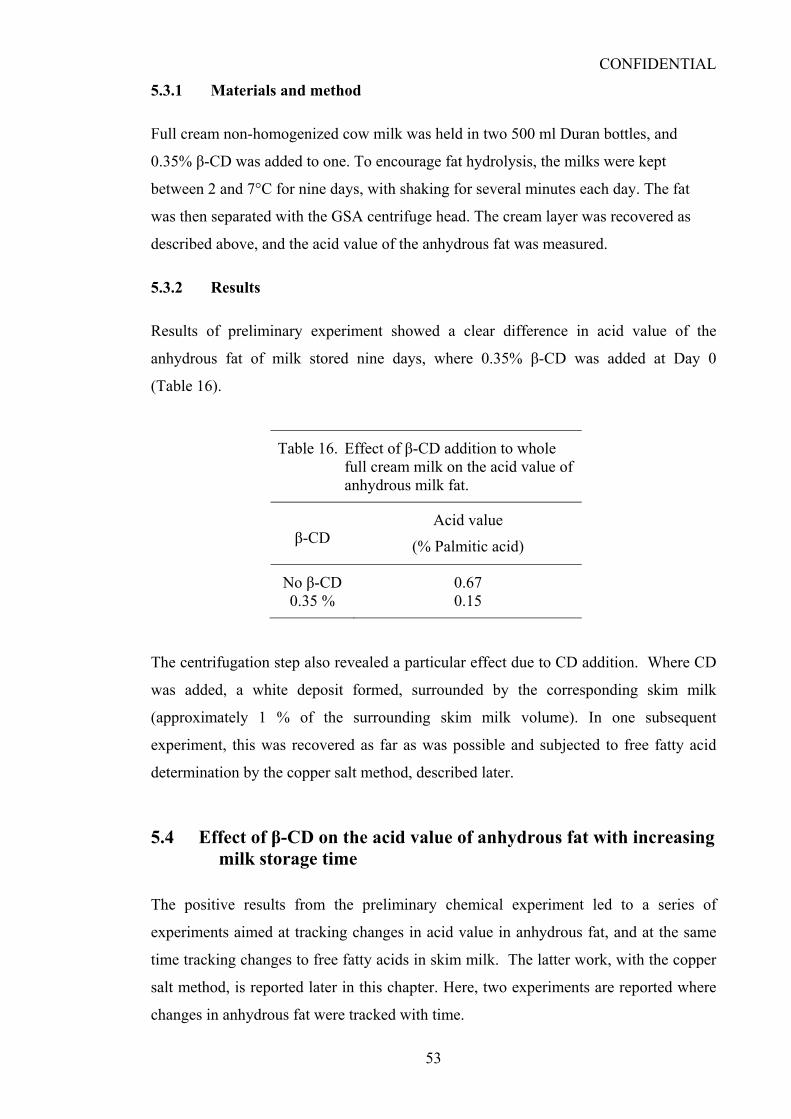
CONFIDENTIAL
53
5.3.1 Materials and method
Full cream non-homogenized cow milk was held in two 500 ml Duran bottles, and
0.35% β-CD was added to one. To encourage fat hydrolysis, the milks were kept
between 2 and 7°C for nine days, with shaking for several minutes each day. The fat
was then separated with the GSA centrifuge head. The cream layer was recovered as
described above, and the acid value of the anhydrous fat was measured.
5.3.2 Results
Results of preliminary experiment showed a clear difference in acid value of the
anhydrous fat of milk stored nine days, where 0.35% β-CD was added at Day 0
(Table 16).
Table 16. Effect of β-CD addition to whole full cream milk on the acid value of anhydrous milk fat.
β-CD Acid value
(% Palmitic acid)
No β-CD 0.67 0.35 % 0.15
The centrifugation step also revealed a particular effect due to CD addition. Where CD
was added, a white deposit formed, surrounded by the corresponding skim milk
(approximately 1 % of the surrounding skim milk volume). In one subsequent
experiment, this was recovered as far as was possible and subjected to free fatty acid
determination by the copper salt method, described later.
5.4 Effect of β-CD on the acid value of anhydrous fat with increasing milk storage time
The positive results from the preliminary chemical experiment led to a series of
experiments aimed at tracking changes in acid value in anhydrous fat, and at the same
time tracking changes to free fatty acids in skim milk. The latter work, with the copper
salt method, is reported later in this chapter. Here, two experiments are reported where
changes in anhydrous fat were tracked with time.
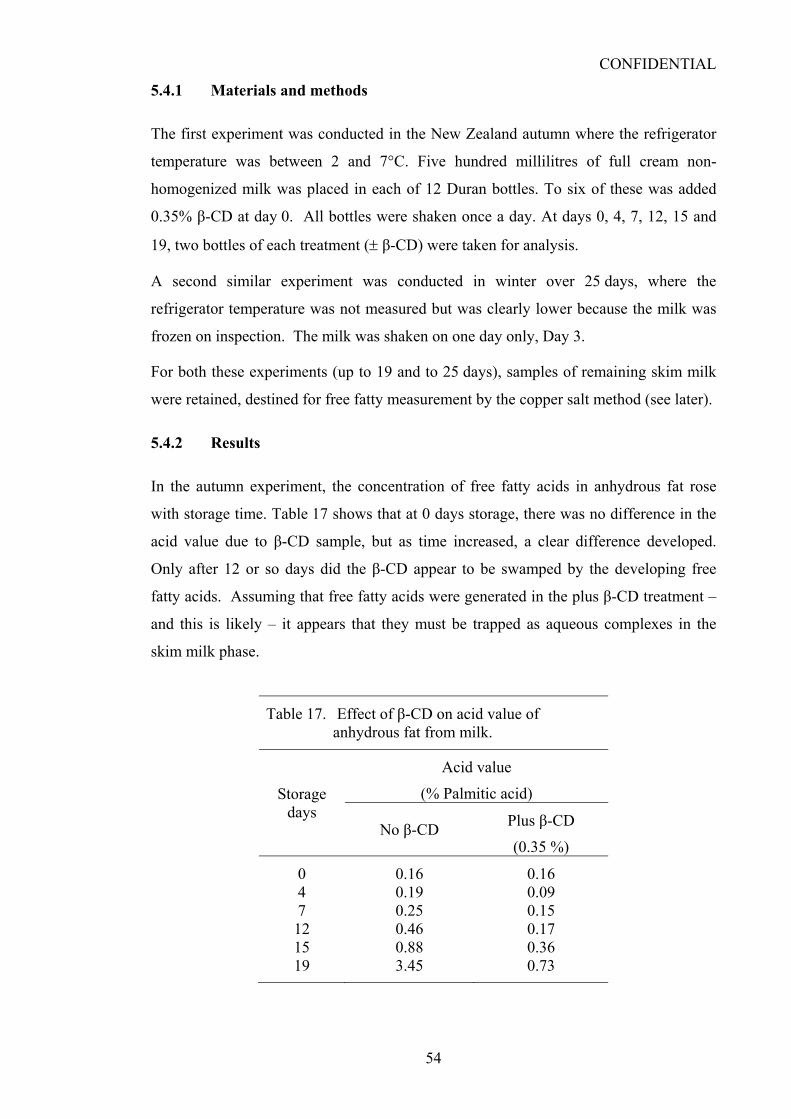
CONFIDENTIAL
54
5.4.1 Materials and methods
The first experiment was conducted in the New Zealand autumn where the refrigerator
temperature was between 2 and 7°C. Five hundred millilitres of full cream non-
homogenized milk was placed in each of 12 Duran bottles. To six of these was added
0.35% β-CD at day 0. All bottles were shaken once a day. At days 0, 4, 7, 12, 15 and
19, two bottles of each treatment (± β-CD) were taken for analysis.
A second similar experiment was conducted in winter over 25 days, where the
refrigerator temperature was not measured but was clearly lower because the milk was
frozen on inspection. The milk was shaken on one day only, Day 3.
For both these experiments (up to 19 and to 25 days), samples of remaining skim milk
were retained, destined for free fatty measurement by the copper salt method (see later).
5.4.2 Results
In the autumn experiment, the concentration of free fatty acids in anhydrous fat rose
with storage time. Table 17 shows that at 0 days storage, there was no difference in the
acid value due to β-CD sample, but as time increased, a clear difference developed.
Only after 12 or so days did the β-CD appear to be swamped by the developing free
fatty acids. Assuming that free fatty acids were generated in the plus β-CD treatment –
and this is likely – it appears that they must be trapped as aqueous complexes in the
skim milk phase.
Table 17. Effect of β-CD on acid value of anhydrous fat from milk.
Storage days
Acid value
(% Palmitic acid)
No β-CD Plus β-CD
(0.35 %)
0 0.16 0.16 4 0.19 0.09 7 0.25 0.15 12 0.46 0.17 15 0.88 0.36 19 3.45 0.73

CONFIDENTIAL
55
The winter experiment showed that β-CD was effective in binding free fatty acids
(Table 18) but the acid values measured were much lower than in Table 17. The
simplest explanation of this is a lack of hydrolysis due to cooler storage in winter.
However, the effect of a difference in shaking frequency cannot be excluded.
Table 18. Effect of β-CD on the acid value of anhydrous fat of naturally aged milk.
Storage days
Acid value
(% Palmitic acid)
No β-CD Plus β-CD
(0.35 %)
17 0.19 0.10 25 0.26 0.13
5.5 Effect of β-CD on the acid value of lipased milk fat
Lipase was previously used to accelerate the development of goaty flavour for sensory
trials with β-CD. This approach was also applied to the partitioning of fat between the
cream and skim milk phases. Three experiments are reported here on milk lipased
similarly as above.
5.5.1 Material and methods
For this work full cream cow milk was bought on three occasions. The concentration of
added lipase was a constant 1448 Sigma units per litre of milk, but the incubation time
and temperature varied (Table 19) before centrifugation and determination of acid value
in anhydrous fat. The experiment with three hours lipolysis was incubated at room
temperature whereas the rest of the two were incubated at 35°C. As in the above
storage time experiments, the skim milk was sampled for free fatty measurement (see
later).

CONFIDENTIAL
56
5.5.2 Results
Table 19. Effect of β-CD on the acid value of anhydrous fat from three discrete lipased milk samples.
Incubation time (hours)
Acid value
(% Palmitic acid)
No β-CD Plus β-CD
(0.35 %)
3 1.83 1.27 2 2.56 1.91
1.75 1.45 0.89
For each discrete lot of lipased milk, β-CD reduced the acid value.
5.6 Free fatty acid concentration in skim milk by the copper salt method
As noted before, if CDs were successfully binding free fatty acids and thus excluding
them from the anhydrous milk fat fraction, they must presumably be partitioning into
the skim milk fraction. Therefore for most of the acid value measurements performed
on anhydrous fat, parallel measurements for free fatty acids were made on the
equivalent skim milk. The method of choice was the copper salt method. The
calibration curve obtained with the available apparatus is shown in Figure 17. This was
used for all the data presented in Table 20.

CONFIDENTIAL
57
0, 0
0.23, 0.2
0.42, 0.4
0.77, 0.8
1.47, 1.6
00.20.40.60.8
11.21.41.61.8
0 0.25 0.5 0.75 1 1.25 1.5 1.75
Concentration of palmitic acid (mM)
Abs
orba
nce
at 4
40 n
m
Fig. 17. Standard curve obtained from known concentrations of palmitic acid.
In the copper salt method, free fatty acids are complexed with Cu2+ ions, then
partitioned into an organic solvent. The copper is then complexed with the colourless
diethydithiocarbamate to form a yellow compound whose concentration is measured by
spectrophotometry at 440 nm.
While the copper salt method was mainly directed at partitioning experiments between
cream and skim milk, some measurements were also made on milks used for certain
sensory experiments. Likewise the method was, on one occasion, also applied to the
centrifugation deposits that occurred where β-CD had been added to whole full cream
milk.
Unlike the acid value method for anhydrous fat, considerable difficulty was experienced
with the copper salt method. Extracts destined for spectrophotometry were sometimes
cloudy and therefore unreadable. Eventually this problem was traced to moisture in one
of the reagents, butanol. This was corrected by use of a drying agent.
5.6.1 Results
Table 20 reports experiments for which acceptable data were obtained. Measurements
were at least duplicated for each sample, but agreement between duplicates was often

CONFIDENTIAL
58
poor. The possible reasons for this are discussed later. For the moment it pointed out
that differences between treatments would have to be large to be meaningful.

CONFIDENTIAL
59
Table 20. Fatty acid concentrations in skim and whole milks of goat and cow calculated by the copper salt method.
CONFIDENTIAL
60
In the experiment where data were averaged over Days 0 to 15 (Table 20), β-CD had no
effect on free fatty acid concentration on skim milk (or whole milk). This results
conflicts with the anhydrous fat results in Table 17. The fact that the concentration in
whole milk (Table 20) was unaffected by β-CD implies that a complex between fatty
acid and CD would be extracted by the solvents used in the copper salt method. In
other words, all free fatty acids, trapped or otherwise, would be measured, as seem
likely from the solvating power of chlorinated solvents reported by Reineccius et al.
[51]. At Day 19 in the same experiment there was an indication that values were higher
where β-CD was used. However, the results in the 25-day experiment and the lipase
experiments (both in Table 20) provided no convincing evidence that β-CD partitioned
free fatty acids into the aqueous phase.
Other results in Table 20 generally confirmed that β-CD did not make fatty acids
unavailable for copper salt estimation. Thus, in whole goat milk used for sensory
experiments, addition of CDs made no obvious difference to mean free fatty acid
concentration.
On the one occasion where the CD-dependent centrifugation deposit (Section 5.4.2) was
tested by the copper salt method, the free fatty acid values obtained were no different
from that of surrounding skim milk (data not shown).
While the results with the copper salt method did not show the expected partitioning
effect with CDs, the utility of added lipases was revealed by the method, as shown next.
5.7 Monitoring of lipase activity by the copper salt method
Experiments reported in Chapter 3 showed that added lipase was effective in generating
free fatty acids as detected by panellists. To be sure that lipolysis was occurring, the
copper salt method was used to monitor changes, as shown in two experiments (lipase
concentration, temperature) reported here. Also, a third experiment reported here
revealed that chilled, standard homogenized cow milk was much more susceptible to
lipase than thawed goat milk.
5.7.1 Methods and results
Lipase (100 mg, 7240 Sigma activity units) was dispersed in 10 ml of water. Aliquots
were added to standard homogenized cow milk to yield 724, 3620 and 14480 Sigma
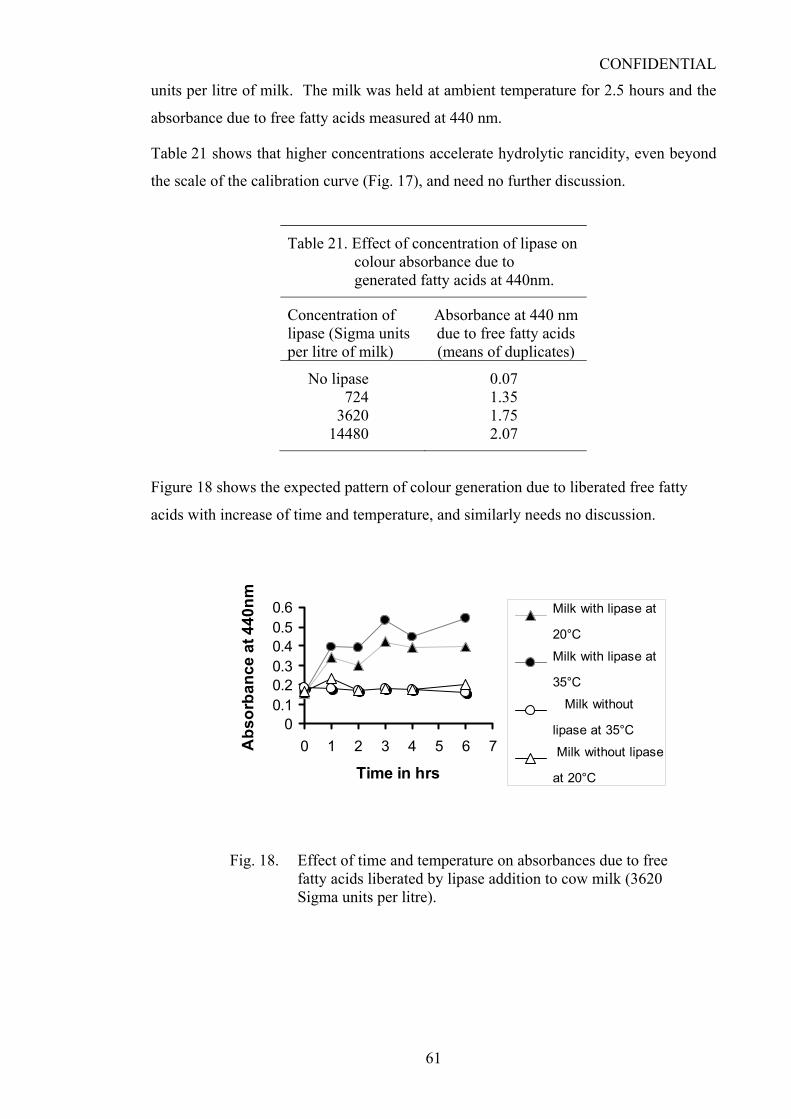
CONFIDENTIAL
61
units per litre of milk. The milk was held at ambient temperature for 2.5 hours and the
absorbance due to free fatty acids measured at 440 nm.
Table 21 shows that higher concentrations accelerate hydrolytic rancidity, even beyond
the scale of the calibration curve (Fig. 17), and need no further discussion.
Table 21. Effect of concentration of lipase on colour absorbance due to generated fatty acids at 440nm.
Concentration of lipase (Sigma units per litre of milk)
Absorbance at 440 nm due to free fatty acids (means of duplicates)
No lipase 0.07 724 1.35
3620 1.75 14480 2.07
Figure 18 shows the expected pattern of colour generation due to liberated free fatty
acids with increase of time and temperature, and similarly needs no discussion.
00.10.20.30.40.50.6
0 1 2 3 4 5 6 7
Time in hrs
Abs
orba
nce
at 4
40nm Milk with lipase at
20°C
Milk with lipase at
35°C
Milk without
lipase at 35°C
Milk without lipase
at 20°C
Fig. 18. Effect of time and temperature on absorbances due to free
fatty acids liberated by lipase addition to cow milk (3620 Sigma units per litre).

CONFIDENTIAL
62
Figure 19 shows that chilled homogenized cow milk was much more susceptible to
added lipase than thawed goat milk. Possible reasons for this are discussed later in this
chapter.
0.31
0.22
0.31
0.22
2.05
0.60
2.06
0.54
0.00
0.50
1.00
1.50
2.00
2.50
Abs
orba
nce
at 4
40 n
m
NoLipase
+0.35%β-CD
No Lipase Noβ-CD
Lipase+0.35%β-CD
Lipase No β-CD
Cow milkGoat milk
Fig. 19. Effect of β-CD and lipase (3620 Sigma units per litre) on absorbances due to generation of fatty acids in goat and cow milk.
5.8 Discussion
Two lines of evidence strongly suggest that free fatty acids in milk are bound by
cyclodextrins. First, the results from sensory trials in citrate buffer, milk and yoghurt
(Chapters 3 and 4) show an overall tendency to suppression of goat milk odour/flavour,
which can occur within 30 minutes of addition. Second, the acid values in anhydrous
fat, which were manipulated by extended storage and lipase addition, were reduced by
β-CD as a representative cyclodextrin. The results were, however, not supported by the
copper salt method in skim milk. A number of factors could be responsible for this.
In an effort to reconcile this conflict it is first necessary to know where free fatty acids
are located in the complex matrix of milk. The acid values in anhydrous fat in Tables 16
to 18 lie between 0.16 and 3.45 % as palmitic acid. Taking an average value of 1.80 %,
this translates to 18 g of palmitic acid per litre of fat, or 0.76 g in the fat of a litre of full
cream milk at 42 g fat per litre. In the corresponding skim milks in Table 20, the
CONFIDENTIAL
63
equivalent average value of palmitic acid (mean of 0.036 and 0.13 mmole.l-1) is 0.083
mmole.l-1 of skim milk or 0.021 g in the skim of a litre of full cream milk.
Whereas the free fatty acids were measured by two different methods in the fat
(titration) and skim (copper salt), the difference is very marked, roughly a 35 fold
preference for solubility of free fatty acids in the fat phase. Tables 16 to 19 show that at
least half the free fatty acids are lost from anhydrous fat due to β-CD addition. If they
are not appearing in the skim milk phase where are they? One possibility is that they are
associated with CD in the cream phase (but still unavailable for sensing) where they
may have been lost in the filtering step on the way to anhydrous fat preparation.
However, this could be wrong because the high temperatures employed here (> 100°C)
could break the host-guest relationship [42]. Likewise, the idea that the chlorinated
solvents used in the copper salt method would be unable to extract free fatty acids from
a CD complex in skim milk seems unlikely. Reineccius et al. [51] showed that
dichloromethane was efficient in extracting vanillin from the CD complex.
Another possibility is that the missing fatty acids were present in the precipitates that
occurred in centrifuged milk where CD had been added. However, when the copper salt
method was applied, the value was much the same as in the corresponding skim milk. It
could not be established what that mass was. One possibility was cholesterol trapped by
CD.
Finally, arguments built around the concept that the skim milk was not truly skim milk
because of poor cream phase recovery after centrifugation, are likely to be
unproductive. The skim milk tested by the copper salt method was sampled from the
bottom of the skim milk phase, specifically to avoid lumps of floating cream.
Still another reason could be that the fatty acids tested by the methods used here, do not
represent the true quantity of free fatty acids, because fatty acids dissolved in water is
not detected by both these methods [59]. However, the copper salt method showed that
the concentration of fatty acids in milk with CD (perhaps trapped by CD and thus
becoming water soluble) was equivalent to the concentration in milk without CD.
Thus the fate of the ‘missing’ free fatty acids remains a mystery. More work would
certainly be helpful to find the facts. One experiment might be to compare the
partitioning of fatty acids milk in milk stored over a period of time where all milks are
compared on the same day and β-CD is added progressively from day 0 and β-CD
added on testing day. An alternative approach might be to design a model system of

CONFIDENTIAL
64
BCFAs in aqueous solution, to which is added 4 % cooking oil (equal to that in milk)
and CDs as required.
Turning now to the miscellaneous results, the graph of comparison of lipase effect on
goat and homogenized cow milk (Fig. 22) indicates that goat milk is less susceptible to
enzyme catalysed lipolysis. It is possible that the reformed membranes of homogenized
milk fat globules cannot resist penetration by lipase.
The chemistry experiments presented in this chapter have not revealed a clear model of
how CDs act in milk to reduce goat milk odour and flavour. However, the results in
Chapters 3 and 4 clearly showed a significant sensory effect when intensity was
measured. It remains to see if consumers like goat milk products more when
cyclodextrins are added. That is the subject of Chapter 6.
CONFIDENTIAL
65
6 Effect of β-CD on liking of goat milk yoghurt
The experiments done so far showed that β-CD was effective in reducing the intensity
goaty flavour from goat milk and yoghurt. It was also important to see if addition of
β-CD increased the liking of goat milk and yoghurt by consumers. Because yoghurt is a
higher value product than milk, and thus better able to carry an extra ingredient cost,
yoghurt was chosen as the test product. Also it was thought that yoghurt would be more
acceptable than milk in a consumer trial.
6.1 Aim of the experiment
The aim of this experiment was to evaluate the effect of β-CD on consumer liking of
goat milk yoghurt. The sensory experiment followed was hedonic, scoring on a scale of
0 to 8. Two yoghurts were prepared, one unflavoured and one flavoured with sugar and
vanilla. Vanilla addition was of particular interest because a small molecule like
vanillin may be able to displace BCFAs from fatty acid-CD complexes, potentially
reducing vanillin flavour but increasing flavour due to BCFAs.
6.2 Development of yoghurts
The method of preparation of plain yoghurts was same as before (Chapter 4), except
that goat milk powder addition was increased from 1 to 3 %. Vanilla was chosen for the
flavoured yoghurt, along with sucrose. Results in Chapter 4 showed that best results
were achieved by adding β-CD before fermentation. All ingredients were added before
fermentation.
CONFIDENTIAL
66
6.3 Preliminary experiment
A preliminary experiment with two panellists testing flavoured cow milk yoghurt as
prepared above, showed that β-CD tended to mask the vanilla flavour. A parallel
experiment with flavoured goat milk yoghurt suggested that the goaty note was less
dominant in the β-CD treatment while at the same time there appeared to be no effect on
vanilla flavour. Hence, the assumption that fatty acids in goat milk may compete better
with β-CD than vanilla flavour in the inclusion processes was certainly not ruled out.
With these preliminary indications in mind the formal experiment was conducted.
6.4 Effect of β-CD on flavour liking scores for plain and flavoured goat milk yoghurts
6.4.1 Design and methods
This experiment was done in the Hub cafeteria area of the AUT campus using mostly
students (59) drawn from wider base than in earlier experiments. The incentive for
taking part was the chance to win $50 cash in a raffle drawn the day of the trial. Two
sensory bays were prepared. At Bay 1, plain goat milk yoghurt was compared with and
without β-CD. At Bay 2, parallel treatments of flavoured goat yoghurt were compared.
Except for three panellists at most, panellists were unaware the yoghurt was derived
from goat milk. Plastic cups (60 ml) were used for tasting, filled to between 15 and 20
ml. Table 22 summarizes the design and results. The full sensory design is shown in
Appendix V. In outline, the panellists scored on a nine point category scale from
‘dislike extremely’ (0) to ‘like extremely’ (8). The order of treatment presentation in
each bay was reversed for each panellist.
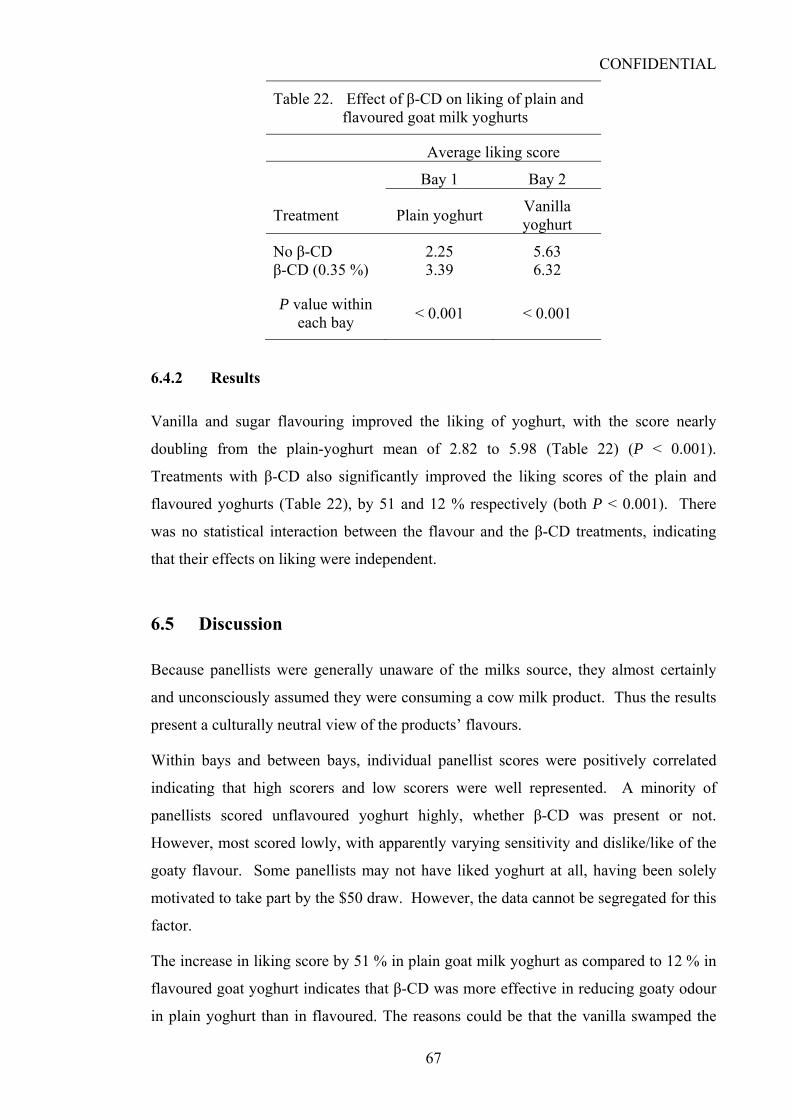
CONFIDENTIAL
67
Table 22. Effect of β-CD on liking of plain and flavoured goat milk yoghurts
Average liking score
Bay 1 Bay 2
Treatment Plain yoghurt Vanilla yoghurt
No β-CD 2.25 5.63 β-CD (0.35 %) 3.39 6.32
P value within each bay < 0.001 < 0.001
6.4.2 Results
Vanilla and sugar flavouring improved the liking of yoghurt, with the score nearly
doubling from the plain-yoghurt mean of 2.82 to 5.98 (Table 22) (P < 0.001).
Treatments with β-CD also significantly improved the liking scores of the plain and
flavoured yoghurts (Table 22), by 51 and 12 % respectively (both P < 0.001). There
was no statistical interaction between the flavour and the β-CD treatments, indicating
that their effects on liking were independent.
6.5 Discussion
Because panellists were generally unaware of the milks source, they almost certainly
and unconsciously assumed they were consuming a cow milk product. Thus the results
present a culturally neutral view of the products’ flavours.
Within bays and between bays, individual panellist scores were positively correlated
indicating that high scorers and low scorers were well represented. A minority of
panellists scored unflavoured yoghurt highly, whether β-CD was present or not.
However, most scored lowly, with apparently varying sensitivity and dislike/like of the
goaty flavour. Some panellists may not have liked yoghurt at all, having been solely
motivated to take part by the $50 draw. However, the data cannot be segregated for this
factor.
The increase in liking score by 51 % in plain goat milk yoghurt as compared to 12 % in
flavoured goat yoghurt indicates that β-CD was more effective in reducing goaty odour
in plain yoghurt than in flavoured. The reasons could be that the vanilla swamped the

CONFIDENTIAL
68
goaty odour. Another explanation lies in the nature of the scoring sheets. The order of
presentation was ‘no-flavour’ followed by ‘flavour’. On average, the former was scored
lowly. When presented with a familiar sweet vanilla flavour, whether with β-CD or not,
the tendency to score highly would be strong. Thus, means for treatments can become
compressed. Nonetheless the absolute difference between β-CD and no β-CD in
flavoured yoghurt was 0.69 in a 0 to 8 scale, still a useful increase in liking.
Inclusion of vanilla along with β-CD prior to fermentation meant that β-CD could bind
free fatty acids, including BCFAs, and/or vanillin. Vanillin does form complexes with
β-CD [51]. While some vanillin may have bound, the simplest explanation is that free
fatty acids are preferentially bound, either by virtue of faster binding or a more
favourable thermodynamic equilibrium (model proposed by O.A. Young).
CONFIDENTIAL
69
7 Conclusion
7.1 Summary of project results and gaps in knowledge
Experiments on the effect of β-CD on skatole odour in cow milk were inconclusive,
possibly for reasons discussed in Chapter 3. However, results were positive in one
respect. β-CD treatments almost always reduced skatole odour intensity, although the
reduction was statistically insignificant.
Turning now to the main topic of β-CD and goat odour/flavour due to free branched
chains fatty acids (BCFAs), experiments with β-CD and 4-methyloctanoic acid (4-MeO)
in citrate buffer indicated that β-CD can complex BCFAs within half an hour of
addition, without any heating. In the range tested, a concentration of 0.32 % β-CD
proved the best effective in reducing 4-MeO odour in buffer at pH 4.8. Experiments
with CDs in goat milk were similarly effective, but here the most effective
concentration was 0.25 % β-CD. β-CD at 0.35 % appeared to generate a stronger odour
for reasons not understood. This requires more work.
In buffers, α-CD proved to be most effective in reducing the 4-MeO odour. This may be
because of a best-fit combination of 4-MeO in the cyclodextrin cavity. The effect was
however, closely followed by β-CD. γ-CD was not effective.
Lipase was used to increase the concentration of free fatty acids in milk. Two
experiments with three equimolar CDs (α-, β- and γ-CD), strongly suggested that α-CD
and β-CD were effective. γ-CD again proved ineffective.
Experiments with yoghurts (Chapter 4) treated with 0.35 % β-CD showed that β-CD
was effective in reducing flavour of goat yoghurt, when added before fermentation but
not just before serving. This implies that steady ‘mopping up’ of BCFAs is more
effective than ‘last minute’ attempts to form complexes.
The chemistry partition experiments (Chapter 5), demonstrated that β-CD reduced the
fatty acid concentration in the fat phase, presumably by making them less lipophilic
through complex formation (CDs are water soluble). However, no equivalent increase

CONFIDENTIAL
70
in free fatty acid concentration in skim milk was demonstrated. The whereabouts of the
‘missing’ fatty acids are discussed in that chapter.
The ‘liking’ experiment (Chapter 6) where plain and flavoured goat yoghurts were
treated with β-CD clearly proved that untrained panellists liked the β-CD-treated more
than the untreated equivalents.
The gaps in knowledge reported above and elsewhere in this thesis, suggest obvious
experiments that could be done to fill these gaps. However, beyond these experiments
are other less obvious ones, some chemically fundamental and some commercially
relevant.
7.2 Future fundamental and commercial experiments
Experiments could be designed to explore the relative affinity of various short chain
fatty acids, including BCFAs, to α-, β- and γ-CD. SPME fibres and a gas
chromatograph could be used to measure the concentration of free fatty acids in the
headspace above model solutions. The work could include a wide range of BCFAs, for
example 4-methylnonanoic acid, known to have particularly goaty notes. The addition
of vanillin with these BCFAs would indicate which molecules bound preferentially with
CDs.
The kinetics of flavour binding by β-CD in goat milk, could be explored in a 5 to 60
minute sensory experiment with trained panellists.
The experiments with mixed CDs would be of important both for direct interaction and
interactions in goat milk and products.
For yoghurt production, the effect of adding CDs at various points of the process and
subsequent storage could be studied by a sensory experiments. The requirement for the
CD effect to be retained on storage is commercially critical.
The effect of β-CD on goat milk and yoghurts are clearly promising. If the effect is
similar with cheeses, there may be an opportunity to extend goat cheese sales to the
non-gourmet market. (The goaty flavour is preferred in gourmet markets.) With the
ripened cheeses, the suppression effect could be more or less obvious depending upon
production of BCFAs. Experiments can be designed to study these effects.
In a commercial environment, some uncontrolled reactions can occur in milk and
products. For example transportation may cause agitation in milk, long storage of

CONFIDENTIAL
71
cheeses and powders at higher than desirable temperatures may encourage microbial
growth. It will be important see if the β-CD effect can tolerate all these factors through
to consumption.
7.3 Consumer perceptions of cyclodextrins
Under New Zealand and Australian food regulations, ingredients have to be declared on
foods for sale. The points of concern however will be as to how to get benefit from this
commercial opportunity, because the notion of CD addition may leave a negative effect
on consumer. Even after GRAS status is achieved, as seems inevitable, if the edible
chemical is shown by its original name, it may induce a negative psychological
response in ‘chemophobic’ people. If, on the other hand, the same chemical were
simply named ‘carbohydrate’ – an accurate name, it would very slightly increase the
declared carbohydrate content and be of no concern.
7.4 Concluding remarks
The research topic was to explore the effects of CDs on goat milk flavour. The study
was done by sensory evaluations and associated chemistry experiments. It established
that β-CD and α-CD can reduce the perception of goaty note in goat milk and goat
yoghurt. β-CD at least can increase consumer acceptance level goat yoghurt, flavoured
or unflavoured. As β-CD is by far the cheapest CD, its use in commercial applications is
indicated.
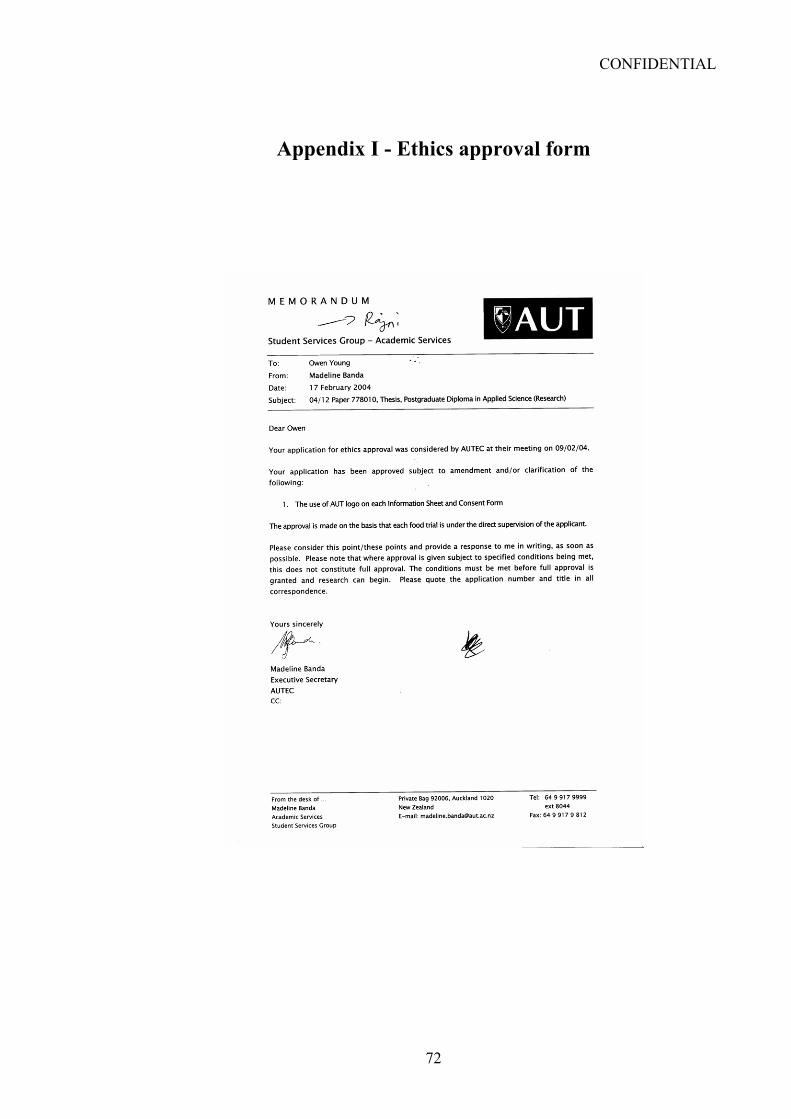
CONFIDENTIAL
72
Appendix I - Ethics approval form

CONFIDENTIAL
73
Appendix II - Typical questionnaire used in milk and buffer sensory experiments
Name: Sex: 4 March 2004 Approximate time I started: At Bays 1 and 2, please sort the 4 glasses of milk into ascending order of odour intensity. Swirl each glass as you would with wine then sniff. Right down your order in the 4 spaces below. If the correct order is not obvious to you, just give your best guess. You are encouraged to clear your sense of smell as required by sniffing the glass of water provided. Bay 1
Low odour High odour
Bay 2
Low odour High odour
Thank you very much. Help yourself to some chocolate
Write the code numbers here
Write the code numbers here
CONFIDENTIAL
74
Appendix III - Design of yoghurt flavour sensory 7.5 Preparation of samples and design for second (difference by
taste) yoghurt sensory
The following treatments were prepared from yoghurts as described in Chapter 4.
A No β-CD in fermented goat milk yoghurt
B β-CD (0.35 %) added before heating and fermentation of goat milk yoghurt
C β-CD (0.35 %) added after fermentation and cooling of goat milk yoghurt
For B, β-CD was added before heating milk to 48°C and for A and C, no β-CD was
added; after fermentation and cooling, half the yoghurt was treated with β-CD 30
minutes before the sensory trial began (C). β-CD was added and mixed in with a stirring
rod. A was left untreated.
The 18 panellists appeared in three groups of six people to make the trial manageable.
For each group a given panellist was presented with three trays representing the three
tests: A compared with B, A with C, and B with C.
The treatments were provided in 60 ml portion cups with a sample size between 15 and
20 ml. Because panellists (unknowingly) tasted yoghurts more than once, two three-
digit codes were used for each treatment. This meant that each panellist saw six
different numbers, thus avoiding inferences from a prior taste.
A was distributed to 18 cups marked as 617 (to be presented with 724 for B) and in 18
cups marked as 196(to be presented with 379 for C). So A will be compared with B and
C but under different labels.
Similarly B was distributed to 36 cups to be compared as 724 with A (617) and as 582
with C as 483.
In a similar way C was transferred to 36 cups(379 and 483) to be compared with A(196)
and B(582).
Fifty four trays were marked in groups of nine as X1, X2, Y1, Y2, Z1 and Z2.
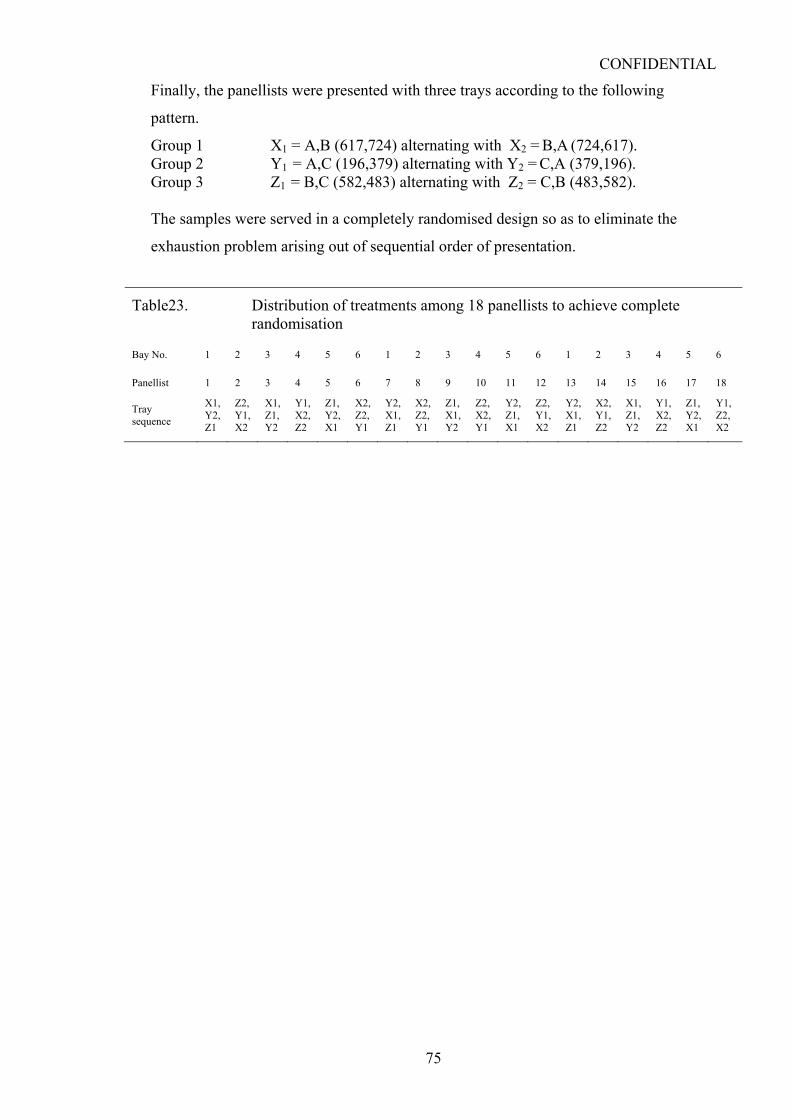
CONFIDENTIAL
75
Finally, the panellists were presented with three trays according to the following
pattern.
Group 1 X1 = A,B (617,724) alternating with X2 = B,A (724,617). Group 2 Y1 = A,C (196,379) alternating with Y2 = C,A (379,196). Group 3 Z1 = B,C (582,483) alternating with Z2 = C,B (483,582). The samples were served in a completely randomised design so as to eliminate the
exhaustion problem arising out of sequential order of presentation.
Table23. Distribution of treatments among 18 panellists to achieve complete randomisation
Bay No. 1 2 3 4 5 6 1 2 3 4 5 6 1 2 3 4 5 6
Panellist 1 2 3 4 5 6 7 8 9 10 11 12 13 14 15 16 17 18
Tray sequence
X1, Y2, Z1
Z2, Y1, X2
X1, Z1, Y2
Y1, X2, Z2
Z1, Y2, X1
X2, Z2, Y1
Y2, X1, Z1
X2, Z2, Y1
Z1, X1, Y2
Z2, X2, Y1
Y2, Z1, X1
Z2, Y1, X2
Y2, X1, Z1
X2, Y1, Z2
X1, Z1, Y2
Y1, X2, Z2
Z1, Y2, X1
Y1, Z2,X2

CONFIDENTIAL
76
Appendix IV - Questionnaire for yoghurt flavour sensory experiment
Name : Your Bay Number : Gender : Please be seated at your allotted Bay Number.
There are three sets of plates (variously coded with Xs, Ys and Zs). Each plate has two samples of pasteurised yoghurt identified by a three-digit number.
Starting with the leftmost plate, taste the two yoghurts (again from left to right), rinsing with water between yoghurts. You can taste them as many times as you like but try to clean your mouth with water between tastes.
If you are not sure of your decision, just give it your best bet. “The yoghurt with the more intense goaty flavour is”:
First plate code More intense yoghurt number
Thank you very much for your valuable help. Direct yourself to the Rewarding Bay, Chocolate Peanuts.
Second plate code More intense yoghurt number
Third plate code More intense yoghurt number

CONFIDENTIAL
77
Appendix V - Design of liking experiment (hedonic sensory)
Given name Gender Age Email address or phone number (so we can contact you if you win the $50 prize!) Table 1 How much do you like these two yoghurts? Tick the box that best describes what you think Like extremely
Like a lot
Like moderately Like slightly Neither like nor dislike Dislike slightly Dislike moderately Dislike a lot Dislike extremely Any comments?
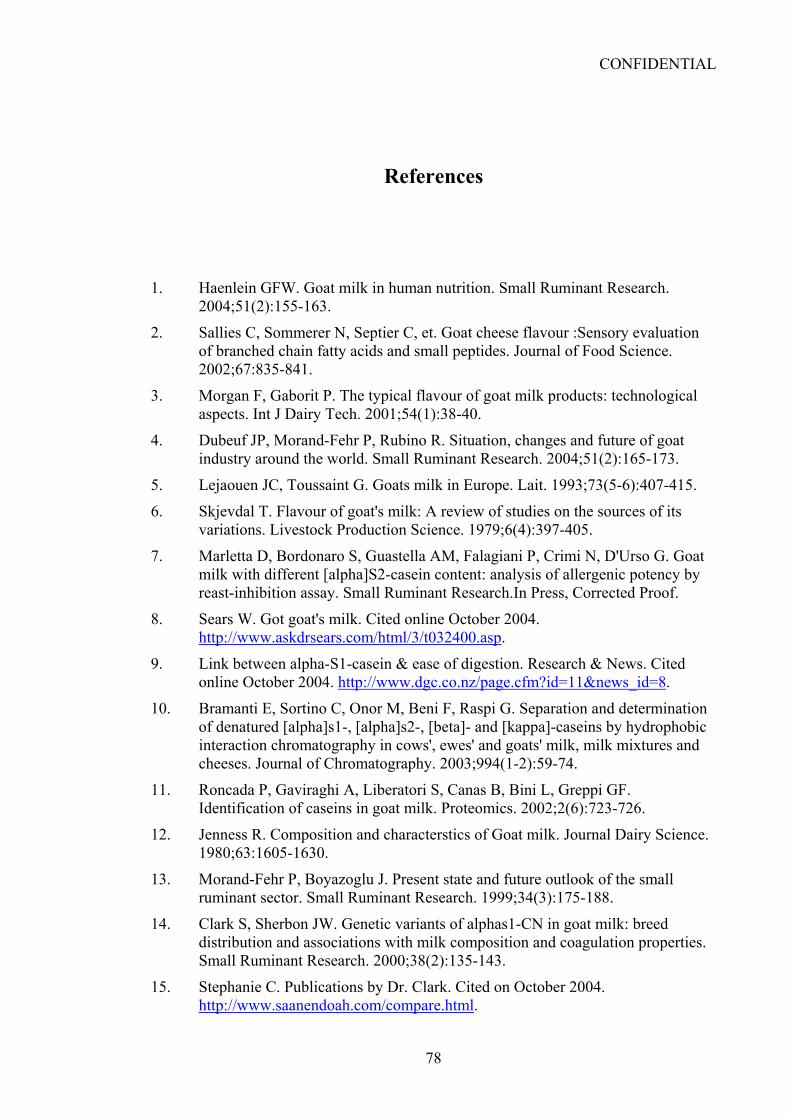
CONFIDENTIAL
78
References
1. Haenlein GFW. Goat milk in human nutrition. Small Ruminant Research. 2004;51(2):155-163.
2. Sallies C, Sommerer N, Septier C, et. Goat cheese flavour :Sensory evaluation of branched chain fatty acids and small peptides. Journal of Food Science. 2002;67:835-841.
3. Morgan F, Gaborit P. The typical flavour of goat milk products: technological aspects. Int J Dairy Tech. 2001;54(1):38-40.
4. Dubeuf JP, Morand-Fehr P, Rubino R. Situation, changes and future of goat industry around the world. Small Ruminant Research. 2004;51(2):165-173.
5. Lejaouen JC, Toussaint G. Goats milk in Europe. Lait. 1993;73(5-6):407-415.
6. Skjevdal T. Flavour of goat's milk: A review of studies on the sources of its variations. Livestock Production Science. 1979;6(4):397-405.
7. Marletta D, Bordonaro S, Guastella AM, Falagiani P, Crimi N, D'Urso G. Goat milk with different [alpha]S2-casein content: analysis of allergenic potency by reast-inhibition assay. Small Ruminant Research.In Press, Corrected Proof.
8. Sears W. Got goat's milk. Cited online October 2004. http://www.askdrsears.com/html/3/t032400.asp.
9. Link between alpha-S1-casein & ease of digestion. Research & News. Cited online October 2004. http://www.dgc.co.nz/page.cfm?id=11&news_id=8.
10. Bramanti E, Sortino C, Onor M, Beni F, Raspi G. Separation and determination of denatured [alpha]s1-, [alpha]s2-, [beta]- and [kappa]-caseins by hydrophobic interaction chromatography in cows', ewes' and goats' milk, milk mixtures and cheeses. Journal of Chromatography. 2003;994(1-2):59-74.
11. Roncada P, Gaviraghi A, Liberatori S, Canas B, Bini L, Greppi GF. Identification of caseins in goat milk. Proteomics. 2002;2(6):723-726.
12. Jenness R. Composition and characterstics of Goat milk. Journal Dairy Science. 1980;63:1605-1630.
13. Morand-Fehr P, Boyazoglu J. Present state and future outlook of the small ruminant sector. Small Ruminant Research. 1999;34(3):175-188.
14. Clark S, Sherbon JW. Genetic variants of alphas1-CN in goat milk: breed distribution and associations with milk composition and coagulation properties. Small Ruminant Research. 2000;38(2):135-143.
15. Stephanie C. Publications by Dr. Clark. Cited on October 2004. http://www.saanendoah.com/compare.html.

CONFIDENTIAL
79
16. Moioli B, Pilla F, Tripaldi C. Detection of milk protein genetic polymorphisms in order to improve dairy traits in sheep and goats: a review. Small Ruminant Research. 1998;27(3):185-195.
17. Laugesen M, Elliott R. Ischaemic heart disease, Type 1 diabetes, and cow milk A1 ß-casein. Journal of the New Zealand Medical Association. 2003; 116(1168).
18. Scoop. Two medical journal reports on A-1 and A-2 milk. Cited online October 2004. http://www.scoop.co.nz/mason/stories/SC0301/S00022.htm.
19. Domagala J. Taurine as a valuable component of goat milk. Medycyna Weterynaryjna. 2003;59(7):571-574.
20. Attaie R, Richter RL. Size distribution of fat globules in goat milk. Journal of Dairy Science. 2000;83(5):940-944.
21. Haenlein GF, Caccese R, Delaware U, Newark. Goat milk versus cow milk. cited online in October 2003. http://www.inform.umd.edu/edres/topic/agrenv/ndd/goat/goat_milk_versus_cow_milk.html.
22. Michael S, Olaf S, Eberhard B. Blokade of angiotensin signaling improves myocardial function in hypercholestrolemia Independent of changes in Eicosanoid Release. Cardiovascular Drugs and Therapy. 2000;14:317 - 327.
23. Alferez MJM, Barrionuevo M, Aliaga IL, Sanz-Sampelayo MR, Lisbona F, Robles JC, et al. Digestive utilization of goat and cow milk fat in malabsorption syndrome. Journal of Dairy Research. 2001;68(3):451-461.
24. Ha JK, Lindsay RC. Release of volatile branched-chain and other fatty acids from ruminent milk fats by various lipases. Journal of Dairy Science. 1992;76:677-690.
25. White GM. Goat milk yogurt for the Philippines. International food development at the NSAC. http://www.nsac.ns.ca/rgs/research/articles/2001/Posecion.htm.
26. Fox PF, McSweeney PLH. Dairy chemistry and Biochemistry. First edition. 1998. Lactose, Table 2.1. Page 21
27. Antunac N, Havranek JL, Samarzija D. Effect of breed on chemical composition of goat milk. Czech Journal of Animal Science. 2001;46(6):268-274.
28. Carol T. An overview of dairy goat farming. http://www.ontariogoatmilk.org/frames.htm. OGMPA.
29. Antunac N, Samarzija D, Havranek JL, Pavic V, Mioc B. Effects of stage and number of lactation on the chemical composition of goat milk. Czech Journal of Animal Science. 2001;46(12):548-553.
30. Meilgaard M, Civille GV, Carr BT. Sensory evaluation techniques. 3rd edition. 1999.
31. Bille PG, Vovor MN, Goreseb J, Keya EL. Evaluating the feasibility of adding value to goat’s milk by producing yoghurt using low cost technology method for rural Namibia. The journal of food technology in Africa. 2000;5(4).
32. Meier MM, Drunkler AD, Bordignon Luiz TM. The influence of beta - cyclodextrin on goaty flavour. British Food Journal. 2001;103(4):281-290.
33. Belitz HD, Grosch W. Food-Chemistry. 2nd edition. 1992. Pages 273-275
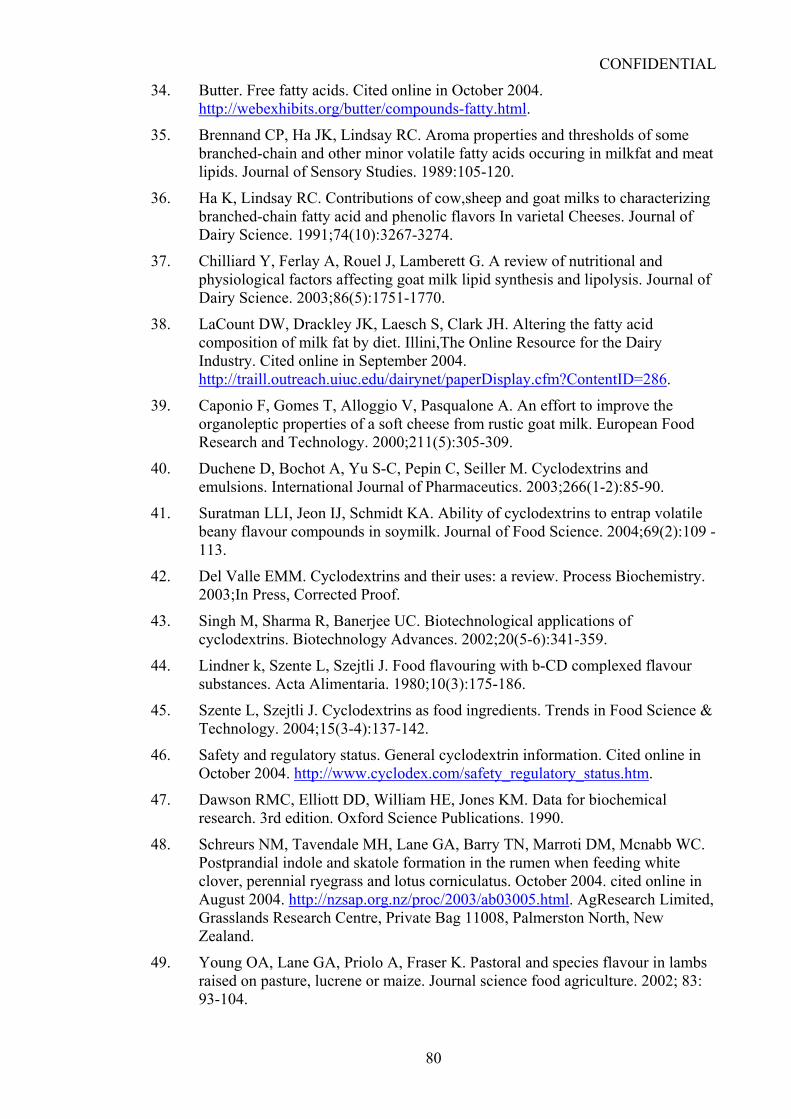
CONFIDENTIAL
80
34. Butter. Free fatty acids. Cited online in October 2004. http://webexhibits.org/butter/compounds-fatty.html.
35. Brennand CP, Ha JK, Lindsay RC. Aroma properties and thresholds of some branched-chain and other minor volatile fatty acids occuring in milkfat and meat lipids. Journal of Sensory Studies. 1989:105-120.
36. Ha K, Lindsay RC. Contributions of cow,sheep and goat milks to characterizing branched-chain fatty acid and phenolic flavors In varietal Cheeses. Journal of Dairy Science. 1991;74(10):3267-3274.
37. Chilliard Y, Ferlay A, Rouel J, Lamberett G. A review of nutritional and physiological factors affecting goat milk lipid synthesis and lipolysis. Journal of Dairy Science. 2003;86(5):1751-1770.
38. LaCount DW, Drackley JK, Laesch S, Clark JH. Altering the fatty acid composition of milk fat by diet. Illini,The Online Resource for the Dairy Industry. Cited online in September 2004. http://traill.outreach.uiuc.edu/dairynet/paperDisplay.cfm?ContentID=286.
39. Caponio F, Gomes T, Alloggio V, Pasqualone A. An effort to improve the organoleptic properties of a soft cheese from rustic goat milk. European Food Research and Technology. 2000;211(5):305-309.
40. Duchene D, Bochot A, Yu S-C, Pepin C, Seiller M. Cyclodextrins and emulsions. International Journal of Pharmaceutics. 2003;266(1-2):85-90.
41. Suratman LLI, Jeon IJ, Schmidt KA. Ability of cyclodextrins to entrap volatile beany flavour compounds in soymilk. Journal of Food Science. 2004;69(2):109 - 113.
42. Del Valle EMM. Cyclodextrins and their uses: a review. Process Biochemistry. 2003;In Press, Corrected Proof.
43. Singh M, Sharma R, Banerjee UC. Biotechnological applications of cyclodextrins. Biotechnology Advances. 2002;20(5-6):341-359.
44. Lindner k, Szente L, Szejtli J. Food flavouring with b-CD complexed flavour substances. Acta Alimentaria. 1980;10(3):175-186.
45. Szente L, Szejtli J. Cyclodextrins as food ingredients. Trends in Food Science & Technology. 2004;15(3-4):137-142.
46. Safety and regulatory status. General cyclodextrin information. Cited online in October 2004. http://www.cyclodex.com/safety_regulatory_status.htm.
47. Dawson RMC, Elliott DD, William HE, Jones KM. Data for biochemical research. 3rd edition. Oxford Science Publications. 1990.
48. Schreurs NM, Tavendale MH, Lane GA, Barry TN, Marroti DM, Mcnabb WC. Postprandial indole and skatole formation in the rumen when feeding white clover, perennial ryegrass and lotus corniculatus. October 2004. cited online in August 2004. http://nzsap.org.nz/proc/2003/ab03005.html. AgResearch Limited, Grasslands Research Centre, Private Bag 11008, Palmerston North, New Zealand.
49. Young OA, Lane GA, Priolo A, Fraser K. Pastoral and species flavour in lambs raised on pasture, lucrene or maize. Journal science food agriculture. 2002; 83: 93-104.

CONFIDENTIAL
81
50. Cyclodextrins for pharmaceutical applicatons. International Speciality Products, a regeisterd trademark of Wacker Chemie GmbH. 2002.
51. Reineccius TA, Reineccuis GA, Peppard TL. Utilization of b-cyclodextrin for improved flavour retention in thermally processed foods. Journal of Food Science. 2004;69:57-63.
52. Lopez-Nicolas MJ, Bru R, Sanchez A, Gracia-carmona F. Use of soluble lipids for biochemical processes: linoleic acid-cyclodextrin inclusion complexes in aqueous solutions. Journal of Biochemistry. 1995;308:151-154.
53. Kohlmann KL, Nielsen SS, Steenson LR, Ladisch MR. Production of proteases by psychrotrophic microorganisms. Journal dairy Science. 1991;74:3275-3283.
54. Cyclodextrins for pharmaceutical applications. 2002.
55. Martin P, Ollivier-Bousquet M, Grosclaude F. Genetic polymorphism of caseins: a tool to investigate casein micelle organization. International Dairy Journal. 1999;9(3-6):163-171.
56. Yoghurt - Manufacturing methods. http://www.foodsci.uoguelph.ca/dairyedu/yogurt.html.
57. Snipe WF, Senyk GF, Fountain KB. Modified Copper Soap Solvent Extraction Method for measuring Free Fatty Acids in milk. Journal dairy Science. 1980;63:193-198.
58. Handbook of dairy food analysis (Indian standard institution). 1st edition., 1981. 94
59. Koops J, Klomp H. Rapid colorimetric determination of free fatty acids (lipolysis) in milk by the copper soap method. Netherland Milk Dairy. 1977;31:56-74.