Èez group – the leader in power markets of … · power markets of central and southeastern...
TRANSCRIPT

ČEZ GROUP – THE LEADER IN POWER MARKETS OF CENTRAL AND
SOUTHEASTERN EUROPEEquity storyJune 2005

1
AGENDA
Profile of ČEZ Group
Introduction
Financial performance
Strategic initiatives of ČEZ Group
Integration and operational excellence
M&A expansion
Plant portfolio renewal
Summary for investors

2
VISION OF THE ČEZ GROUP IS TO BE THE LEADER IN POWER MARKETS IN CENTRAL AND SOUTHEASTERN EUROPE
Our vision: the leader in power markets in the Central and Southeastern Europe
Business focus
Integrated utility focused on power generation, distribution and supplyPresent in related businesses where relevant (coal mining, heat generation)
Priority initiatives
Czech Republic – maintain strong hedged position, achieve operational excellence to be replicated across the groupRenewal of plant portfolioCentral and South Eastern Europe –build strong hedged position through acquisitions and integration
Brand equityCzech champion on the international energy markets

3
Board of ČEZ, a. s.
Trade Generation
NEW MANAGEMENT TEAM IS DETERMINED TO FULFILL THE MISSION
Finance OperationsCEO
Responsibility
Credentials
TradingSales and marketingCustomer servicesMarket rules
Partner in McKinsey & Company responsible for energy sectorCFO in regional power distributor
TreasuryAccountingPlanning/ controllingICT
Top management positions in ČEZ, incl. CEO and CFO
M&AProcurement
CEO of Škoda holding in PlzeňCEO of US-owned Janka Radotin
Conventional generationNuclear generationNew projects
CEO of Škoda Nuclear division
DistributionEquity participationsHRIntegration office
CEO of E-bankaBoard member of Komerční banka
Alan Svoboda Petr Vobořil Martin Roman Radomír LašákJiří Borovec

4
3,760
2,687
1,934
3,916
ČEZ GROUP STEADILY INCREASES PRODUCTION
Annual production of ČEZ GroupTWh
62.161.454.152.250.8
2000 2001 2002 2003 2004
Share in powerproduction inthe Czech RepublicPercent
69 70 71 74 74
ČEZ Group generation capacityMW
Hydro (river accumulation and pump storage)
Lignite off basinand hard coal
Lignite at lignite basins
Nuclear
12,297 Completion of Temelínnuclear power plant 2,000 MW
3%
17%
38%
42%
100% ofgeneration

5
MAJOR INVESTMENT PROGRAM WAS FOCUSED ON EMISSION REDUCTION
Generation structure of ČEZ GroupTWh
0
10
20
30
40
50
60
1993
1994
1995
1996
1997
1998
1999
2000
2001
2002
2003
2004
Nuclear power plants
Coal power plants
Desulphurized coal power plants
Hydro power plants
ČEZ Group emission change 2004/1993
CO - 77%Fly-ash - 95%NOx - 50%SO2 - 92%
ČEZ invested EUR 1.5 billion into
desulphurization of its plants between 1993-
1999
6
Děčín
Plzeň
České Budějovice
Hradec Králové
Brno
Ostrava
Praha
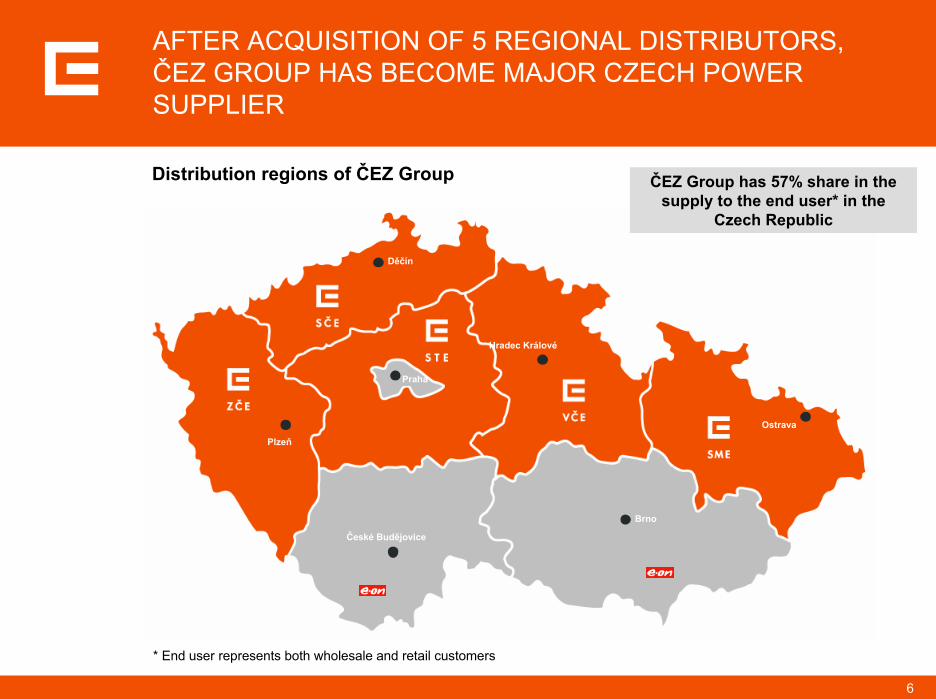
Distribution regions of ČEZ Group ČEZ Group has 57% share in the supply to the end user* in the
Czech Republic
AFTER ACQUISITION OF 5 REGIONAL DISTRIBUTORS, ČEZ GROUP HAS BECOME MAJOR CZECH POWER SUPPLIER
* End user represents both wholesale and retail customers

7
ČEZ Group in Bulgaria*(67% shares in 3 EDCs )Electricity sales (TWh)Number of customers (m)Installed capacity (MW)Number of employeesEBIT (EUR m)EBITDA (EUR m)Sales (EUR m)
7.71.904,9051137376
ČEZ Group in Romania**(51% share in EDC Oltenia) Electricity sales (TWh)Number of customers (m)Installed capacity (MW)Number of employeesEBIT (EUR m)EBITDA (EUR m)Sales (EUR m)
6.81.3603,027-41*-34*340*
ČEZ Group in the Czech Republic*
Electricity sales (TWh)Number of customers (m)Installed capacity (MW)Number of employeesEBIT (EUR m)EBITDA (EUR m)Sales (EUR m)
67.83.4412,29717,8556391,2513,339
* Czech Republic and Bulgaria in accordance with IFRS, in 2004**Romanian Accounting Standards, in 2003
Target markets
Exchange rate CZK/EUR 30
WITH ACQUISITIONS IN BULGARIA AND ROMANIA, ČEZ GROUP CREATED A STRONG FOOTHOLD IN THE SOUTHEASTERN EUROPE

8
AGENDA
Profile of ČEZ Group
Introduction
Financial performance
Strategic initiatives of ČEZ Group
Integration and operational excellence
M&A expansion
Plant portfolio renewal
Summary for investors

9
1.4
1.2
1.6
1.6
1.7
2.2
2.4
2.4
4.5
9.4
ČEZ GROUP IS THE LARGEST CZECH COMPANY
By assets Total assets, EUR billion*
By profitabilityIncome before income taxesEUR million*
Top Czech companies in 2004
Share in the PX 50 Prague stock exchange index Percent as of April 11, 2005
19.5
18.4
16.6
19.6
25.9
ČEZ Group
Erste Bank
Český Telecom
Komerční Banka
Other
ČEZ Group
Český Telecom
Škoda Auto
RWE Transgas
OKD
Agrofert
345
327
275
264
204
174
163
161
141
598ČEZ Group
RWE Transgas
Mittal Steel
Eurotel
T-Mobile
Phillip Morris
Škoda Auto
* Exchange rate CZK/EUR 30
Source: Czech TOP 100
Siemens Group
Unipetrol
Český Telecom
Unipetrol
Lesy ČR
České dráhy
Mittal Steel

10
Market capitalization of ČEZ GroupUSD* billion
Top 10 European power utilities Number of customers in Europe, million
3.4
9.0
11.3
Dec 2003 Dec 2004 Feb 2005
EUR* billion 2.7 6.6 8.5
36.2
29.0
26.0
20.8
11.3
9.6
7.0
6.6
5.8
5.6Electrabel10
EdF1
Enel2
E.ON3
RWE4
Endesa5
Iberdrola6
DEI (PPC)7
Vattenfall9
ČEZ Group8
* 2003: 1.26, 2004: 1.36, 2005: 1.33
ČEZ Group ranks as 446th global company
Czech Republic 3.4Bulgaria 1.9Romania 1.3
Source: Annual reports; Forbes; ČEZ, a. s.
WITH MARKET CAPITALIZATION OF USD 11.3 BILLION ČEZ BELONGS TO TOP 500 BIGGEST GLOBAL COMPANIES AND TOP 10 EUROPEAN POWER UTILITIES

11
37.5
30.2
29.6
27.7
27.7
27.0
25.8
21.4
19.9
17.8
ČEZ GROUP IS ONE OF THE MOST PROFITABLE UTILITIES IN EUROPE
EBITDA margin, 2004Percent
ČEZ Group has generally lower fuel costs and higher depreciation
EdF
Endesa
Vattenfall
Iberdrola
PPC
ENEL
ČEZ Group
Electrabel
RWE
E.ON

12
Analysts‘ expectations(low – high)
EBIT of ČEZ GroupEUR million
722-965672-939619-915546-932446-1,012
489-822
566-663
374 433
2002 2003 2004 2005E 2006E 2007E 2008E 2009E 2010E
639
~833
ČEZ Group expects annual increase by 31%
Source: Patria; UBS; UBM; Raiffeisen; CAIB; BH Securities; ING; Wood & Co.; Merrill Lynch; ČEZ, a.s.
ČEZ GROUP MAINTAINS HIGH DYNAMICS IN PROFIT GROWTH IN LINE WITH ANALYSTS EXPECTATIONS

13
ČEZ STOCK HAS SIGNIFICANTLY OUT-PERFORMED THE CZECH MARKET, EUROPEAN UTILITY MARKET AND MAIN UTILITIES
Prime Utilities Performance Index
RWEE.ON
ČEZ
PX 50
Prices of shares and share indexes *Percent
0%
100%
200%
300%
400%
500%
600%
700%
Jan
1,20
02
Jan
1,20
03
Jan
1,20
04
Jan
1,20
05Ap
r 1, 2
005
Growth Jan 02 - Apr 05Percent
11
14
47
201
446ČEZ
PX 50
PUP index
E.ON
RWE
ČEZ shareprice CZK 406
Source: Analyst reports
* Indexed to 1. 1. 2002
14
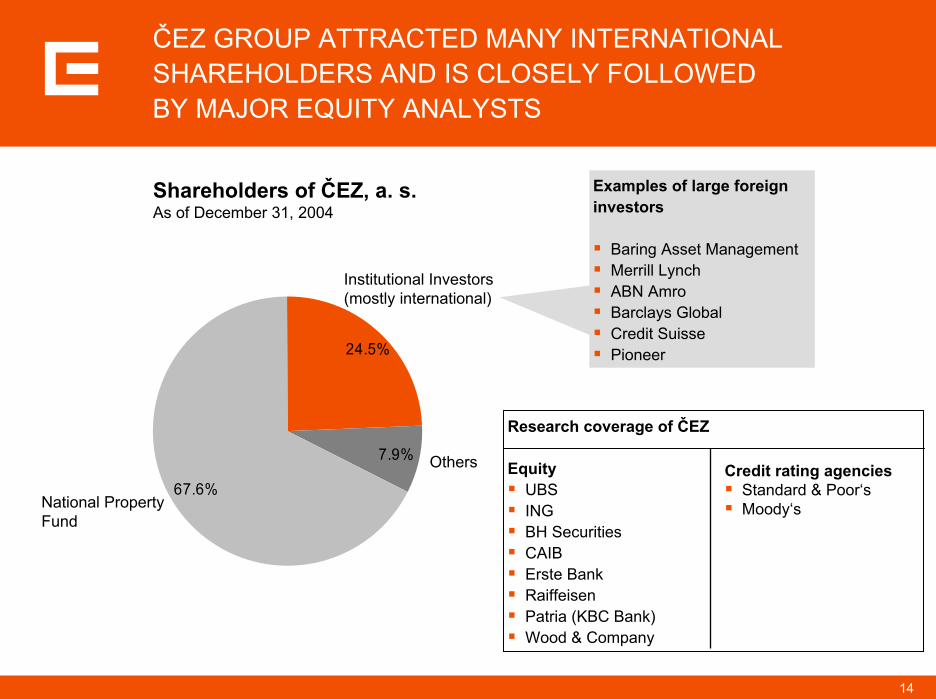
Research coverage of ČEZ
EquityUBSINGBH SecuritiesCAIBErste BankRaiffeisenPatria (KBC Bank)Wood & Company
24.5%
7.9%
67.6%
ČEZ GROUP ATTRACTED MANY INTERNATIONAL SHAREHOLDERS AND IS CLOSELY FOLLOWED BY MAJOR EQUITY ANALYSTS
Others
National Property Fund
Institutional Investors (mostly international)
Shareholders of ČEZ, a. s. As of December 31, 2004
Examples of large foreign investors
Baring Asset ManagementMerrill LynchABN AmroBarclays GlobalCredit SuissePioneer
Credit rating agenciesStandard & Poor‘sMoody‘s

15
330
510 490 515585
510
350 369360
ANALYSTS MAINTAIN POSITIVE VIEW ON ČEZ GROUP PERFORMANCE
Target share price CZK
Recom-mendation
UBM ING BH Securities
Raiffeisen bank
CAIBUBS Erste Bank
Patria Wood & Comp.
12.11.04 24.11.04 10.12.04 20.12.04 16.6.059.3.05 31.3.05 15.4.05
Buy Hold Hold Hold BuyBuy BuyBuy
Not updated Updated
21.3.05
Buy
* June 17, 2005
Expected increase of 23%
Current share price CZK 477*
Source: Analyst reports

16
ČEZ FINANCES ARE UNDER CLOSE SCRUTINY OF RATING AGENCIES AND BOND INVESTORS
Placement
ČEZ bonds
Year
19931994
19951996
19971999
20032004
AmountMillion
2,1004,000
1504,0003,0003,000
2004,5002,5003,000
2003,000
400
Currency
CZKCZKUSDCZKCZKCZKUSDCZKCZKCZKEURCZKEUR
PrahaPrahaLuxembourg PrahaPrahaPrahaUSAPrahaPrahaPrahaLuxembourg PrahaLuxembourg
Standard & Poor’s
Moody’s
ČEZ
Czech Republic
ČEZ
Czech Republic
Credit rating of ČEZ and Czech Republic
BBB+
A-
Baa1
A1
1996199919992000199920032007200920142004200620082011
Repayment
ČEZ has high credit rating just below the country riskČEZ has been first rated companyin former Eastern Europe
ČEZ has been first and one of the largest corporate bond issuers in former Eastern Europe

17
THE BALANCE SHEET OF ČEZ GROUP IS VERY ROBUSTCZK billion
Total assets
236 227
22 3120 23Current assets
Other non-current assets
Property, plant and equipment
2003 2004
278 281
Total equity and liabilities
278 281
Deferred taxes liability
Long-term liabilities
Equity
Current liabilities
Nuclear reserves
Minority interestsStable low
level of debt allows for
substantial investments in the future
Source: Analyst reports
153 164
3643
2829
3723
16 168 6
2003 2004
18
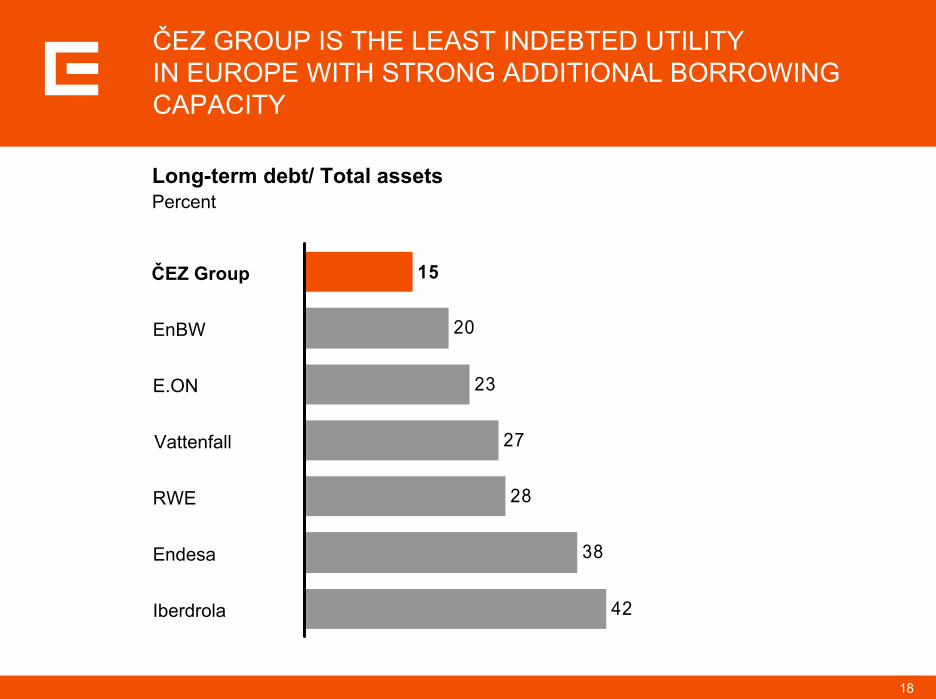
20
23
27
28
38
42
15ČEZ Group
EnBW
E.ON
Vattenfall
RWE
Endesa
Iberdrola
ČEZ GROUP IS THE LEAST INDEBTED UTILITY IN EUROPE WITH STRONG ADDITIONAL BORROWING CAPACITY
Long-term debt/ Total assetsPercent

19
ČEZ GROUP HAS VERY STRONG FREE CASH-FLOW FURTHER STRENGTHENING ITS ABILITY TO FINANCE INTERNATIONAL GROWTH
500
3,000
2,375
1,750
1,125
0
1,000
2,000
3,000
4,000
2005E 2006E 2007E 2008E 2009E
dividend payout increasing by 50% in 5 yearsinvestments into plants and equipment are covered preservation of the low rate of the long-term indebtedness
Assumptions:
Free cash flow of ČEZ Group (cumulative)EUR million
ČEZ Group can finance foreign acquisitions in the next 3-5 years from free cash flow up to EUR 3,000 million

20
0
5
10
15
20
25
30
35
40
45
50
1993 1994 1995 1996 1997 1998 1999 2000 2001 2002 2003 2004 2005 2006 2007 2008 2009
CZK
bill
ion
Nuclear fuel andprovis ions
Capitalized interest
Czech RDCinvestm ents
Fore ign RDCinvestm ents
Other ČEZ, a. s .investm ents
Plant installation/renew al
Net cash provided byoperating activities
Investment into property, plant and
equipment
ČEZ GROUP GENERATES LARGE OPERATING CASH-FLOW IN EXCESS OF INVESTMENT NEEDS
2005:CZK 2.4 bn – nuclear fuel and provisionsCZK 1.2 bn – capitalized interestCZK 5.3 bn – domestic distribution companiesCZK 2.0 bn – Romanian and Bulgarian distribution
companiesCZK 5.6 bn – nuclear power plants (CZK 3.3 bn)
other (CZK 2.3 bn)CZK 0.9 bn – coal power plants

21
SUMMARY OF ČEZ GROUP PROFILE
ČEZ Group is the largest Czech corporationWith February 2005 market capitalization of USD 11.3 billion ČEZ belonged to top 500 biggest global companies and top 10 European power utilitiesČEZ Group is one of the most profitable utilities in Europe with strong profitability growthČEZ is the best performing utility stock in Europe with growth at >200% of January 2004 levelČEZ Group attracted many international shareholders and is closely followed by major equity brokersČEZ finances are under close scrutiny of rating agencies and bond investorsČEZ Group is the least indebted utility in Europe with strong additional borrowing capacityČEZ Group has very strong free cash-flow further strengthening its ability to finance international growth

22
AGENDA
Profile of ČEZ Group
Introduction
Financial performance
Strategic initiatives of ČEZ Group
Integration and operational excellence
M&A expansion
Plant portfolio renewal
Summary for investors

23
Vision and corporate targets
Plant portfolio renewal
(2007-20)
M&A expansion
(2004-10)
Integration and
operational excellence
(2004-8)
Performance-oriented culture
ČEZ GROUP HAS LAUNCHED FOUR KEY STRATEGIC INITIATIVES

24
Value creation is the top priority
Enforcing individual responsibility for reaching ambitious goals/results
Building ties and shared values within the Group
Creation of international organization
Enforcing integrity
Development of human potential
Acceptance of continuous change
PERFORMANCE ORIENTED CULTURE IS A PRECONDITION FOR ALL OTHER INITIATIVES

25
AGENDA
Profile of ČEZ Group
Introduction
Financial performance
Strategic initiatives of ČEZ Group
Integration and operational excellence
M&A expansion
Plant portfolio renewal
Summary for investors

26
WITHIN PROJECT VISION 2008 ČEZ GROUP WILL REORGANIZE ITSELF INTO A TRANSPARENT HOLDING STRUCTURE
ČEZ, a.s.Production
- Nuclear- Conventional
Sales and trading
DomesticAffiliates*
Distributor 1
Affiliates*
Distributor 2
Affiliates*
Distributor 5
Affiliates*
Foreign Affiliates*
ČEZ, a.s.Production
- Nuclear- Conventional
Trading
DomesticAffiliates
ČEZ Prodej, s.r.o.Sales
ČEZ Distribuce, a.s. Distribution
Foreign Affiliates
Estimated annual EBITDA positive contribution
CZK 2 bn
* At the end of 2004 CEZ group included 97 affiliates compared to just 22 in 2002
Main objectives
Restructure ČEZ Group into integrated, functionally driven organization
Implement all synergies and operational improvements
Meet all requirements of unbundling
Improve margins, minimize risks
Develop “Business excellence” to be replicated in foreign subsidiaries
Project VISION 2008

27
Generation Trading Supply Distribution Group level
Positive Low and stable cost of ligniteHigher utilization of nuclear and coal plantsCost savings in maintenance and overhaulBiomass fuel
Convergence of price to GermanGrowing German pricesGrowing local consumptionHigher share of system servicesAdditional trading opportunities
Stable market shareNo churn in mass marketIncreased supply marginsLower marketing, sales and service costsHigher quality of service
Centralization of corporate functionsDivestment of non-core assets/ activities
Higher WACC and eligible costsRevaluation of asset baseFull recognition of unbundling investmentsHigh cost savings due to centralization
STRONG PROFITABILITY GROWTH IS DRIVEN BY MULTIPLE FACTORS ACROSS THE VALUE CHAIN

28
ADDITIONAL 8.7 TWh CAN BE GENERATED BY INCREASING UTILIZATION OF NUCLEAR AND COAL PLANTS
Lignite (at mine)
Lignite (other)
Nuclear
Time utilization of generation capacityPercent of hours p.a.
Higher sales opportunity due to improved utilization –potential of additional 8.7 TWh sales (14% of ČEZ generation volume). Could be limited by volume of available CO2allowances.
77
69
50
3
11
6
3
12
13
23
20
16
16
1229Hard coal
100 %
100 %
90 %
70 %
1 current utilization2 auxiliary services3 reserve for higher utilization4 overhauls, outages
1 3 42
10 20 30 6040 50 70 80 90 100

29
400
~500
1,540
GOING FORWARD, ČEZ GROUP WILL BENEFIT FROM FAST GROWING DEMAND AND FORCED SHUT DOWN OF OLD PLANTS
Centrel
Power consumption in the Czech RepublicTWh
220 218 230
Estimated capacity reduction in Central Europe by 2010Installed capacity, MW
Increased shortage of power in the regionLower pressure on export profiles to Germany/AustriaPrice convergence to one level across Central Europe
Slovakia
Poland
Hungary
Czech Republic
1,000-2,000
52
54
56
58
60
62
64
200020012002200320042005E2006E2007E2008E2009E2010E
1.5%
248240234
Source: Europrog, ERÚ, ČEZ, a. s.
+2.9%
+2.0%
+2.9% -0.2%
I.Q 2005+1.5%
environmental impactnuclear safety
environmental impact
economic ageingenvironmental impact

30
ČEZ GROUP IS SECOND LARGEST EXPORTER OF POWER IN EUROPE, PROVIDING POWER TO CENTRAL EUROPEAN COUNTRIES
Net exports in 2004TWh
Structure of ČEZ exports in 2004
France
ČR
Poland
Germany
Slovakia
Germany60%
Poland 3%
Slovakia 30%Austria
7%
1.9
8.1
10.3
15.7*
64.5
* ČEZ Group exported 16.7 TWh
Diversification of target export markets from initial focus on Germany

31
38.034.5?
DOMESTIC AND EXPORT PRICES ARE CONVERGING TO INTERNATIONAL LEVELSEUR/MWh*
Domestic annual baseload wholesale prices
Price changePercent
Net export prices
Price changePercent
* Exchange rate CZK/EUR 30
2002 2003 2004 2005 2006 forward prices
1.5% 9.1% 11.3%
2002 2003 2004 2005 2006 forward prices
15.2% 17.0% 8.8% ?
35 38
German wholesale price
?
Transmission capacity fee
2.6 2.7 4.2 6.521.7 24.7 29.9
24.5 24.8 27.1 ?30.2
19.1 22.0 25.7 28.0 ?Export prices
5.8
5.9
6.5
7.9
8.2
8.4
8.4
8.9
8.9
9.8
6.8
12.8
14.1
9.1
0 5 10 15
Estonia
Malta
Poland
Czech Republic
Finland
United Kingdom
Sweden
Hungary
Spain
Cyprus
France
Austria
Germany
Italy
Average electricity pricesfor households
EUR cent/kWh, VAT excl.
Source: EUROSTAT

32
30.2
WHOLESALE PRICES OFFERED BY ČEZ ARE THE LOWEST IN THE REGION . . .
+10%+15%
+18% +18% +22%
+72%
Export markets Import markets
ČR Slovakia Poland Germany Austria Hungary Italy
Germany
Poland
Slovakia
AustriaHungary
Wholesale power price2005, baseload, EUR/MWh
has been a result of influence of higher German prices and potential cheaper imports from Poland and Slovakia
may be changed by establishing of the market with emission allowances (acceptable by Czech industry and residents)
Existing approach how to set up level of electricity prices

33
ČEZ GROUP INCREASED SALES MARGIN WHILE MAINTAINING MARKET SHARE
Děčín
Plzeň
České Budějovice
Hradec Králové
Brno
Ostrava
Praha
Distribution regions of ČEZ Group
2004
2%
6%
2005
Market share in power retailPercent of MWh
2004
61% 61%
2005
Average net marginPercent

34
Preparation by ČEZ Group
Central call center is operated 24/7Network of customer service centers in major citiesNew products and servicesNew customer information system (SAP ISU)New marketing approach
Distribution(REAS)
Transmission,system dispatching,
ancillary servicesprocurement (ČEPS)
Market regulator (Energy Regulatory Office, ERÚ)Provides for equal conditions for all market participants,
sets prices for transmission, distribution, system services and for supply to protected customers
ČEZ
Othergenerators
Import
Electricitytraders
Market Operatorsettles deviations of
contracted amounts and real consumption or
generation
Protected customers
(households)Only until
December 12, 2005
Eligible customers
Suppliers Customers
Fully competitive environment
Choice of supplier
ČEZ GROUP IS READY TO OPERATE IN FULLY LIBERALIZED END-USER MARKET

35
REGULATORY ENVIRONMENT IN THE CZECH REPUBLIC IS FAIR AND TRANSPARENT
Prepare team 1st regulatory period 2nd regulatory period
Czech energy regulator establishedIntroduction of TPA to gridsSeparate reporting for retail and distributionRegulated tariff split into transmission, distribution, systems services and power price
Regulation parameters reassessed for distribution* (WACC, RAB, allowed costs, …)Average revenue cap of ČEZ Group distribution up by ~20%Coverage of unbundling costs EUR 10-20 mil agreedRevaluation of asset base up potentially by ~ 90%
<2002 2002-04 2005-09
Introduction of RPI-X regulationStarting values of regulation parameters defined
PV revenue capOC operating costsPPI producer price indexX efficiency factor (instrument for decrease of costs)D depreciationRAB operating assets (regulatory assets base)WACC weighted average capital costs
*PV = OC*(PPI - X) + D*PPI + RAB*WACC

36
SUMMARY OF PROFIT IMPROVEMENT AND BUSINESS GROWTH INITIATIVES
ČEZ Group has launched multiple initiatives focused on improvement of the existing businesses
Project Vision 2008 aims at restructuring of the entire group and will lead to major operational improvement
Additional profit growth is driven by multiple initiatives across the value chain:
In generation, ČEZ Group has developed a balanced, cost competitive and environment friendly plant portfolio; it has potential for further production increase
In trading, ČEZ Group benefits from increasing wholesale power price, increases its domestic wholesale market share and enjoys position of 2nd biggest European exporter
ČEZ distribution is managed within transparent and fair regulatory environment
In retail, ČEZ Group operates stable and increasingly profitable retail business while offering affordable prices

37
AGENDA
Profile of ČEZ Group
Introduction
Financial performance
Strategic initiatives of ČEZ Group
Integration and operational excellence
M&A expansion
Plant portfolio renewal
Summary for investors

38
3,760
6,603
1,934
~ 20,000
3.4
1.3
1.9
~10.0
ČEZ GROUP WANTS TO GROW BOTH IN GENERATION AND DISTRIBUTION/SUPPLY
Ambition for target generation growth MW of installed capacity
Ambition for distribution/supply growthMillions of customers
6.6
ČEZ Group
6th European player
Czech Republic
Bulgaria
Romania
ČEZ Group
8-9th European player
Nuclear
Coal
Hydro
Current ranking 8th 10th
12,297

39
Intimate knowledge of the region
Very well accepted, successful but “local” investor due to close cultural/historical ties
First-hand experience with transformation of power markets
Natural hedge to current position of ČEZ Group providing significant synergies/risk mitigation
Significant portion of the assets still in state hands, many privatization processes initiated
Limited interest of other players in target region of ČEZ Group
Higher financial leverage of other players
ČEZ GROUP IS BEST POSITIONED TO SUCCEED IN THE REGION OF CENTRAL AND SOUTHEASTERN EUROPE
40
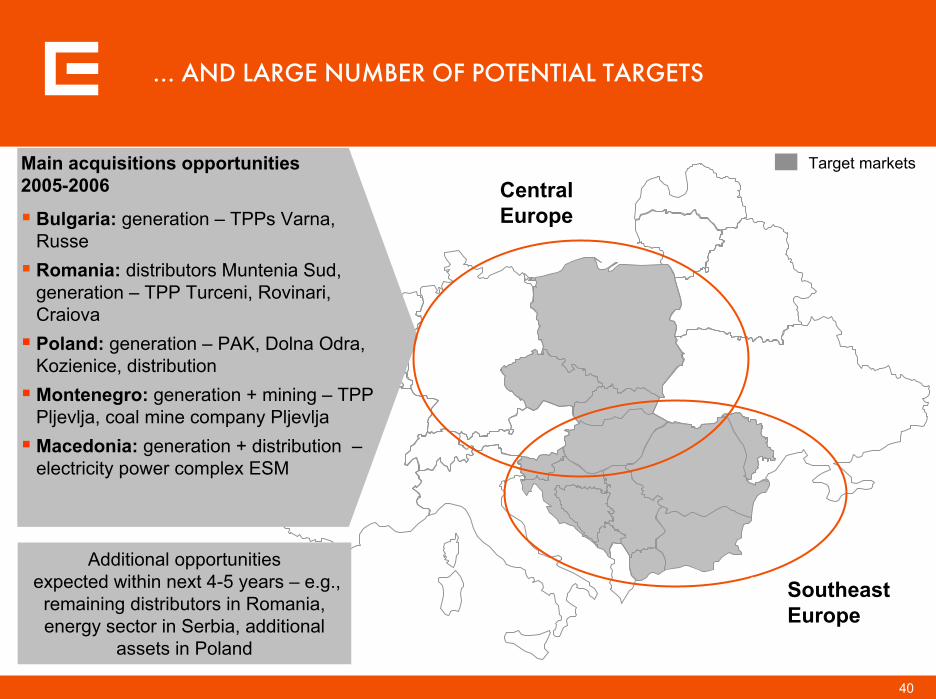
Central Europe
Southeast Europe
… AND LARGE NUMBER OF POTENTIAL TARGETS
Additional opportunitiesexpected within next 4-5 years – e.g., remaining distributors in Romania, energy sector in Serbia, additional
assets in Poland
Target marketsMain acquisitions opportunities 2005-2006
Bulgaria: generation – TPPs Varna, RusseRomania: distributors Muntenia Sud, generation – TPP Turceni, Rovinari, CraiovaPoland: generation – PAK, Dolna Odra, Kozienice, distributionMontenegro: generation + mining – TPP Pljevlja, coal mine company PljevljaMacedonia: generation + distribution –electricity power complex ESM

41
EVEN THOUGH ČEZ GROUP HAS AMBITIOUS EXPANSION PLANS, WE ARE VERY PRUDENT IN OUR M&A DECISIONS
Key criteria for M&A decisions
Target attractive on standalone basis (market position, asset quality)
Synergies with ČEZ Group (welcomed but not taken into valuation)
Return above cost of capital (without future synergies)
Credit rating targeting
Positive contribution to ČEZ Group value

42
CZ
RO
BG
CZ
RO
BG
ČEZ ALREADY STARTED INTEGRATION OF DISTRIBUTORS IN BULGARIA AND ROMANIA
Romania51% shares in EDC Oltenia owned by ČEZ, a. s.
StatusČEZ Group selected in tenderSPA signedManagement team ready to go
Bulgaria67% shares in 3 EDCs are owned by ČEZ, a .s.
StatusManagement team on site with full controlTakeover on January 18, 2005SPA signed money and shares transferred
43
AGENDA
Profile of ČEZ Group
Introduction
Financial performance
Strategic initiatives of ČEZ Group
Integration and operational excellence
M&A expansion
Plant portfolio renewal
Summary for investors

44
0
100
200
300
400
500
600
700
800
1993 1994 1995 1996 1997 1998 1999 2000 2001 2002 2003 2004
Emissions of CO, Fly-ash, NOx , SO2 and CO2
k to
ns
Desulphurization has 15 year cycle
Next stage of reconstruction is expected
in horizon of 10 years
Main investments proceeded in
1996-1998
ČEZ‘S COAL-FIRED POWER PLANTS EMISSIONS
m to
ns C
O2
32.6
37.0 37.335.1 35.6 35.1
20
25
30
35
40
1999 2000 2001 2002 2003 2004
Index 2004 / 1993CO 23%
Fly-ash 5%
NOX 50%
SO2 8%

45
Age structure of ČEZ thermal blocks MW
Age, years
2 800Substantial portion of ČEZ thermal capacity approaches end of its life time
Additionally, the emission limits on SOx, NOx will get much stricter starting 2016
As a result part of the existing capacity will need to be decommissioned
655
1,550 1,512
0
500
1000
1500
2000
2500
10 - 15 25 - 30 30 - 35 35 - 40
2,800
HOWEVER, LARGE PORTION OF ČEZ POWER PLANTS WILL BE AT THE END OF THEIR LIFETIME

46
Coal Nuclear Gas
Environ-mental impact
Competitive advantages
Risks/ constraints
Acceptable emissions if well designed/managed
Low cost of domestic lignite
Lignite availabilityCO2 regulation/price
Cornerstone of the future ČEZ plant fleet
No emissionsNuclear risk
Politically acceptable in Czech Republic
High up front investment
Complement to lignite for baseloadgeneration
Low emissions
Flexibility, relatively low investment cost
High/volatile gas price
Potentially source of flexible power
Renewables
Limited/no emissionsNo resources depletion
Public support
Subsidy scheme not clear yet
Complementary role (e.g. combined combustion of coal and biomass)
ČEZ INTENDS TO BUILD ITS FUTURE PLANT FLEET AROUND NEW GENERATION OF LIGNITE PLANTS

47
AGENDA
Profile of ČEZ Group
Introduction
Financial performance
Strategic initiatives of ČEZ Group
Integration and operational excellence
M&A expansion
Plant portfolio renewal
Summary for investors

48
ČEZ GROUP PROVIDE SOME UNIQUE FEATURES FOR EQUITY INVESTORS
Key factors Rationale
Robust balance sheet
Strong financial performance
Growing dividend payout by 50% in 5 years
Dynamic profit growth expected to continue
Management fully focused on financial performance
Standard corporate governance practices
Exposure to attractive regions of 1st and 2nd EU convergence zone
Lowest level of debt among large players
EBITDA margin 37%
41% of net profit and 2.1% yield in 2004
Growing power prices and consumption, efficiency improvements and synergies
Group restructuring, aggressive performance targets
Under scrutiny of institutional investors, financial advisors, credit agencies (S&P, Moody’s)
Central and Southeastern Europe