eei conference november 7-9, 2021
TRANSCRIPT

ESSENTIALEEI CONFERENCENOVEMBER 7-9, 2021

Except for the historical statements contained in this presentation, the matters discussed herein are forward-looking statements that aresubject to certain risks, uncertainties and assumptions. Such forward-looking statements, including the 2021 and 2022 EPS guidance, long-term EPS and dividend growth rate objectives, future sales, future expenses, future tax rates, future operating performance, estimated basecapital expenditures and financing plans, projected capital additions and forecasted annual revenue requirements with respect to rider filings,expected rate increases to customers, expectations and intentions regarding regulatory proceedings, and expected impact on our results ofoperations, financial condition and cash flows of resettlement calculations and credit losses relating to certain energy transactions, as well asassumptions and other statements are intended to be identified in this document by the words “anticipate,” “believe,” “could,” “estimate,”“expect,” “intend,” “may,” “objective,” “outlook,” “plan,” “project,” “possible,” “potential,” “should,” “will,” “would” and similar expressions. Actualresults may vary materially. Forward-looking statements speak only as of the date they are made, and we expressly disclaim any obligationto update any forward-looking information. The following factors, in addition to those discussed in Xcel Energy’s Annual Report on Form 10-Kfor the fiscal year ended Dec. 31, 2020 and subsequent filings with the Securities and Exchange Commission, could cause actual results todiffer materially from management expectations as suggested by such forward-looking information: uncertainty around the impacts andduration of the COVID-19 pandemic; operational safety, including our nuclear generation facilities; successful long-term operational planning;commodity risks associated with energy markets and production; rising energy prices and fuel costs; qualified employee workforce and third-party contractor factors; ability to recover costs, changes in regulation and subsidiaries’ ability to recover costs from customers; reductions inour credit ratings and the cost of maintaining certain contractual relationships; general economic conditions, including inflation rates,monetary fluctuations and their impact on capital expenditures and the ability of Xcel Energy Inc. and its subsidiaries to obtain financing onfavorable terms; availability or cost of capital; our customers’ and counterparties’ ability to pay their debts to us; assumptions and costsrelating to funding our employee benefit plans and health care benefits; our subsidiaries’ ability to make dividend payments; tax laws; effectsof geopolitical events, including war and acts of terrorism; cyber security threats and data security breaches; seasonal weather patterns;changes in environmental laws and regulations; climate change and other weather; natural disasters and resource depletion, includingcompliance with any accompanying legislative and regulatory changes; and costs of potential regulatory penalties.
Paul JohnsonVice President, Treasurer & IR [email protected]
Safe Harbor
ContactsEmily AhachichDirector, Investor Relations [email protected]
Darin NormanSenior Analyst, Investor [email protected]
Website: https://investors.xcelenergy.com/ Xcel Energy app also available

Attractive Investment Thesis
~8-10% Total Shareholder
Return
Pure-Play Regulated Utility that Consistently Delivers
5-7% CAGR ׀ 60-70% Payout Ratio
Sustainable long-term growth Strong ESG leadership Proven track record
2
5-7% EPS Growth
~3% Dividend Yield

Enhance the Customer Experience
Lead the Clean Energy Transition
Keep Bills Low
• Electricity: 80% carbon reduction by 2030, 100% carbon-free by 2050
• Natural gas: 25% GHG reduction by 2030, net-zero by 2050
• Conservation, new products/services• 1.5 million EVs enabled by 2030
Average bill increases < rate of inflation
CO2
VISIONWe will be the preferredand trusted provider of the energy our customers need
MISSIONWe provide our customers the safe, clean, reliable energy services they want and value at a competitive price
VALUES Connected Committed Safe Trustworthy
Strategy, Vision and MissionPRIORITIES
3

4
Robust Base Capital Forecast 2022 - 2026
Investment by CompanyInvestment by Function
Electric Distribution
30%
Electric Generation12%
Renewables6%
Electric Transmission
29%
Natural Gas LDC13%
Other10%
$26Billion
NSPM37%
NSPW10%
SPS15%
$22.5Billion
NSPM39%
PSCo38% NSPW
9%
SPS14%
$26Billion
Base capital forecast excludes potential incremental investment associated with resource plans

5
Potential Incremental Investment 2024 - 2026
$1.5 - $2.5 Billion in Incremental Opportunities
$1.0 - $1.5 Billion Renewables~2,000 MW proposed additions across Colorado and Minnesota resource plans, assuming 50% ownership
$0.5 - $1.0 Billion TransmissionEnables renewables associated with the Colorado resource plan, including network upgrades, voltage support and interconnection work

6
Strong Rate Base Growth
$ Billions
$36.1 $39.2 $41.7 $44.4 $47.3 $49.4
2021 2022 2023 2024 2025 2026
$51.2$48.5
SPS~5%
NSPW~11%
PSCo~7%
NSPM~6%
XEL~6.5%
Op Co Base CAGRs 2021 - 2026
Xcel Energy Consolidated
Op Co CAGRs exclude potential incremental spend
Base 2021 - 2026 CAGR: ~6.5%Incremental 2021 - 2026 CAGR: ~7.3%

7
Robust Capital Forecast 2022 - 2031
Incremental
$0
$10
$20
$30
$40
2022 - 2026 2027 - 2031
Hydrogen & Storage 5%$36 - $40 Billion
Renewables 20%
Electric Transmission & Distribution 50%
Other 25%
$26 Billion Base
Does not include potential incremental investment for PPA buy outs or future wind repowerings
Up to $28.5 Billion
2026 - 2031 Rate Base CAGR Midpoint 6.5%

8
Significant Organic Growth Opportunities
RESOURCE PLANS~10 GW in next decade, assumed 50% ownership
TRANSMISSION BUILDOUTExpansion to enable more renewables in Colorado, MISO and SPP
ELECTRIC VEHICLESCharging infrastructure, programs and grid upgrades
HYDROGENBlending into power generation and natural gas LDC operations
GRID RESILIENCYHardening, automation and capacity for distributed resources and future growth

Transparent Resource Plans
9
80% Carbon Reduction by 2030, Full Coal Exit by 2040
NSPM/NSPW SPS Carbon reduction 85% 85% >70%
Full coal exit 2040 2030 2032
New renewables 3,900 MW 5,800 MW 1,900 MW
Spend horizon 2025 - 2030 2024 - 2034 2025 and beyond
PSCo

Transparent Resource Plans
60651 570
1,093474 374 374
748374
1,000 150
850
3501,300
350
450 500
240
600 1,200
250
400
950
100500
200
400
50
0
500
1000
1500
2000
2500
3000
2024 2025 2026 2027 2028 2029 2030 2031 2032 2033 2034
Natural Gas & Flexible Resources Wind Universal Solar Storage
MW
10
Proposed Additions Across Upper Midwest and Colorado
Excludes 460 MW Sherco solar project in 2024

Long-Term Transmission Buildout
Major Expansion to Enable More Renewables
NSPM PSCoMISO outlook includes up to 50% renewables by 2039
Initial MISO project set ~$30 billion; full plan up to $100 billion
Estimated $5 - $6 billion opportunity for Xcel Energy
~$1.7 billion Pathway project enables 5.5 GW renewables via 560 miles of 345 kV lines; decision anticipated 2022 Q1
Additional $0.5 - 1.0 billion in potential future projects
SPS$0.5 - $1.0 billion in potential projects that help alleviate congestion and enable future load growth and renewables in SPP
11

12
2022 - 2026
Commercial49%
Grid Upgrades
17%
Residential30%
Public Charging4%
~$750Million
2027 - 2031
Chargers & Programs 50%
Grid Upgrades50%
~$1.7Billion
Electric Vehicle Infrastructure
RESIDENTIAL COMMERCIAL• Charging equipment/installs for
cities, schools and businesses• EV purchase rebates (rate based)
• Charger installs and services• Rebates for vehicles and
charger installs (rate based)
PUBLIC• Charging stations in major
corridors and underserved communities
Enabling 1.5 Million EVs by 2030

Grid Resiliency
13
System Health & HardeningInfrastructure upgrades and targeted undergrounding to protect against severe weather events and minimize outage impacts
Grid Automation & EfficiencyMonitoring and control systems, storage, microgrids and advanced technologies that help prevent and mitigate outages
Capacity ExpansionNew infrastructure to accommodate distributed resources and electric vehicles

Hydrogen Opportunities
14
POWER GEN(GAS CT/CCs)
Renewables power electrolyzers
Electrolyzers produce green hydrogen
+ -
Lower carbon emissions from customer gas use
Hydrogen blending
NATURAL GAS SYSTEM
Lower-carbon electricity delivered to customers
$2 - $4 billion potential investment
Assumes up to 5% blending in natural gas systemNew gas generation and retrofits by 2031

Comprehensive Sustainability Goals
15
80% loweremissions by 2030*
* Includes owned and purchased electricity serving customers ** Spans natural gas supply, distribution and customer use
10% of spend with diverse suppliers
70% lesswater consumptionby 2030*
< rate of inflationcustomer bill increases
1.5 millionEVs powered by 2030
Social impactsof coal closures mitigated
Workforcereflects our communities
Local communitiessupported
CO2
$
100% carbon-free by 2050*
25% loweremissions by 2030**
Net zero by 2050**
NATGAS

Bill Increases at or Below Rate of Inflation
$84 $83 $80 $81 $81 $84 $80 $84
$53$62
$48$42 $45 $48 $51
$44
2013 2014 2015 2016 2017 2018 2019 2020
Electric
Natural Gas
Flat Average Monthly Residential Bills
16
Nearly $1.8 Billion in Customer Savings from Wind Energy
Includes avoided fuel costs and PTCs
$150 $150$250
$400
$800
2017 2018 2019 2020 2021
$ Millions

Disciplined O&M Cost Control
USING DRONES AND DATA
AUTOMATING WORK
RETIRING COAL PLANTS
OPTIMIZING SUPPLY CHAIN
Driving Sustainable Savings
LEVERAGING ATTRITION
$ Millions
TOTAL O&M CAGR 0.2%
0
500
1,000
1,500
2,000
2,500
2014 2015 2016 2017 2018 2019 2020 2021
Controlling Spend
17

Proven Track Record
18
200520062007200820092010201120122013201420152016201720182019202020212022
Low End High End
Actual Result
Midpoint
Performance Within Guidance
ON TRACK
2005 2007 2009 2011 2013 2015 2017 2019
2005 2007 2009 2011 2013 2015 2017 2019 2021
Annual Increase
Ongoing EPS
Dividend
$1.15
Guidance Range
$2.94-$2.98
$3.10-$3.20
2021 2022

Attractive Investment Thesis
~8-10% Total Shareholder
Return
Pure-Play Regulated Utility that Consistently Delivers
5-7% CAGR ׀ 60-70% Payout Ratio
Sustainable long-term growth Strong ESG leadership Proven track record
19
5-7% EPS Growth
~3% Dividend Yield

APPENDIX

STEEL FOR FUEL ADVANTAGE

Geographic Advantage for Renewables
Xcel Energy Territory
Speed (m/s)
>10.5 <4.0 Xcel Energy Territory
High Capacity Factors Enable Greater Efficiency and Lower Costs
KWh/M²/Day6.8
4.0
National Renewable Energy Laboratory with modification
Solar IntensityWind Speed
22

Fuel savings offset new investment; bills stay low
Less carbon, fewer coal assets, lower labor costs
Replacing Coal with Lower-Cost Wind
Variable cost of coal generation
Levelized cost of wind generation
<$20/MWh
$22-23/MWh
50% Capacity factor
8,760 Hours/year
Over 3,600 MW New owned wind (2018-2021) ~16 million MWh annually× =×
23
Steel for Fuel - Attractive Economics for Renewables
ADD WIND
RETIRE COAL

Steel for Fuel – Expanding Renewables Profile
Targeting 50% Ownership of New Resources
4 5 5 6 7 7 7 810 11
14 1416 16 17 18 19 20
23
2011 2013 2015 2018 2020 2022 2024 2026 2028 2030
Wind - PPA Wind - Owned Wind - % Ownership TBD Solar - % Ownership TBD
GW
24Solar includes universal scale and community solar gardens
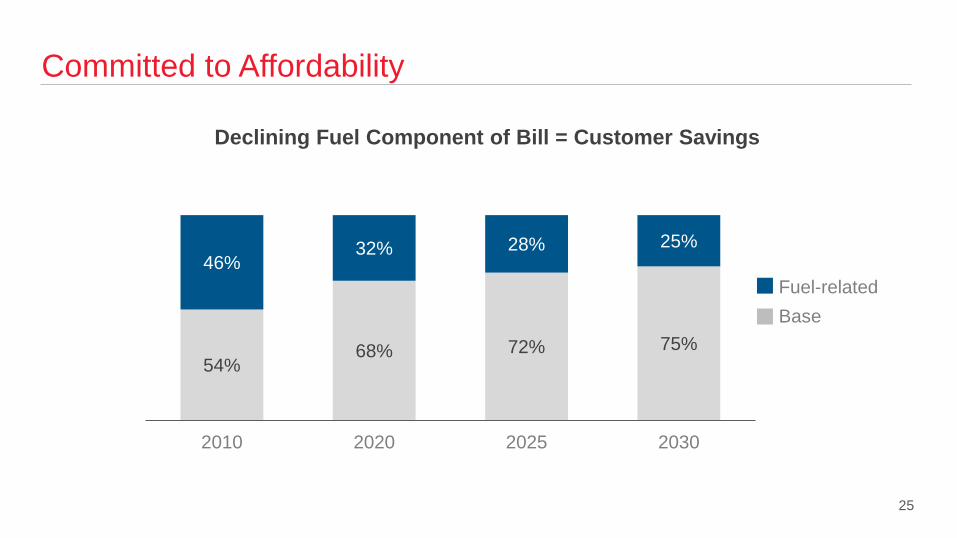
Committed to Affordability
54%68% 72% 75%
46%32% 28% 25%
2010 2020 2025 2030
Fuel-relatedBase
Declining Fuel Component of Bill = Customer Savings
25

ESG LEADERSHIP
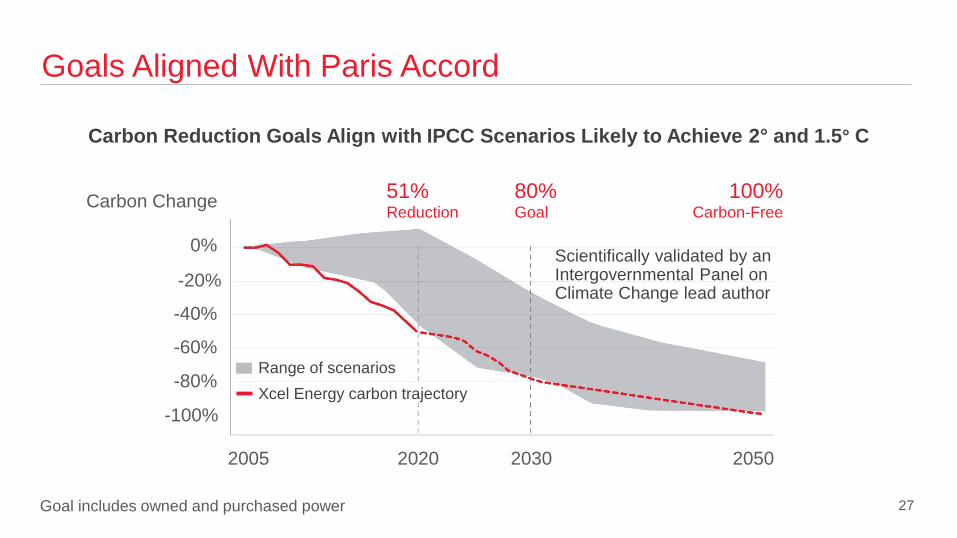
Goals Aligned With Paris Accord
27Goal includes owned and purchased power
Carbon Reduction Goals Align with IPCC Scenarios Likely to Achieve 2° and 1.5° C
2005 2020 2030 2050
51% Reduction
80% Goal
100% Carbon-Free
Scientifically validated by an Intergovernmental Panel on Climate Change lead author
Range of scenarios
Carbon Change
0%
-20%
-40%
-60%
-80%
-100%Xcel Energy carbon trajectory

56%
21%13%
3%
23%32%
23% 18%12% 13% 12% 13%9%
34%
52%
66%
Coal Natural Gas Nuclear Renewables
2005 2020 2025 2030
Significant Shift in Energy Mix
Tangible Carbon Reduction Plans
28

2006 2020 2028
Year Plant Capacity2022 Comanche 1 325 MW2023 Sherco 2 682 MW2025 Comanche 2 335 MW2025 Craig 1 42 MW**2026 Sherco 1 680 MW2028 Craig 2 40 MW**
Out of Coal by 2040
~8,100 MW
~6,500 MW
~4,400 MW
Completed
Approved
* Conversion from coal to natural gas** Based on Xcel Energy's ownership interest
Year Plant Capacity2024 Harrington* 1,018MW2027 Hayden 2 136 MW**2028 Hayden 1 97 MW**2028 King 511 MW2028 Pawnee* 505 MW2030 Sherco 3 517 MW**2032 Tolk 1,067MW2040 Comanche 3 500 MW**
Proposed
2929
Year Plant Capacity
2007 High Bridge 3-6 353 MW2008 Riverside 6-8 371 MW2010 Cameo 1-2 73 MW2011 Cherokee 2 106 MW2012 Cherokee 1 107 MW2013 Arapahoe 3-4 144 MW2015 Cherokee 3 152 MW2015 Black Dog 3-4 282 MW2015 Bay Front 4* 15 MW2017 Cherokee 4* 352 MW2017 Valmont 5 184 MW2020 Bay Front 5-6 41 MW

Reductions Beyond Carbon
Environmental Improvement Since 2005
SULFUR DIOXIDE
2005
2020 87%
NITROGEN OXIDES
83%
COAL ASH
62%
WATER CONSUMPTION
34%
••••••••
30
MERCURY
93%

XCEL ENERGY
25% Net GHG Emission Reduction by 2030, Net Zero by 2050
Net Zero Natural Gas Service
Pursue certified low/no net emissions supply
Promote conservation & beneficial electrification
Incorporate clean fuels to achieve net-zero methane emissions by 2030
31Goal compared to 2020 baseline; includes gas supply for electric systemNet zero assumes use of biologic offsets and carbon capture technologies
INFLUENCE SUPPLIERS
OPERATE THE CLEANESTSYSTEM POSIBLE
OFFER CUSTOMERS OPTIONS

Diverse and Engaged Board
2 Executives12 Independent
36% Female/Diverse6 Years Average Tenure
Governance, Compensation & Nominating (ESG oversight)
Audit Finance Operations, Nuclear, Environmental & Safety
MaleFemaleDiverse
• Mandatory retirement age and tenure limit• Lead independent director elected annually • Independent committee chairs• Board and committee performance evaluations• No supermajority approval provisions• Proxy access adopted • Annual advisory vote on compensation• Overboarding policies
Eight new directors within past five years; see Xcel Energy’s ESG deck for governance highlights 32

Electric Vehicle Vision 2030
1.5 MillionEVs Enabled
$1 billion annual customer savings~$1/gallon and lower using off-peak energy; rebates drive adoption
Nation-leading models for residential, commercial
and public charging
5 million CO2 tons avoided annually80% lower vehicle emissions when charging with Xcel Energy
$2 billion investmentService connections, charging infrastructure and programs
0.6% to 0.7% incremental annual retail sales growth~6-7 million MWh new load keeps customer bills low
33
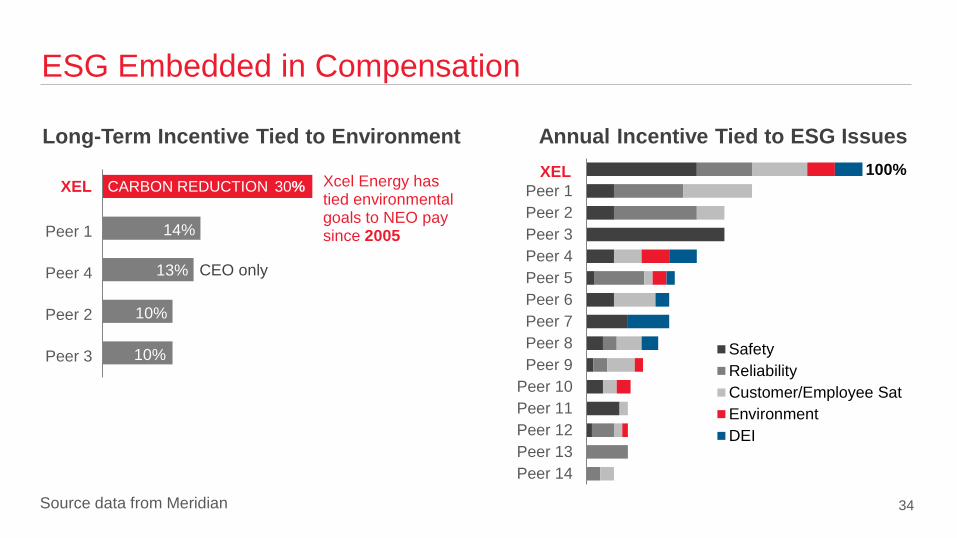
ESG Embedded in Compensation
30%
14%
13%
10%
10%
XEL
Peer 1
Peer 4
Peer 2
Peer 3
30%
Source data from Meridian
Long-Term Incentive Tied to EnvironmentXEL
Peer 1Peer 2Peer 3Peer 4Peer 5Peer 6Peer 7Peer 8Peer 9
Peer 10Peer 11Peer 12Peer 13Peer 14
SafetyReliabilityCustomer/Employee SatEnvironmentDEI
Annual Incentive Tied to ESG IssuesXEL
XEL
CEO only
Xcel Energy has tied environmental goals to NEO pay since 2005
CARBON REDUCTION100%
34

35
Sustainability Goals - Tangible Progress
CO2
$
GOAL PROGRESS
Carbon emissions down 80% by 2030* 51% reduction 2005 - 2020
Net GHG emissions down 25% by 2030** To be reported early 2022
Water consumption down 70% by 2030* 34% reduction 2005 - 2020
Bill increases < rate of inflation Residential CAGR flat 2013 - 2020
1.5 million EVs powered by 2030 Programs approved in MN, CO, WI, NM
Mitigate coal retirement impacts 7 plant closures, 0 layoffs
Support local economies >70% supply chain spend local (2020)~$900 million investment; 3,000 jobs (2020)
Workforce reflects our communities Board - 21% female, 14% diverseWorkforce - 23% female, 16% diverse (YE 2020)
~10% spend with diverse suppliers $640 million vs. $600 million goal (YE 2020)
* Includes owned and purchased electricity serving customers ** Spans natural gas supply, distribution and customer use

Workforce Representation
MANAGEMENT
BOARD21% female
Workforce figures as of YE 2020
14% diverse
22% female 10% diverse
WORKFORCE23% female 16% diverse
CEO DIRECT REPORTS38% female 13% diverse
NEW HIRES33% female 22% diverse
INTERNS33% female 28% diverse
36

DEI Progress Tied to Compensation
Keeping a pulse on how employees are doing and taking action to better support them
INTERVIEW PANELSDiversity in background, race, ethnicity, gender and perspectives
Focus, Commitment and Accountability
37
Over 30 female and minority employees paired with members of senior leadership
EXECUTIVE SPONSORSHIP
INCLUSION INDEX

REPORTS & DISCLOSURES
Voluntary Disclosures
FRAMEWORKS & STANDARDS
POLICIES & POSITION STATEMENTS
Alignment Alignment
Sustainability Report
EEI/AGA Template
PoliticalContributions
Lobbying& Contributions
Responsible Transition
Anti-Discrimination
Alignment
Carbon Scenarios
Founding MemberAlignment Member
TCFD Response
Compliance Program
Code of Conduct
Environmental Policy
38
Natural Gas Vision
Human Rights
Anti-Retaliation
ESG library available
EEO-1Green Bond Impacts

FINANCIAL SUPPLEMENT

Strong Credit Metrics
40
Credit metrics are based on five-year capital plan and do not reflect rating agency adjustments Credit metrics reflect incremental debt issued for the assumed lag in Uri fuel cost recovery, which are pending regulatory decisions; FFO doesn’t include impacts of regulatory lag for fuel recovery (a working capital adjustment)
Credit Ratings Moody’s S&P FitchXcel Energy Unsecured Baa1 BBB+ BBB+NSPM Secured Aa3 A A+NSPW Secured Aa3 A A+PSCo Secured A1 A A+SPS Secured A3 A A-
Plan 2022 2023 2024 2025 2026FFO/Debt ~17% ~17% ~17% ~17% ~17%Debt/EBITDA 5.0x 4.9x 4.8x 4.8x 4.7xEquity Ratio 40% 41% 41% 41% 41%Hold Co Debt/Total Debt 24% 23% 23% 23% 24%

Manageable Debt Maturities
$ Millions
$0
$400
$800
$1,200
2022 2023 2024 2025 2026 2027 2028 2029 2030
NSPM NSPW PSCo SPS Hold Co
41
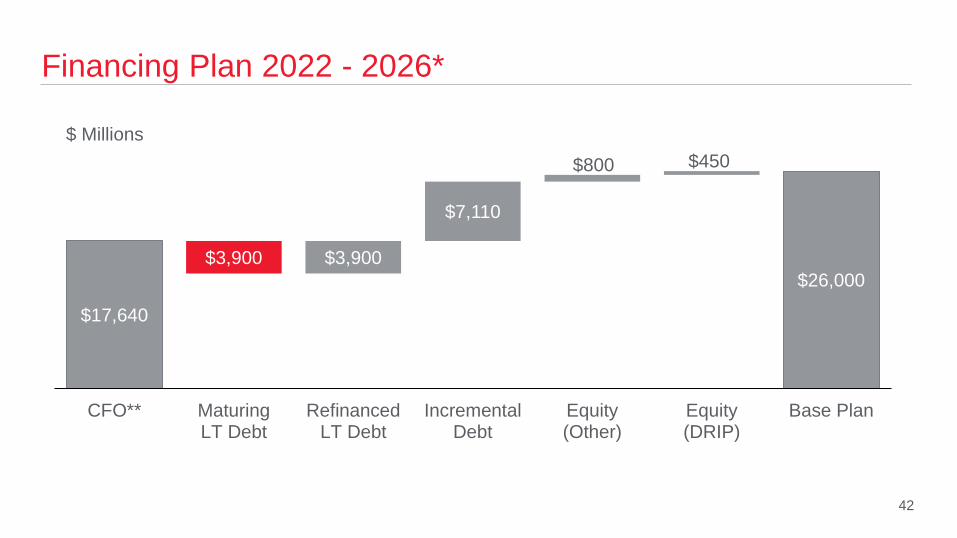
Financing Plan 2022 - 2026*
42
$ Millions
$17,640
$26,000$3,900 $3,900
$7,110
$800 $450
CFO** MaturingLT Debt
RefinancedLT Debt
IncrementalDebt
Equity(Other)
Equity(DRIP)
Base Plan

2022 Debt Financing Plan
Financing plans are subject to change, depending on capital expenditures, regulatory outcomes, internal cash generation, market conditions, changes in tax policies and other factors 43
Issuer Security AmountHold Co Senior Unsecured Bonds $500NSPM First Mortgage Bonds $550NSPW First Mortgage Bonds $100PSCo First Mortgage Bonds $600SPS First Mortgage Bonds $150
$ Millions

Reconciliation - Ongoing EPS to GAAP EPS2005 2006 2007 2008 2009 2010 2011 2012 2013 2014 2015 2016 2017 2018 2019 2020
Ongoing EPS $1.15 $1.30 $1.43 $1.45 $1.50 $1.62 $1.72 $1.82 $1.95 $2.03 $2.09 $2.21 $2.30 $2.47 $2.64 $2.79PSRI-COLI 0.05 0.05 (0.08) 0.01 (0.01) 0.03 - - - - - - - - - -Prescription Drug Tax Benefit - - - - - (0.04) - 0.03 - - - - - - - -
SPS FERC Order - - - - - - - - (0.04) - - - - - - -LossonMonticello LCM/EPU Project - - - - - - - - - - (0.16) - - - - -
Impact of Tax Cuts & Jobs Act - - - - - - - - - - - - (0.05) - - -
Cont. Ops. 1.20 1.35 1.35 1.46 1.49 1.61 1.72 1.85 1.91 2.03 1.94 2.21 2.25 2.47 2.64 2.79Discont. Ops. 0.03 0.01 - - (0.01) 0.01 - - - - - - - - - -GAAP EPS $1.23 $1.36 $1.35 $1.46 $1.48 $1.62 $1.72 $1.85 $1.91 $2.03 $1.94 $2.21 $2.25 $2.47 $2.64 $2.79Amounts may not sum due to rounding
Xcel Energy’s management believes that ongoing earnings reflects management’s performance in operating the company and provides ameaningful representation of the performance of Xcel Energy’s core business. In addition, Xcel Energy’s management uses ongoingearnings internally for financial planning and analysis, for reporting of results to the Board of Directors and when communicating itsearnings outlook to analysts and investors.
44

Diverse Asset Base
Electric Distribution
21%
Generation 8%
Renewables15%
Electric Transmission
23%
Natural Gas LDC
12%
Other8%
Nuclear5%
Electric Distribution
28%
Generation7%
Renewables10%
Electric Transmission
29%
Natural Gas LDC
13%
Other7%
Nuclear3%Coal
8%Coal3%
$34Billion
2020 2026
$49Billion
Coal Rate Base Declines from 8% to 3%
45

Base Capital Expenditures by Function
46
2022 2023 2024 2025 2026 TotalElectric Distribution $1,485 $1,600 $1,520 $1,605 $1,720 $7,930 Electric Transmission $1,105 $1,220 $1,575 $1,965 $1,555 $7,420 Natural Gas $655 $670 $695 $660 $660 $3,340 Electric Generation $645 $580 $670 $650 $650 $3,195 Other $725 $545 $450 $340 $450 $2,510 Renewables $665 $345 $230 $340 $25 $1,605 Total $5,280 $4,960 $5,140 $5,560 $5,060 $26,000
$ Millions
Excludes potential incremental investment associated with resource plans, PPA buyouts and future wind repowerings. Approved NSPM 650 MW wind repowering projects are included in base capital expenditures.
Base Capital Expenditures by Company
47
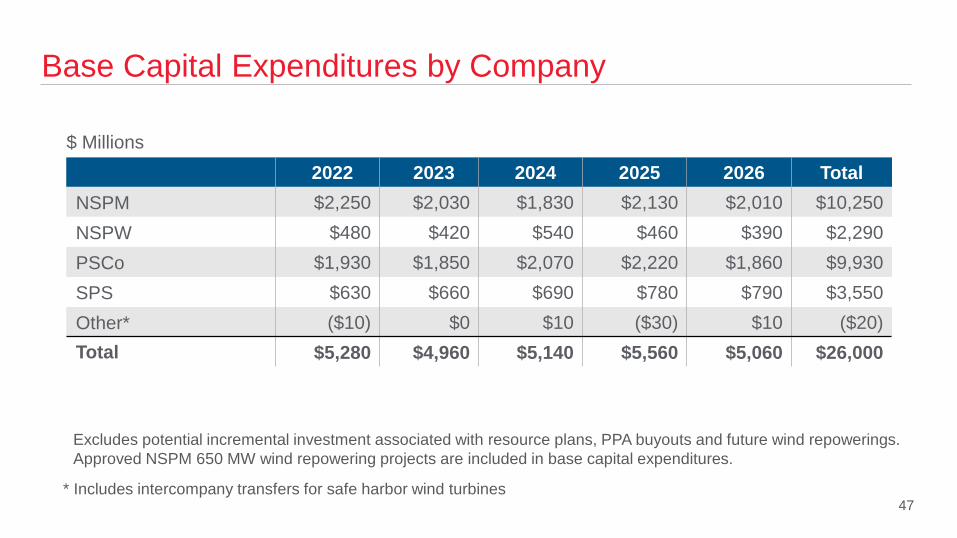
2022 2023 2024 2025 2026 TotalNSPM $2,250 $2,030 $1,830 $2,130 $2,010 $10,250 NSPW $480 $420 $540 $460 $390 $2,290 PSCo $1,930 $1,850 $2,070 $2,220 $1,860 $9,930 SPS $630 $660 $690 $780 $790 $3,550 Other* ($10) $0 $10 ($30) $10 ($20)Total $5,280 $4,960 $5,140 $5,560 $5,060 $26,000
$ Millions
* Includes intercompany transfers for safe harbor wind turbines
Excludes potential incremental investment associated with resource plans, PPA buyouts and future wind repowerings. Approved NSPM 650 MW wind repowering projects are included in base capital expenditures.

Regulatory Framework
48
Rate Base Covered by Multi-year Plans
Rate Base Recovered Under Forward Test Year
Cap Ex Eligible forRecovery by Rider
Retail Electric SalesCovered by Decoupling
NSPMYP40%
FTY41%
Rider Recovery
~30%
MN Decoupled
32%
FTY Allowed
42%
HTY 12%
Formula Rates 5%
Formula Rates 5%
Non-MYP27% Traditional
Rate Case~70%
NotDecoupled
55%
CODecoupled
13%
PSCo *Electric MYP
28%
* Colorado Commission approved two three-year electric MYPs in the past 48

ROE Results - GAAP and Ongoing Earnings
49
8.65% 9.72%8.22% 9.07% 8.61%
10.85%
NSPM NSPW PSCo SPS TotalOpCo
XcelEnergy
GAAP and Ongoing ROETwelve Months Ended 9/30/2021
NSPM38%
NSPW5%
PSCo39%
SPS18%
2020 Rate Base
~$34Billion

Regulatory Framework by CompanyNSPM NSPW PSCo SPS
Multi-year Rate Plans ✓ ✓ AllowedForward Test Year ✓ MN & ND ✓ Allowed ✓ NM AllowedInterim Rates ✓ Allowed *Fuel Recovery Mechanism ✓ ✓ ✓ ✓Capacity Recovery Mechanism ✓Renewable Rider ✓ MN & ND ✓ ✓ NMTransmission Rider ✓ MN & ND ✓ ✓ TXDistribution or Advanced Grid Rider ✓ MN ✓ TX & NMInfrastructure Rider ✓ SDGeneration Rider ✓ TXPension Deferral Mechanism ✓ MN ✓ ✓Property Tax Deferral/True-up ✓ MN ✓Decoupling ✓ MN ✓
* Wind settlement in Texas reduces regulatory lag for wind projects 50

2020 Rate Base and ROEs
51
OpCo JurisdictionYE 2020
Rate Base($ millions)
YE 2020 Authorized
ROE (%)
YE 2020W/N Earned
ROE (%)Regulatory Status
NSPM
MN Electric 10,339 9.20 9.26 Filed 2022-2024 MYP; decision expected 2023 Q2MN Natural Gas 816 10.09 7.19 Filed 2022 FTY and stay-out; decision on stay-out expected 2021 Q4ND Electric 632 9.85 9.54 Filed 2021 FTY; settlement approved, rates effective January 2021ND Natural Gas 81 9.75 6.63 Filed 2022 FTY; interim rates implemented November 2021SD Electric 727 Blackbox 8.48 TCJA Settlement 2019-2020
NSPWWI Electric 1,584 10.00 10.46 Filed 2022-2023 MYP; settlement decision expected 2021 Q4WI Natural Gas 172 10.00 5.59 Filed 2022-2023 MYP; settlement decision expected 2021 Q4MI Elec. & Nat. Gas 44 9.80(e)/10.00(g) 8.18 Filed 2022 FTY electric case
PSCoCO Electric 9,202 9.30 8.73 Filed 2022 FTY; decision expected 2022 Q1
CO Natural Gas 3,030 9.20 8.78 Rates effective April 2021, retroactive to November 2020 Wholesale/Steam 763 * *
SPSTX Electric 3,269 Blackbox 7.02** Filed required 2020 HTY; decision expected 2022 Q1NM Electric 1,795 9.45 6.20** Filed required HTY; settlement decision expected 2021 Q4SPS Wholesale 1,051 *** ***
* Authorized ROE for PSCo transmission and production formula = 9.72%** Actual regulatory ROEs are low relative to GAAP ROE due to the use of year-end rate base for regulatory purposes, which includes the
Sagamore wind farm, but not the corresponding revenue*** Transmission ROE = 10.50% and production formula ROE = 10.00%

COMPANY PROFILES

Fully Regulated and Vertically Integrated
53
Four Operating Companies
EightStates
3.7 MillionElectric Customers
2.1 MillionNatural Gas Customers
$34 Billion 2020 Rate Base
20 GWOwned Gen. Capacity
11,000+Employees
As of 12/31/2020
Northern States Power Minnesota (NSPM)Minnesota, South Dakota, North Dakota• 2020 Rate Base: $12.6 billion • 2020 Ongoing EPS: $1.12• 2021-2025 Base Cap Ex: $9.3 billion
Northern States Power Wisconsin (NSPW)Wisconsin, Michigan• 2020 Rate Base: $1.8 billion • 2020 Ongoing EPS: $0.20• 2021-2025 Base Cap Ex: $2.2 billion
Public Service Company of Colorado (PSCo)Colorado• 2020 Rate Base: $13.0 billion • 2020 Ongoing EPS: $1.11• 2021-2025 Base Cap Ex: $8.6 billion
Southwestern Public Service (SPS)Texas, New Mexico• 2020 Rate Base: $6.1 billion • 2020 Ongoing EPS: $0.56• 2021-2025 Base Cap Ex: $3.4 billion

NSPM Overview
CoalNatural GasNuclearWindSolarOtherHydro
Electric - Retail Natural Gas - Retail1.5 million customers 531,000 customers32 million MWh 85 million MMBtu
2020 Financials GAAP & OngoingNet Income $591 millionAssets $21.1 billionROE 9.20%Equity Ratio 52.7%
Credit Ratings (Secured/Unsecured)Moody’s Aa3 / A2S&P A / A-Fitch A+ / A
54
NSP System Energy Mix
2005 2020
18%
20%
30%
21%
3%2%6%
50%
7%
27%
3%2%
11%
2025
4%
29%
25%
30%
9%3%
2030
19%
26%39%
13%
3%

Minnesota Resource Plan
June 2021Updated filing
August 2021Intervenor comments
2022 Q1Anticipated decision
Full coal exit by 2030• King (511 MW) retire 2028 • Sherco 3 (517 MW) retire 2030
Firm peaking capacity (reliability driven)• 800 MW of hydrogen ready CTs• 300 MW of repowered black start CTs• 1,900 MW of dispatchable capacity
Nuclear extension (Monticello to 2040)
Significant renewable additions• Universal scale solar (3,150 MW)• Wind (2,650 MW)
55
85% Carbon Reduction & Coal Exit by 2030

Transmission Expansion - MISO Outlook
• MISO’s initial long-range transmission planning roadmap highlighted:- Three potential futures with up to
50% renewables by 2039- Urgency for significant expansion
over next ~15 years- Initial set of projects with preliminary
estimate of ~$30 billion; potential full rollout up to $100 billion
• Visibility to initial project set anticipated 2022 H1
56
Source: MISO
Indicative Transmission Development in MISO

NSPM Base Capital Expenditures by Function
2022 2023 2024 2025 2026 TotalElectric Distribution $585 $625 $590 $610 $660 $3,070 Electric Transmission $310 $320 $340 $440 $470 $1,880 Electric Generation $325 $340 $345 $455 $535 $2,000 Natural Gas $165 $175 $160 $160 $145 $805 Other $300 $250 $175 $135 $185 $1,045 Renewables $565 $320 $220 $330 $15 $1,450 Total $2,250 $2,030 $1,830 $2,130 $2,010 $10,250
$ Millions
57
Excludes potential incremental investment associated with resource plans, PPA buyouts and future wind repowerings. Approved NSPM 650 MW wind repowering projects are included in base capital expenditures.

NSPM Recovery Mechanisms
Minnesota• Forward test year with interim rates• Transmission rider • Renewable energy rider• Natural gas infrastructure rider• Environmental improvement rider• Recovery of grid modernization through
transmission rider• DSM incentive mechanism• Fuel clause adjustment • Electric decoupling/sales true-up
for all classes (2016 - 2021)• Multi-year rate plans up to 5 years
North Dakota and South Dakota• Forward test year with interim rates (ND)• Historic test year (SD)• Transmission rider (ND & SD)• Renewable energy rider (ND)• Infrastructure rider for capital projects (SD) • Fuel clause adjustment (ND & SD)
58

NSPM Electric Rate Case
59
• In October 2021, NSPM filed a three-year electric rate case:– Requesting rate increase of $677 million over three years– ROE of 10.2% and equity ratio of 52.5%– 2022 - 2024 forecast test year– Interim rates of $288 million in January 2022 (subject to refund) and an
incremental $135 million in January 2023• Decision expected 2023 Q2
Proceeding No. 21-630
$ Millions, Except Percentages 2022 2023 2024 TotalRate request $396 $150 $131 $677Increase 12.2% 4.8% 4.2% 21.2%Rate base $10,931 $11,446 $11,918 N/A

NSPM Natural Gas Rate Case
60
• In November 2021, NSPM filed a natural gas rate case:
– Requesting rate increase of ~$36 million
– ROE of 10.5% and equity ratio of 52.50%
– Rate base of ~$934 million
– 2022 forecast test year
– Interim rates of ~$25 million in effect January 2022
• A proposed stay-out alternative was filed to mitigate customer bill impacts; the rate case filing would be withdrawn if the Commission grants deferrals of certain costs
• Commission decision on whether to approve the stay-out or proceed with the rate case is anticipated 2021 Q4
Proceeding No. 21-678

NSPM North Dakota Natural Gas Rate Case
61
Proceeding No. PU-21-381
• In September 2021, NSPM filed a natural gas rate case:– Requesting rate increase of ~$7 million– ROE of 10.5% and equity ratio of 52.54%– Rate base of ~$140 million– 2022 forecast test year – Interim rates of ~$7 million implemented November 1, 2021 (subject to refund)

NSPW Overview
CoalNatural GasNuclearWindSolarOtherHydro
Electric - Retail Natural Gas - Retail 264,000 customers 118,000 customers7 million MWh 17 million MMBtu
2020 Financials GAAP & OngoingNet Income $107 millionAssets $2.9 billionROE 10.52%Equity Ratio 53.6%
Credit Ratings (Secured/Unsecured)Moody’s Aa3 / A2S&P A / A-Fitch A+ / A
62
NSP System Energy Mix
2005 2020
18%
20%
30%
21%
3%2%6%
50%
7%
27%
3%2%
11%
2025
4%
29%
25%
30%
9%3%
2030
19%
26%39%
13%
3%

NSPW Base Capital Expenditures by Function
2022 2023 2024 2025 2026 TotalElectric Distribution $105 $130 $145 $115 $115 $610 Electric Transmission $145 $130 $150 $155 $165 $745 Electric Generation $25 $60 $150 $90 $30 $355 Natural Gas $40 $30 $45 $45 $25 $185 Other $80 $55 $50 $55 $55 $295 Renewables $85 $15 $0 $0 $0 $100 Total $480 $420 $540 $460 $390 $2,290
$ Millions
63

NSPW Recovery Mechanisms
Wisconsin and Michigan• Forward test year (WI & MI)• Biennial rate case (WI)• Annual electric fuel plan with reconciliation (WI)• Purchased natural gas adjustment (WI)• Natural gas cost recovery mechanism (MI)• Power supply cost recovery (MI)
64

NSPW Electric & Natural Gas Rate Case Settlement
65
Proceeding No. 4220-UR-125
• In July 2021, NSPW filed an electric and natural gas rate case settlement based on a FTY, reflecting: – Electric rate increase: $35 million for 2022 and incremental $18 million for 2023– Natural gas rate increase: $10 million for 2022 and incremental $3 million for 2023– ROE of 9.8% for 2022 and 10.0% for 2023; equity ratio of 52.5% – Electric rate base: ~$1.75 billion for 2022 and ~$1.98 billion for 2023– Natural gas rate base: ~$195 million for 2022 and ~$223 million for 2023– COVID-19 deferral recovery to be addressed in next rate proceeding– Deferral of impacts from potential changes in federal or state tax law– Earnings sharing mechanism, which would return to customers 50% of earnings 50 - 75 basis
points over authorized ROE and 100% of earnings equal to or in excess of 75 basis points • Decision expected 2021 Q4

PSCo Overview
PSCo System Energy Mix
65%31%
2%2%
27%
10%47%
15%
1%
Electric - Retail Natural Gas - Retail 1.5 million customers 1.4 million customers29 million MWh 145 million MMBtu
2020 Financials GAAP & OngoingNet Income $588 millionAssets $20.4 billionROE 8.06%Equity Ratio 56.4%
Credit Ratings (Secured/Unsecured)Moody’s A1 / A3S&P A / A-Fitch A+ / A
2005 2020 2025
26%
38%
31%
3%1%1%
CoalNatural GasWindSolarOtherHydro 662030
4%
16%
55%
25%

Colorado Resource Plan
March 2021Filed
October 2021Intervenor comments
2022 Q1Anticipated decision
67
85% Carbon Reduction by 2030 & Coal Exit by 2040
Full coal exit by 2040• Hayden 1 & 2 (233 MW) retire 2028/2027• Pawnee (505 MW) convert to nat gas 2028• Comanche 3 (500 MW) retire 2040;
reduced operations begin 2030
Significant renewable additions• Wind (~2,300 MW) • Universal scale solar (~1,600 MW)• Distributed solar (~1,200 MW)
Transmission expansionPathway enables additional renewables while improving reliability
Firm peaking capacity• ~1300 MW flexible resources• ~400 MW storage
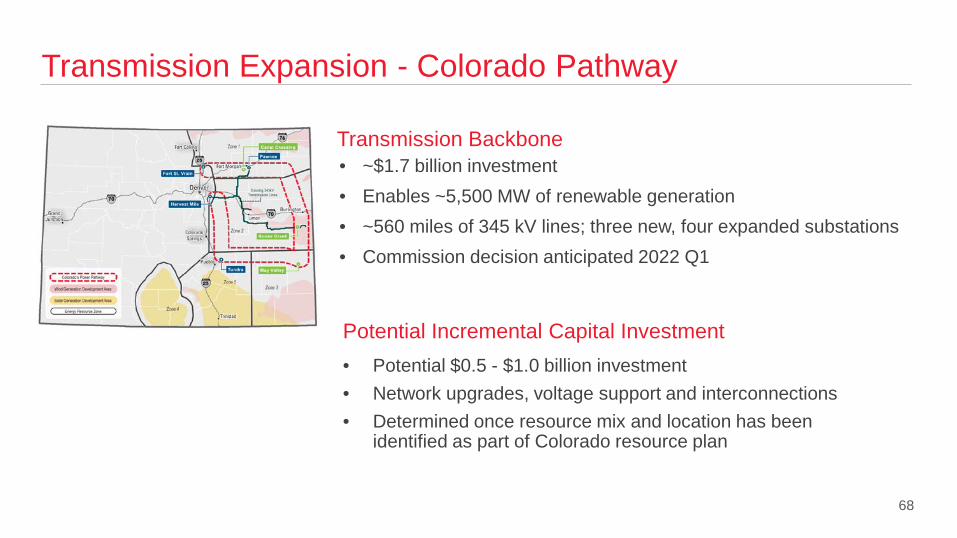
Transmission Expansion - Colorado Pathway
• ~$1.7 billion investment • Enables ~5,500 MW of renewable generation• ~560 miles of 345 kV lines; three new, four expanded substations• Commission decision anticipated 2022 Q1
Transmission Backbone
• Potential $0.5 - $1.0 billion investment • Network upgrades, voltage support and interconnections• Determined once resource mix and location has been
identified as part of Colorado resource plan
Potential Incremental Capital Investment
68
PSCo Base Capital Expenditures by Function
$ Millions
69
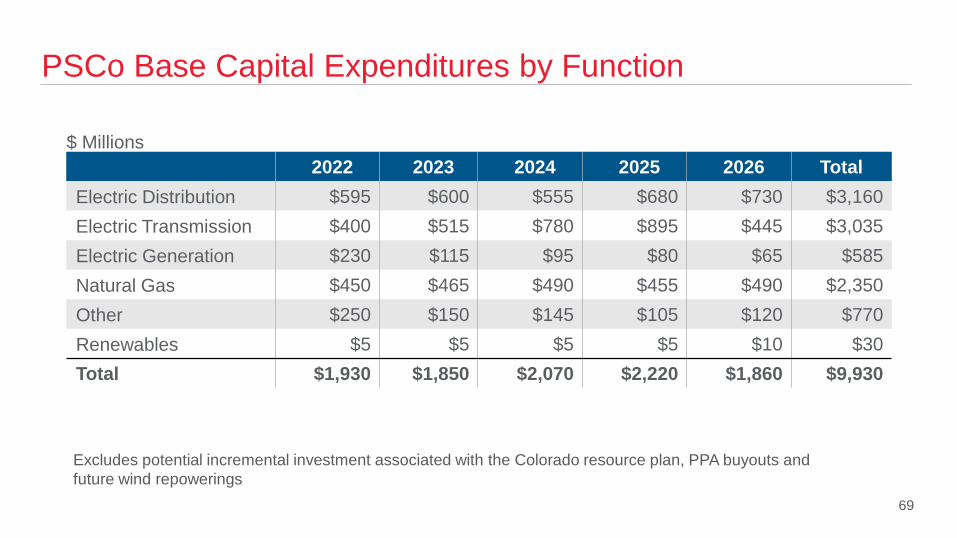
2022 2023 2024 2025 2026 TotalElectric Distribution $595 $600 $555 $680 $730 $3,160 Electric Transmission $400 $515 $780 $895 $445 $3,035 Electric Generation $230 $115 $95 $80 $65 $585 Natural Gas $450 $465 $490 $455 $490 $2,350 Other $250 $150 $145 $105 $120 $770 Renewables $5 $5 $5 $5 $10 $30 Total $1,930 $1,850 $2,070 $2,220 $1,860 $9,930
Excludes potential incremental investment associated with the Colorado resource plan, PPA buyouts and future wind repowerings
PSCo Recovery Mechanisms
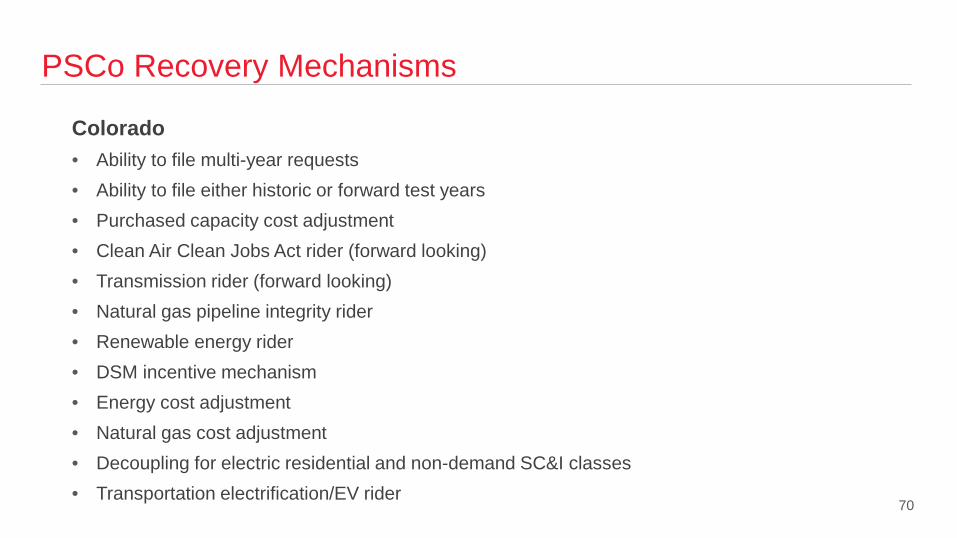
Colorado• Ability to file multi-year requests• Ability to file either historic or forward test years• Purchased capacity cost adjustment• Clean Air Clean Jobs Act rider (forward looking)• Transmission rider (forward looking)• Natural gas pipeline integrity rider• Renewable energy rider• DSM incentive mechanism• Energy cost adjustment• Natural gas cost adjustment• Decoupling for electric residential and non-demand SC&I classes• Transportation electrification/EV rider
70

PSCo Colorado Comprehensive Settlement
71
In October 2021, PSCo filed a settlement that proposes to address several regulatory items:• Full recovery of all Winter Storm Uri deferred fuel costs through a rider
– Electric: $263 million electric over 24 months with no carrying charges– Natural gas: $287 million over 30 months with no carrying charges
• Refund electric customers ~$41 million (deferred revenue) from 2020 decoupling program
• Forego recovery of ~$14 million of replacement power costs incurred due to an extended Comanche Unit 3 outage in 2020
• Will not seek recovery of ~$11 million of deferred COVID-19 bad debt expense
• Commission decision anticipated 2022 H1
Proceeding No. 21A-0192EG

PSCo Colorado Electric Rate Case
72
• In July 2021, PSCo filed an electric rate case: – Requesting a net base rate increase of ~$343 million – ROE of 10.0% and equity ratio of 55.64%– Rate base of ~$10.3 billion – 2022 forecast test year– A historical test year including a 10.5% ROE was also filed as required
• Decision expected 2022 Q1• Rates effective April 2022
Proceeding No. 21AL-0317E

SPS Overview
CoalNatural GasWindSolar
SPS System Energy Mix
54%43%
1%2%
19%
47%
32%
2%10%
30%58%
2%
Electric - Retail 398,000 customers21 million MWh
2020 Financials GAAP & OngoingNet Income $295 millionAssets $8.9 billionROE 9.54%Equity Ratio 52.2%
Credit Ratings (Secured/Unsecured)Moody’s A3 / Baa2S&P A / A-Fitch A- / BBB+
2005 2020 2025 73
10%
18%
60%
12%
2030
SPS Base Capital Expenditures by Function
$ Millions
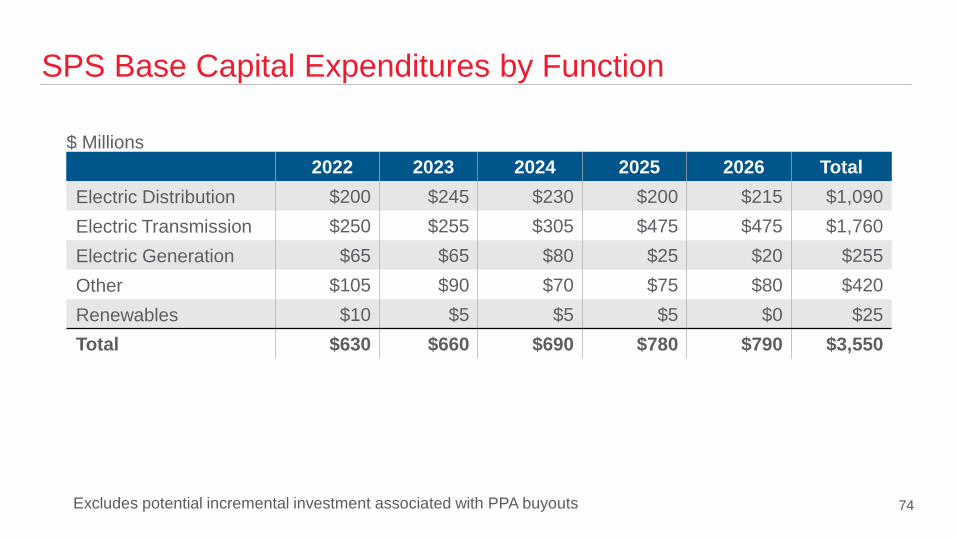
74
2022 2023 2024 2025 2026 TotalElectric Distribution $200 $245 $230 $200 $215 $1,090 Electric Transmission $250 $255 $305 $475 $475 $1,760 Electric Generation $65 $65 $80 $25 $20 $255 Other $105 $90 $70 $75 $80 $420 Renewables $10 $5 $5 $5 $0 $25 Total $630 $660 $690 $780 $790 $3,550
Excludes potential incremental investment associated with PPA buyouts

SPS Recovery Mechanisms
Texas and New Mexico• Historic test year (TX) (wind settlement reduced regulatory lag)• Ability to file forward test year (NM)• DSM incentive mechanism (TX & NM)• Fuel clause adjustment (TX & NM)• Purchased Capacity Cost Recovery Factor (TX)• Transmission Cost Recovery rider (TX)• Distribution Cost Recovery rider (TX)• AMI rider (TX & NM)• Generation rider (TX)
75

SPS New Mexico Electric Rate Case Settlement
76
• In January 2021, SPS filed a required electric rate case: – Requesting base rate increase of ~$84 million– ROE of 10.35% and equity ratio of 54.72%– Retail rate base of ~$1.9 billion – HTY ended September 30, 2020, including capital additions through February 2021– Changes to depreciation rates to reflect early retirement of Tolk coal plant (2032) and
Harrington plant coal handling assets due to conversion to natural gas (2024) • In June 2021, SPS and various parties filed an uncontested settlement, including:
– Base revenue increase of $62 million– ROE of 9.35% and equity ratio of 54.72% for filing purposes– Accelerated depreciation for Tolk plant (2032) and Harrington coal handling assets (2024)
• Commission decision expected 2021 Q4
Proceeding No. 20-00238-UT
SPS Texas Electric Rate Case
77
Proceeding No. 51802
• In February 2021, SPS filed a required electric rate case: – Requesting base rate increase of ~$140 million– Customer increase of $71 million after reflecting fuel savings and Sagamore wind farm PTCs– ROE of 10.35% and equity ratio of 54.60%– Rate base of ~$3.3 billion – Historic test year ended December 31, 2020– Changes to depreciation rates to reflect early retirement of Tolk coal plant (2032) and Harrington
plant coal handling assets due to conversion to natural gas (2024)• Schedule abated for settlement discussion• Decision expected 2022 Q1

© 2021 Xcel Energy Inc.