eecs 141: digital integrated circuits - spring 1998 · web viewcollege of engineering department of...
TRANSCRIPT

EECS 141: Spring 2006 Bill Hung and Dennis Wang
UNIVERSITY OF CALIFORNIA AT BERKELEYCOLLEGE OF ENGINEERING
DEPARTMENT OF ELECTRICAL ENGINEERING AND COMPUTER SCIENCE
EECS 141: Digital Integrated Circuits - Spring 2006
Report Cover Sheet
TERM PROJECT: SRAM Design Cover SheetReport 1 – Memory cell designDue Monday, March 20, 2006 by 10am in drop box.
NamesBill HungChih-Chieh (Dennis) Wang
Parameter Pre-design estimate
Units
Cell area 13.3632 (9282)
µm2
Read noise margin 250 mVVoltage rise during read
393.6 mV
GRADE
Approach, result and correctness (60%)Report (40%)TOTAL
University of California, Berkeley 1 © 2006
EECS 141: Spring 2006 Bill Hung and Dennis Wang
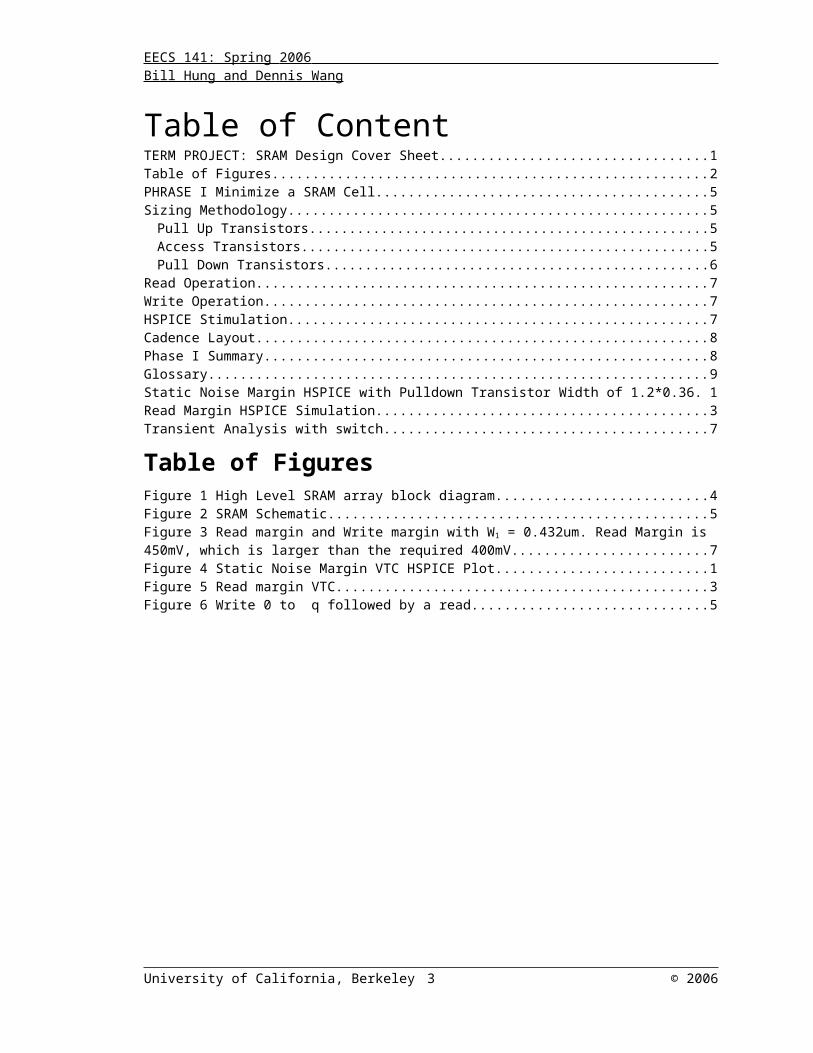
Table of ContentTERM PROJECT: SRAM Design Cover Sheet........................................................................................1Table of Figures....................................................................................................................................... 2PHRASE I Minimize a SRAM Cell.......................................................................................................... 5Sizing Methodology................................................................................................................................. 5
Pull Up Transistors............................................................................................................................... 5Access Transistors................................................................................................................................ 5Pull Down Transistors.......................................................................................................................... 6
Read Operation........................................................................................................................................ 7Write Operation....................................................................................................................................... 7HSPICE Stimulation................................................................................................................................ 7Cadence Layout....................................................................................................................................... 8Phase I Summary..................................................................................................................................... 8Glossary................................................................................................................................................... 9Static Noise Margin HSPICE with Pulldown Transistor Width of 1.2*0.36...............................................1Read Margin HSPICE Simulation............................................................................................................ 3Transient Analysis with switch................................................................................................................. 7
Table of FiguresFigure 1 High Level SRAM array block diagram......................................................................................4Figure 2 SRAM Schematic....................................................................................................................... 5Figure 3 Read margin and Write margin with W1 = 0.432um. Read Margin is 450mV, which is larger than the required 400mV.......................................................................................................................... 7Figure 4 Static Noise Margin VTC HSPICE Plot......................................................................................1Figure 5 Read margin VTC...................................................................................................................... 3Figure 6 Write 0 to q followed by a read.................................................................................................5
University of California, Berkeley 2 © 2006
EECS 141: Spring 2006 Bill Hung and Dennis Wang
SRAM Cell Design
University of California, Berkeley 3 © 2006
Figure 1: SRAM Cell Schematic Figure 2: Cadence SRAM Cell Layout
Figure 3: HSPICE Static Noise Margin Figure 4: HSPICE Read and Write Simulation
(left) The pull-up transistors and the access transistors are minimum sized (W/L=0.36/0.24) to give a pull-up ratio of 1(<1.5). The pull-down transistors are sized W/L=0.48/0.24 to meet the 0.4V read margin. The cell ratio is 1.33(>1.2). (right) The goal of the layout is to make it work with minimum size.
(left) Voltage Transfer Curve (VTC) of an inverter and a half cell taken from the SRAM cell. The read margin of 0.4V is met. Note that the two axises are in different scale. (right) A write simulation wrote a zero into the SRAM cell, followed by a read simulation shows the read margin is below 0.4V. Note that when the word line is low initially, Q and have don’t care values
WL
VDD
BL BL
M1
M2
M3
M4
M5 M6Q
Cbit Cbit
Q
umum
24.036.0
umum
24.036.0
umum
24.036.0
umum
24.036.0
umum
24.048.0
umum
24.048.0
WL
BL
Q and

EECS 141: Spring 2006 Bill Hung and Dennis Wang
Figure 1 High Level SRAM array block diagram
University of California, Berkeley 4 © 2006

EECS 141: Spring 2006 Bill Hung and Dennis Wang
PHRASE I Minimize a SRAM Cell
The phrase I involes minimizing a SRAM area, stimulating the SRAM design with HSPICE. and drawing the layout for the minimum sized SRAM using Cadence.
Figure 2 SRAM Schematic
Sizing MethodologyPull Up TransistorsThe two pull up transistors (M2 and M4) in Figure 2 are minimum sized. Because the Pull Up ratio between the pull up transistors and the access transistors equals to 1 if they are all minimum sized. The pull-up ratio needs to be less than 1.8 [Rabaey, 661]. From Cadence, the minimum size is when W=0.36um, and L=0.24um.
Equation 1:Pull-up Ratio [Rabaey, 661]
Access TransistorsThe two access transistors (M5 and M6) in Figure 2 are minimum sized. Practical designs sometimes increase the length (L) of these access transistors to improve the robustness of
University of California, Berkeley 5 © 2006
WL
VDD
BL BL
M1
M2
M3
M4
M5 M6Q
Cbit Cbit
Q
umum
24.036.0
umum
24.036.0
umum
24.036.0
umum
24.036.0
umum
24.048.0
umum
24.048.0

EECS 141: Spring 2006 Bill Hung and Dennis Wang
the SRAM design. Larger L can give less leakage because of longer channel length, but it adds more load to the bit line. In this design, the L of the access transistors are at their minimum lengths. In order to compensate for the minimum lenghts of the access transistors, the width (W) of the pull down transistors are increased.
Pull Down TransistorsThe width of the pull down transistors (M1 and M3) is the main parameter to optimize. The goal of the minimizing is to make sure “the SRAM still works” as expected. The critical point to meet the specification to have of below 0.4V. That is :
. According to the equation
Equation 2:Cell Ratio [Rabaey, 659]
where CR is called t he cell ratio [Rabaey, 659]
CR is about 1.2[Rabaey, 659]. So
If W5 is minimum sized, W1 is 1.2 times the minimum size. As HW3#3a suggested, the minimum NMOS has L=0.24um, and W=0.36um. So,
However, with W1 = 0.432um, the read margin exceed the 0.4V specification.
University of California, Berkeley 6 © 2006

EECS 141: Spring 2006 Bill Hung and Dennis Wang
Figure 3 Read margin and Write margin with W1 = 0.432um. Read Margin is 450mV, which is larger than the required 400mV.
Therefore, we increased the width to 0.48um, CR = 1.33, which will gives a read margin 0.3936. A read margin of 0.3936V is better than the required read margin 0.4V.Also note that the width needs to be multiple of lambda in the layout, 0.12um. At this point, both read margin and write margin are below 0.4V. Note that we could increase the width even further to lower the read margin, but since our goal is to minize the size, we used 0.48um.
Read Operation The read margin has to be met. The read margin is designed so that does not exceed 0.4V during a read operation.
Write Operation This project needs to meet the write margin. According to Professor Nikolic, the write margin is “the highest voltag on BL/ that writes a zero into the cell”.
HSPICE Stimulation As we increase the width of the pulldown nmos transistors, the read margin decreases.
University of California, Berkeley 7 © 2006
Read Margin 450mV > Required 400mV

EECS 141: Spring 2006 Bill Hung and Dennis Wang
Cadence Layout
Phase I Summary
Horizontal Length = 7.2umVertical Height = 2.16umArea = 15.552 um2 = 10802
Hours = 39 hours
University of California, Berkeley 8 © 2006

EECS 141: Spring 2006 Bill Hung and Dennis Wang
GlossaryArea
The smallest rectangle enclosing the repetitive pattern. In this case, from a contact of one side to the contact of another side.
Read Margin is designed so that does not exceed 0.4V during a read operation.
SRAMStatic Random Access Memory
Write Margin is “the highest voltag on BL/ that writes a zero into the cell
University of California, Berkeley 9 © 2006

EECS 141: Spring 2006 Bill Hung and Dennis Wang
Static Noise Margin HSPICE with Pulldown Transistor Width of 1.2*0.36
Figure 4 Static Noise Margin VTC HSPICE Plot
University of California, Berkeley 1 © 2006

EECS 141: Spring 2006 Bill Hung and Dennis Wang
Static Noise Margin
.lib '/home/ff/ee141/MODELS/g25.mod' TT
****************************************** Parameter*****************************************.param vddp=2.5.param wpulldown=0.36u*1.2.param pmoswidth=0.36u
****************************************** Netlist *****************************************VDD vdd 0 'vddp'vq q 0 2.5V
*M<name> <drain> <gate> <source> <bulk> <model> <geometry>
M1 qbar q 0 0 nmos l=0.24u w='wpulldown'M2 qbar q vdd vdd pmos l=0.24u w='pmoswidth'
****************************************** Analysis******************************************nomod= no model info from library.options post=2 nomod
*.op makes hspice determines DC operating point.op
.dc vq 0 2.5 0.01
.end
University of California, Berkeley 2 © 2006

EECS 141: Spring 2006 Bill Hung and Dennis Wang
Read Margin HSPICE Simulation
University of California, Berkeley 3 © 2006

EECS 141: Spring 2006 Bill Hung and Dennis Wang
Figure 5 Read margin VTC
** inverter subcircuit.subckt my_inv vin vout vdd vss
University of California, Berkeley 4 © 2006

EECS 141: Spring 2006 Bill Hung and Dennis Wang
.param wpulldown='0.48u'
.param pmoswidth=0.36uM1 vout vin vss vss nmos l=0.24u w='wpulldown'M2 vout vin vdd vdd pmos l=0.24u w='pmoswidth'.ends
* read margin testbench.lib '/home/ff/ee141/MODELS/g25.mod' TT.inc 'circuit.sp'Vdd vdd 0 2.5Vin VIN 0 dc 2.5xinv Vin Vout vdd 0 my_invM5 vblbar vdd Vout 0 nmos l=0.24u w=0.36uVblbar vblbar 0 2.5.dc Vin 0 2.5 0.01.option post.END
$DATA1 SOURCE='HSPICE' VERSION='V-2004.03 '.TITLE 'sram project phrase' q_max_rd q_max_wr temper alter# 1.886e-02 0.3936 25.0000 1.0000
* Write margin testbench (not required for the report).lib '/home/ff/ee141/MODELS/g25.mod' TT.inc 'circuit.sp'Vdd vdd 0 2.5Vin VIN 0 dc 2.5xinv Vin Vout vdd 0 my_invM6 vbl vdd Vout 0 nmos l=0.24u w=0.36uVbl vbl 0 0.dc Vin 0 2.5 0.01.option post.END
University of California, Berkeley 5 © 2006

EECS 141: Spring 2006 Bill Hung and Dennis Wang
Figure 6 Write 0 to q followed by a read
University of California, Berkeley 6 © 2006

EECS 141: Spring 2006 Bill Hung and Dennis Wang
SRAM PROJECT PHRASE
.lib '/home/ff/ee141/MODELS/g25.mod' TT
****************************************** Parameter*****************************************.param vddp=2.5.param vwl=2.5.param vbl=0.param vblbar=0* find the optimal nmos width.param w = 1.32.param wpulldown='0.48u'.param pmoswidth=0.36u* increase the size of capacitance.param cright=.5pF.param cleft=.5pF
****************************************** Netlist******************************************M<name> <drain> <gate> <source> <bulk> <model> <geometry>M1 qbar q 0 0 nmos l=0.24u w='wpulldown'M2 qbar q vdd vdd pmos l=0.24u w='pmoswidth'M3 q qbar 0 0 nmos l=0.24u w='wpulldown'M4 q qbar vdd vdd pmos l=0.24u w='pmoswidth'M5 qbar wl blbar 0 nmos l=0.24u w=0.36uM6 q wl bl 0 nmos l=0.24u w=0.36u
VDD vdd 0 'vddp'*VWL wl 0 'vwl'
* generate pulses for word line and bit lines. In the first cycle, write * a zero to q; in the second cycle, read 0 from q VWL wl 0 pulse(0 2.5 .5n 0.05n 0.05n 2.5n 4n)VBLBAR blbar 0 pulse(0 2.5 .3n 0.05n 0.05n 2.7n 4n)VBL bl 0 pulse(0 2.5 4.3n 0.05n 0.05n 2.7n 8n)
Cblbar blbar 0 'cleft'Cbl bl 0 'cright'
****************************************** Analysis*****************************************.options post=2 nomod.op
.tran 0.01ns 10ns *sweep w 1.08 1.8 .06* In both scenarios, we want to check the maximum voltage at q .meas q_max_wr max v(q) from=.6n to=3.5n.meas q_max_rd max v(q) from=4.6n to=7.5n
University of California, Berkeley 7 © 2006

EECS 141: Spring 2006 Bill Hung and Dennis Wang
.END
Transient Analysis with switchSRAM PROJECT PHRASE
.lib '/home/ff/ee141/MODELS/g25.mod' TT
****************************************** Parameter*****************************************.param vddp=2.5.param vwl=2.5.param vbl=0.param vblbar=0* find the optimal nmos width.param w = 1.32.param wpulldown='0.48u'.param pmoswidth=0.36u* increase the size of capacitance.param cright=.5pF.param cleft=.5pF
****************************************** Netlist******************************************M<name> <drain> <gate> <source> <bulk> <model> <geometry>M1 qbar q 0 0 nmos l=0.24u w='wpulldown'M2 qbar q vdd vdd pmos l=0.24u w='pmoswidth'M3 q qbar 0 0 nmos l=0.24u w='wpulldown'M4 q qbar vdd vdd pmos l=0.24u w='pmoswidth'M5 qbar wl blbar 0 nmos l=0.24u w=0.36uM6 q wl vx 0 nmos l=0.24u w=0.36u
* syntax for ideal switch: G1 node1 node2 VCR PWL(1) node3 V Resistance* V Resistance, where node3 is the controlling voltage. For example, the* syntax below said that the switch is controlled by phi1; if it is 0V,* the off resistance is 100Gohm; if it is 2.5V, the on resistance is 1uohmG1 vx bl VCR PWL(1) phi1 0 0,100G 2.5,1u*G2 vx 0 VCR PWL(1) phi1 0 0,100G 2.5,1u* controlling voltage sourceVphi1 phi1 0 pwl(0 0 .4n 0 0.4000001n 2.5 4.4n 2.5 4.4000001n 0 )
VDD vdd 0 'vddp'*VWL wl 0 'vwl'
* generate pulses for word line and bit lines. In the first cycle, write* a zero to q; in the second cycle, read 0 from qVWL wl 0 pulse(0 2.5 .5n 0.05n 0.05n 2.5n 4n)VBLBAR blbar 0 pulse(0 2.5 .3n 0.05n 0.05n 2.7n 4n)VBL bl 0 pulse(0 2.5 4.3n 0.05n 0.05n 2.7n 8n)
Cblbar blbar 0 'cleft'Cbl bl 0 'cright'
****************************************** Analysis*****************************************.options post=2 nomod.op
.tran 0.01ns 10ns *sweep w 1.08 1.8 .06* In both scenarios, we want to check the maximum voltage at q.meas q_max_wr max v(q) from=.6n to=3.5n.meas q_max_rd max v(q) from=4.6n to=7.5n
University of California, Berkeley 8 © 2006

EECS 141: Spring 2006 Bill Hung and Dennis Wang
.END
University of California, Berkeley 9 © 2006