ee 1130 freshman eng. design for electrical and computer … · signal processing engineer ... in...
TRANSCRIPT
3/17/2014 EE 1130 1
Class 2
Signal Processing Module (DSP).
Matlab and Simulink.
1
EE 1130 Freshman Eng. Design for Electrical and Computer Eng.

3/17/2014 EE 1130 2
Signal Processing Engineer
2
We are detectives of hidden information in signals.
Communication signals: obtain the information.
Signals from CO2 sensors, heat sensors, etc.
Data from Hard Drives.
Data from Computers to computers.
In order to do that we need to master MATHEMATICS!!
3/17/2014 EE 1130 3
Problem Statement
3
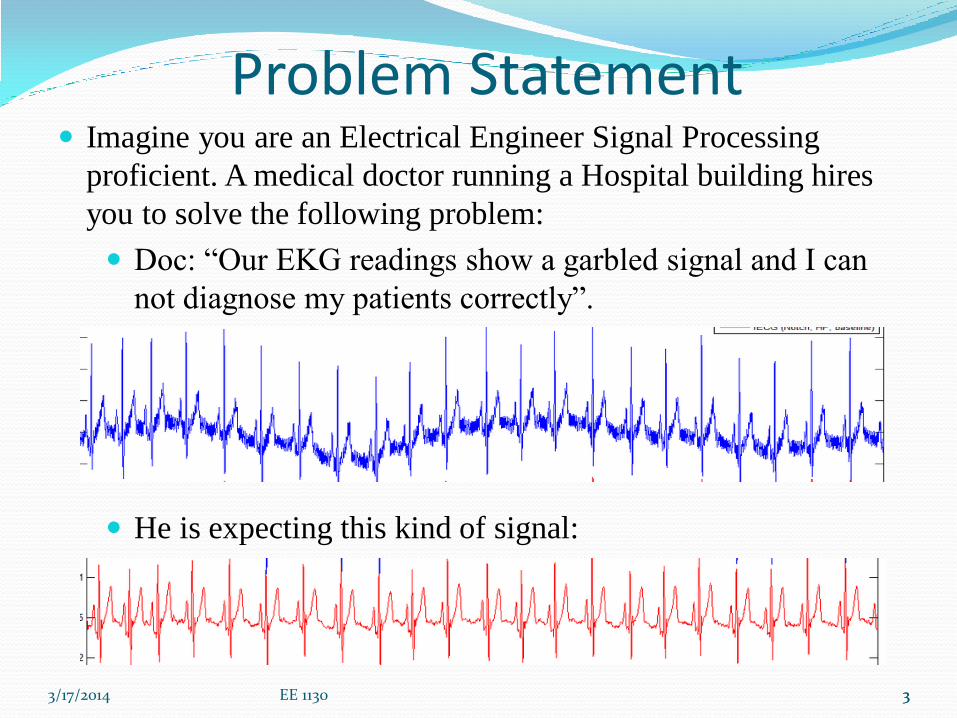
Imagine you are an Electrical Engineer Signal Processing
proficient. A medical doctor running a Hospital building hires
you to solve the following problem:
Doc: “Our EKG readings show a garbled signal and I can
not diagnose my patients correctly”.
He is expecting this kind of signal:
3/17/2014 EE 1130 4
Problem Statement
4
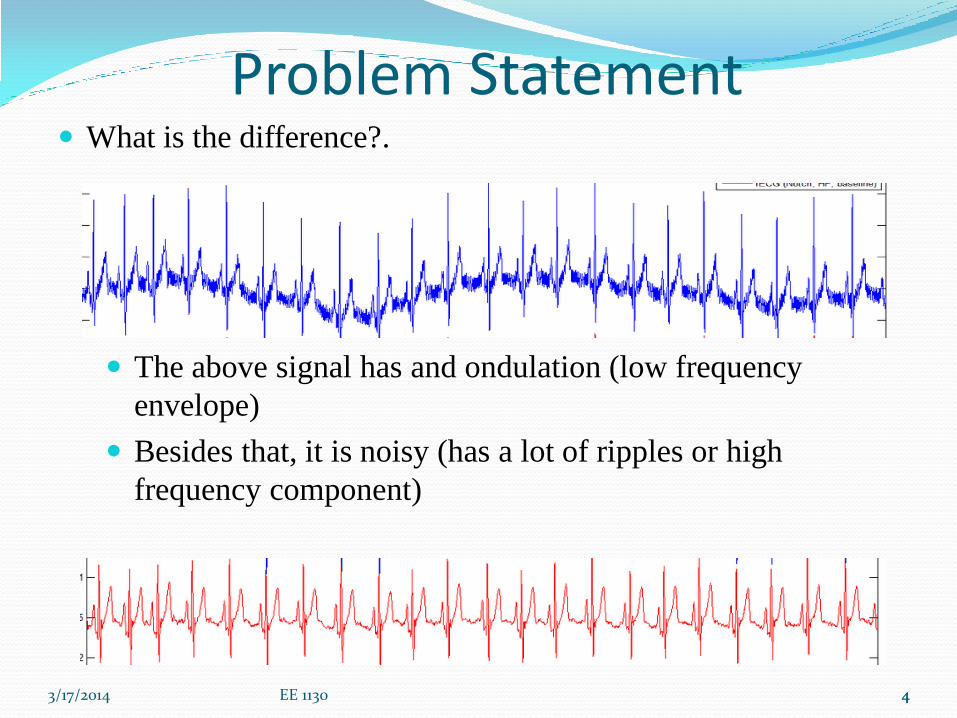
What is the difference?.
The above signal has and ondulation (low frequency
envelope)
Besides that, it is noisy (has a lot of ripples or high
frequency component)
3/17/2014 EE 1130 5
Matlab
5
Matlab is a powerful tool for mathematical/engineering research
and development. It is also useful to students to easily computate
or solve almost all mathematical and engineering problems.
This Signal Processing Module will use Matlab as a development
and teaching tool.
Matlab is learned in the course EE 3220 Software Applications
in Electric Engineering.
3/17/2014 EE 1130 6
Matlab
6
We will use the Simulink part of Matlab for two main purposes
inside this DSP Module:
We will emulate/modelate a low frequency signal corrupted
with an additive noise (high frequency signal).
Design and implement a FILTER that will eliminate a high
frequency component (ripple or noise) meanwhile leaving
untouched a low frequency sine wave.
This phenomenon is common in any electrical system, where
the 60Hz signal from the power lines corrupt a signal of
interest as an Electro EncephaloGram (EEG), Electro
CardioGram (EKG), or just a sinewave.

3/17/2014 EE 1130 7
Matlab
7
To run Matlab, just double click on the matlab icon.
3/17/2014 EE 1130 8
Matlab
8
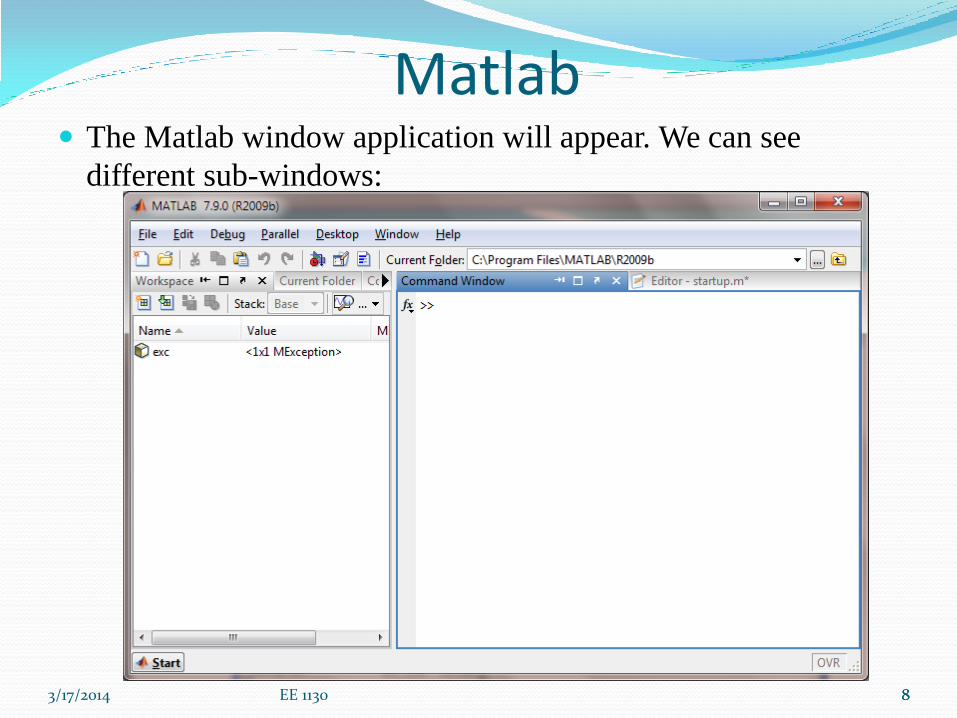
The Matlab window application will appear. We can see
different sub-windows:

3/17/2014 EE 1130 9
Matlab
9
Command window: is the one where the user writes the
variables and where the results are displayed
Workspace window: is the one where the user can see the
variables.
3/17/2014 EE 1130 10
Matlab
10
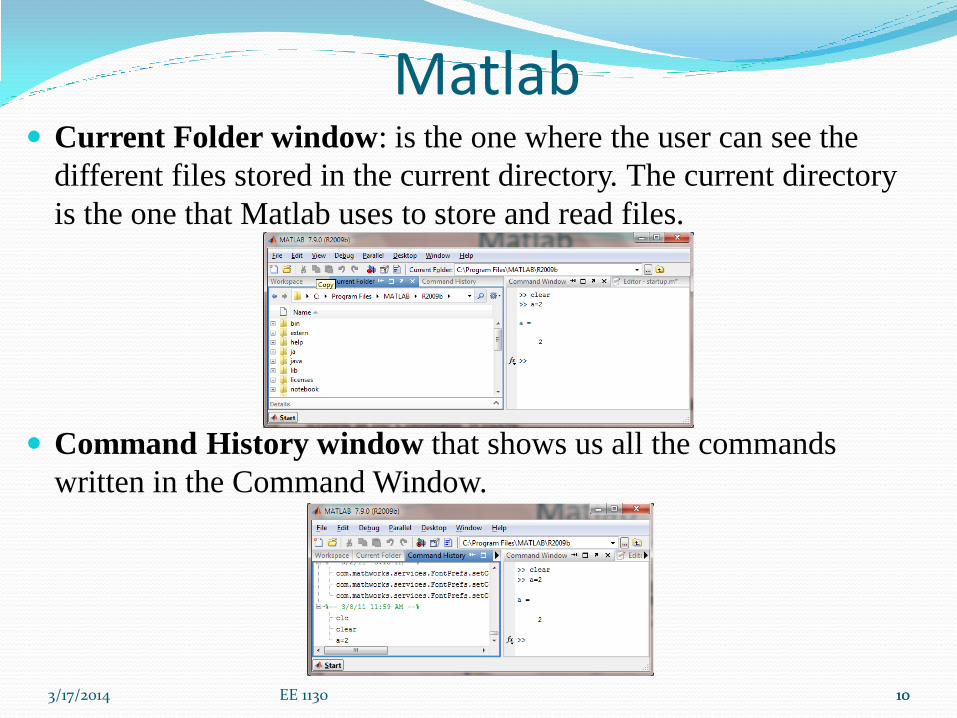
Current Folder window: is the one where the user can see the
different files stored in the current directory. The current directory
is the one that Matlab uses to store and read files.
Command History window that shows us all the commands
written in the Command Window.

3/17/2014 EE 1130 11
Simulink
11
Simulink is part of Matlab. Simulink works by interconecting
blocks. Each block is in fact a matlab function with input and
output parameters.
To open simulink click on the Simulink icon as shown:
3/17/2014 EE 1130 12
Simulink
12
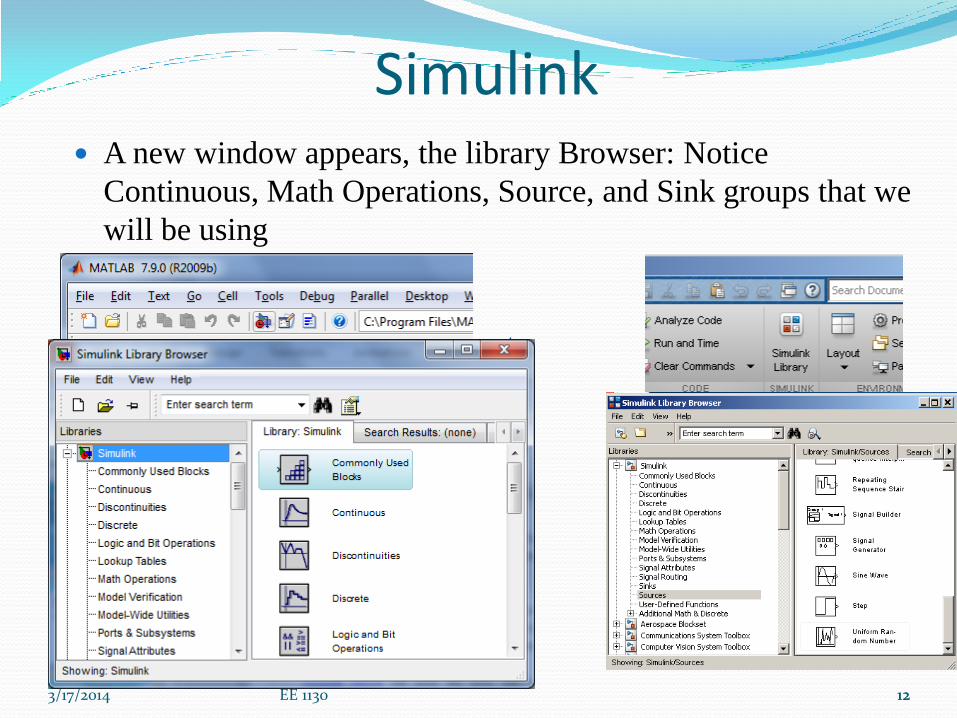
A new window appears, the library Browser: Notice
Continuous, Math Operations, Source, and Sink groups that we
will be using
3/17/2014 EE 1130 13
Simulink
13
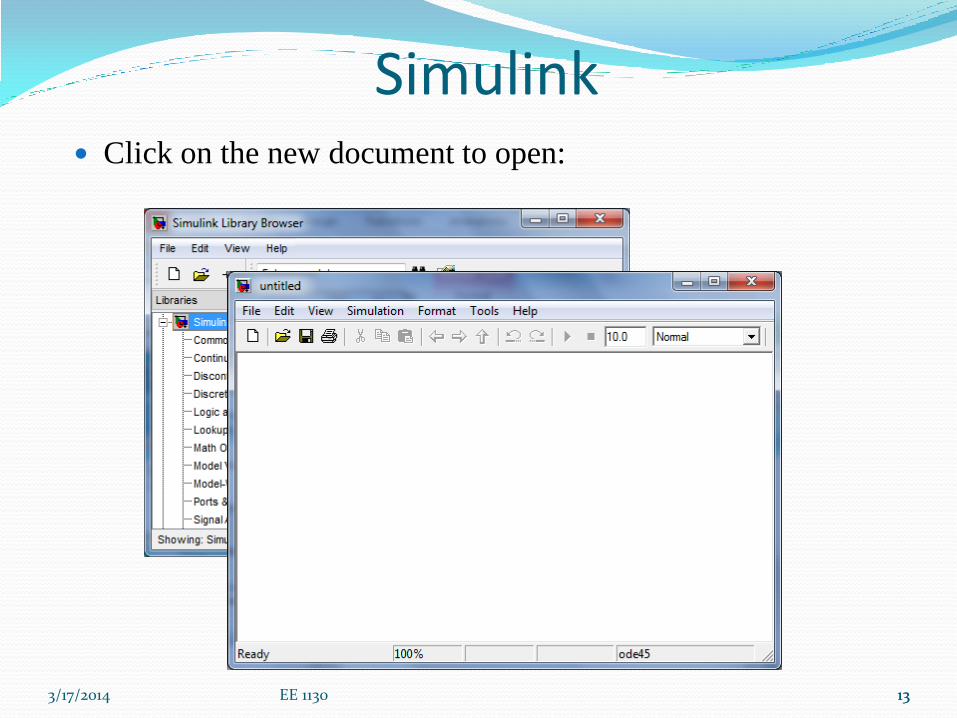
Click on the new document to open:
3/17/2014 EE 1130 14
Simulink: Sinewaves.
14
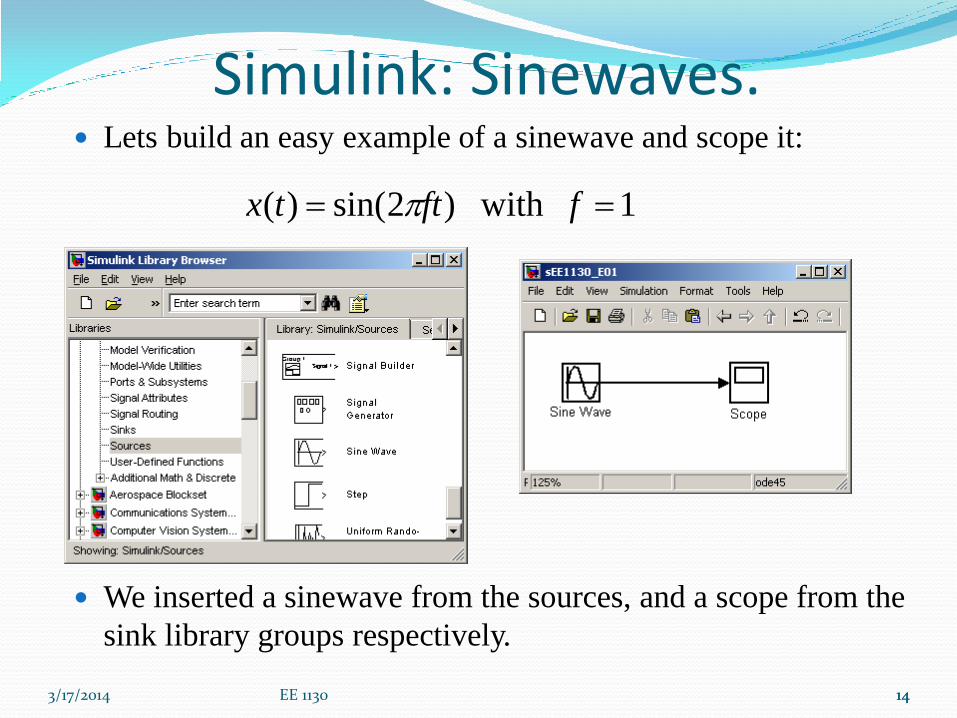
Lets build an easy example of a sinewave and scope it:
We inserted a sinewave from the sources, and a scope from the
sink library groups respectively.
1with)2sin()( ffttx

3/17/2014 EE 1130 15
Simulink: Sinewaves.
15
By double clicking on the Sine Wave box we open its
properties box and set the angular frequecy to 2*pi*1:
1with)2sin()( ffttx
3/17/2014 EE 1130 16
Simulink: Sinewaves.
16
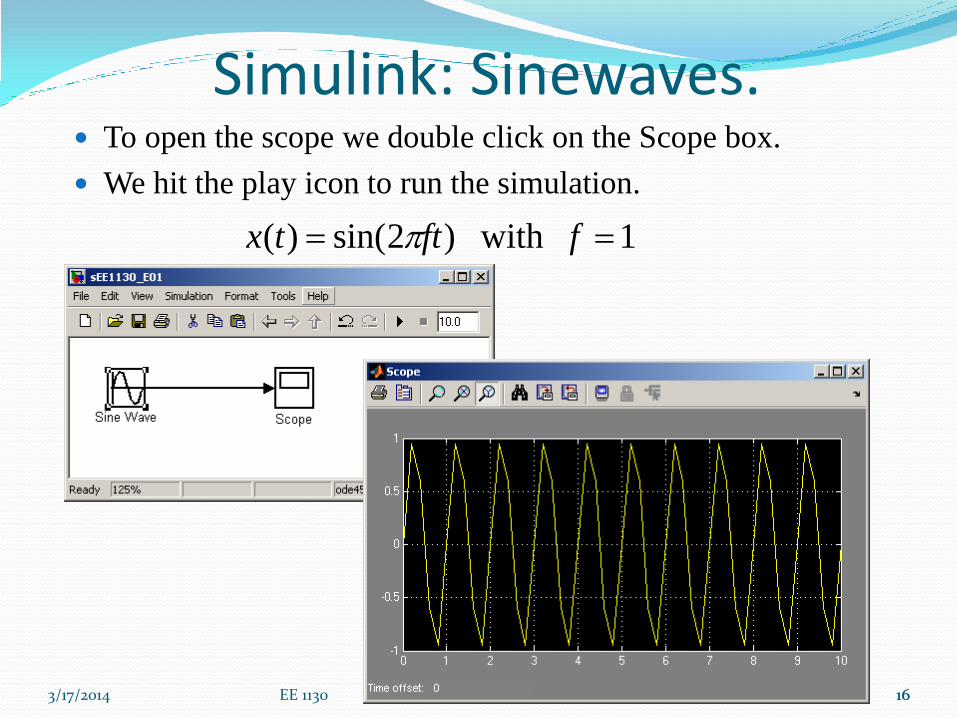
To open the scope we double click on the Scope box.
We hit the play icon to run the simulation.
1with)2sin()( ffttx

3/17/2014 EE 1130 17
Simulink: Sinewaves.
17
To obtain a better view of the sinewave, we reduce the running
time to 3 seconds as shown in next figure:
Click on the binoculars to zoom the signal so it fills the Scope.
1with)2sin()( ffttx
3/17/2014 EE 1130 18
Simulink: Sum of Sinewaves.
18
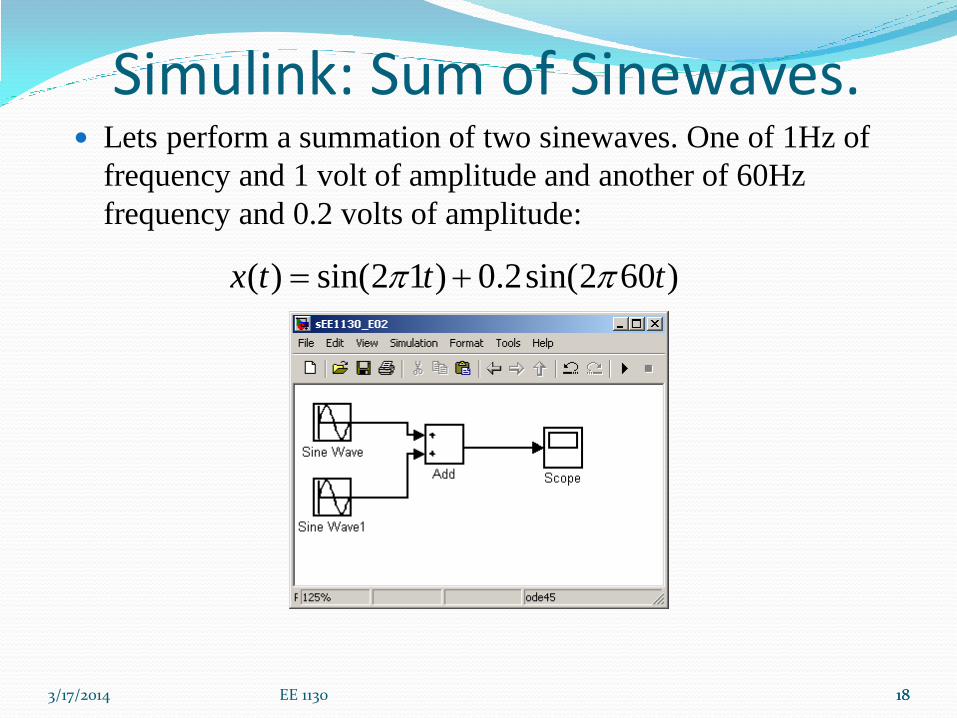
Lets perform a summation of two sinewaves. One of 1Hz of
frequency and 1 volt of amplitude and another of 60Hz
frequency and 0.2 volts of amplitude:
)602sin(2.0)12sin()( tttx

3/17/2014 EE 1130 19
Simulink: Sum of Sinewaves.
19
We need to click on each sinewave box to set up the amplitude
and frequencies: )602sin(2.0)12sin()( tttx
3/17/2014 EE 1130 20
Simulink: Sum of Sinewaves.
20
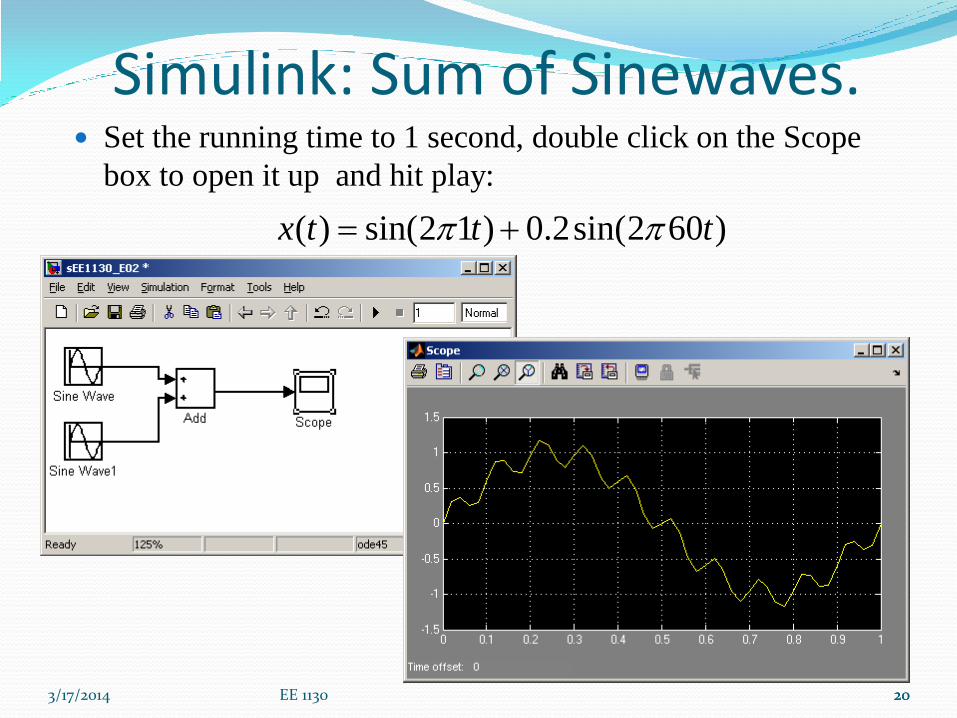
Set the running time to 1 second, double click on the Scope
box to open it up and hit play:
)602sin(2.0)12sin()( tttx
3/17/2014 EE 1130 21
Simulink: Sum of Sinewaves.
21
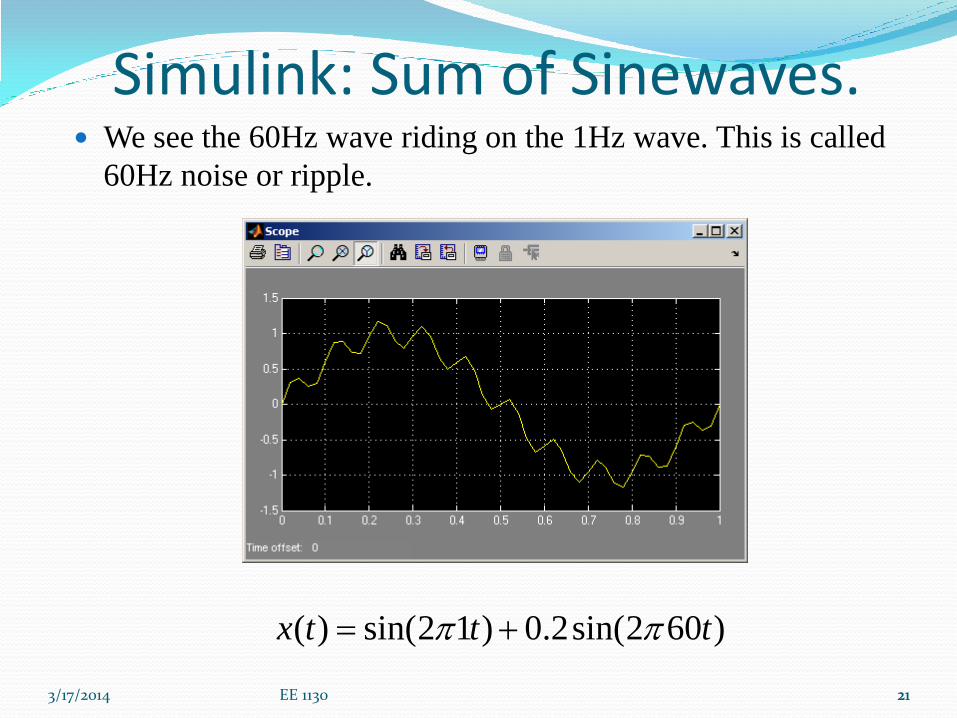
We see the 60Hz wave riding on the 1Hz wave. This is called
60Hz noise or ripple.
)602sin(2.0)12sin()( tttx
3/17/2014 EE 1130 22
Simulink: Sum of Sinewaves.
22
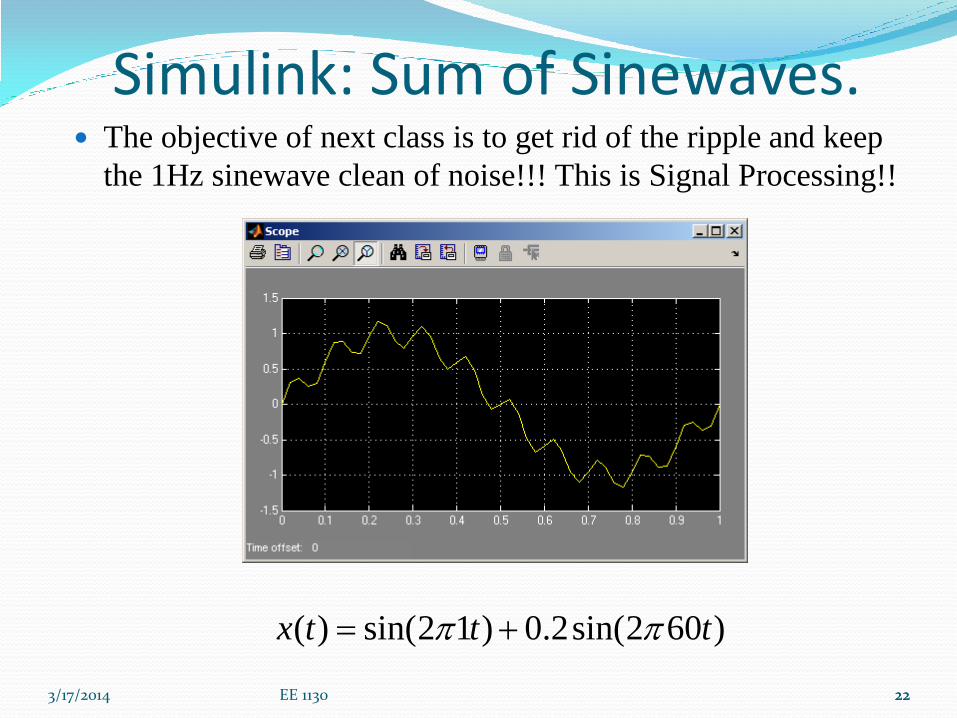
The objective of next class is to get rid of the ripple and keep
the 1Hz sinewave clean of noise!!! This is Signal Processing!!
)602sin(2.0)12sin()( tttx

3/17/2014 EE 1130 23
Emulation of an EKG signal
23
There is a code that I copied emulaing a EKG signal!!
0 100 200 300 400 500 6000
0.2
0.4
0.6
0.8
1
1.2
1.4
3/17/2014 EE 1130 24
Emulation of an EKG signal
24
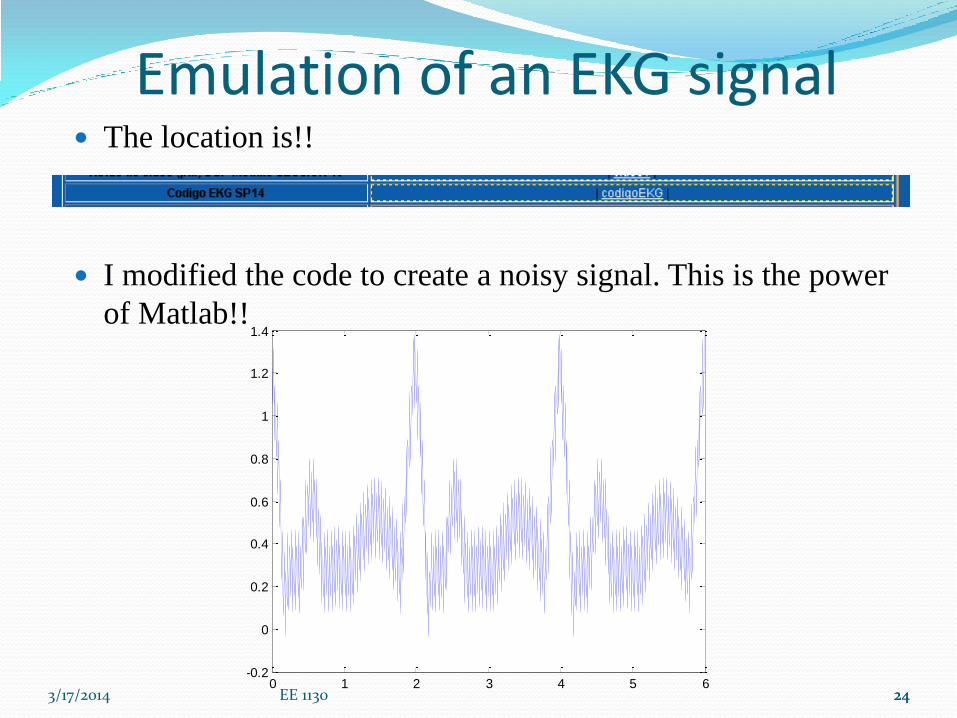
The location is!!
I modified the code to create a noisy signal. This is the power
of Matlab!!
0 1 2 3 4 5 6-0.2
0
0.2
0.4
0.6
0.8
1
1.2
1.4

3/17/2014 EE 1130 25 25
End of Class