education - boston.gov · education • cabinet 207 ... • general laws and liberties of the...
TRANSCRIPT
E d u c a t i o n • C a b i n e t 2 0 7
Education
Education Cabinet
Education ............................................................................................ 209 Boston Public Schools ............................................................. 210
General School Purposes .......................................... 218 Boston Public Schools Capital Budget .................... 220

2 0 8 E d u c a t i o n • C a b i n e t
E d u c a t i o n • C a b i n e t 2 0 9
Education
Education
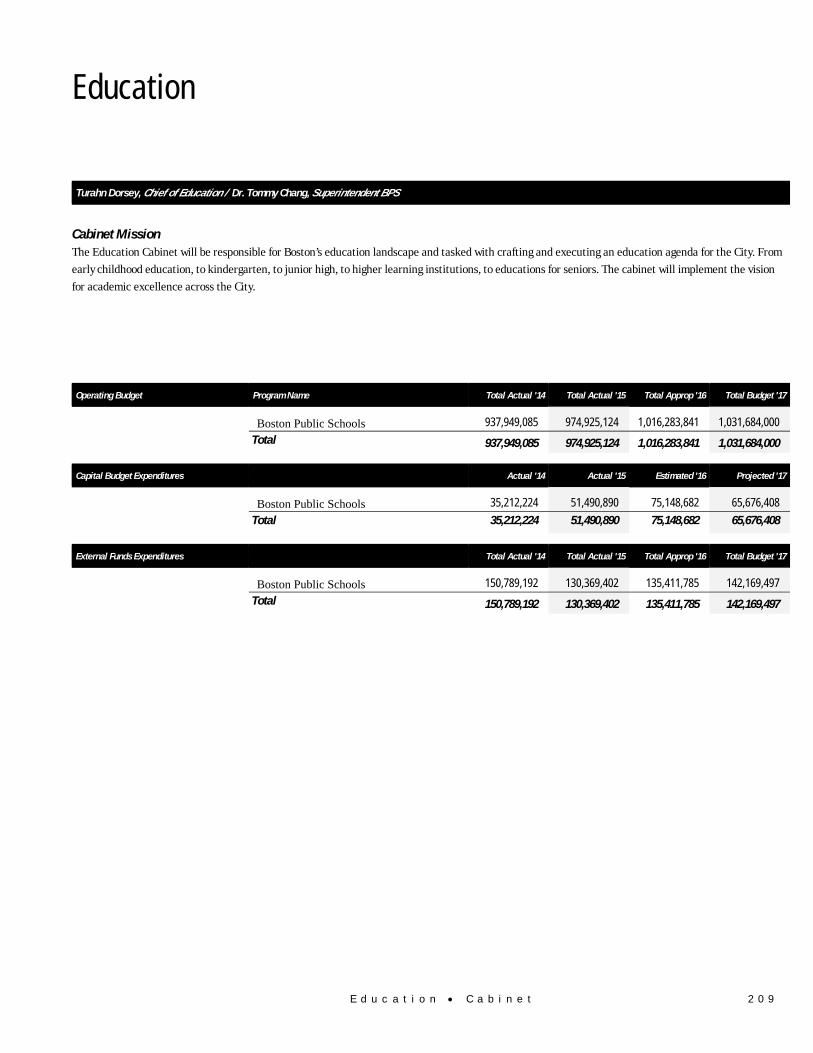
Turahn Dorsey, Chief of Education / Dr. Tommy Chang, Superintendent BPS
Cabinet Mission The Education Cabinet will be responsible for Boston’s education landscape and tasked with crafting and executing an education agenda for the City. From
early childhood education, to kindergarten, to junior high, to higher learning institutions, to educations for seniors. The cabinet will implement the vision
for academic excellence across the City.
Operating Budget Program Name Total Actual '14 Total Actual '15 Total Approp '16 Total Budget '17
Boston Public Schools 937,949,085 974,925,124 1,016,283,841 1,031,684,000
Total 937,949,085 974,925,124 1,016,283,841 1,031,684,000
Capital Budget Expenditures Actual '14 Actual '15 Estimated '16 Projected '17
Boston Public Schools 35,212,224 51,490,890 75,148,682 65,676,408 Total 35,212,224 51,490,890 75,148,682 65,676,408
External Funds Expenditures Total Actual '14 Total Actual '15 Total Approp '16 Total Budget '17
Boston Public Schools 150,789,192 130,369,402 135,411,785 142,169,497Total 150,789,192 130,369,402 135,411,785 142,169,497
2 1 0 E d u c a t i o n • B o s t o n P u b l i c S c h o o l s
Boston Public Schools Operating Budget
Education Boston Public Schools
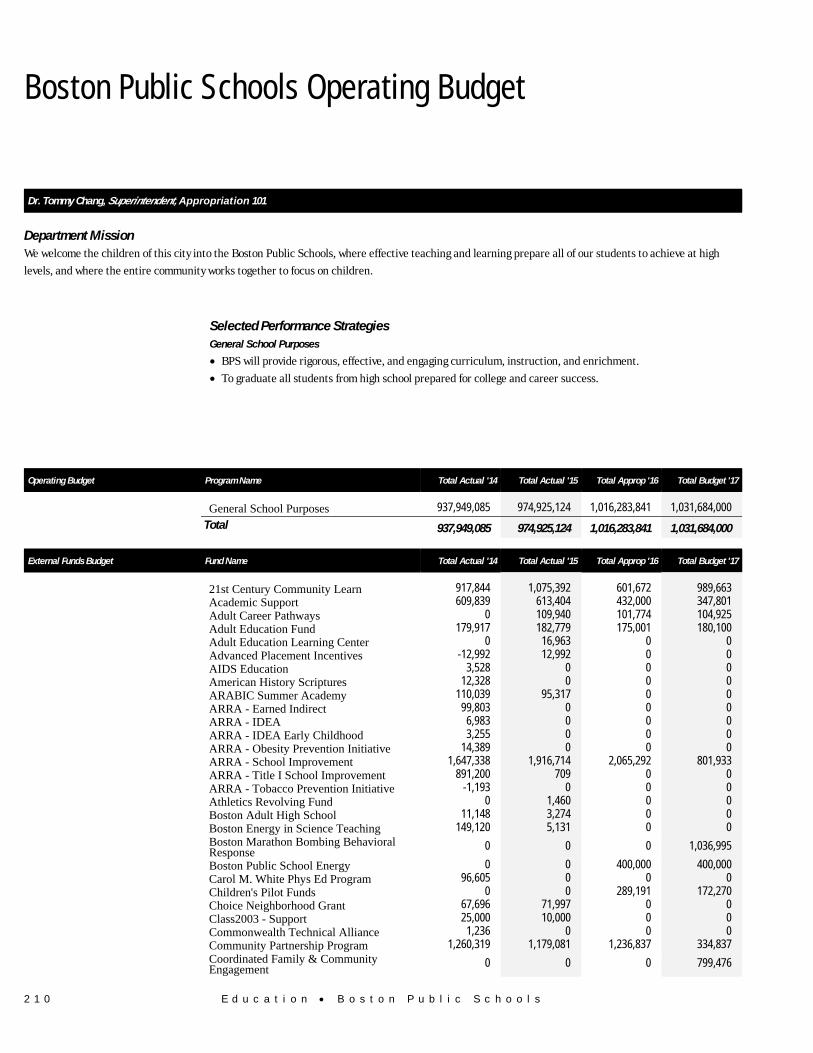
Dr. Tommy Chang, Superintendent, Appropriation 101
Department Mission We welcome the children of this city into the Boston Public Schools, where effective teaching and learning prepare all of our students to achieve at high
levels, and where the entire community works together to focus on children.
Selected Performance Strategies General School Purposes
• BPS will provide rigorous, effective, and engaging curriculum, instruction, and enrichment.
• To graduate all students from high school prepared for college and career success.
Operating Budget Program Name Total Actual '14 Total Actual '15 Total Approp '16 Total Budget '17
General School Purposes 937,949,085 974,925,124 1,016,283,841 1,031,684,000
Total 937,949,085 974,925,124 1,016,283,841 1,031,684,000
External Funds Budget Fund Name Total Actual '14 Total Actual '15 Total Approp '16 Total Budget '17
21st Century Community Learn 917,844 1,075,392 601,672 989,663Academic Support 609,839 613,404 432,000 347,801Adult Career Pathways 0 109,940 101,774 104,925Adult Education Fund 179,917 182,779 175,001 180,100Adult Education Learning Center 0 16,963 0 0Advanced Placement Incentives -12,992 12,992 0 0AIDS Education 3,528 0 0 0American History Scriptures 12,328 0 0 0ARABIC Summer Academy 110,039 95,317 0 0ARRA - Earned Indirect 99,803 0 0 0ARRA - IDEA 6,983 0 0 0ARRA - IDEA Early Childhood 3,255 0 0 0ARRA - Obesity Prevention Initiative 14,389 0 0 0ARRA - School Improvement 1,647,338 1,916,714 2,065,292 801,933ARRA - Title I School Improvement 891,200 709 0 0ARRA - Tobacco Prevention Initiative -1,193 0 0 0Athletics Revolving Fund 0 1,460 0 0Boston Adult High School 11,148 3,274 0 0Boston Energy in Science Teaching 149,120 5,131 0 0
Boston Marathon Bombing Behavioral Response 0 0 0 1,036,995
Boston Public School Energy 0 0 400,000 400,000Carol M. White Phys Ed Program 96,605 0 0 0Children's Pilot Funds 0 0 289,191 172,270Choice Neighborhood Grant 67,696 71,997 0 0Class2003 - Support 25,000 10,000 0 0Commonwealth Technical Alliance 1,236 0 0 0Community Partnership Program 1,260,319 1,179,081 1,236,837 334,837
Coordinated Family & Community Engagement 0 0 0 799,476
E d u c a t i o n • B o s t o n P u b l i c S c h o o l s 2 1 1
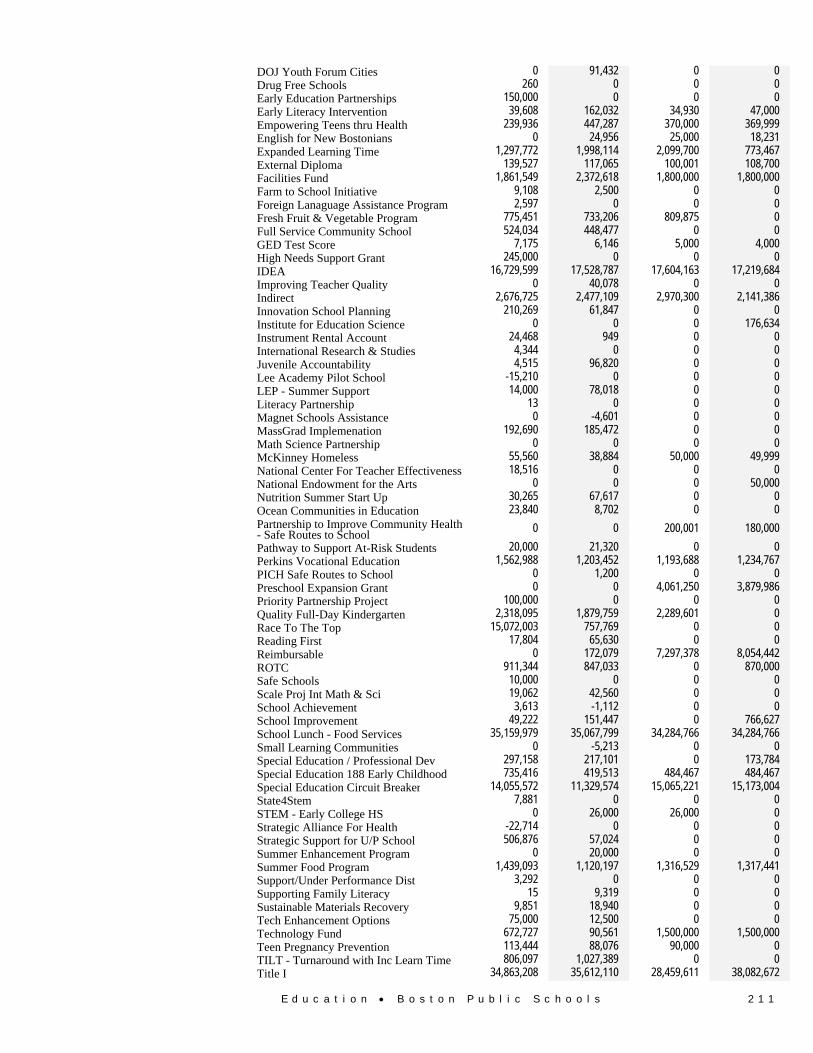
DOJ Youth Forum Cities 0 91,432 0 0Drug Free Schools 260 0 0 0Early Education Partnerships 150,000 0 0 0Early Literacy Intervention 39,608 162,032 34,930 47,000Empowering Teens thru Health 239,936 447,287 370,000 369,999English for New Bostonians 0 24,956 25,000 18,231Expanded Learning Time 1,297,772 1,998,114 2,099,700 773,467External Diploma 139,527 117,065 100,001 108,700Facilities Fund 1,861,549 2,372,618 1,800,000 1,800,000Farm to School Initiative 9,108 2,500 0 0Foreign Lanaguage Assistance Program 2,597 0 0 0Fresh Fruit & Vegetable Program 775,451 733,206 809,875 0Full Service Community School 524,034 448,477 0 0GED Test Score 7,175 6,146 5,000 4,000High Needs Support Grant 245,000 0 0 0IDEA 16,729,599 17,528,787 17,604,163 17,219,684Improving Teacher Quality 0 40,078 0 0Indirect 2,676,725 2,477,109 2,970,300 2,141,386Innovation School Planning 210,269 61,847 0 0Institute for Education Science 0 0 0 176,634Instrument Rental Account 24,468 949 0 0International Research & Studies 4,344 0 0 0Juvenile Accountability 4,515 96,820 0 0Lee Academy Pilot School -15,210 0 0 0LEP - Summer Support 14,000 78,018 0 0Literacy Partnership 13 0 0 0Magnet Schools Assistance 0 -4,601 0 0MassGrad Implemenation 192,690 185,472 0 0Math Science Partnership 0 0 0 0McKinney Homeless 55,560 38,884 50,000 49,999National Center For Teacher Effectiveness 18,516 0 0 0National Endowment for the Arts 0 0 0 50,000Nutrition Summer Start Up 30,265 67,617 0 0Ocean Communities in Education 23,840 8,702 0 0
Partnership to Improve Community Health - Safe Routes to School 0 0 200,001 180,000
Pathway to Support At-Risk Students 20,000 21,320 0 0Perkins Vocational Education 1,562,988 1,203,452 1,193,688 1,234,767PICH Safe Routes to School 0 1,200 0 0Preschool Expansion Grant 0 0 4,061,250 3,879,986Priority Partnership Project 100,000 0 0 0Quality Full-Day Kindergarten 2,318,095 1,879,759 2,289,601 0Race To The Top 15,072,003 757,769 0 0Reading First 17,804 65,630 0 0Reimbursable 0 172,079 7,297,378 8,054,442ROTC 911,344 847,033 0 870,000Safe Schools 10,000 0 0 0Scale Proj Int Math & Sci 19,062 42,560 0 0School Achievement 3,613 -1,112 0 0School Improvement 49,222 151,447 0 766,627School Lunch - Food Services 35,159,979 35,067,799 34,284,766 34,284,766Small Learning Communities 0 -5,213 0 0Special Education / Professional Dev 297,158 217,101 0 173,784Special Education 188 Early Childhood 735,416 419,513 484,467 484,467Special Education Circuit Breaker 14,055,572 11,329,574 15,065,221 15,173,004State4Stem 7,881 0 0 0STEM - Early College HS 0 26,000 26,000 0Strategic Alliance For Health -22,714 0 0 0Strategic Support for U/P School 506,876 57,024 0 0Summer Enhancement Program 0 20,000 0 0Summer Food Program 1,439,093 1,120,197 1,316,529 1,317,441Support/Under Performance Dist 3,292 0 0 0Supporting Family Literacy 15 9,319 0 0Sustainable Materials Recovery 9,851 18,940 0 0Tech Enhancement Options 75,000 12,500 0 0Technology Fund 672,727 90,561 1,500,000 1,500,000Teen Pregnancy Prevention 113,444 88,076 90,000 0TILT - Turnaround with Inc Learn Time 806,097 1,027,389 0 0Title I 34,863,208 35,612,110 28,459,611 38,082,672
2 1 2 E d u c a t i o n • B o s t o n P u b l i c S c h o o l s
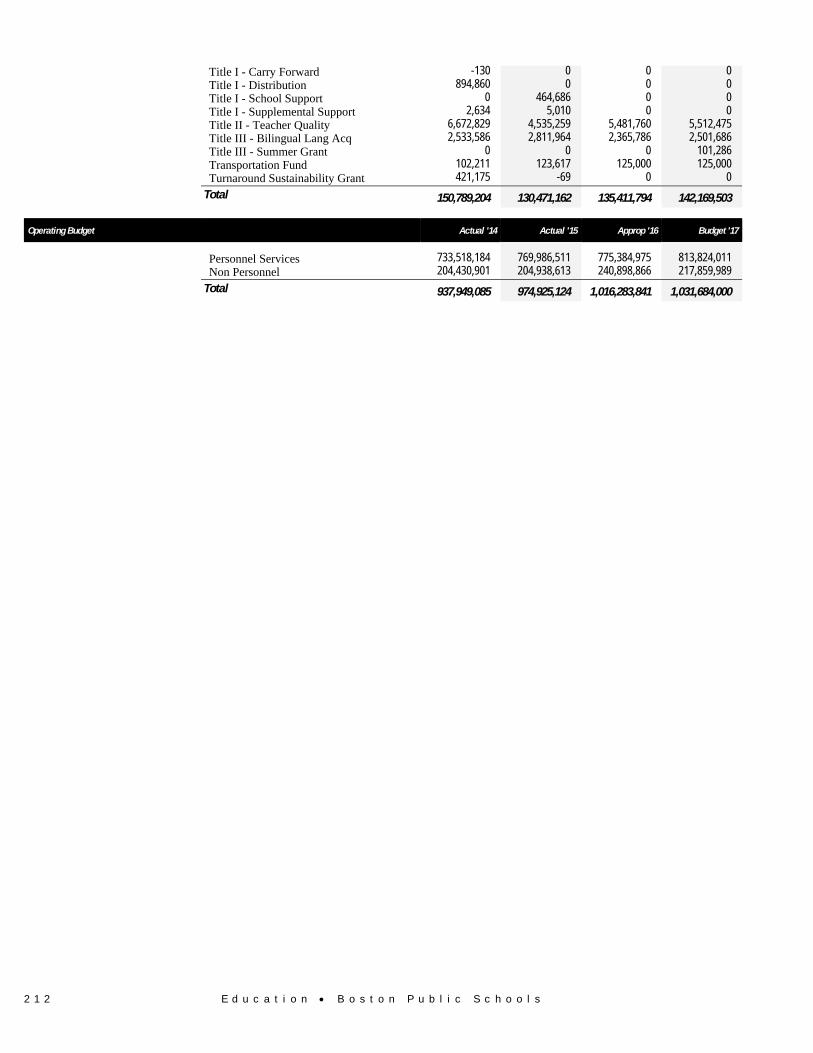
Title I - Carry Forward -130 0 0 0Title I - Distribution 894,860 0 0 0Title I - School Support 0 464,686 0 0Title I - Supplemental Support 2,634 5,010 0 0Title II - Teacher Quality 6,672,829 4,535,259 5,481,760 5,512,475Title III - Bilingual Lang Acq 2,533,586 2,811,964 2,365,786 2,501,686Title III - Summer Grant 0 0 0 101,286Transportation Fund 102,211 123,617 125,000 125,000Turnaround Sustainability Grant 421,175 -69 0 0
Total 150,789,204 130,471,162 135,411,794 142,169,503
Operating Budget Actual '14 Actual '15 Approp '16 Budget '17
Personnel Services 733,518,184 769,986,511 775,384,975 813,824,011 Non Personnel 204,430,901 204,938,613 240,898,866 217,859,989
Total 937,949,085 974,925,124 1,016,283,841 1,031,684,000
E d u c a t i o n • B o s t o n P u b l i c S c h o o l s 2 1 3
Boston Public Schools Operating Budget
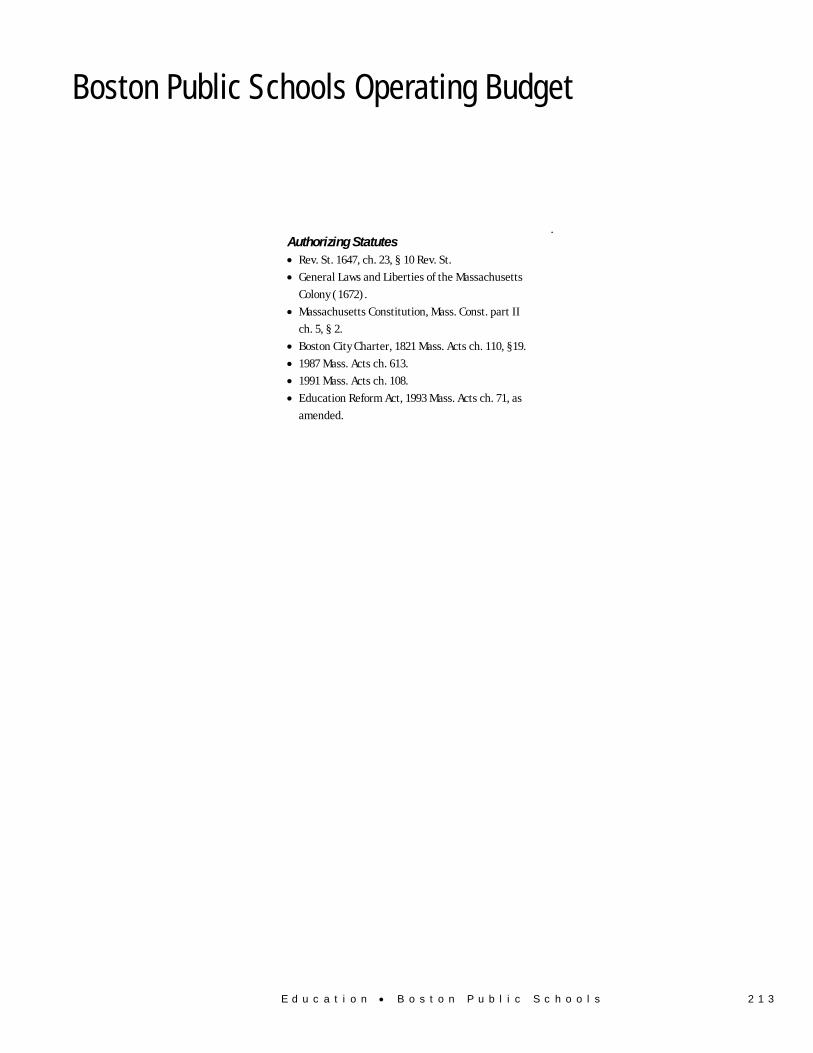
Authorizing Statutes • Rev. St. 1647, ch. 23, § 10 Rev. St.
• General Laws and Liberties of the Massachusetts
Colony (1672).
• Massachusetts Constitution, Mass. Const. part II
ch. 5, § 2.
• Boston City Charter, 1821 Mass. Acts ch. 110, §19.
• 1987 Mass. Acts ch. 613.
• 1991 Mass. Acts ch. 108.
• Education Reform Act, 1993 Mass. Acts ch. 71, as
amended.
.
2 1 4 E d u c a t i o n • B o s t o n P u b l i c S c h o o l s
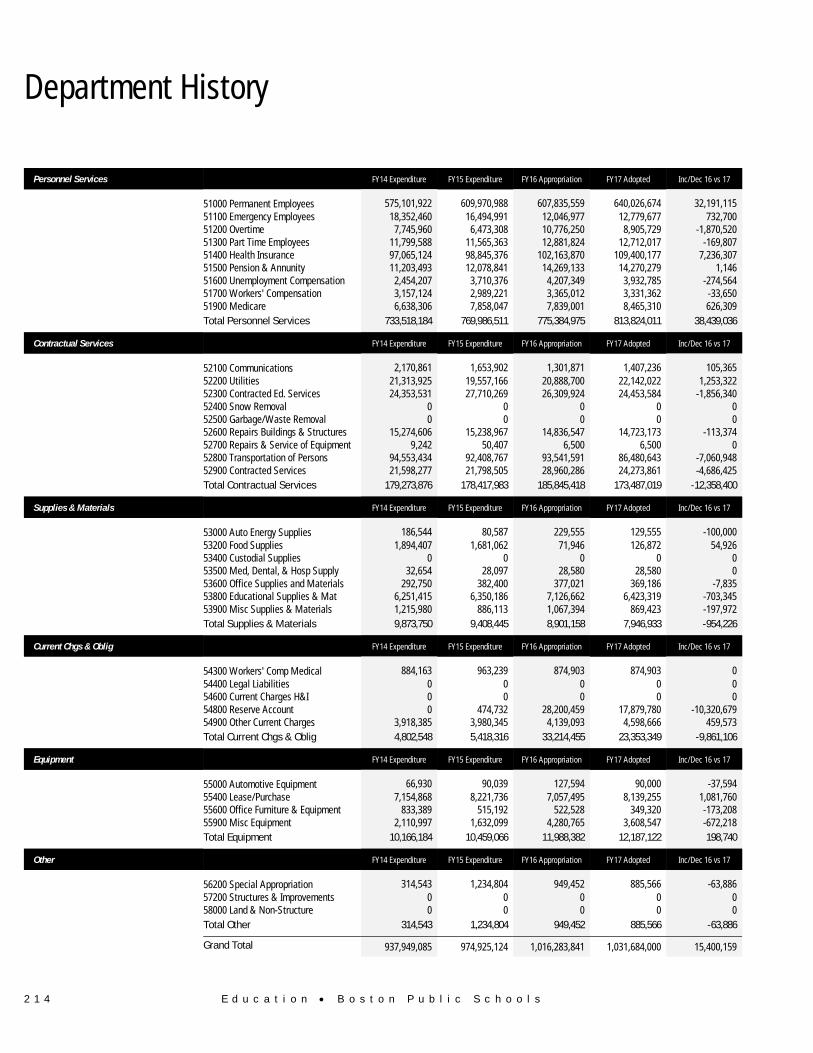
Department History
Personnel Services FY14 Expenditure FY15 Expenditure FY16 Appropriation FY17 Adopted Inc/Dec 16 vs 17
51000 Permanent Employees 575,101,922 609,970,988 607,835,559 640,026,674 32,191,115 51100 Emergency Employees 18,352,460 16,494,991 12,046,977 12,779,677 732,700 51200 Overtime 7,745,960 6,473,308 10,776,250 8,905,729 -1,870,520 51300 Part Time Employees 11,799,588 11,565,363 12,881,824 12,712,017 -169,807 51400 Health Insurance 97,065,124 98,845,376 102,163,870 109,400,177 7,236,307 51500 Pension & Annunity 11,203,493 12,078,841 14,269,133 14,270,279 1,146 51600 Unemployment Compensation 2,454,207 3,710,376 4,207,349 3,932,785 -274,564 51700 Workers' Compensation 3,157,124 2,989,221 3,365,012 3,331,362 -33,650 51900 Medicare 6,638,306 7,858,047 7,839,001 8,465,310 626,309 Total Personnel Services 733,518,184 769,986,511 775,384,975 813,824,011 38,439,036
Contractual Services FY14 Expenditure FY15 Expenditure FY16 Appropriation FY17 Adopted Inc/Dec 16 vs 17
52100 Communications 2,170,861 1,653,902 1,301,871 1,407,236 105,365 52200 Utilities 21,313,925 19,557,166 20,888,700 22,142,022 1,253,322 52300 Contracted Ed. Services 24,353,531 27,710,269 26,309,924 24,453,584 -1,856,340 52400 Snow Removal 0 0 0 0 0 52500 Garbage/Waste Removal 0 0 0 0 0 52600 Repairs Buildings & Structures 15,274,606 15,238,967 14,836,547 14,723,173 -113,374 52700 Repairs & Service of Equipment 9,242 50,407 6,500 6,500 0 52800 Transportation of Persons 94,553,434 92,408,767 93,541,591 86,480,643 -7,060,948 52900 Contracted Services 21,598,277 21,798,505 28,960,286 24,273,861 -4,686,425 Total Contractual Services 179,273,876 178,417,983 185,845,418 173,487,019 -12,358,400
Supplies & Materials FY14 Expenditure FY15 Expenditure FY16 Appropriation FY17 Adopted Inc/Dec 16 vs 17
53000 Auto Energy Supplies 186,544 80,587 229,555 129,555 -100,000 53200 Food Supplies 1,894,407 1,681,062 71,946 126,872 54,926 53400 Custodial Supplies 0 0 0 0 0 53500 Med, Dental, & Hosp Supply 32,654 28,097 28,580 28,580 0 53600 Office Supplies and Materials 292,750 382,400 377,021 369,186 -7,835 53800 Educational Supplies & Mat 6,251,415 6,350,186 7,126,662 6,423,319 -703,345 53900 Misc Supplies & Materials 1,215,980 886,113 1,067,394 869,423 -197,972 Total Supplies & Materials 9,873,750 9,408,445 8,901,158 7,946,933 -954,226
Current Chgs & Oblig FY14 Expenditure FY15 Expenditure FY16 Appropriation FY17 Adopted Inc/Dec 16 vs 17
54300 Workers' Comp Medical 884,163 963,239 874,903 874,903 0 54400 Legal Liabilities 0 0 0 0 0 54600 Current Charges H&I 0 0 0 0 0 54800 Reserve Account 0 474,732 28,200,459 17,879,780 -10,320,679 54900 Other Current Charges 3,918,385 3,980,345 4,139,093 4,598,666 459,573 Total Current Chgs & Oblig 4,802,548 5,418,316 33,214,455 23,353,349 -9,861,106
Equipment FY14 Expenditure FY15 Expenditure FY16 Appropriation FY17 Adopted Inc/Dec 16 vs 17
55000 Automotive Equipment 66,930 90,039 127,594 90,000 -37,594 55400 Lease/Purchase 7,154,868 8,221,736 7,057,495 8,139,255 1,081,760 55600 Office Furniture & Equipment 833,389 515,192 522,528 349,320 -173,208 55900 Misc Equipment 2,110,997 1,632,099 4,280,765 3,608,547 -672,218 Total Equipment 10,166,184 10,459,066 11,988,382 12,187,122 198,740
Other FY14 Expenditure FY15 Expenditure FY16 Appropriation FY17 Adopted Inc/Dec 16 vs 17
56200 Special Appropriation 314,543 1,234,804 949,452 885,566 -63,886 57200 Structures & Improvements 0 0 0 0 0 58000 Land & Non-Structure 0 0 0 0 0 Total Other 314,543 1,234,804 949,452 885,566 -63,886
Grand Total 937,949,085 974,925,124 1,016,283,841 1,031,684,000 15,400,159
E d u c a t i o n • B o s t o n P u b l i c S c h o o l s 2 1 5
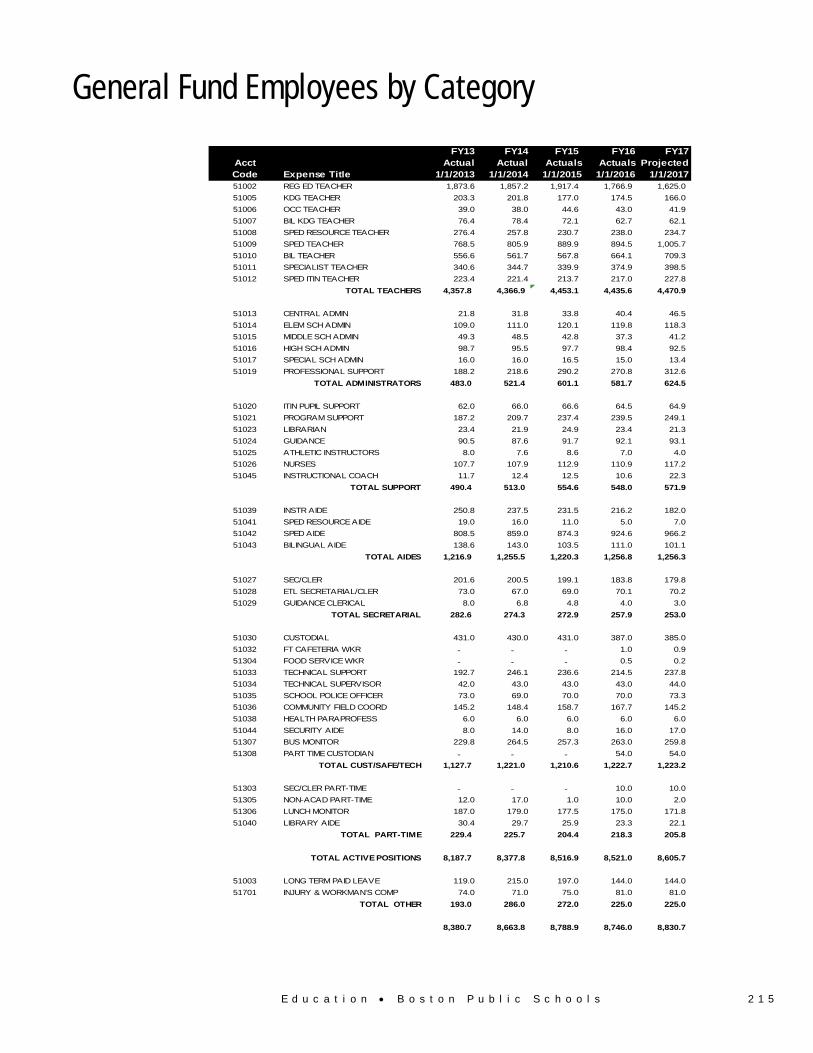
General Fund Employees by Category
FY13 FY14 FY15 FY16 FY17Acct Actual Actual Actuals Actuals ProjectedCode Expense Title 1/1/2013 1/1/2014 1/1/2015 1/1/2016 1/1/201751002 REG ED TEACHER 1,873.6 1,857.2 1,917.4 1,766.9 1,625.0 51005 KDG TEACHER 203.3 201.8 177.0 174.5 166.0 51006 OCC TEACHER 39.0 38.0 44.6 43.0 41.9 51007 BIL KDG TEACHER 76.4 78.4 72.1 62.7 62.1 51008 SPED RESOURCE TEACHER 276.4 257.8 230.7 238.0 234.7 51009 SPED TEACHER 768.5 805.9 889.9 894.5 1,005.7 51010 BIL TEACHER 556.6 561.7 567.8 664.1 709.3 51011 SPECIALIST TEACHER 340.6 344.7 339.9 374.9 398.5 51012 SPED ITIN TEACHER 223.4 221.4 213.7 217.0 227.8
TOTAL TEACHERS 4,357.8 4,366.9 4,453.1 4,435.6 4,470.9
51013 CENTRAL ADMIN 21.8 31.8 33.8 40.4 46.5 51014 ELEM SCH ADMIN 109.0 111.0 120.1 119.8 118.3 51015 MIDDLE SCH ADMIN 49.3 48.5 42.8 37.3 41.2 51016 HIGH SCH ADMIN 98.7 95.5 97.7 98.4 92.5 51017 SPECIAL SCH ADMIN 16.0 16.0 16.5 15.0 13.4 51019 PROFESSIONAL SUPPORT 188.2 218.6 290.2 270.8 312.6
TOTAL ADMINISTRATORS 483.0 521.4 601.1 581.7 624.5
51020 ITIN PUPIL SUPPORT 62.0 66.0 66.6 64.5 64.9 51021 PROGRAM SUPPORT 187.2 209.7 237.4 239.5 249.1 51023 LIBRARIAN 23.4 21.9 24.9 23.4 21.3 51024 GUIDANCE 90.5 87.6 91.7 92.1 93.1 51025 ATHLETIC INSTRUCTORS 8.0 7.6 8.6 7.0 4.0 51026 NURSES 107.7 107.9 112.9 110.9 117.2 51045 INSTRUCTIONAL COACH 11.7 12.4 12.5 10.6 22.3
TOTAL SUPPORT 490.4 513.0 554.6 548.0 571.9
51039 INSTR AIDE 250.8 237.5 231.5 216.2 182.0 51041 SPED RESOURCE AIDE 19.0 16.0 11.0 5.0 7.0 51042 SPED AIDE 808.5 859.0 874.3 924.6 966.2 51043 BILINGUAL AIDE 138.6 143.0 103.5 111.0 101.1
TOTAL AIDES 1,216.9 1,255.5 1,220.3 1,256.8 1,256.3
51027 SEC/CLER 201.6 200.5 199.1 183.8 179.8 51028 ETL SECRETARIAL/CLER 73.0 67.0 69.0 70.1 70.2 51029 GUIDANCE CLERICAL 8.0 6.8 4.8 4.0 3.0
TOTAL SECRETARIAL 282.6 274.3 272.9 257.9 253.0
51030 CUSTODIAL 431.0 430.0 431.0 387.0 385.0 51032 FT CAFETERIA WKR ‐ ‐ ‐ 1.0 0.9 51304 FOOD SERVICE WKR ‐ ‐ ‐ 0.5 0.2 51033 TECHNICAL SUPPORT 192.7 246.1 236.6 214.5 237.8 51034 TECHNICAL SUPERVISOR 42.0 43.0 43.0 43.0 44.0 51035 SCHOOL POLICE OFFICER 73.0 69.0 70.0 70.0 73.3 51036 COMMUNITY FIELD COORD 145.2 148.4 158.7 167.7 145.2 51038 HEALTH PARAPROFESS 6.0 6.0 6.0 6.0 6.0 51044 SECURITY AIDE 8.0 14.0 8.0 16.0 17.0 51307 BUS MONITOR 229.8 264.5 257.3 263.0 259.8 51308 PART TIME CUSTODIAN ‐ ‐ ‐ 54.0 54.0
TOTAL CUST/SAFE/TECH 1,127.7 1,221.0 1,210.6 1,222.7 1,223.2
51303 SEC/CLER PART-TIME ‐ ‐ ‐ 10.0 10.0 51305 NON-ACAD PART-TIME 12.0 17.0 1.0 10.0 2.0 51306 LUNCH MONITOR 187.0 179.0 177.5 175.0 171.8 51040 LIBRARY AIDE 30.4 29.7 25.9 23.3 22.1
TOTAL PART-TIME 229.4 225.7 204.4 218.3 205.8
TOTAL ACTIVE POSITIONS 8,187.7 8,377.8 8,516.9 8,521.0 8,605.7
51003 LONG TERM PAID LEAVE 119.0 215.0 197.0 144.0 144.0 51701 INJURY & WORKMAN'S COMP 74.0 71.0 75.0 81.0 81.0
TOTAL OTHER 193.0 286.0 272.0 225.0 225.0
8,380.7 8,663.8 8,788.9 8,746.0 8,830.7

2 1 6 E d u c a t i o n • B o s t o n P u b l i c S c h o o l s
External Funds History
Personnel Services FY14 Expenditure FY15 Expenditure FY16 Appropriation FY17 Adopted Inc/Dec 16 vs 17
51000 Permanent Employees 43,953,948 31,476,462 32,438,983 31,599,334 -839,648 51100 Emergency Employees 864,421 2,413,010 2,683,100 2,689,630 6,530 51200 Overtime 15,527,691 13,512,436 7,812,575 9,748,424 1,935,848 51300 Part Time Employees 6,503,447 6,743,129 6,316,887 470,982 -5,845,904 51400 Health Insurance 8,025,641 5,481,421 7,968,884 7,304,511 -664,373 51500 Pension & Annunity 4,451,063 3,286,378 4,093,223 3,745,108 -348,115 51600 Unemployment Compensation 214,518 170,467 234,898 403,916 169,018 51700 Workers' Compensation 279,696 127,640 250,487 321,532 71,045 51800 Indirect Costs 3,505,954 3,524,051 2,515,463 1,800,567 -714,896 51900 Medicare 695,339 464,294 615,434 632,618 17,184 Total Personnel Services 84,021,719 67,199,289 64,929,934 58,716,622 -6,213,312
Contractual Services FY14 Expenditure FY15 Expenditure FY16 Appropriation FY17 Adopted Inc/Dec 16 vs 17
52100 Communications 14,005 17,744 40,450 71,615 31,165 52200 Utilities 309,000 306,864 309,000 318,270 9,270 52300 Contracted Ed. Services 14,055,572 12,629,574 16,172,859 16,203,004 30,145 52400 Snow Removal 0 0 0 0 0 52500 Garbage/Waste Removal 0 0 0 0 0 52600 Repairs Buildings & Structures 2,599,809 3,658,304 3,281,720 3,281,720 0 52700 Repairs & Service of Equipment 281,831 0 0 0 0 52800 Transportation of Persons 572,320 521,440 345,231 400,955 55,724 52900 Contracted Services 21,859,452 18,251,849 17,868,600 20,287,695 2,419,095 Total Contractual Services 39,691,989 35,385,775 38,017,860 40,563,259 2,545,399
Supplies & Materials FY14 Expenditure FY15 Expenditure FY16 Appropriation FY17 Adopted Inc/Dec 16 vs 17
53000 Auto Energy Supplies 0 0 0 0 0 53200 Food Supplies 20,368,089 19,564,704 22,513,364 27,377,228 4,863,864 53400 Custodial Supplies 0 0 0 0 0 53500 Med, Dental, & Hosp Supply 0 0 0 0 0 53600 Office Supplies and Materials 3,651 18,105 19,640 19,640 0 53800 Educational Supplies & Mat 3,988,955 4,896,624 6,377,939 5,300,547 -1,077,392 53900 Misc Supplies & Materials 544,110 1,217,051 1,061,278 994,926 -66,352 Total Supplies & Materials 24,904,805 25,696,484 29,972,221 33,692,341 3,720,120
Current Chgs & Oblig FY14 Expenditure FY15 Expenditure FY16 Appropriation FY17 Adopted Inc/Dec 16 vs 17
54300 Workers' Comp Medical 0 0 0 0 0 54400 Legal Liabilities 0 0 0 0 0 54600 Current Charges H&I 0 0 0 0 0 54800 Reserve Account 27,475 -6,275 758,729 7,215,252 6,456,523 54900 Other Current Charges 89,471 33,735 41,405 39,680 -1,725 Total Current Chgs & Oblig 116,946 27,460 800,134 7,254,932 6,454,798
Equipment FY14 Expenditure FY15 Expenditure FY16 Appropriation FY17 Adopted Inc/Dec 16 vs 17
55000 Automotive Equipment 204,023 -5,732 0 0 0 55400 Lease/Purchase 0 0 0 60,300 60,300 55600 Office Furniture & Equipment -822 5,501 0 0 0 55900 Misc Equipment 1,850,531 2,060,625 1,691,635 1,882,043 190,408 Total Equipment 2,053,733 2,060,394 1,691,635 1,942,343 250,708
Other FY14 Expenditure FY15 Expenditure FY16 Appropriation FY17 Adopted Inc/Dec 16 vs 17
56200 Special Appropriation 0 0 0 0 0 57200 Structures & Improvements 0 0 0 0 0 58000 Land & Non-Structure 0 0 0 0 0 Total Other 0 0 0 0 0
Grand Total 150,789,192 130,369,402 135,411,785 142,169,497 6,757,713

E d u c a t i o n • B o s t o n P u b l i c S c h o o l s 2 1 7
External Funds Employees by Category
FY13 FY14 FY15 FY16 FY17Acct Actual Actual Actual Actual ProjectedCode Expense Title 1/1/2013 1/1/2014 1/1/2015 1/1/2016 1/1/201751002 REG ED TEACHER 38.9 27.4 7.3 17.6 13.8 51005 KDG TEACHER 0.8 0.7 ‐ ‐ ‐ 51006 OCC TEACHER 0.5 ‐ 2.0 3.0 3.0 51007 BIL KDG TEACHER 0.6 0.6 0.9 0.3 0.1 51008 SPED RESOURCE TEACHER 2.5 0.5 0.5 1.5 1.4 51009 SPED TEACHER 7.7 1.5 2.5 2.8 3.0 51010 BIL TEACHER 49.8 41.5 35.6 17.5 11.0 51011 SPECIALIST TEACHER 14.2 6.3 5.4 5.2 2.9 51012 SPED ITIN TEACHER 1.0 1.0 1.0 8.0 6.4
TOTAL TEACHERS 116.0 79.5 55.2 55.9 41.6
51013 CENTRAL ADMIN 2.0 2.0 ‐ 2.0 2.4 51014 ELEM SCH ADMIN 2.0 1.0 1.0 ‐ ‐ 51015 MIDDLE SCH ADMIN 1.5 1.5 1.0 ‐ ‐ 51016 HIGH SCH ADMIN 13.0 9.5 9.5 6.0 4.8 51017 SPECIAL SCH ADMIN 7.0 7.0 6.5 6.0 4.8 51019 PROFESSIONAL SUPPORT 156.1 165.6 108.0 119.8 103.4
TOTAL ADMINISTRATORS 181.6 186.6 126.0 133.8 115.4
51020 ITIN PUPIL SUPPORT 8.0 8.0 9.4 3.4 3.2 51021 PROGRAM SUPPORT 29.4 23.9 24.4 21.9 26.3 51022 SPED‐EVALUATION TEAM ‐ ‐ ‐ ‐ ‐ 51023 LIBRARIAN ‐ ‐ ‐ ‐ ‐ 51024 GUIDANCE 3.3 3.2 2.2 3.7 3.0 51025 ATHLETIC INSTRUCTORS ‐ ‐ ‐ ‐ ‐ 51026 NURSES 3.0 3.0 3.0 5.5 3.6 51045 INSTRUCTIONAL COACH 34.1 22.7 0.4 10.7 8.8
TOTAL SUPPORT 77.8 60.8 39.4 45.2 44.9
51039 INSTR AIDE 7.2 4.2 1.0 22.0 5.4 51041 SPED RESOURCE AIDE ‐ ‐ ‐ ‐ ‐ 51042 SPED AIDE 19.5 11.2 15.5 24.5 32.4 51043 BILINGUAL AIDE 15.1 5.7 6.0 12.0 8.1
TOTAL AIDES 41.8 21.1 22.5 58.5 45.9
51027 SEC/CLER 23.8 24.3 21.2 18.8 11.8 51028 ETL SECRETARIAL/CLER ‐ ‐ ‐ ‐ ‐ 51029 GUIDANCE CLERICAL ‐ ‐ ‐ ‐ ‐
TOTAL SECRETARIAL 23.8 24.3 21.2 18.8 11.8
51030 CUSTODIAL ‐ ‐ ‐ ‐ ‐ 51032 FT CAFETERIA WKR 71.0 70.0 69.0 76.0 68.0 51304 FOOD SERVICE WKR 191.0 181.8 157.0 177.5 172.8 51033 TECHNICAL SUPPORT 66.9 55.4 49.0 51.7 32.5 51034 TECHNICAL SUPERVISOR 6.0 6.0 6.0 5.0 3.2 51035 SCHOOL POLICE OFFICER ‐ ‐ ‐ ‐ ‐ 51036 COMMUNITY FIELD COORD 6.8 5.8 5.4 8.4 7.5 51038 HEALTH PARAPROFESS ‐ ‐ ‐ ‐ ‐ 51044 SECURITY AIDE 1.0 1.0 0.7 1.0 1.0 51307 BUS MONITOR ‐ ‐ ‐ ‐ ‐
TOTAL CUST/SAFE/TECH 342.7 320.0 287.1 319.6 285.0
51303 SEC/CLER PART‐TIME 7.0 1.0 1.0 21.0 21.6 51305 NON‐ACAD PART‐TIME ‐ ‐ 12.0 1.0 0.4 51306 LUNCH MONITOR ‐ ‐ ‐ 1.0 1.3 51040 LIBRARY AIDE 2.8 1.5 1.1 1.1 0.4
TOTAL PART‐TIME 9.8 2.5 14.1 24.1 23.7
TOTAL ACTIVE POSITIONS 793.5 694.7 565.5 655.9 568.3
51003 LONG TERM PAID LEAVE ‐ ‐ ‐ ‐ ‐ 51701 INJURY & WORKMAN'S COMP 2.0 3.0 ‐ ‐ ‐
TOTAL OTHER 2.0 3.0 0.0 0.0 0.0
795.5 697.7 565.5 655.9 568.3
2 1 8 E d u c a t i o n • B o s t o n P u b l i c S c h o o l s
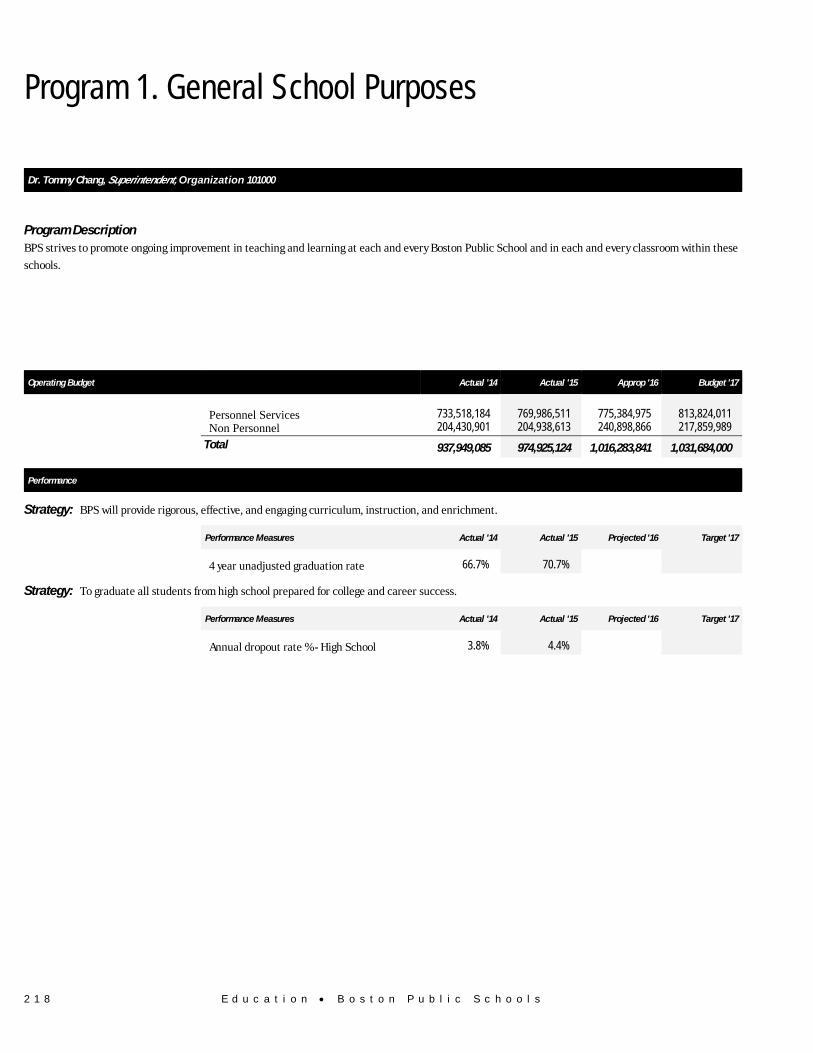
Program 1. General School Purposes
Dr. Tommy Chang, Superintendent, Organization 101000
Program Description BPS strives to promote ongoing improvement in teaching and learning at each and every Boston Public School and in each and every classroom within these
schools.
Operating Budget Actual '14 Actual '15 Approp '16 Budget '17
Personnel Services 733,518,184 769,986,511 775,384,975 813,824,011 Non Personnel 204,430,901 204,938,613 240,898,866 217,859,989
Total 937,949,085 974,925,124 1,016,283,841 1,031,684,000
Performance
Strategy: BPS will provide rigorous, effective, and engaging curriculum, instruction, and enrichment.
Performance Measures Actual '14 Actual '15 Projected '16 Target '17
4 year unadjusted graduation rate 66.7% 70.7%
Strategy: To graduate all students from high school prepared for college and career success.
Performance Measures Actual '14 Actual '15 Projected '16 Target '17
Annual dropout rate % - High School 3.8% 4.4%
E d u c a t i o n • B o s t o n P u b l i c S c h o o l s 2 1 9
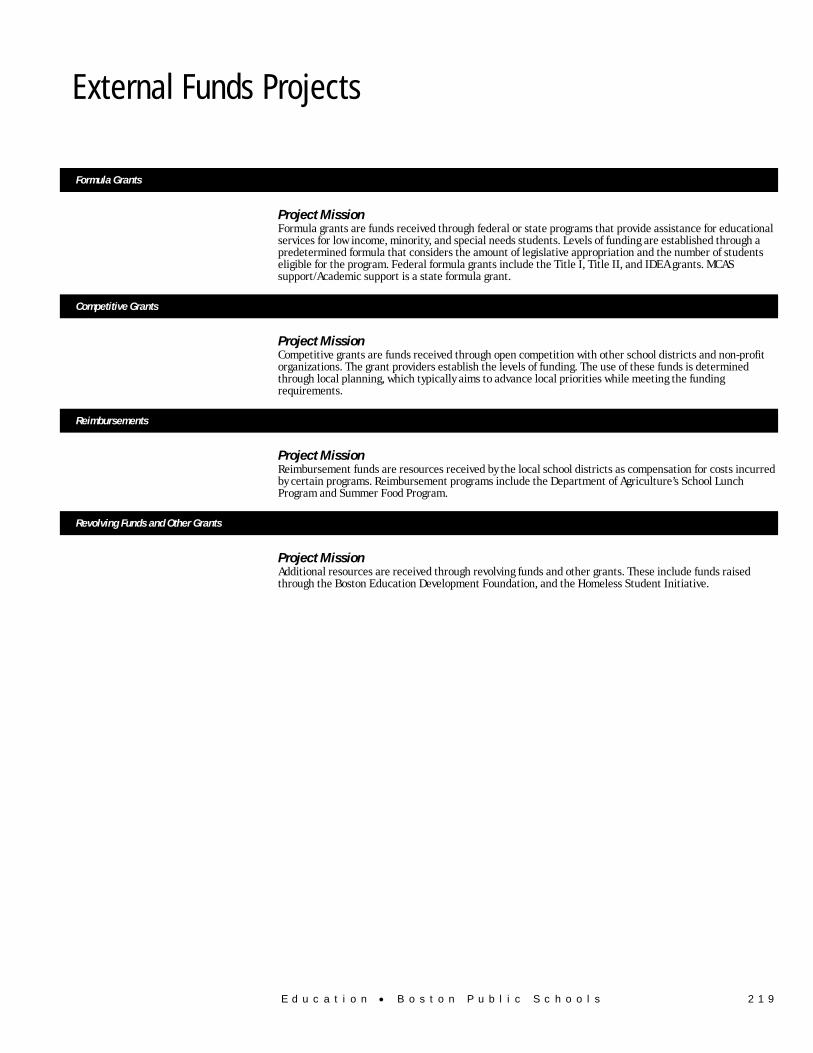
External Funds Projects
Formula Grants
Project Mission Formula grants are funds received through federal or state programs that provide assistance for educational services for low income, minority, and special needs students. Levels of funding are established through a predetermined formula that considers the amount of legislative appropriation and the number of students eligible for the program. Federal formula grants include the Title I, Title II, and IDEA grants. MCAS support/Academic support is a state formula grant.
Competitive Grants
Project Mission Competitive grants are funds received through open competition with other school districts and non-profit organizations. The grant providers establish the levels of funding. The use of these funds is determined through local planning, which typically aims to advance local priorities while meeting the funding requirements.
Reimbursements
Project Mission Reimbursement funds are resources received by the local school districts as compensation for costs incurred by certain programs. Reimbursement programs include the Department of Agriculture’s School Lunch Program and Summer Food Program.
Revolving Funds and Other Grants
Project Mission Additional resources are received through revolving funds and other grants. These include funds raised through the Boston Education Development Foundation, and the Homeless Student Initiative.

2 2 0 E d u c a t i o n • B o s t o n P u b l i c S c h o o l s
Boston Public Schools Capital Budget
Education Boston Public Schools
Overview The City’s public schools serve to educate and prepare Boston’s youth, families and communities for the challenges of today and the future. The capital plan
strives to ensure that a continuum of learning opportunities is available to the families who live and work in Boston. The comprehensive master planning
process to develop a 10-year facilities master plan for BPS will be completed in FY17.
FY17 Major Initiatives • Construction will continue for a new STEM (Science, Technology, Engineering and Mathematics) school for
grades 6 through 12 on the site of the current Dearborn School. The City has partnered with MSBA in the
development and funding of this new school.
• Renovation will continue of the North Bennet Street buildings to provide additional classrooms to support the
Eliot School's expansion as a K to 8 school.
• In September 2016, the Another Course to College high school program will relocate into a novated former school
building.
• The City will conduct a feasibility study and develop schematic design plans in conjunction with the
Massachusetts School Building Authority for the construction or renovation of a facility that supports the
requirements of the Boston Arts Academy.
• Upgrades will be completed to the Madison Park High School welding shop to accommodate classroom welding
with adequate ventilation and safety equipment.
• BPS will continue the 5 year plan to upgrade technology infrastructure across the district in support of 21st
century learning.
Capital Budget Expenditures Total Actual '14 Total Actual '15 Estimated '16 Total Projected '17
Total Department 35,212,224 51,490,890 75,148,682 65,676,408

E d u c a t i o n • B o s t o n P u b l i c S c h o o l s 2 2 1
Boston Public Schools Project Profiles
ACC AT E. GREENWOOD Project Mission Interior renovation of the E. Greenwood facility for Another Course to College. Managing Department, School Department Status, In Construction Location, Hyde Park Operating Impact, Yes
Authorizations
Source Existing FY17 FutureNon Capital
Fund Total City Capital 7,000,000 0 0 0 7,000,000 Grants/Other 0 0 0 0 0 Total 7,000,000 0 0 0 7,000,000
Expenditures (Actual and Planned)
Source Thru
6/30/15 FY16 FY17 FY18-21 Total City Capital 0 3,500,000 3,500,000 0 7,000,000 Grants/Other 0 0 0 0 0 Total 0 3,500,000 3,500,000 0 7,000,000
ACCESS IMPROVEMENTS AT HENDERSON INCLUSION UPPER SCHOOL PHASE II Project Mission Accessibility renovations including bathroom and fire system upgrades. Managing Department, Public Facilities Department Status, In Design Location, Dorchester Operating Impact, No
Authorizations
Source Existing FY17 FutureNon Capital
Fund Total City Capital 500,000 3,575,000 0 0 4,075,000 Grants/Other 0 0 0 0 0 Total 500,000 3,575,000 0 0 4,075,000
Expenditures (Actual and Planned)
Source Thru
6/30/15 FY16 FY17 FY18-21 Total City Capital 0 0 200,000 3,875,000 4,075,000 Grants/Other 0 0 0 0 0 Total 0 0 200,000 3,875,000 4,075,000
2 2 2 E d u c a t i o n • B o s t o n P u b l i c S c h o o l s
Boston Public Schools Project Profiles
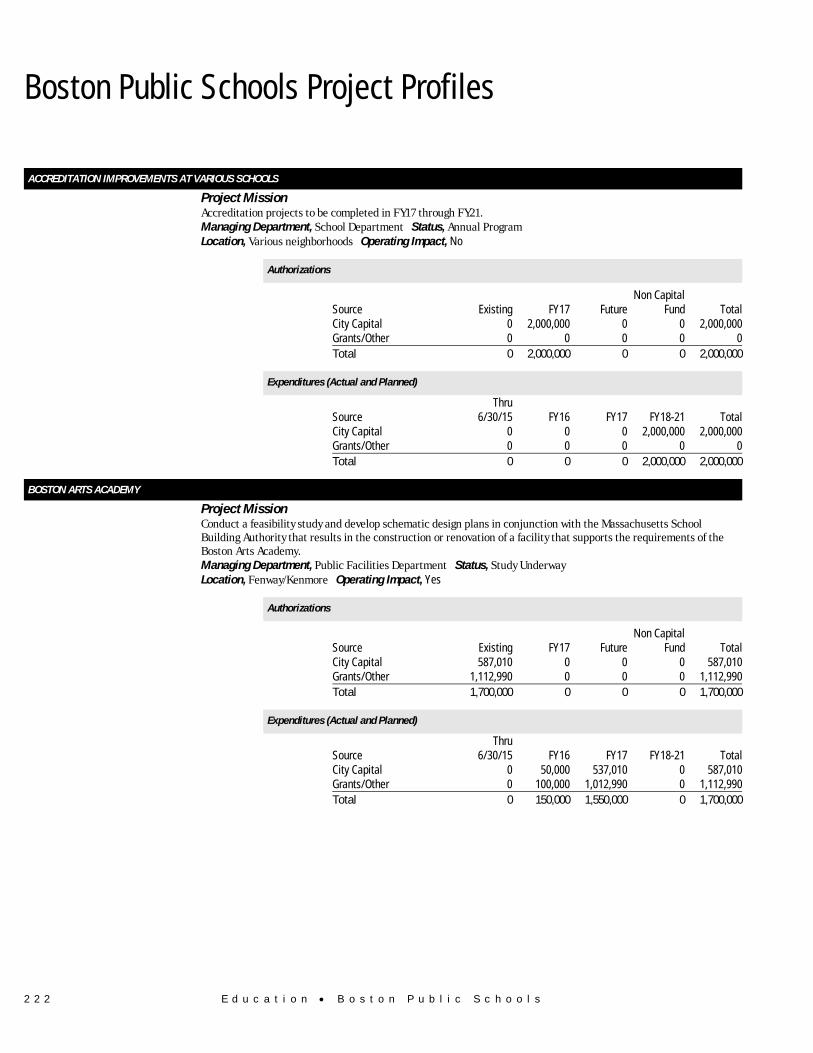
ACCREDITATION IMPROVEMENTS AT VARIOUS SCHOOLS Project Mission Accreditation projects to be completed in FY17 through FY21. Managing Department, School Department Status, Annual Program Location, Various neighborhoods Operating Impact, No
Authorizations
Source Existing FY17 FutureNon Capital
Fund Total City Capital 0 2,000,000 0 0 2,000,000 Grants/Other 0 0 0 0 0 Total 0 2,000,000 0 0 2,000,000
Expenditures (Actual and Planned)
Source Thru
6/30/15 FY16 FY17 FY18-21 Total City Capital 0 0 0 2,000,000 2,000,000 Grants/Other 0 0 0 0 0 Total 0 0 0 2,000,000 2,000,000
BOSTON ARTS ACADEMY Project Mission Conduct a feasibility study and develop schematic design plans in conjunction with the Massachusetts School
Building Authority that results in the construction or renovation of a facility that supports the requirements of the Boston Arts Academy.
Managing Department, Public Facilities Department Status, Study Underway Location, Fenway/Kenmore Operating Impact, Yes
Authorizations
Source Existing FY17 FutureNon Capital
Fund Total City Capital 587,010 0 0 0 587,010 Grants/Other 1,112,990 0 0 0 1,112,990 Total 1,700,000 0 0 0 1,700,000
Expenditures (Actual and Planned)
Source Thru
6/30/15 FY16 FY17 FY18-21 Total City Capital 0 50,000 537,010 0 587,010 Grants/Other 0 100,000 1,012,990 0 1,112,990 Total 0 150,000 1,550,000 0 1,700,000

E d u c a t i o n • B o s t o n P u b l i c S c h o o l s 2 2 3
Boston Public Schools Project Profiles
BOSTON SCHOOL BUILDING AUTHORITY Project Mission A fund for major school building renovation initiatives. Managing Department, School Department Status, To Be Scheduled Location, Various neighborhoods Operating Impact, No
Authorizations
Source Existing FY17 FutureNon Capital
Fund Total City Capital 0 0 70,000,000 0 70,000,000 Grants/Other 0 0 0 0 0 Total 0 0 70,000,000 0 70,000,000
Expenditures (Actual and Planned)
Source Thru
6/30/15 FY16 FY17 FY18-21 Total City Capital 0 0 0 70,000,000 70,000,000 Grants/Other 0 0 0 0 0 Total 0 0 0 70,000,000 70,000,000
CARTER DEVELOPMENT CENTER Project Mission Design and construct a building addition that will include appropriate and dedicated spaces for beneficial and critical
instructional activities including aquatic, physical, creative arts and multi-sensory therapies. Managing Department, Public Facilities Department Status, To Be Scheduled Location, South End Operating Impact, No
Authorizations
Source Existing FY17 FutureNon Capital
Fund Total City Capital 1,600,000 0 0 0 1,600,000 Grants/Other 0 0 0 0 0 Total 1,600,000 0 0 0 1,600,000
Expenditures (Actual and Planned)
Source Thru
6/30/15 FY16 FY17 FY18-21 Total City Capital 0 0 0 1,600,000 1,600,000 Grants/Other 0 0 0 0 0 Total 0 0 0 1,600,000 1,600,000

2 2 4 E d u c a t i o n • B o s t o n P u b l i c S c h o o l s
Boston Public Schools Project Profiles
CRITICAL FACILITY REPAIRS Project Mission A critical repair fund for emergency repairs to school facilities including roofs, windows, masonry, electrical and
HVAC systems. Managing Department, School Department Status, Annual Program Location, Various neighborhoods Operating Impact, No
Authorizations
Source Existing FY17 FutureNon Capital
Fund Total City Capital 662,650 500,000 837,350 0 2,000,000 Grants/Other 0 0 0 0 0 Total 662,650 500,000 837,350 0 2,000,000
Expenditures (Actual and Planned)
Source Thru
6/30/15 FY16 FY17 FY18-21 Total City Capital 0 500,000 450,000 1,050,000 2,000,000 Grants/Other 0 0 0 0 0 Total 0 500,000 450,000 1,050,000 2,000,000
DEARBORN 6-12 STEM / EARLY COLLEGE ACADEMY Project Mission Design and construct a new STEM (Science, Technology, Engineering and Mathematics) school for grades 6 through
12 on the site of the current Dearborn School. The MSBA will partner with the City in the development and funding of this new school.
Managing Department, Public Facilities Department Status, In Construction Location, Roxbury Operating Impact, No
Authorizations
Source Existing FY17 FutureNon Capital
Fund Total City Capital 36,127,653 0 0 0 36,127,653 Grants/Other 37,370,642 0 0 0 37,370,642 Total 73,498,295 0 0 0 73,498,295
Expenditures (Actual and Planned)
Source Thru
6/30/15 FY16 FY17 FY18-21 Total City Capital 2,424,895 5,000,000 16,300,000 12,402,758 36,127,653 Grants/Other 2,194,727 17,050,000 16,500,000 1,625,915 37,370,642 Total 4,619,622 22,050,000 32,800,000 14,028,673 73,498,295
E d u c a t i o n • B o s t o n P u b l i c S c h o o l s 2 2 5
Boston Public Schools Project Profiles
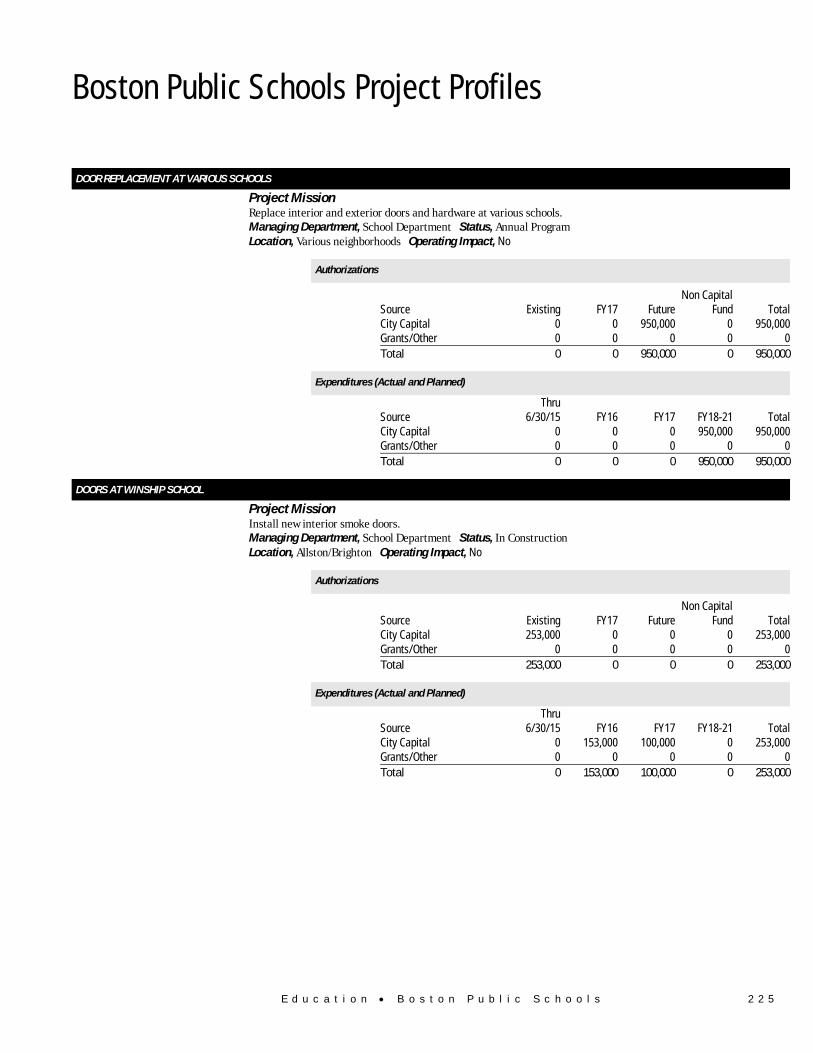
DOOR REPLACEMENT AT VARIOUS SCHOOLS Project Mission Replace interior and exterior doors and hardware at various schools. Managing Department, School Department Status, Annual Program Location, Various neighborhoods Operating Impact, No
Authorizations
Source Existing FY17 FutureNon Capital
Fund Total City Capital 0 0 950,000 0 950,000 Grants/Other 0 0 0 0 0 Total 0 0 950,000 0 950,000
Expenditures (Actual and Planned)
Source Thru
6/30/15 FY16 FY17 FY18-21 Total City Capital 0 0 0 950,000 950,000 Grants/Other 0 0 0 0 0 Total 0 0 0 950,000 950,000
DOORS AT WINSHIP SCHOOL Project Mission Install new interior smoke doors. Managing Department, School Department Status, In Construction Location, Allston/Brighton Operating Impact, No
Authorizations
Source Existing FY17 FutureNon Capital
Fund Total City Capital 253,000 0 0 0 253,000 Grants/Other 0 0 0 0 0 Total 253,000 0 0 0 253,000
Expenditures (Actual and Planned)
Source Thru
6/30/15 FY16 FY17 FY18-21 Total City Capital 0 153,000 100,000 0 253,000 Grants/Other 0 0 0 0 0 Total 0 153,000 100,000 0 253,000
2 2 6 E d u c a t i o n • B o s t o n P u b l i c S c h o o l s
Boston Public Schools Project Profiles
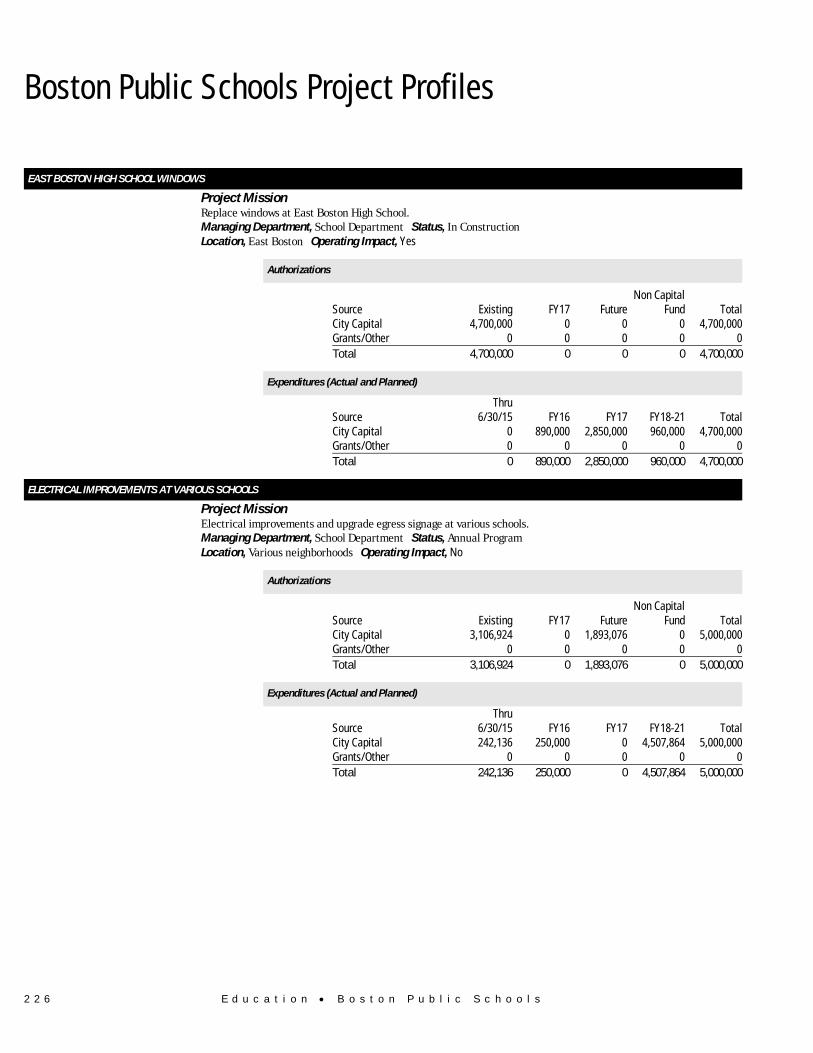
EAST BOSTON HIGH SCHOOL WINDOWS Project Mission Replace windows at East Boston High School. Managing Department, School Department Status, In Construction Location, East Boston Operating Impact, Yes
Authorizations
Source Existing FY17 FutureNon Capital
Fund Total City Capital 4,700,000 0 0 0 4,700,000 Grants/Other 0 0 0 0 0 Total 4,700,000 0 0 0 4,700,000
Expenditures (Actual and Planned)
Source Thru
6/30/15 FY16 FY17 FY18-21 Total City Capital 0 890,000 2,850,000 960,000 4,700,000 Grants/Other 0 0 0 0 0 Total 0 890,000 2,850,000 960,000 4,700,000
ELECTRICAL IMPROVEMENTS AT VARIOUS SCHOOLS Project Mission Electrical improvements and upgrade egress signage at various schools. Managing Department, School Department Status, Annual Program Location, Various neighborhoods Operating Impact, No
Authorizations
Source Existing FY17 FutureNon Capital
Fund Total City Capital 3,106,924 0 1,893,076 0 5,000,000 Grants/Other 0 0 0 0 0 Total 3,106,924 0 1,893,076 0 5,000,000
Expenditures (Actual and Planned)
Source Thru
6/30/15 FY16 FY17 FY18-21 Total City Capital 242,136 250,000 0 4,507,864 5,000,000 Grants/Other 0 0 0 0 0 Total 242,136 250,000 0 4,507,864 5,000,000

E d u c a t i o n • B o s t o n P u b l i c S c h o o l s 2 2 7
Boston Public Schools Project Profiles
ELIOT SCHOOL ACCESS IMPROVEMENTS Project Mission New school entrance, accessible bathroom renovations, and sprinkler system at the Eliot School's Charter Street
building. Managing Department, Public Facilities Department Status, To Be Scheduled Location, North End Operating Impact, No
Authorizations
Source Existing FY17 FutureNon Capital
Fund Total City Capital 450,000 0 0 0 450,000 Grants/Other 0 0 0 0 0 Total 450,000 0 0 0 450,000
Expenditures (Actual and Planned)
Source Thru
6/30/15 FY16 FY17 FY18-21 Total City Capital 0 0 0 450,000 450,000 Grants/Other 0 0 0 0 0 Total 0 0 0 450,000 450,000
ELIOT SCHOOL AT 585 COMMERCIAL STREET Project Mission Renovate 585 Commercial Street office building, including building envelope, structural work, interior and site work,
which will provide additional classrooms to support the Eliot School's expansion as a K to 8 school. Managing Department, Public Facilities Department Status, In Design Location, North End Operating Impact, No
Authorizations
Source Existing FY17 FutureNon Capital
Fund Total City Capital 20,450,000 4,200,000 0 0 24,650,000 Grants/Other 15,800,000 0 0 0 15,800,000 Total 36,250,000 4,200,000 0 0 40,450,000
Expenditures (Actual and Planned)
Source Thru
6/30/15 FY16 FY17 FY18-21 Total City Capital 1,301,396 1,888,530 0 21,460,074 24,650,000 Grants/Other 15,796,587 3,413 0 0 15,800,000 Total 17,097,983 1,891,943 0 21,460,074 40,450,000

2 2 8 E d u c a t i o n • B o s t o n P u b l i c S c h o o l s
Boston Public Schools Project Profiles
ELIOT SCHOOL AT NORTH BENNET STREET Project Mission Renovate North Bennet Street buildings which will provide additional classrooms to support the Eliot School's
expansion as a K to 8 school. Managing Department, Public Facilities Department Status, In Construction Location, North End Operating Impact, Yes
Authorizations
Source Existing FY17 FutureNon Capital
Fund Total City Capital 18,628,867 0 0 0 18,628,867 Grants/Other 4,390,000 0 0 0 4,390,000 Total 23,018,867 0 0 0 23,018,867
Expenditures (Actual and Planned)
Source Thru
6/30/15 FY16 FY17 FY18-21 Total City Capital 3,140,992 4,326,942 6,969,008 4,191,925 18,628,867 Grants/Other 2,155,043 1,673,058 561,899 0 4,390,000 Total 5,296,035 6,000,000 7,530,907 4,191,925 23,018,867
ENGLISH HIGH SCHOOL BUILDING ENVELOPE Project Mission Roof and window replacement, selective masonry repointing and curtain wall window replacement to attain greater
energy efficiency. Managing Department, Public Facilities Department Status, To Be Scheduled Location, Jamaica Plain Operating Impact, Yes
Authorizations
Source Existing FY17 FutureNon Capital
Fund Total City Capital 2,000,000 0 0 0 2,000,000 Grants/Other 0 0 0 0 0 Total 2,000,000 0 0 0 2,000,000
Expenditures (Actual and Planned)
Source Thru
6/30/15 FY16 FY17 FY18-21 Total City Capital 0 0 0 2,000,000 2,000,000 Grants/Other 0 0 0 0 0 Total 0 0 0 2,000,000 2,000,000
E d u c a t i o n • B o s t o n P u b l i c S c h o o l s 2 2 9
Boston Public Schools Project Profiles
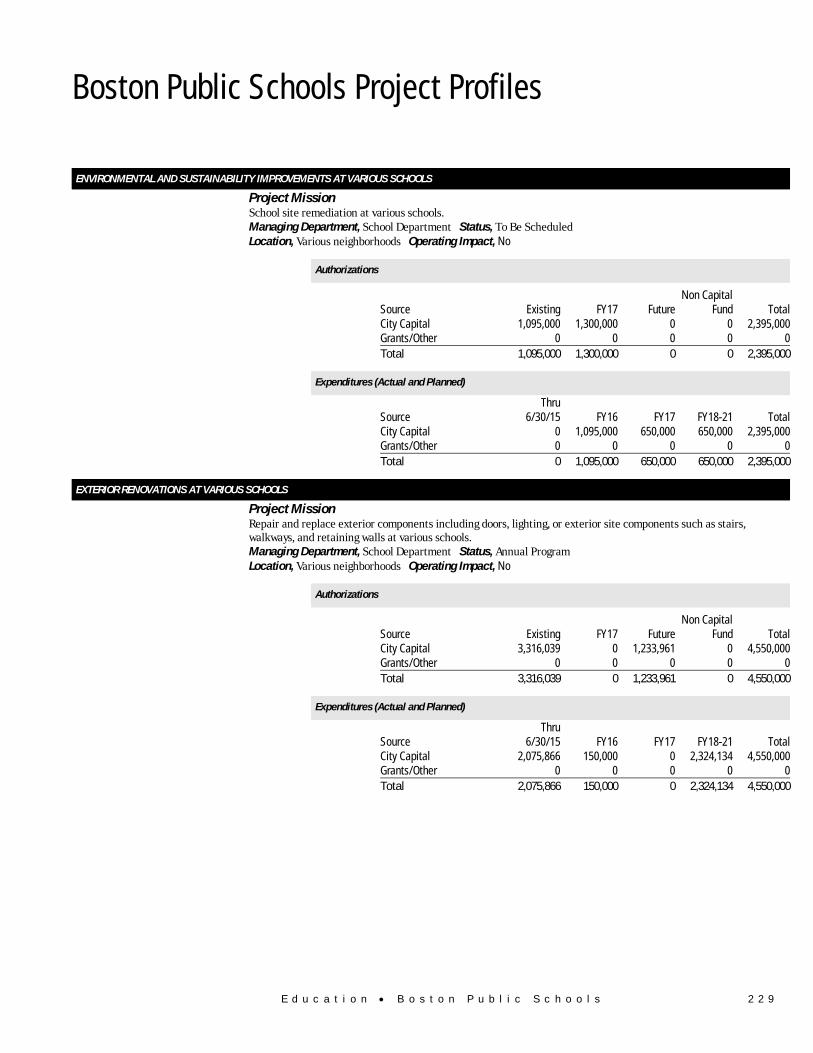
ENVIRONMENTAL AND SUSTAINABILITY IMPROVEMENTS AT VARIOUS SCHOOLS Project Mission School site remediation at various schools. Managing Department, School Department Status, To Be Scheduled Location, Various neighborhoods Operating Impact, No
Authorizations
Source Existing FY17 FutureNon Capital
Fund Total City Capital 1,095,000 1,300,000 0 0 2,395,000 Grants/Other 0 0 0 0 0 Total 1,095,000 1,300,000 0 0 2,395,000
Expenditures (Actual and Planned)
Source Thru
6/30/15 FY16 FY17 FY18-21 Total City Capital 0 1,095,000 650,000 650,000 2,395,000 Grants/Other 0 0 0 0 0 Total 0 1,095,000 650,000 650,000 2,395,000
EXTERIOR RENOVATIONS AT VARIOUS SCHOOLS Project Mission Repair and replace exterior components including doors, lighting, or exterior site components such as stairs,
walkways, and retaining walls at various schools. Managing Department, School Department Status, Annual Program Location, Various neighborhoods Operating Impact, No
Authorizations
Source Existing FY17 FutureNon Capital
Fund Total City Capital 3,316,039 0 1,233,961 0 4,550,000 Grants/Other 0 0 0 0 0 Total 3,316,039 0 1,233,961 0 4,550,000
Expenditures (Actual and Planned)
Source Thru
6/30/15 FY16 FY17 FY18-21 Total City Capital 2,075,866 150,000 0 2,324,134 4,550,000 Grants/Other 0 0 0 0 0 Total 2,075,866 150,000 0 2,324,134 4,550,000

2 3 0 E d u c a t i o n • B o s t o n P u b l i c S c h o o l s
Boston Public Schools Project Profiles
EXTERIOR SITE IMPROVEMENTS AT HERNANDEZ SCHOOL Project Mission General site improvements including permeable paving that will reduce the volume of storm water run-off entering
the Boston Water and Sewer Commission's (BWSC) storm water system. The BWSC is funding a portion of this project.
Managing Department, School Department Status, New Project Location, Roxbury Operating Impact, No
Authorizations
Source Existing FY17 FutureNon Capital
Fund Total City Capital 0 400,000 0 0 400,000 Grants/Other 0 0 0 275,000 275,000 Total 0 400,000 0 275,000 675,000
Expenditures (Actual and Planned)
Source Thru
6/30/15 FY16 FY17 FY18-21 Total City Capital 0 0 150,000 250,000 400,000 Grants/Other 0 0 0 0 0 Total 0 0 150,000 250,000 400,000
EXTERIOR SITE IMPROVEMENTS AT IRVING SCHOOL Project Mission General site improvements including permeable paving that will reduce the volume of storm water run-off entering
the Boston Water and Sewer Commission's (BWSC) storm water system. The BWSC is funding a portion of this project.
Managing Department, School Department Status, New Project Location, Roslindale Operating Impact, No
Authorizations
Source Existing FY17 FutureNon Capital
Fund Total City Capital 0 300,000 0 0 300,000 Grants/Other 0 0 0 575,000 575,000 Total 0 300,000 0 575,000 875,000
Expenditures (Actual and Planned)
Source Thru
6/30/15 FY16 FY17 FY18-21 Total City Capital 0 0 300,000 0 300,000 Grants/Other 0 0 0 0 0 Total 0 0 300,000 0 300,000

E d u c a t i o n • B o s t o n P u b l i c S c h o o l s 2 3 1
Boston Public Schools Project Profiles
HVAC IMPROVEMENTS AT VARIOUS SCHOOLS Project Mission Replace the DDC controls and HVAC units at various schools. Managing Department, School Department Status, Annual Program Location, Various neighborhoods Operating Impact, No
Authorizations
Source Existing FY17 FutureNon Capital
Fund Total City Capital 3,142,006 0 6,828,994 0 9,971,000 Grants/Other 0 0 0 0 0 Total 3,142,006 0 6,828,994 0 9,971,000
Expenditures (Actual and Planned)
Source Thru
6/30/15 FY16 FY17 FY18-21 Total City Capital 1,021,085 600,000 0 8,349,915 9,971,000 Grants/Other 0 0 0 0 0 Total 1,021,085 600,000 0 8,349,915 9,971,000
INTERIOR REFURBISHMENTS AT VARIOUS SCHOOLS Project Mission Interior improvements at various schools. Managing Department, School Department Status, Annual Program Location, Various neighborhoods Operating Impact, No
Authorizations
Source Existing FY17 FutureNon Capital
Fund Total City Capital 2,921,120 0 978,880 0 3,900,000 Grants/Other 0 0 0 0 0 Total 2,921,120 0 978,880 0 3,900,000
Expenditures (Actual and Planned)
Source Thru
6/30/15 FY16 FY17 FY18-21 Total City Capital 1,978,381 907,114 0 1,014,505 3,900,000 Grants/Other 0 0 0 0 0 Total 1,978,381 907,114 0 1,014,505 3,900,000
2 3 2 E d u c a t i o n • B o s t o n P u b l i c S c h o o l s
Boston Public Schools Project Profiles
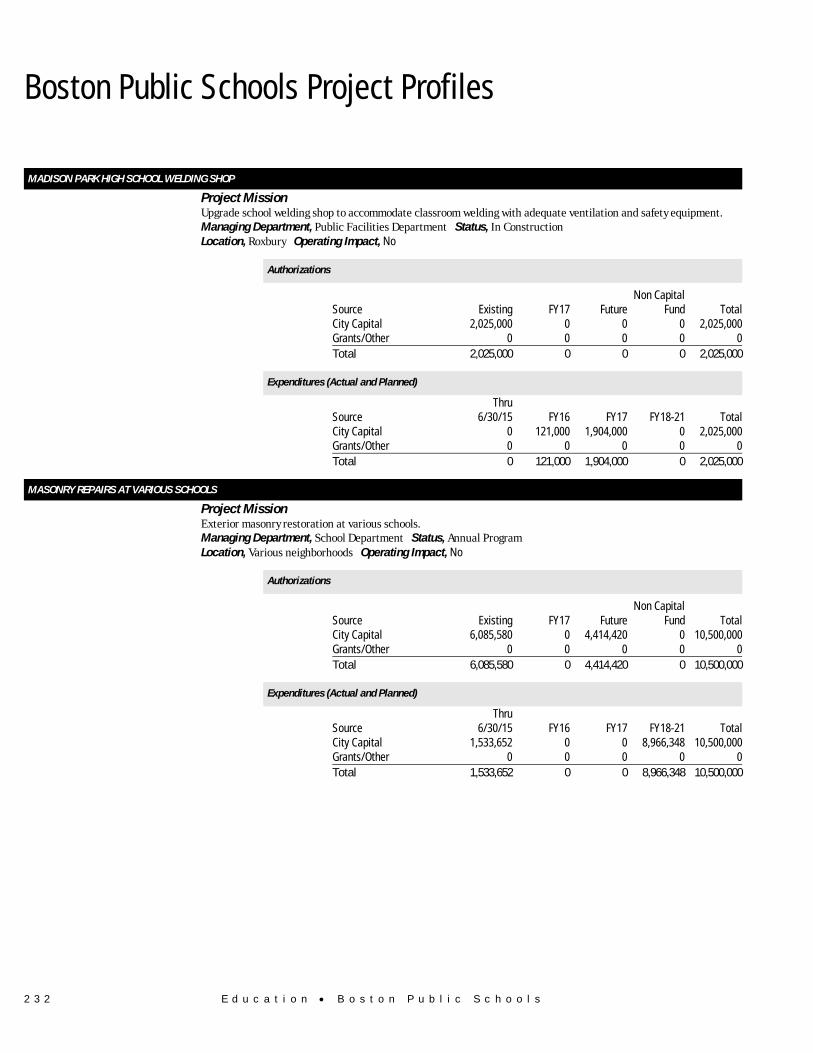
MADISON PARK HIGH SCHOOL WELDING SHOP Project Mission Upgrade school welding shop to accommodate classroom welding with adequate ventilation and safety equipment. Managing Department, Public Facilities Department Status, In Construction Location, Roxbury Operating Impact, No
Authorizations
Source Existing FY17 FutureNon Capital
Fund Total City Capital 2,025,000 0 0 0 2,025,000 Grants/Other 0 0 0 0 0 Total 2,025,000 0 0 0 2,025,000
Expenditures (Actual and Planned)
Source Thru
6/30/15 FY16 FY17 FY18-21 Total City Capital 0 121,000 1,904,000 0 2,025,000 Grants/Other 0 0 0 0 0 Total 0 121,000 1,904,000 0 2,025,000
MASONRY REPAIRS AT VARIOUS SCHOOLS Project Mission Exterior masonry restoration at various schools. Managing Department, School Department Status, Annual Program Location, Various neighborhoods Operating Impact, No
Authorizations
Source Existing FY17 FutureNon Capital
Fund Total City Capital 6,085,580 0 4,414,420 0 10,500,000 Grants/Other 0 0 0 0 0 Total 6,085,580 0 4,414,420 0 10,500,000
Expenditures (Actual and Planned)
Source Thru
6/30/15 FY16 FY17 FY18-21 Total City Capital 1,533,652 0 0 8,966,348 10,500,000 Grants/Other 0 0 0 0 0 Total 1,533,652 0 0 8,966,348 10,500,000
E d u c a t i o n • B o s t o n P u b l i c S c h o o l s 2 3 3
Boston Public Schools Project Profiles
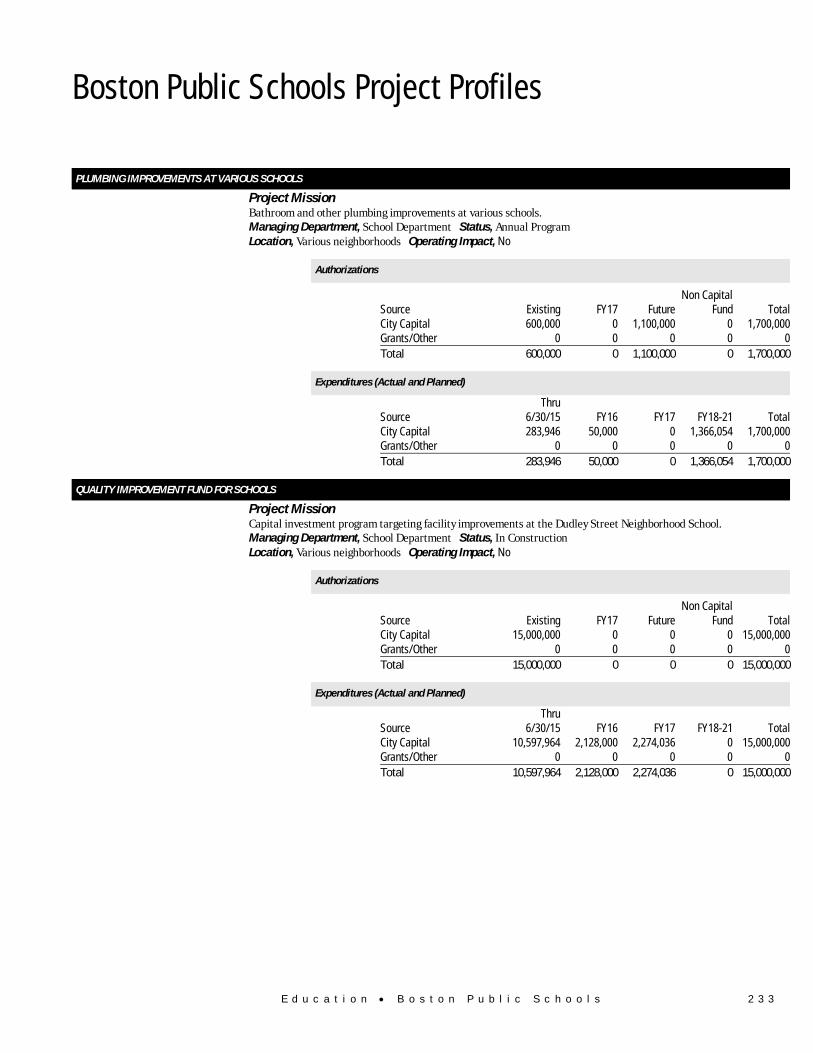
PLUMBING IMPROVEMENTS AT VARIOUS SCHOOLS Project Mission Bathroom and other plumbing improvements at various schools. Managing Department, School Department Status, Annual Program Location, Various neighborhoods Operating Impact, No
Authorizations
Source Existing FY17 FutureNon Capital
Fund Total City Capital 600,000 0 1,100,000 0 1,700,000 Grants/Other 0 0 0 0 0 Total 600,000 0 1,100,000 0 1,700,000
Expenditures (Actual and Planned)
Source Thru
6/30/15 FY16 FY17 FY18-21 Total City Capital 283,946 50,000 0 1,366,054 1,700,000 Grants/Other 0 0 0 0 0 Total 283,946 50,000 0 1,366,054 1,700,000
QUALITY IMPROVEMENT FUND FOR SCHOOLS Project Mission Capital investment program targeting facility improvements at the Dudley Street Neighborhood School. Managing Department, School Department Status, In Construction Location, Various neighborhoods Operating Impact, No
Authorizations
Source Existing FY17 FutureNon Capital
Fund Total City Capital 15,000,000 0 0 0 15,000,000 Grants/Other 0 0 0 0 0 Total 15,000,000 0 0 0 15,000,000
Expenditures (Actual and Planned)
Source Thru
6/30/15 FY16 FY17 FY18-21 Total City Capital 10,597,964 2,128,000 2,274,036 0 15,000,000 Grants/Other 0 0 0 0 0 Total 10,597,964 2,128,000 2,274,036 0 15,000,000
2 3 4 E d u c a t i o n • B o s t o n P u b l i c S c h o o l s
Boston Public Schools Project Profiles
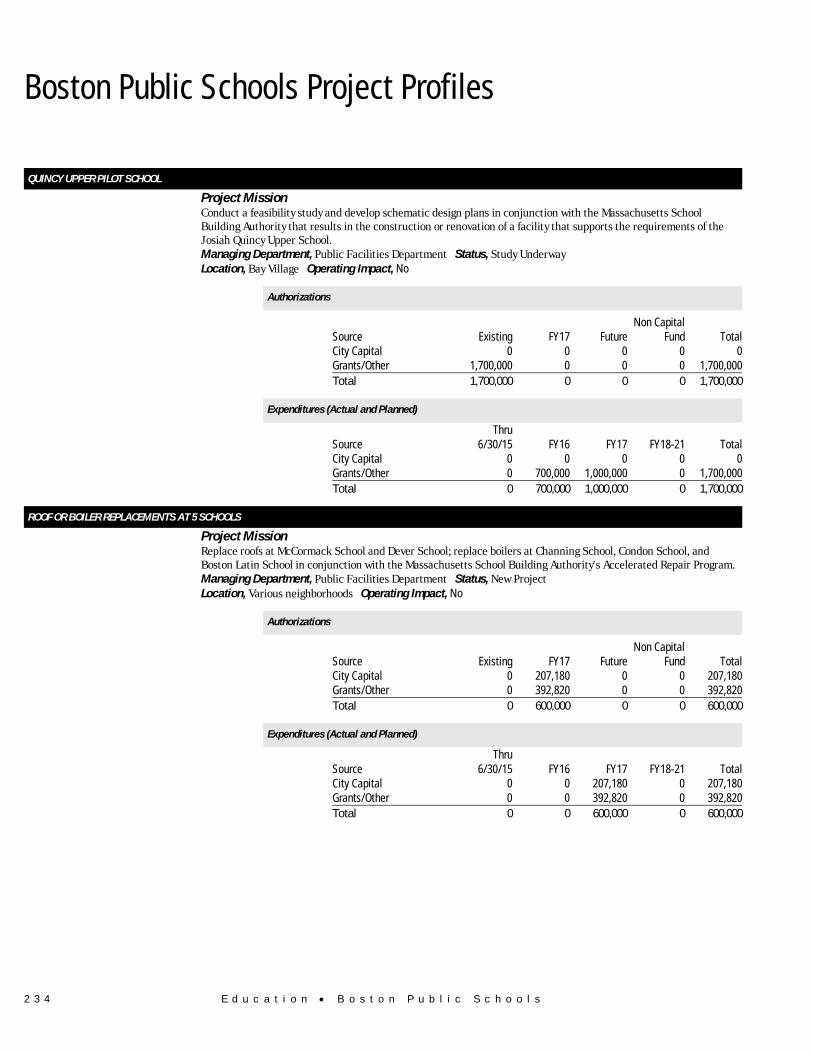
QUINCY UPPER PILOT SCHOOL Project Mission Conduct a feasibility study and develop schematic design plans in conjunction with the Massachusetts School
Building Authority that results in the construction or renovation of a facility that supports the requirements of the Josiah Quincy Upper School.
Managing Department, Public Facilities Department Status, Study Underway Location, Bay Village Operating Impact, No
Authorizations
Source Existing FY17 FutureNon Capital
Fund Total City Capital 0 0 0 0 0 Grants/Other 1,700,000 0 0 0 1,700,000 Total 1,700,000 0 0 0 1,700,000
Expenditures (Actual and Planned)
Source Thru
6/30/15 FY16 FY17 FY18-21 Total City Capital 0 0 0 0 0 Grants/Other 0 700,000 1,000,000 0 1,700,000 Total 0 700,000 1,000,000 0 1,700,000
ROOF OR BOILER REPLACEMENTS AT 5 SCHOOLS Project Mission Replace roofs at McCormack School and Dever School; replace boilers at Channing School, Condon School, and
Boston Latin School in conjunction with the Massachusetts School Building Authority's Accelerated Repair Program. Managing Department, Public Facilities Department Status, New Project Location, Various neighborhoods Operating Impact, No
Authorizations
Source Existing FY17 FutureNon Capital
Fund Total City Capital 0 207,180 0 0 207,180 Grants/Other 0 392,820 0 0 392,820 Total 0 600,000 0 0 600,000
Expenditures (Actual and Planned)
Source Thru
6/30/15 FY16 FY17 FY18-21 Total City Capital 0 0 207,180 0 207,180 Grants/Other 0 0 392,820 0 392,820 Total 0 0 600,000 0 600,000
E d u c a t i o n • B o s t o n P u b l i c S c h o o l s 2 3 5
Boston Public Schools Project Profiles
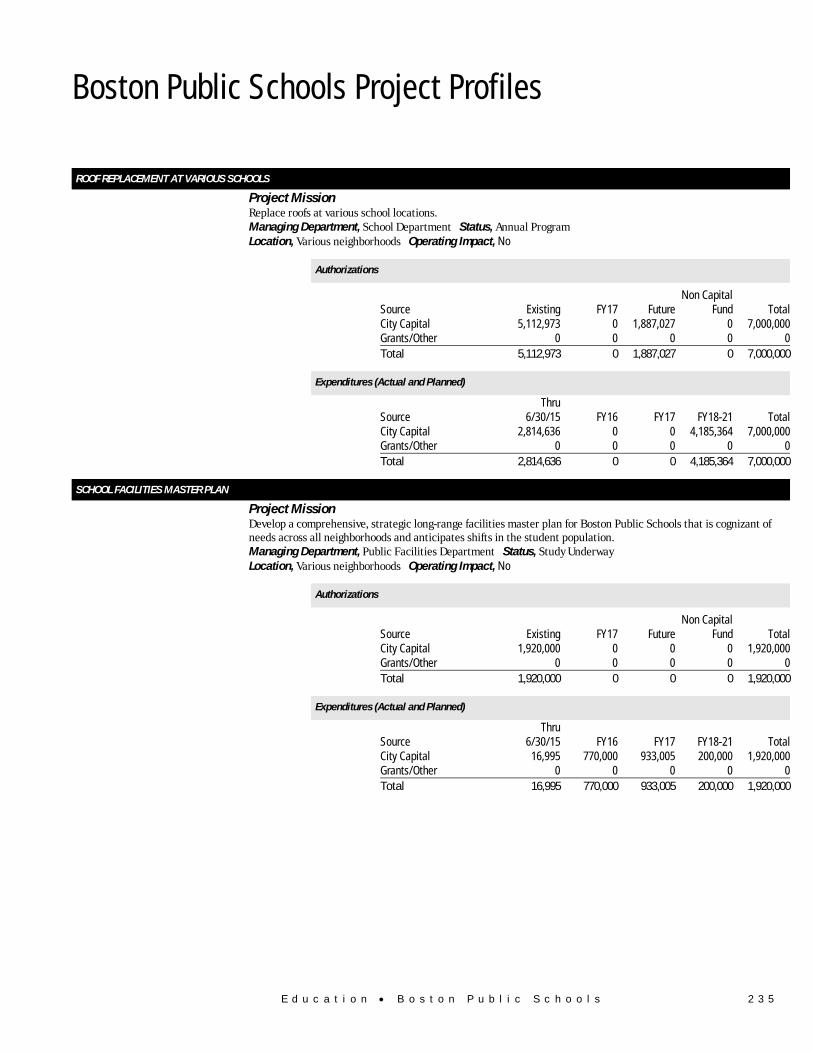
ROOF REPLACEMENT AT VARIOUS SCHOOLS Project Mission Replace roofs at various school locations. Managing Department, School Department Status, Annual Program Location, Various neighborhoods Operating Impact, No
Authorizations
Source Existing FY17 FutureNon Capital
Fund Total City Capital 5,112,973 0 1,887,027 0 7,000,000 Grants/Other 0 0 0 0 0 Total 5,112,973 0 1,887,027 0 7,000,000
Expenditures (Actual and Planned)
Source Thru
6/30/15 FY16 FY17 FY18-21 Total City Capital 2,814,636 0 0 4,185,364 7,000,000 Grants/Other 0 0 0 0 0 Total 2,814,636 0 0 4,185,364 7,000,000
SCHOOL FACILITIES MASTER PLAN Project Mission Develop a comprehensive, strategic long-range facilities master plan for Boston Public Schools that is cognizant of
needs across all neighborhoods and anticipates shifts in the student population. Managing Department, Public Facilities Department Status, Study Underway Location, Various neighborhoods Operating Impact, No
Authorizations
Source Existing FY17 FutureNon Capital
Fund Total City Capital 1,920,000 0 0 0 1,920,000 Grants/Other 0 0 0 0 0 Total 1,920,000 0 0 0 1,920,000
Expenditures (Actual and Planned)
Source Thru
6/30/15 FY16 FY17 FY18-21 Total City Capital 16,995 770,000 933,005 200,000 1,920,000 Grants/Other 0 0 0 0 0 Total 16,995 770,000 933,005 200,000 1,920,000

2 3 6 E d u c a t i o n • B o s t o n P u b l i c S c h o o l s
Boston Public Schools Project Profiles
SCHOOL YARD IMPROVEMENTS AT MURPHY SCHOOL Project Mission Design and construction of school yard improvements at the Murphy School. Managing Department, Public Facilities Department Status, In Construction Location, Dorchester Operating Impact, No
Authorizations
Source Existing FY17 FutureNon Capital
Fund Total City Capital 695,000 0 0 0 695,000 Grants/Other 0 0 0 0 0 Total 695,000 0 0 0 695,000
Expenditures (Actual and Planned)
Source Thru
6/30/15 FY16 FY17 FY18-21 Total City Capital 0 50,000 645,000 0 695,000 Grants/Other 0 0 0 0 0 Total 0 50,000 645,000 0 695,000
SCHOOL YARD IMPROVEMENTS AT OHRENBERGER SCHOOL Project Mission Install new play structures, safety surfacing, and landscaping improvements. Managing Department, School Department Status, In Construction Location, West Roxbury Operating Impact, No
Authorizations
Source Existing FY17 FutureNon Capital
Fund Total City Capital 376,000 0 0 0 376,000 Grants/Other 0 0 0 0 0 Total 376,000 0 0 0 376,000
Expenditures (Actual and Planned)
Source Thru
6/30/15 FY16 FY17 FY18-21 Total City Capital 0 125,000 251,000 0 376,000 Grants/Other 0 0 0 0 0 Total 0 125,000 251,000 0 376,000
E d u c a t i o n • B o s t o n P u b l i c S c h o o l s 2 3 7
Boston Public Schools Project Profiles
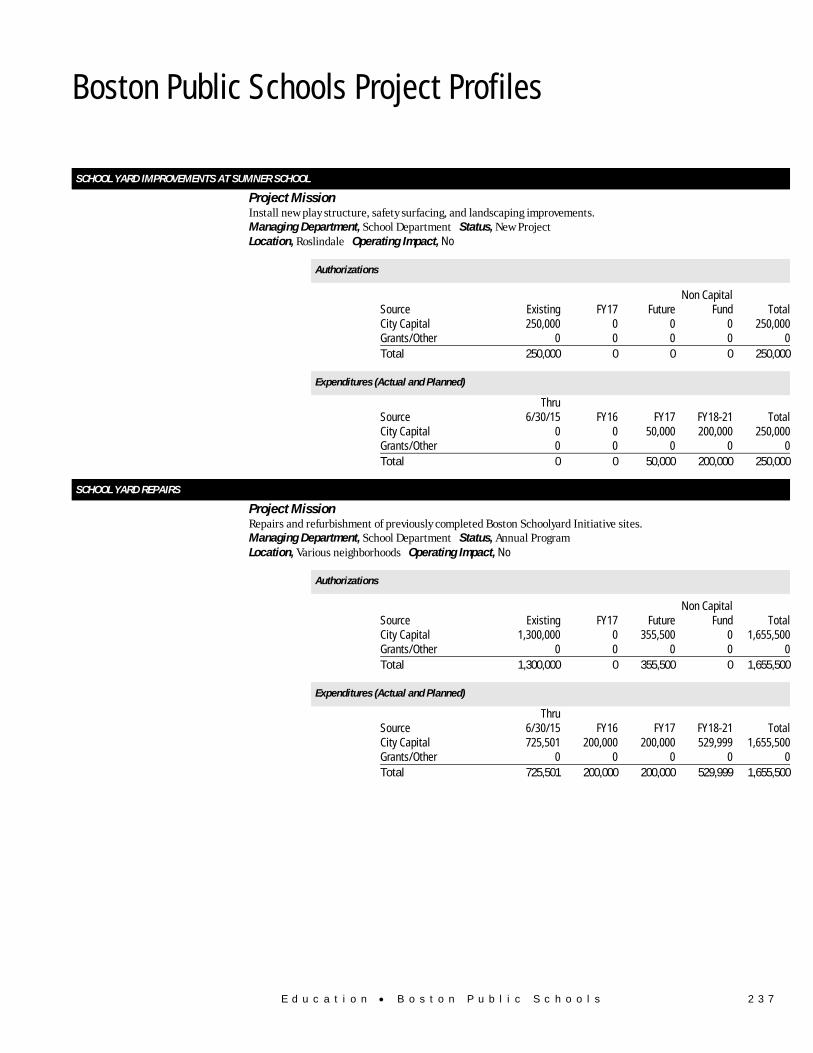
SCHOOL YARD IMPROVEMENTS AT SUMNER SCHOOL Project Mission Install new play structure, safety surfacing, and landscaping improvements. Managing Department, School Department Status, New Project Location, Roslindale Operating Impact, No
Authorizations
Source Existing FY17 FutureNon Capital
Fund Total City Capital 250,000 0 0 0 250,000 Grants/Other 0 0 0 0 0 Total 250,000 0 0 0 250,000
Expenditures (Actual and Planned)
Source Thru
6/30/15 FY16 FY17 FY18-21 Total City Capital 0 0 50,000 200,000 250,000 Grants/Other 0 0 0 0 0 Total 0 0 50,000 200,000 250,000
SCHOOL YARD REPAIRS Project Mission Repairs and refurbishment of previously completed Boston Schoolyard Initiative sites. Managing Department, School Department Status, Annual Program Location, Various neighborhoods Operating Impact, No
Authorizations
Source Existing FY17 FutureNon Capital
Fund Total City Capital 1,300,000 0 355,500 0 1,655,500 Grants/Other 0 0 0 0 0 Total 1,300,000 0 355,500 0 1,655,500
Expenditures (Actual and Planned)
Source Thru
6/30/15 FY16 FY17 FY18-21 Total City Capital 725,501 200,000 200,000 529,999 1,655,500 Grants/Other 0 0 0 0 0 Total 725,501 200,000 200,000 529,999 1,655,500
2 3 8 E d u c a t i o n • B o s t o n P u b l i c S c h o o l s
Boston Public Schools Project Profiles
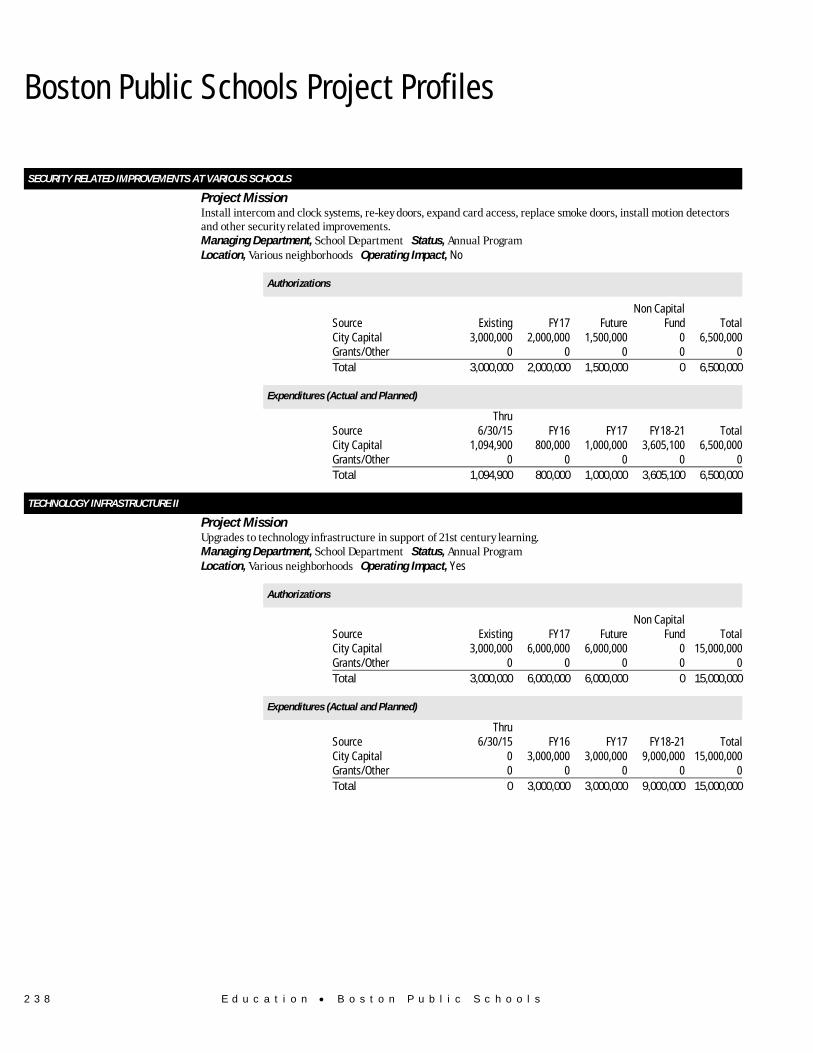
SECURITY RELATED IMPROVEMENTS AT VARIOUS SCHOOLS Project Mission Install intercom and clock systems, re-key doors, expand card access, replace smoke doors, install motion detectors
and other security related improvements. Managing Department, School Department Status, Annual Program Location, Various neighborhoods Operating Impact, No
Authorizations
Source Existing FY17 FutureNon Capital
Fund Total City Capital 3,000,000 2,000,000 1,500,000 0 6,500,000 Grants/Other 0 0 0 0 0 Total 3,000,000 2,000,000 1,500,000 0 6,500,000
Expenditures (Actual and Planned)
Source Thru
6/30/15 FY16 FY17 FY18-21 Total City Capital 1,094,900 800,000 1,000,000 3,605,100 6,500,000 Grants/Other 0 0 0 0 0 Total 1,094,900 800,000 1,000,000 3,605,100 6,500,000
TECHNOLOGY INFRASTRUCTURE II Project Mission Upgrades to technology infrastructure in support of 21st century learning. Managing Department, School Department Status, Annual Program Location, Various neighborhoods Operating Impact, Yes
Authorizations
Source Existing FY17 FutureNon Capital
Fund Total City Capital 3,000,000 6,000,000 6,000,000 0 15,000,000 Grants/Other 0 0 0 0 0 Total 3,000,000 6,000,000 6,000,000 0 15,000,000
Expenditures (Actual and Planned)
Source Thru
6/30/15 FY16 FY17 FY18-21 Total City Capital 0 3,000,000 3,000,000 9,000,000 15,000,000 Grants/Other 0 0 0 0 0 Total 0 3,000,000 3,000,000 9,000,000 15,000,000

E d u c a t i o n • B o s t o n P u b l i c S c h o o l s 2 3 9
Boston Public Schools Project Profiles
WINDOW REPLACEMENT AT VARIOUS SCHOOLS Project Mission Replace windows at various schools. Managing Department, School Department Status, Annual Program Location, Various neighborhoods Operating Impact, No
Authorizations
Source Existing FY17 FutureNon Capital
Fund Total City Capital 2,500,000 0 0 0 2,500,000 Grants/Other 0 0 0 0 0 Total 2,500,000 0 0 0 2,500,000
Expenditures (Actual and Planned)
Source Thru
6/30/15 FY16 FY17 FY18-21 Total City Capital 46,797 200,000 0 2,253,203 2,500,000 Grants/Other 0 0 0 0 0 Total 46,797 200,000 0 2,253,203 2,500,000
WINDOW REPLACEMENTS AT 7 SCHOOLS Project Mission Complete a feasibility study and develop schematic designs for window replacement projects at Community Academy,
Curley School, Ellis School, McKay K-8 School, Sumner School, TechBoston Academy, and Young Achievers K-8 School in partnership with the MSBA.
Managing Department, Public Facilities Department Status, In Design Location, Various neighborhoods Operating Impact, No
Authorizations
Source Existing FY17 FutureNon Capital
Fund Total City Capital 207,180 8,779,145 0 0 8,986,325 Grants/Other 392,820 16,364,018 0 0 16,756,838 Total 600,000 25,143,163 0 0 25,743,163
Expenditures (Actual and Planned)
Source Thru
6/30/15 FY16 FY17 FY18-21 Total City Capital 0 207,180 1,308,313 7,470,832 8,986,325 Grants/Other 0 392,820 2,430,148 13,933,870 16,756,838 Total 0 600,000 3,738,461 21,404,702 25,743,163