edpe_2013 dubrovnik, croatia 1 problem of obtaining boost converter bifurcation model for hysteretic...
TRANSCRIPT

EDPE_2013 Dubrovnik, Croatia 1
Problem of Obtaining Boost Converter Bifurcation Model for Hysteretic Behaviour
Željko Stojanović
Department of Electrical Engineering
Polytechnic of Zagreb
Denis Pelin, Krešimir Predrijevac
Faculty of Electrical Engineering
University of Osijek

EDPE_2013 Dubrovnik, Croatia 2
Contents
Introduction Boost converter physical realisation and measurements Simulation Comparison of simulation results and measurements Two-parameters bifurcation diagrams Conclusions

EDPE_2013 Dubrovnik, Croatia 3
Boost converter physical realisation and measurements
Schematic of the experimental boost converter
EDPE_2013 Dubrovnik, Croatia 4
Boost converter physical realisation and measurements
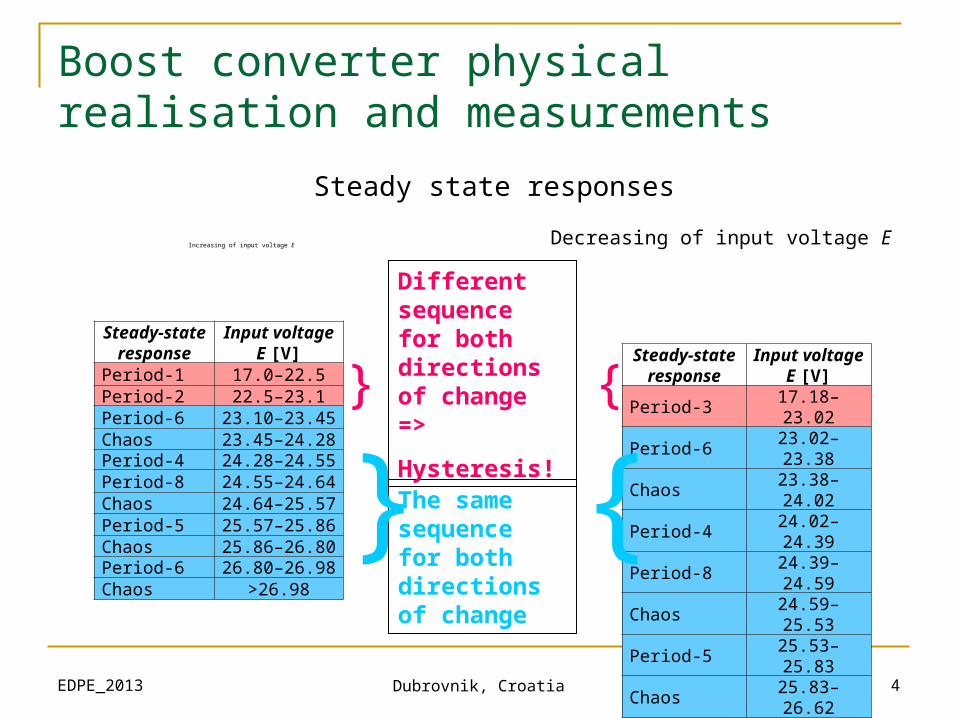
Increasing of input voltage EDecreasing of input voltage E
Steady-state response
Input voltage E [V]
Period-1 17.0–22.5Period-2 22.5–23.1Period-6 23.10–23.45Chaos 23.45–24.28Period-4 24.28–24.55Period-8 24.55–24.64Chaos 24.64–25.57Period-5 25.57–25.86Chaos 25.86–26.80Period-6 26.80–26.98Chaos >26.98
Steady-state response
Input voltage E [V]
Period-3 17.18–23.02Period-6 23.02–23.38Chaos 23.38–24.02Period-4 24.02–24.39Period-8 24.39–24.59Chaos 24.59–25.53Period-5 25.53–25.83Chaos 25.83–26.62Period-6 26.62–26.98
Steady state responses
The same sequence for both directions of change
Different sequence for both directions of change =>
Hysteresis!
} {
}
{

EDPE_2013 Dubrovnik, Croatia 5
Simulation
E Rd
L R
Cd
V2
V1

EDPE_2013 Dubrovnik, Croatia 6
Simulation

EDPE_2013 Dubrovnik, Croatia 7
Comparison of simulation results and measurements
Correspondence of measured and simulated steady-states for decreasing of input voltage E.
Steady-state response
Input voltage E [V]
Measuring Simulation
Period-3 to 23 V 22.5–23.05Period-6 23.00–23.27 23.03–23.22Period-9 – 23.22–23.32Chaos 23.27–24.07 23.32–24.06
Period-4 24.07–24.42 24.06–24.32Period-8 24.42–24.49 24.32–24.50Chaos 24.49–25.47 24.50–25.46
Period-5 25.47–25.68 25.46–25.70Chaos 25.68–26.63 25.70–26.66
Period-6 26.63–26.85 26.66–26.76Chaos 26.85–27 26.76–27
EDPE_2013 Dubrovnik, Croatia 8
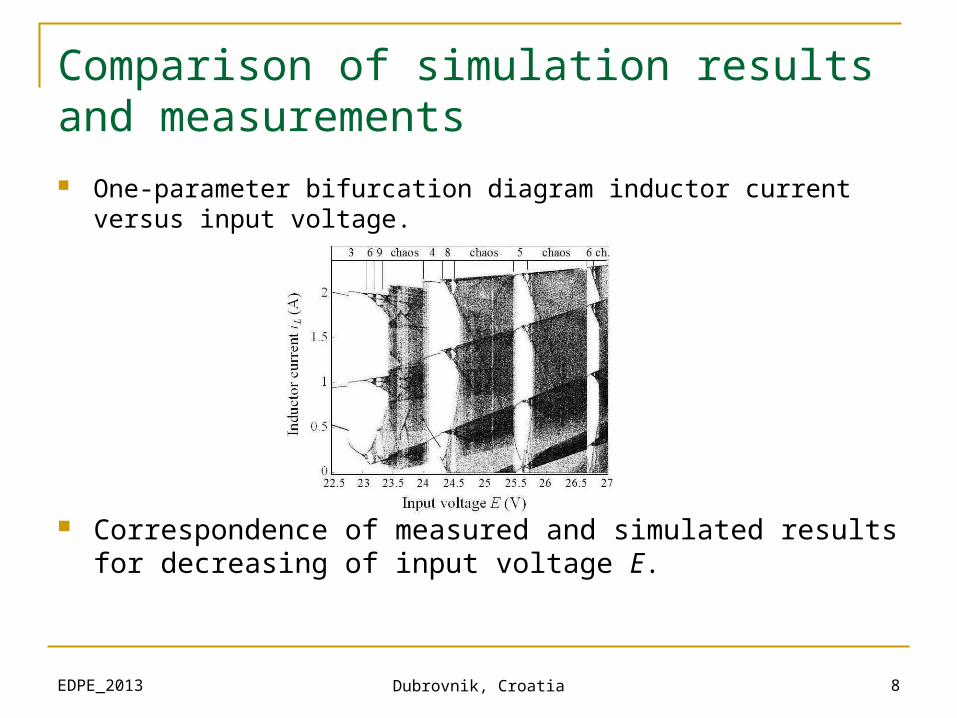
Comparison of simulation results and measurements
One-parameter bifurcation diagram inductor current versus input voltage.
Correspondence of measured and simulated results for decreasing of input voltage E.
EDPE_2013 Dubrovnik, Croatia 9
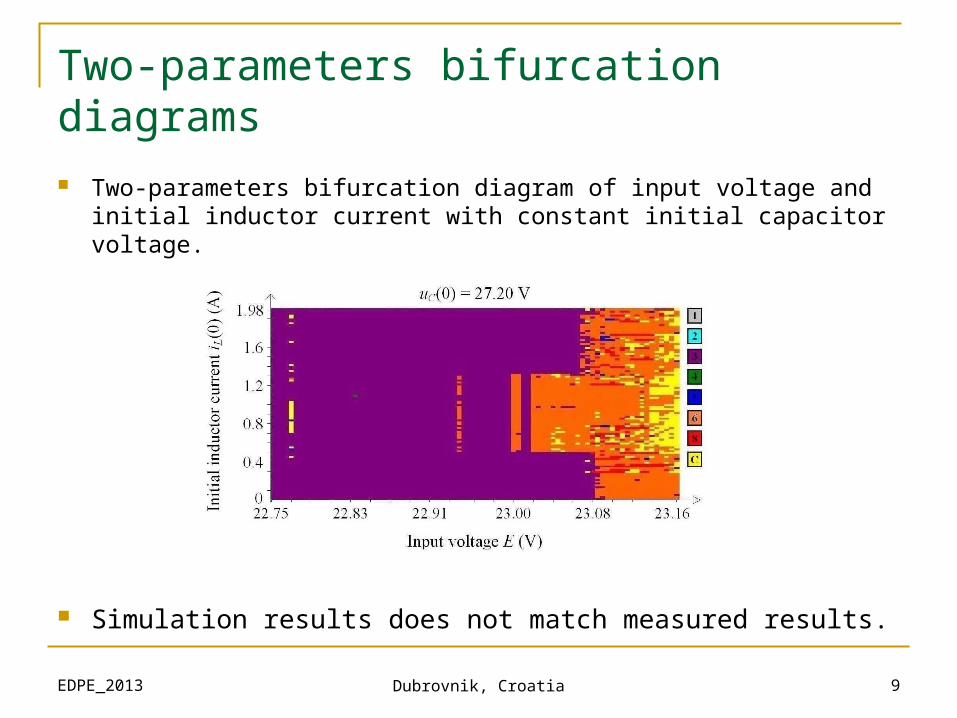
Two-parameters bifurcation diagrams
Two-parameters bifurcation diagram of input voltage and initial inductor current with constant initial capacitor voltage.
Simulation results does not match measured results.

EDPE_2013 Dubrovnik, Croatia 10
Two-parameters bifurcation diagrams
Two-parameters bifurcation diagram of initial capacitor voltage and initial inductor current with constant input voltage.
Simulation results does not match measured results.
EDPE_2013 Dubrovnik, Croatia 11
Conclusions
Bifurcation model is valid for only one direction of input voltage varying.
Change of two bifurcation parameter at the same time does not improve bifurcation model.
The next step is investigation of influence of ramp input voltage on bifurcation model.

EDPE_2013 Dubrovnik, Croatia 12
Thank you!
Questions please.