edhec working paper idiosyncratic risk f
TRANSCRIPT
8/3/2019 EDHEC Working Paper Idiosyncratic Risk F
http://slidepdf.com/reader/full/edhec-working-paper-idiosyncratic-risk-f 1/40
EDHEC-Risk Institute
393-400 promenade des Anglais06202 Nice Cedex 3Tel.: +33 (0)4 93 18 32 53E-mail: [email protected]: www.edhec-risk.com
Idiosyncratic Riskand the Cross-Section of Stock Returns
February 2011
Rene GarciaProfessor of Finane, EdhEc Business Soolan resear fellow at cIREQ an cIRANO
Daniel Mantilla-GarciaPd in Finane caniate, EdhEc Business Soolan Resear Assistant at EdhEc-Risk Institute
Lionel MartelliniProfessor of Finane, EdhEc Business Soolan Sientifi diretor of EdhEc-Risk Institute
with the support of

8/3/2019 EDHEC Working Paper Idiosyncratic Risk F
http://slidepdf.com/reader/full/edhec-working-paper-idiosyncratic-risk-f 2/40
AbstractIiosynrati volatility as reeive onsierable attention in te reent finanial literature.
Weter average iiosynrati volatility as reently risen, weter it is a goo preitor for
aggregate market returns an weter it as a positive relationsip wit expete returns in te
ross-setion are still matters of ative ebate. We revisit tese questions from a novel perspetive,
by taking te ross-setional variane of stok returns as a measure of average iiosynrati
variane. Two key avantages of tis measure are its moel-free nature an its observability at
any frequeny, wi allows us to present new results on te properties of aily iiosynrativolatility series. Troug entral limit arguments, we formally sow tat te ross-setional
ispersion of stok returns an be regare as a onsistent an asymptotially effiient estimator
for iiosynrati volatility. We empirially onfirm tat te ross-setional measure provies a
very goo proxy for average iiosynrati risk as implie by stanar asset priing moels an
tat it preits well aggregate returns, espeially at te aily frequeny. Te preitability power
of iiosynrati risk is furter inrease wen aing a measure of ross-setional skewness
to te ross-setional variane fator. We finally provie eviene tat iiosynrati risk is a
positively reware risk fator.
We tank Miel crouy, Robert Engle, Stépane Gregoir, Abraam Lioui, harrison hong, Frééri
Smaja, Georges Tauen, Stepane Ty, Vijay Vaiyanatan, Volker Ziemann, as well as seminaran onferene partiipants at EdhEc Business Sool, te Finanial Eonometris conferene
(Toulouse), te Finanial Eonometris Worksop (SMU), te conferene in Asset an Risk
Management in te Aftermat of te Finanial crisis (hEc Lausanne), for useful isussions an
omments. Tis resear as benefite from te support of te cair "Prouits Struturés et
Prouits dérivés", Féération Banaire Française.
EdhEc is one of te top five business sools in Frane. Its reputation is built on te ig quality
of its faulty an te privilege relationsip wit professionals tat te sool as ultivate
sine its establisment in 1906. EdhEc Business Sool as eie to raw on its extensive
knowlege of te professional environment an as terefore fouse its resear on temes tat
satisfy te nees of professionals.
EdhEc pursues an ative resear poliy in te fiel of finane. EdhEc-Risk Institute arries out
numerous resear programmes in te areas of asset alloation an risk management in bot te
traitional an alternative investment universes.
copyrigt © 2011 EdhEc

8/3/2019 EDHEC Working Paper Idiosyncratic Risk F
http://slidepdf.com/reader/full/edhec-working-paper-idiosyncratic-risk-f 3/40
3
1 - This amounts to imposing unit beta restrictions in an industry-market model.
2 - This is also the approach followed in Ang et al. (2006).
3 - Goyal and Santa-Clara (2003) argue infor mally that their measure can be interpreted as a measure of cross-sectional dispersion of stock returns, but do not establish a formal link between the two. In the
practitioners' literature (see DiBartolomeo (2006)), cross-sectional dispersion of returns is called variety and is used in risk management and performance analysis.
1. IntroductionTe reent finanial literature as pai onsierable attention to iiosynrati volatility. campbell
et al. (2001) an Malkiel an Xu (2002) oument tat iiosynrati volatility inrease over
time, wile Brant et al. (2009) sow tat tis tren ompletely reverse itself by 2007, falling
below pre-1990s levels an suggest tat te inrease in iiosynrati volatility troug te 1990s
was not a time tren but rater an "episoi penomenon". Bekaert et al. (2008) onfirm tat
tere is no tren bot for te Unite States an oter evelope ountries. A seon fat about
iiosynrati volatility is also a soure of ontention. Goyal an Santa-clara (2003) put forwartat iiosynrati volatility as foreasting power for future exess returns, wile Bali et al. (2005)
an Wei an Zang (2005) fin tat te positive relationsip is not robust to te sample osen.
Finally, wile some eonomi teories suggest tat iiosynrati volatility soul be positively
relate to expete returns, Ang et al. (2006) fin tat stoks wit ig iiosynrati volatility
ave low average returns.
An unerlying issue in all tese stuies is te measurement of iiosynrati volatility. campbell et
al. (2001) use a value-weigte sum of iniviual firm iiosynrati varianes, ompute as te
varianes of resiuals of ifferenes between iniviual firm returns an te return of an inustry
portfolio to wi te firm belongs.1 In aition to tis measure, Bekaert et al. (2008) use also teiniviual firm resiuals of a stanar Fama an Fren tree-fator moel to ompute a value-
weigte aggregate iiosynrati volatility.2
We revisit te issues regaring te ynamis an foreasting power of iiosynrati variane by using
instea te ross-setional ispersion of stok returns. Troug entral limit arguments, we provie
te formal onitions uner wi te ross-setional variane (cSV) of stok returns asymptotially
onverges towars te average iiosynrati variane.3 One key avantage of tis measure is obviously
its observability at any frequeny, wile te previous approaes ave use montly measures base
on time series of aily returns. A seon important feature is tat tis measure is moel-free, sine
we o not nee to obtain resiuals from a partiular moel to ompute it.
We onfirm empirially tat te ross-setional variane is an exellent proxy for te iiosynrati
variane obtaine from te cAPM or te Fama-Fren moels, as one in te previous literature.
correlations between te cSV measure an te moel-base measures estimate montly, are
always above 99%, weter we onsier equally-weigte or apitalization-weigte measures of
iiosynrati variane. We also estimate a regime-switing moel for cSV time series at bot aily
an montly frequenies an fin remarkably oerent results in terms of parameter estimates.
If we were to buil a aily series of moel-base iiosynrati variane, we will roll a winow of
one-mont of aily ata, wi will result in a very persistent time series. We onstrut su a
aily series but oul not fin any regimes. Tis reinfores te usefulness of te cSV to aptureiiosynrati volatility at ig frequeny.
Te regime-switing moel iniates learly tat te cSV is ounter-ylial, te ispersion of
returns being ig an quite variable wen eonomi growt subsies. We analyze furter te
relation between cSV an eonomi an finanial variables. In partiular, we fin tat tere exists
a substantial orrelation between te equal-weigte cSV an onsumption growt volatility.
Tis is onsistent wit Teongap (2010) wo provies strong eviene tat onsumption volatility
risk explains a ig perentage of te ross-setional ispersion in average stok returns for te
usual set of size an book-to-market portfolios tat ave been use in tests of asset priing
moels. In intertemporal asset priing moels of Bansal an Yaron (2004), Bollerslev et al. (2009)
an Bollerslev et al. (2009), onsumption growt volatility is a measure of eonomi unertainty,
wi is a prie risk fator tat affets returns, terefore proviing a rationale for te observe
orrelation between cSV an onsumption growt volatility.

8/3/2019 EDHEC Working Paper Idiosyncratic Risk F
http://slidepdf.com/reader/full/edhec-working-paper-idiosyncratic-risk-f 4/40
On te ebate about preitability of aggregate returns by te iiosynrati variane, we first
verify empirially tat te cSV measure leas to te same onlusions tat oter stuies (in
partiular Goyal an Santa-clara (2003) an Bali et al. (2005)) ave reporte at te montly
frequeny. Ten, we report new results at te aily frequeny. Speifially, we sow tat te
preitive power of iiosynrati volatility is mu stronger bot quantitatively an statistially
at te aily frequeny tan at te montly frequeny. Tis relationsip is robust to te inlusion of
return variane an option-implie variane as aitional variables in te preitive regressions.
We fin tat te relation is mu stronger an stable aross perios between te equally- weigte
measure of aggregate iiosynrati volatility an te returns on te equally-weigte inex tan
for te market-ap-weigte equivalents. Eonomi soures of eterogeneity between firms,
as iverse as tey an be, are better reflete in an equally weigte measure, all oter tings
being equal. Tis argument is onsistent wit previous finings in Bali et al. (2005), wo argue
tat te relationsip between equal-weigte average iiosynrati risk an te market-ap
weigte inex on te sample ening in 1999:12 is mostly riven by small stoks trae in te
NASdAQ. Of ourse, wen te bubble burst, te market apitalization of ot-om small firms was
relatively more affete ausing te relationsip to break own in 2000 an 2001. Tis effet is
not prevalent in an equally-weigte inex, for wi te relationsip remains strong.
however, te frequeny at wi preitive regressions are run as an important impat on
te results, sine at lower frequenies we fin little eviene of preitability for te equally-
weigte measure of cSV . At quarterly an annual frequenies, we fin tat te apitalization-
weigte measure of cSV is a very strong preitor of te aggregate value-weigte returns.
Wen using cSV cW alone as a preitor we obtain remarkable R 2s of 4% an 26% at quarterly an
annual frequenies, respetively. Aing te implie variane brings te R 2s to almost 19% an
29%. In all tese preitability regressions, te sign of te cSV cW variable is negative. We relate
tese results to potential explanations in terms of missing fators, Guo an Savikas (2008), or
ispersion of investors' opinions, cao et al. (2005).
Finally, we unveil an asymmetry in te relationsip between iiosynrati variane an returns
an sow tat te preitive power of speifi risk is substantially inrease wen a ross-
setional measure for iiosynrati skewness is ae as explanatory variable. In fat, tis is
yet anoter key avantage of our measure tat it lens itself to straigtforwar extensions to
iger-orer moments.
Te statistial signifiane of te moments of te ross-setional istribution in tese preitive
regressions of future returns is not te same as te ross-setional priing of stoks or portfolios.
however, as empasize in Goyal an Santa-clara (2003), te two piees of eviene are relate.Using a Fama-MaBet proeure wit several sets of portfolios, we fin support for a positive an
signifiant prie of risk for te exposure to te iiosynrati variane risk. Teoretial rationalizations
of a positive relation between iiosynrati risk an expete returns an be foun in te asset priing
literature. Levy (1978), Merton (1987) an Malkiel an Xu (2002) priing moels relate stok returns
to teir beta wit te market an teir beta to market-wie measures of iiosynrati risk. In tese
moels, an important portion of investors' portfolios may iffer from te market. Teir olings may
be affete by orporate ompensation poliies, borrowing onstraints, eterogeneous beliefs an
inlue non-trae assets tat a bakgroun risk to teir trae portfolio eisions (e.g. uman
apital an private businesses). Tese teoretial preitions are also in line wit campbell et al.'s
(2001) argument tat investors oling a limite number of stoks oping to approximate a well-
iversifie portfolio woul en up being affete by anges in iiosynrati volatility just as mu
as by anges in market volatility. More reently, Guo an Savikas (2008) argue tat anges in
average iiosynrati volatility provie a proxy for anges in te investment opportunity set an
tat tis proxy is losely relate to te book-to-market fator.4
4 - Alternative explanations of the relation between idiosyncratic risk and return are the firm's assets' call-option interpretation by Merton (1974) where equity is a function of total volatility as i n Black and
Scholes (1973) as well as Barberis et al. (2001) prospect theory asset pricing model with loss aversion over (owned) individual stock's variance.

8/3/2019 EDHEC Working Paper Idiosyncratic Risk F
http://slidepdf.com/reader/full/edhec-working-paper-idiosyncratic-risk-f 5/40
Ang et al. (2006) an Ang et al. (2009) fin results tat are opposite to our finings an to tese
teories sine stoks wit ig iiosynrati volatility ave low average returns but annot fully
rationalize tis result. however, huang et al. (2009) fin tat te negative sign in te relationsip
between iiosynrati variane an expete returns at te stok level beomes positive after
ontrolling for return reversals. Similarly, Fu (2009) ouments tat ig iiosynrati volatilities
of iniviual stoks are ontemporaneous wit ig returns, wi ten to reverse in te following
mont.
Te rest of te paper is organize as follows. In Setion 2, we provie a formal argument for
oosing te ross-setional variane of returns as a measure of average iiosynrati volatility,
explore its asymptoti an finite-istane properties, as well as te assumptions bein its use,
an ompare it to oter measures formerly selete in te literature. Setion 3 provies an
empirial implementation of te onept, again in omparison wit oter measures, by stuying
its time-series beavior, outlining te presene of regimes an a ounter-ylial property. In
Setion 4, we provie new results on te preitability of returns by iiosynrati volatility, an
we also exten te analysis to iiosynrati skewness. Setion 5 fouses on te analysis of te
ross-setional relationsip between iiosynrati risk an expete returns. Setion 6 onlues
an a tenial appenix ollets proofs an more formal erivations.
2. The Cross-sectional Variance as a Measure of Idiosyncratic VarianceLet N t be te total number of stoks in a given universe at ay t , an assume wit no loss of
generality a onitional single fator moel for exess stok returns.5 Tat is, we assume tat for
all i = 1,…, N t te return on stok i in exess of te risk-free rate an be written as:
(1)
were F t is te fator exess return at time t , it is te beta of stok i at time t , an ε it is te
resiual, wit E (ε it ) = 0 an ov (F t , ε it ) = 0. We assume tat te fator moel uner onsierationis a strit fator moel, tat is ov (ε it , ε jt ) = 0 for i ≠ j .6
Given T observations of te stok returns an te fator return, one an use te resiuals of te
regression to obtain a measure of te iiosynrati variane of asset i by:
An average measure of iiosynrati variane over te T observations (say a mont) an be
obtaine by averaging aross assets su iniviual iiosynrati variane estimates. Tis is te
approa tat as been followe by most relate papers wit observations of te returns at a
aily frequeny to ompute montly iiosynrati varianes. We propose instea to measure
at ea time t te ross-setional variane of observe stok returns. Using formal entral-
limit arguments, we sow tat, uner mil simplifying assumptions, tis ross-setional measureprovies a very goo approximation for average iiosynrati variane. In ontrast wit most
previous measures of average iiosynrati variane, te cSV offers two main avantages: it an
be ompute iretly from observe returns, wit no nee to estimate oter parameters su as
betas, an it is reaily available at any frequeny an for any universe of stoks.
2.1 Measuring the cross-sectional variance
To see tis, first let be a given weigt vetor proess. Te return on te portfolio efine
by te weigt vetor proess (w t ) is enote by an given by:
(2)
5
5 - Assuming a single factor structure is done for simplicity of exposure only and the results below can easily be extended to a multi-factor setting.
6 - This assumption is made in the single index or diagonal model of Sharpe (1963) and in the derivation of the APT in Ross (1976). It implies that all commonalities are explained by the factor model in
place. One should notice that the very denition of idiosyncratic risk relies precisely on the assumption of orthogonal residuals: assuming that the model is the "true" factor model implies that the "true"
idiosyncratic risk is the one measured with respect to that model, which in turn implies that no commonalities should be left after controlling for the common factor exposure.
8/3/2019 EDHEC Working Paper Idiosyncratic Risk F
http://slidepdf.com/reader/full/edhec-working-paper-idiosyncratic-risk-f 6/40
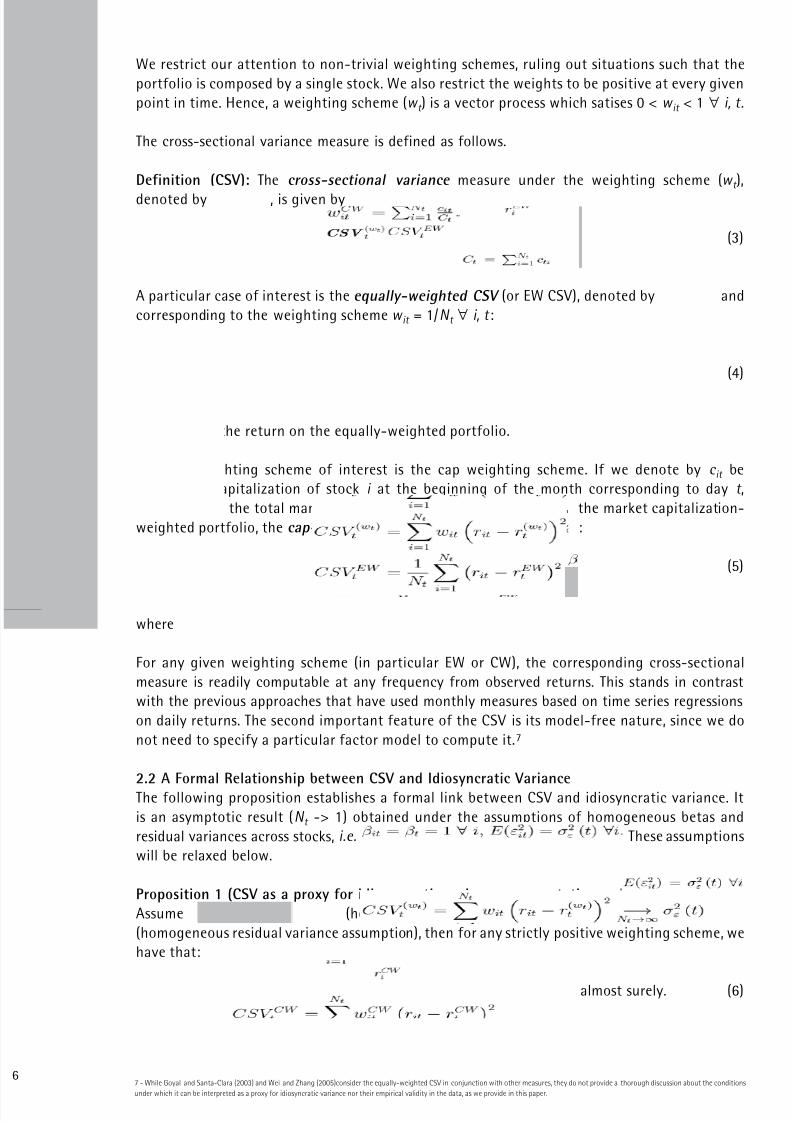
We restrit our attention to non-trivial weigting semes, ruling out situations su tat te
portfolio is ompose by a single stok. We also restrit te weigts to be positive at every given
point in time. hene, a weigting seme (w t ) is a vetor proess wi satises 0 < w it < 1 ∀ i, t .
Te ross-setional variane measure is efine as follows.
Definition (CSV): Te cross-sectional variance measure uner te weigting seme (w t ),
enote by , is given by
(3)
A partiular ase of interest is te equally-weighted CSV (or EW cSV), enote by an
orresponing to te weigting seme w it = 1/N t ∀ i, t :
(4)
were is te return on te equally-weigte portfolio.
Anoter weigting seme of interest is te ap weigting seme. If we enote by it be
te market apitalization of stok i at te beginning of te mont orresponing to ay t ,
te total market apitalization an te return on te market apitalization-
weigte portfolio, te cap-weighted (CW) (or cW cSV) is efine as:
(5)
were
For any given weigting seme (in partiular EW or cW), te orresponing ross-setional
measure is reaily omputable at any frequeny from observe returns. Tis stans in ontrast
wit te previous approaes tat ave use montly measures base on time series regressions
on aily returns. Te seon important feature of te cSV is its moel-free nature, sine we o
not nee to speify a partiular fator moel to ompute it.7
2.2 A Formal Relationship between CSV and Idiosyncratic VarianceTe following proposition establises a formal link between cSV an iiosynrati variane. It
is an asymptoti result (N t -> 1) obtaine uner te assumptions of omogeneous betas an
resiual varianes aross stoks, i.e. Tese assumptions
will be relaxe below.
Proposition 1 (CSV as a proxy for idiosyncratic variance - asymptotic results):
Assume (omogenous beta assumption) an
(omogeneous resiual variane assumption), ten for any stritly positive weigting seme, we
ave tat:
almost surely. (6)
7 - While Goyal and Santa-Clara (2003) and Wei and Zhang (2005)consider the equally-weighted CSV in conjunction with other measures, they do not provide a thorough discussion about the conditions
under which it can be interpreted as a proxy for idiosyncratic variance nor their empirical validity in the data, as we provide in this paper.

8/3/2019 EDHEC Working Paper Idiosyncratic Risk F
http://slidepdf.com/reader/full/edhec-working-paper-idiosyncratic-risk-f 7/40
7
Proof See Appenix A.
Tis result is important beause it raws a formal relationsip between te ynamis of te
ross-setional ispersion of realize returns an te ynamis of iiosynrati variane. Note
tat tis asymptoti result ols for any weigting seme tat satisfies
. Of ourse, at finite istane, ifferent weigting semes will generate
ifferent proxies for iiosynrati variane. In te empirial analysis tat follows, we sall
fous on te equally-weigte seme, wile also onsiering te ap-weigte seme
for omparison purposes. Formal justiation for our fous on te equally-weigte semeis provie in te next setion, were we sow tat te EW cSV is te best estimator for
iiosynrati variane witin te lass of cSV obtaine uner a stritly positive weigting
seme.
2.3 Properties of CSV as an Estimator for Idiosyncratic Variance
First, we erive in Proposition 2 te bias an te variane of te cSV as an estimator of iiosynrati
variane. Ten we stuy teir asymptoti limits as te number of firms grows large an onlue
tat te equally-weigte cSV is te best among all positively-weigte estimators.
Proposition 2 (Bias and variance of CSV) :Maintaining the homogeneous beta assumption an the homogeneous
resiual variane assumption , for any stritly positive weighting sheme,
we have that:
(7)
To analyze the variane of the cSV estimator, we further make the assumption of multi-variate
normal resiuals , where Σ ε enotes the variane-ovariane matrix of the resiuals.
Uner this aitional assumption, we obtain:
(8)
Proof See Appenix B for a proof in te sligtly more general ase wen te omogeneous speifi
variane assumption as been relaxe. hene te cSV is a biase estimator for iiosynrati
variane, wit a bias given by te multipliative fator , wi an be easily
orrete for sine it is available in expliit form. In te en, te bias an variane of te cSV
appear to be minimum for te EW seme, wi orrespons to taking w it = 1/N t at ea ate t .
It is easy to see, tat tis bias isappears an te variane tens to zero for te equally-weigte
seme wen te number of stoks grows large, as explaine in te following proposition.
Proposition 3 (Properties of the equally-weighted CSV)
The bias an variane of the EW cSV as an estimator for speifi variane isappear in the limit
of an inreasingly large number of stoks:
Proof See Appenix B for a proof in te sligtly more general ase wen te omogeneous
speifi variane assumption as been relaxe.
Te equally-weigte cSV tus appears to be a onsistent an asymptotially effiient estimator
for iiosynrati variane. As su, it is te best estimator in te lass of cSV estimators efine
uner any positive weigting seme, an it ominates in partiular te ap-weigte cSV as an
7
8/3/2019 EDHEC Working Paper Idiosyncratic Risk F
http://slidepdf.com/reader/full/edhec-working-paper-idiosyncratic-risk-f 8/40
estimator for iiosynrati variane. If we relax te omogeneous resiual variane assumption,
we obtain tat:
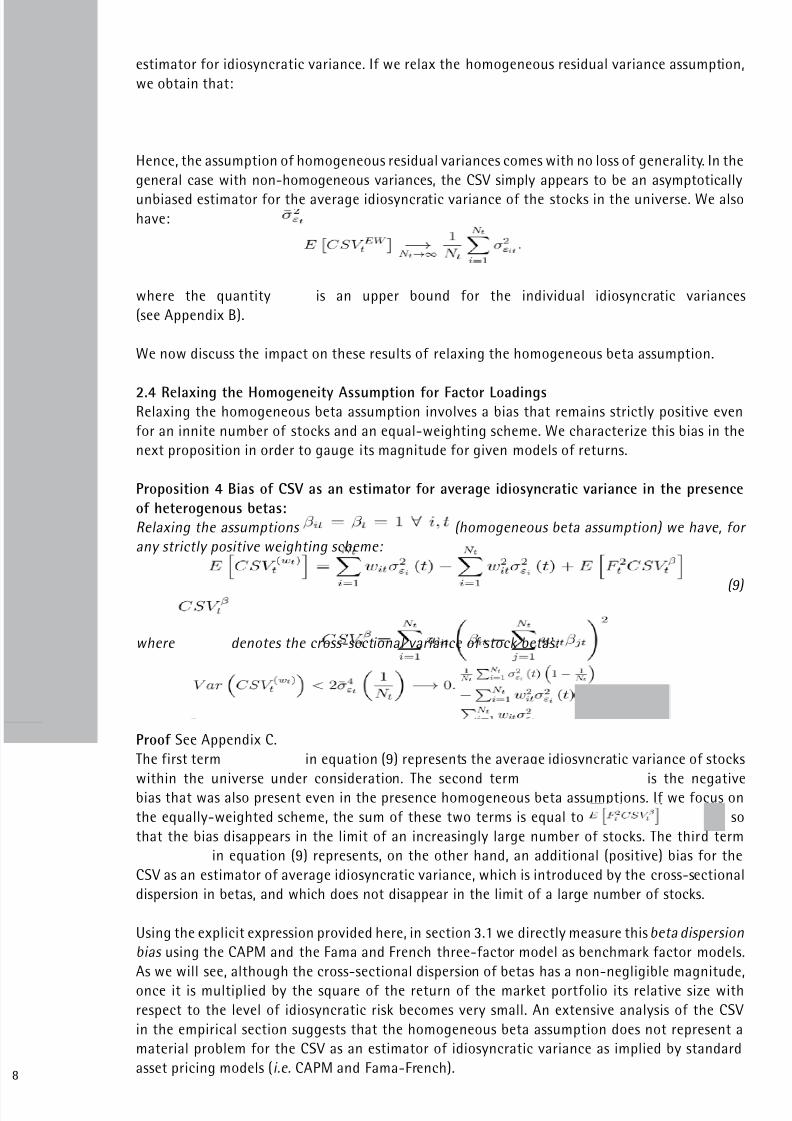
hene, te assumption of omogeneous resiual varianes omes wit no loss of generality. In te
general ase wit non-omogeneous varianes, te cSV simply appears to be an asymptotially
unbiase estimator for te average iiosynrati variane of te stoks in te universe. We alsoave:
were te quantity is an upper boun for te iniviual iiosynrati varianes
(see Appenix B).
We now isuss te impat on tese results of relaxing te omogeneous beta assumption.
2.4 Relaxing the Homogeneity Assumption for Factor LoadingsRelaxing te omogeneous beta assumption involves a bias tat remains stritly positive even
for an innite number of stoks an an equal-weigting seme. We araterize tis bias in te
next proposition in orer to gauge its magnitue for given moels of returns.
Proposition 4 Bias of CSV as an estimator for average idiosyncratic variance in the presence
of heterogenous betas:
Relaxing the assumptions (homogeneous beta assumption) we have, for
any stritly positive weighting sheme:
(9)
where enotes the ross-setional variane of stok betas:
Proof See Appenix c.
Te first term in equation (9) represents te average iiosynrati variane of stoks
witin te universe uner onsieration. Te seon term is te negativebias tat was also present even in te presene omogeneous beta assumptions. If we fous on
te equally-weigte seme, te sum of tese two terms is equal to so
tat te bias isappears in te limit of an inreasingly large number of stoks. Te tir term
in equation (9) represents, on te oter an, an aitional (positive) bias for te
cSV as an estimator of average iiosynrati variane, wi is introue by te ross-setional
ispersion in betas, an wi oes not isappear in te limit of a large number of stoks.
Using te expliit expression provie ere, in setion 3.1 we iretly measure tis beta ispersion
bias using te cAPM an te Fama an Fren tree-fator moel as benmark fator moels.
As we will see, altoug te ross-setional ispersion of betas as a non-negligible magnitue,
one it is multiplie by te square of te return of te market portfolio its relative size wit
respet to te level of iiosynrati risk beomes very small. An extensive analysis of te cSV
in te empirial setion suggests tat te omogeneous beta assumption oes not represent a
material problem for te cSV as an estimator of iiosynrati variane as implie by stanar
asset priing moels (i.e. cAPM an Fama-Fren).

8/3/2019 EDHEC Working Paper Idiosyncratic Risk F
http://slidepdf.com/reader/full/edhec-working-paper-idiosyncratic-risk-f 9/40
2.5 Competing Measures of Idiosyncratic Risk
In tis setion, we esribe measures tat ave been use in te literature, an wi will be use
for omparison purposes in subsequent setions of te paper. Te stanar approa onsists of
onsiering iiosynrati variane eiter relative to te cAPM an or to te Fama-Fren (FF)
moel (Fama an Fren (1993)):
(10)
were r it enotes te exess return at time t of stok i , XMKT is te exess return on te marketportfolio, SMB is te size fator an hML is te value fator. Te iiosynrati variane for asset
i is te variane of te resiuals of te regression, tat is, . To obtain an estimate for
average iiosynrati variane, Bekaert et al. (2008) an Wei an Zang (2006) use a market
apitalization weigting:
(11)
For omparison purposes we also look at te equally-weigte average of FF iiosynrati variane in
wat follows. An alternative approa to average (mostly ) iiosynrati risk estimation as beensuggeste by Goyal an Santa-clara (2003), wit a measure given by:
(12)
were r i is te return on stok i in ay an d t is te number of traing ays in mont t .8
campbell et al. (2001) propose yet an alternative measure of average iiosynrati variane, uner
a very partiular setting tat allows one to avoi running regressions ea perio.9
however,teir measure is not instantaneous sine a winow of ata is still neee to estimate iniviual
varianes. In wat follows, we o not repeat te analysis wit tis measure beause Bekaert et
al. (2008) ave sown tat it is very losely relate to te measure obtaine from stanar asset
priing moels. In partiular, Bekaert et al. (2008) fin tat te measure of campbell et al. (2001)
an te FF-base one ave a orrelation of 98% an sare most of te same strutural breaks.
3. Empirical ImplementationIn orer to perform an empirial analysis of our measure for iiosynrati risk, we ollet aily US
stok returns (ommon equity sares only) an teir market apitalization from cRSP ata base.Our longest sample runs from July 1963 to deember 2006. We also extrat te FF fators an te
one-mont Treasury bill from Kennet Fren web-site ata library for te same sample perio.
Ea mont, we rop stoks wit missing returns an wit non-positive market apitalization
at te beginning of te mont. Te number of firms varies between 377 an 7293, an remains
greater tan one tousan 75% of te time. Te maximum number of stoks is reae uring
te .om bubble. Ten, we estimate every mont te ap-weigte iiosynrati variane as in
equation (11), as well as te equal-weigte version.10 Similarly, we estimate te ap-weigte
an equal weigte average iiosynrati variane relative to te cAPM. We also estimate te GS
average variane measure as in equation (12) an its ap-weigte version. Finally, we estimate
on a aily basis te equal an ap-weigte versions of te cSV as in equations (4) an (5). In
orer to onstrut te montly series for our ross-setional measures, we estimate te average
of te aily series at te en of ea mont. For omparison purposes we also estimate te
FF-base average iiosynrati variane (EW an cW) on a aily basis using a rolling winow
sample of one mont. We annualize all figures in orer to ompare aily an montly measures.
98 - As in Goyal and Santa-Clara (2003), when the second term makes the estimate negative, it is ignored. This measure has been originally used in French et al. (1987).
9 - They assume that all betas are equal to one and substract industry returns in addition to market returns to control for risk.
10 - We use previous period market capitalization and assume it is constant within the month.
8/3/2019 EDHEC Working Paper Idiosyncratic Risk F
http://slidepdf.com/reader/full/edhec-working-paper-idiosyncratic-risk-f 10/40
11 - This is measured as in equation (11) with just the market returns with both weighting schemes.
12 - As noted earlier, it would be straightforward to remove the impact of this bias by dividing the CSV measure by the factor , equal to in the EW case.
Following Bekaert et al. (2008), we fit a regime-switing moel to te montly an aily series
in orer to furter ompare te ierent measures. Last, we look at te relation between te cSV
measures of iiosynrati variane an selete eonomi an finanial variables.
3.1 Measuring the CSV bias
Some of te previous resear on iiosynrati volatility as been onute uner te assumption
of omogeneous betas aross stoks (see campbell et al. (2001) an Goyal an Santa-clara (2003)
in partiular). As illustrate in Proposition 4 an isusse in Appenix c, te presene of non-omogeneous betas introues a positive bias on te cSV as an estimator for average iiosynrati
variane, wi is given by te first term in equation (9). We now measure te impat of tis bias
wit respet to te cAPM as a benmark moel.
First, we ompute te bias for every mont in te sample using beta estimates for
ea stok wit bot te equal-weigte an te ap-weigte market returns. To gauge its
importane, we ivie it by te average iiosynrati variane, also measure wit respet to te
cAPM.11
Table 1 presents a summary of te istribution of te time series of ross-setional ispersionof betas, its prout wit te square return of te market portfolio (ene te bias itself) an
te proportion of tis bias wit respet to te average iiosynrati variane at te en of every
mont. Altoug te ross-setional ispersion of betas is sizable, one it is multiplie by te
square return of te market portfolio, te size of te bias remains relatively small. Te meian
of te istribution of , is 0.348% for te equal-weigte seme an 0.351% for te ap-
weigte measure, ompute over te wole sample (July 1963 to deember 2006). Te 97.5
quantiles are 3.24 an 3.47 respetively.
On te oter an, te formal isussion about te properties of te cSV as a measure of
iiosynrati variane on setion 2.4 also unovere te fat tat anoter bias (but negativein sign) oming from te cSV weigting seme onentration is also introue. Proposition 2
preits two properties about tis weigting bias: first, it soul be negative an minimal for an
equally-weigte seme. Seon, it soul be very small for a ig number of stoks. Te beta-
bias ten is more likely to ominate te onentration-bias wen using an equal-weigt seme.
Using te expliit expression for tis bias provie in Proposition 4 we estimate te proportion
of te size of tis weigts-onentration bias wit respet to te average iiosynrati varianes
implie by te cAPM.12 In te last line of te upper an lower panels of Table 1 we report
quantiles of te istribution of tis bias for bot weigting semes. Te orresponing meians
are 0.030% an 0.426% for te EW an cW semes respetively. Sine te bias is of opposite
sign to te beta ross-setional ispersion bias, we nee to assess te resulting overall bias.
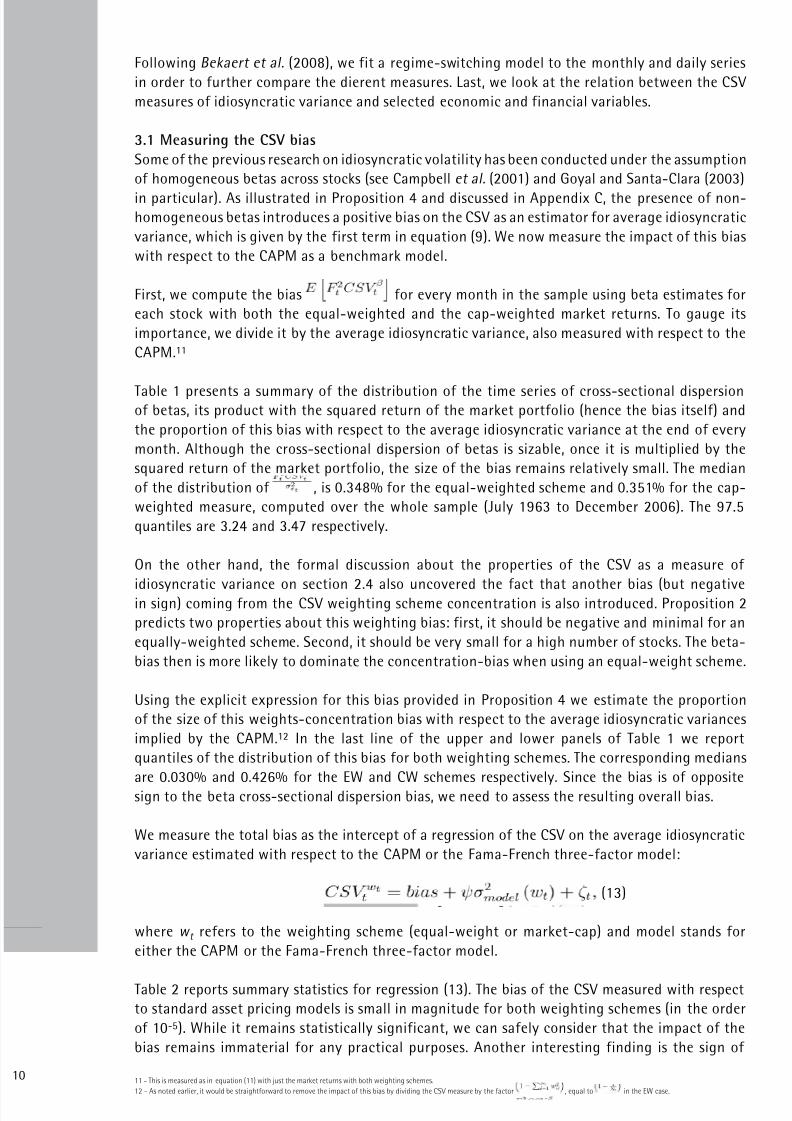
We measure te total bias as te interept of a regression of te cSV on te average iiosynrati
variane estimate wit respet to te cAPM or te Fama-Fren tree-fator moel:
(13)
were w t refers to te weigting seme (equal-weigt or market-ap) an moel stans for
eiter te cAPM or te Fama-Fren tree-fator moel.
Table 2 reports summary statistis for regression (13). Te bias of te cSV measure wit respet
to stanar asset priing moels is small in magnitue for bot weigting semes (in te orer
of 10-5). Wile it remains statistially signifiant, we an safely onsier tat te impat of te
bias remains immaterial for any pratial purposes. Anoter interesting fining is te sign of

8/3/2019 EDHEC Working Paper Idiosyncratic Risk F
http://slidepdf.com/reader/full/edhec-working-paper-idiosyncratic-risk-f 11/40
te bias. For te equal-weigte quantities, te sign of te bias is positive, wile it is negative
for te ap-weigte ones. Terefore, te beta bias ominates te weigting bias for equal-
weigte averages in bot moels. Tis is onsistent wit te preition mae by te teoretial
analysis regaring te relative impat of te weigting-bias for ifferent weigting semes.
Regaring te moel, te bias is larger wen te iiosynrati variane is measure wit respet
to te Fama-Fren moel instea of te cAPM for bot weigting semes, as expete, but its
magnitue remains negligible.
3.2 Comparison with Other Measures
In tis setion we ompare te cSV measure to te afore-mentione, more onventional, measures
of iiosynrati risk (i.e., FF-base, cAPM-base an GS). To obtain tese oter measures, we
nee to re-estimate te relevant fator moel using a rolling winow of one-mont wort of
aily ata to allow for time-variation in beta estimates (or total-variane variation for te GS).
In Table 3, we report summary statistis for te montly time series of annualize iiosynrati
varianes base on 516 observations from January 1964 to deember 2006.13
On te montly series, te annualize means of te equally-weigte cSV, FF-base an
cAPM-base measures are 38.4%, 38.3% an 38.7%, respetively, wile te EW GS variane is34.2%. Te stanar eviations are 8.5%, 8.6%, 8.7% for te cSV, FF-base an cAPM-base
measures an 7.0% for te GS measure. For te ap-weigte version, te cSV, FF an cAPM
iiosynrati variane measures ave an annualize mean of 8.5%, 7.6%, 8.0%, respetively
an te GS measure mean is 11.2%. Te stanar eviations are also loser for te cSV, FF an
cAPM measures tan for GS. Altoug GS argue tat teir measure funamentally onstitutes
a measure of iiosynrati risk, wit te iiosynrati omponent aounting for about 85% of
te total EW average measure, it is stritly speaking an average of total stok variane. Our cSV
measure is very lose to iiosynrati variane measures erive from traitional asset priing
moels, onfirming tat te assumption tat beta omogeneity is not a major problem.
Te ross-orrelation matrix reporte in Table 3 provies furter eviene on te loseness of
te cSV to te oter moel-base measures. correlations are very ig between cSV EW an
cAPM EW (99.93%) an FF EW (99.75%, as well as between cSV cW an cAPM cW (99.48%) an cSV cW
an FF cW (98.56%). Te ig orrelations between te cAPM an te FF measures (99.88% an
99.18% for EW an cW respetively) also iniate tat aing fators oes not rastially affet
te estimation of iiosynrati variane. correlations between te GS measures an te oter
measures are always smaller but remain lose to 90% wen onsiering te same weigting
seme. correlations between measures for ifferent weigting semes are mu lower,
irrespetive of te estimation meto, iniating tat te oie over te weigting seme
is funamentally important for estimating iiosynrati variane, as stresse in our teoretialanalysis in setion 2.
Table 4 provies mean an stanar-eviation estimates for te aily average iiosynrati variane
measures. Te mean of te EW cSV is 38.4%, pratially equal to te mean of EW iiosynrati
variane base on te FF moel. For te ap-weigte measures, te cSV as a sligtly iger
mean tan te FF-base one. For te cSV aily series, te stanar eviation is iger tan for
te FF-base measure for bot weigting semes. Tis is ue to te ifferent nature of te two
series. Te cSV only inlues information from te ross-setion of realize returns, wile te FF
iiosynrati variane is a persistent, overlapping, rolling-winow estimate. Ea aily estimate of
iiosynrati variane for te FF moel iffers from te previous one by only two observations out
of te approximately 21 traing ays inlue in a mont (te first an last ays).
Te smootness of te iiosynrati variane estimates obtaine wit te rolling-winow
metoology is illustrate in Figures 1 an 2, wi plot aily cSV an FF iiosynrati varianes
1113 - In this section of the paper, we start the sample period in January 1964 to allow for direct comparison with Bekaert et al. (2008). In the predictability section, we instead start the sample in July 1963.

8/3/2019 EDHEC Working Paper Idiosyncratic Risk F
http://slidepdf.com/reader/full/edhec-working-paper-idiosyncratic-risk-f 12/40
for ea weigting seme respetively. It soul also be note tat te estimation of te FF-
measure is omputationally mu more expensive tan for te cSV measure, wi is base on
observable quantities.
Te lower panel of Table 4 presents ross-orrelations for te aily series of iiosynrati variane
measures. Altoug te oeffiients are smaller tan for te montly series, te relationsip
remains strong provie te omparison is one for te same weigting seme: 82.6% an
73.9% for EW an cW measures respetively. Te ifferene wit te montly series orrelationsmay again be explaine by te presene of te smoote estimation proeure inerent to te FF-
base measure. Overall, it appears tat te cSV measure is extremely lose to cAPM or FF-base
measures at te montly frequeny, wen te latter measures suffer from no partiular bias, an
tat te cSV measure appears to be a goo an instantaneous proxy for iiosynrati variane
at te aily frequeny, wen te stanar measures are subjet to artifiial smooting ue to
overlapping ata.
3.3 Extracting Regimes in Idiosyncratic Risk
Bekaert et al. (2008) t a Markov regime-switing moel wit a first-orer autoorrelation
struture (see hamilton (1989)) for te montly series of iiosynrati variane base on te FFmoel. In tis setion, we want to estimate tis moel wit our cSV measure bot at te montly
an aily frequenies. Wile we expet tat te t will be lose to Bekaert et al. (2008) for te
montly series given our previous results on te similarity of te series, we want to verify weter
su a moel provies a similar t for te aily series.
In tis moel, two regimes are inexe by a isrete state variable, s t , wi follows a Markov-
ain proess wit onstant transition probabilities. Let te urrent regime be inexe by i an
te past regime by j an x t be te original iiosynrati variane. In tis parsimonious moel, x t follows an AR(1) moel:
(14)
Te transition probabilities are enote by p = P [s t = 1|s t -1 = 1] an q = P [s t = 2|s t -1 = 2]). Te
moel involves a total of seven parameters, µ 1, µ 2, σ 1, σ 2, φ, p , q.
We first verify tat te cSV an te FF-base measures give te same results for te montly series.
Te estimation results for te montly series of te FF cW , cSV cW , FF EW an cSV EW are reporte in
te upper panel of Table 5. For orresponing weigting semes, te parameters in bot regimes
are similar between te two measures. For bot measures te low-mean, low-variane regime
presents a iger probability of remaining in te same state.
We ten fit te same moel to te aily time series an present te parameter estimates in te
lower panel of Table 5. It soul be stresse tat for our cSV measure, te parameter values
of te average level of iiosynrati variane µ in bot regimes are foun to be quite lose to
te values obtaine wit te montly series. Tis result suggests tat te proess observe at
te aily frequeny is not just a noisy series, but atually aptures te same unerlying proess
observe at te montly frequeny. Tis stans in sarp ontrast wit te FF-base measure,
for wi te maximum-likelioo estimation proeure oul not reognize two regimes wen
aily ata is use, as eviene by te fat tat te parameter values for te mean level of
iiosynrati variane are basially te same for te two regimes. Tis problem, ombine wit
an autoorrelation parameter very lose to one, is likely ause by te overlapping ata problem
present in te aily FF measure, wi orrespons to te smoothing effet mentione in te
previous setion.
In Figures 3 an 4 we plot te filtere probabilities (onitional on information up to time t ) of
remaining in state 1 (ig-mean an ig variane regime), as well as te montly cSV an FF

8/3/2019 EDHEC Working Paper Idiosyncratic Risk F
http://slidepdf.com/reader/full/edhec-working-paper-idiosyncratic-risk-f 13/40
average iiosynrati variane time series for te cW an EW weigting semes, respetively.14
At te montly frequeny, our measure an te FF-base measure appear to be remarkably lose
for bot te equal-weigte an ap-weigte semes. Also, we fin tat te ates of regime
anges, marke by te filtere probabilities, are te same most of te times for te ap-weigte
an te equal-weigte measures.15 We also fin tat perios in te iger-mean an iger-
variane regime are more persistent for te equally-weigte measure ompare to te ap-
weigte measure (exept uring te te bubble perio).
Overall, our filtere probability series resembles losely te one presente in Bekaert et al. (2008)
for te ap-weigte FF an campbell et al. (2001) measures.16
Te sae areas in Figures 3 an 4, wi time stamp te NBER reession perios, iniate tat
te peaks in te probability of remaining in te ig-mean ig-variane regime oinie most
of te times wit te ontration perios. Terefore, te cSV measure is ounter-ylial, te
ispersion of returns being ig an quite variable wen eonomi growt subsies. In te next
setion, we want to analyze furter te relation between te cSV an oter eonomi an nanial
variables.
3.4 CSV Relation with Economic and Financial Variables
To put tis analysis in te proper ontext, we soul go bak to te very nature of iiosynrati
risk. In an asset priing moel, it represents te risk tat belongs speially to an iniviual firm,
after aounting for te soures of risk tat are ommon to all firms. In te previous setions,
we ave sown tat te ross-setional variane of returns provies a very goo measure of tis
iiosynrati risk, even if it ignores te risk exposures to te usual ommon risk fators su as
te market return or te Fama-Fren fators. Yet we onlue our time series analysis of cSV by
stressing its strong ounter-ylial beavior. To pursue tis analysis furter we nee terefore to
rely on equilibrium moels tat link returns to eonomi funamentals. Reently, Bansal an Yaron
(2004) ave revive onsumption-base asset priing moels by sowing tat two soures of long-run risk — expete onsumption growt an onsumption volatility as a measure of eonomi
unertainty — etermine asset returns. Furter, Teongap (2010) provies strong eviene tat
onsumption volatility risk explains a ig perentage of te ross-setional ispersion in average
stok returns for te usual set of size an book-to-market portfolios tat ave been use in tests
of asset priing moels. Anoter stran of literature base on te intertemporal cAPM or te
onitional cAPM as linke te ross-setion of expete returns to oter eonomi or finanial
variables su as te term sprea, efault sprea, implie or realize measures of aggregate returns
variane, an many oters.
Wile our cSV measure is base on te ross-setional ispersion of realize returns over tewole universe of trae stoks, as oppose to te ross-setional ispersion of average returns
of a limite number of size an book-to-market portfolios, te same teoretial impliations
soul prevail. Terefore, we present below a simple orrelation an grapial analysis of te
relation between te cSV an some of tese key variables. For te eonomi variables, we ose
onsumption-growt volatility as a measure of eonomi unertainty. Following Bansal an Yaron
(2004) an Teongap (2010), we filter onsumption-growt volatility wit a GARch moel. For
onsumption, we use FREd's personal onsumption expenitures of non-urables an servies
montly series, ivie by te onsumer prie inex an te population values to obtain a per-
apita real onsumption series. We ten ompute its growt rate from July 1963 to 2006.17 Te
seon eonomi variable we onsier is inflation volatility, wi we filter also wit a GARch
proess.18 For te finanial variables we use Wel an Goyal's (2008)'s ata for orporate bon
13
14 - These are estimates of the transition probabilities conditional to information up to time t given all sample data.
15 - One notable exception is the regime change of 1980 : 05, which is present for the cap-weighted measure and absent for the equally-weighted one.
16 - The small diff erence might come from the fact that Bekaert et al. (2008) t a model with two different autocorrelation coefficients (one for each regime) as opposed to one. However, they find the two
coefficients to be fundamentally equal in both regimes, which supports using a more parsimonious model.
17 - The series IDs at the FRED's webpage are, PCEND and PCES for "Personal Consumption Expenditures: Nondurable Goods" and "Personal Consumption Expenditures: Services", CPIAUCNS for "Consumer
Price Index for All Urban Consumers: All Items" and POP for "Total Population: All Ages including Armed Forces Overseas". Bansal and Yaron (2004) used the Bureau of Economic Analysis data available at
www.bea.gov/national/consumer spending.htm on real per-capita annual consumption growth of non-durables and services for the period 1929 to 1998. The series is longer but is available only at annual
and quarterly frequencies.
18 - For space considerations, we do not report parameter estimates for the two AR(1)-Garch(1,1) we estimate. They are available upon request from the authors.

8/3/2019 EDHEC Working Paper Idiosyncratic Risk F
http://slidepdf.com/reader/full/edhec-working-paper-idiosyncratic-risk-f 14/40
yiels on BAA an AAA-rate bons, long-term government bon yiel an 3-mont T-bill rate
to estimate te reit sprea an term sprea (as te ifferene between te first an te seon
rate in bot ases).19 In Table 6 we report te orrelations between te equally-weigte an
ap-weigte measures of ross-setional variane an te five eonomi an finanial variables
uring te 1990-2006 perio. We also explore some potential asymmetries by omputing te
cSV EW for te positive an negative returns.
Te igest orrelation (0.401) is obtaine between onsumption growt volatility an teequally-weigte measure cSV EW . In Figure 5 we plot te two series for te perio 1990 to
2006. Wile te cSV series is mu noisier tan onsumption-growt volatility, te oinient
movements between te two series are quite remarkable. After a ig volatile perio just before
2000, bot series sow a marke ownwar tren after te turn of te entury. A reasonable
explanation for tis strong orrelation is to tink about a ommon fator (aggregate eonomi
unertainty) affeting te iiosynrati variane of ea seurity. Aggregating over all seurities
will make te cSV a funtion of eonomi unertainty. In intertemporal asset priing moels
of Bansal an Yaron (2004), Bollerslev, Sizova, an Tauen (2009) an Bollerslev, Tauen, an
Zou (2009), eonomi unertainty is a prie risk fator tat affets returns, terefore proviing
a funamental rationale for te observe orrelation between cSV an onsumption growtvolatility. Tis suggests tat cSV soul appear to be prie wen a Fama-MaBet proeure
is applie to a set of portfolios. We explore tis issue in Setion 5. Te orrelation of te ap-
weigte cSV wit onsumption growt volatility is not as ig (0.241) sine it puts more weigt
on large ap seurities, wi are in general less affete by eonomi unertainty. Looking at
te split between cSV EW+ an cSV EW-, we see tat te orrelation is iger for te cSV wen
onitioning on te negative returns (0.346). Tis suggests tat return ispersion in bear perios
is relatively more affete by eonomi unertainty.
Te next most igly negatively orrelate variable is inflation volatility (-0.367). Sine 1998,
inflation volatility seems to ave been on an upwar tren, wile te ross-setional variane of returns as been sarply elining. Tis is learly apparent in Figure 6. In te presene of iger
inflation unertainty, investors will move towars alloating more to stoks relative to bons in teir
portfolios, generating a general inrease in stok returns tat reues teir ross-setional variane.
Te T-bill rate is also relatively igly orrelate wit cSV EW (0.302). In te type of equilibrium
moels we ave referre to, te risk-free rate, proxie ere by te T-bill, will be a funtion of
onsumption growt volatility, ene its positive relation wit te ross-setional variane.
For te finanial variables (reit sprea an term sprea), it is interesting to note tat te iger
orrelations are wit te ap-weigte measures of te ross-setional variane. Te signs are
intuitive. creit risk affets ifferently iniviual firm returns an terefore tens to inrease cSV,wile a pervasive term sprea risk will reue ispersion by being ommon to many seurities ue
to a move of investors away from bons into te stok market.
Given tat te ross-setional variane is signifiantly linke wit eonomi an finanial fators
tat ave been sown to preit returns, we explore in te next setion te preitive power
of cSV for aggregate returns at various frequenies, espeially at aily frequenies, sine our
measure of iiosynrati variane allows us to measure cSV at any frequeny witout any artifiial
smooting effet. Tis is a main avantage over oter metos of reovering tis iiosynrati
variane.
4. New Evidence on the Predictability of the Market ReturnTere is an ongoing ebate on te preitive power of average iiosynrati variane for average
(or aggregate) stok market returns. Goyal an Santa-clara (2003) fin a signifiantly positive
19 - Data available at Amit Goy al's webpage: http://www.bus.emory.edu/AGoyal/Research.html

8/3/2019 EDHEC Working Paper Idiosyncratic Risk F
http://slidepdf.com/reader/full/edhec-working-paper-idiosyncratic-risk-f 15/40
relationsip between te equal-weigte average iiosynrati stok variane an te ap-
weigte portfolio returns for te perio 1963:07 to 1999:12. Tey fin tat teir measure of
average iiosynrati (in fat total) variane as a signifiant relationsip wit next mont return
on te ap-weigte portfolio. Te regression in GS is as follows:
(15)
were orrespons to . In a subsequent analysis, Bali et al . (2005) argue tattis relationsip isappeare for te extene sample 1963:07 to 2001:12, an attribute te
relationsip observe in GS to ig-te-bubble-type stoks (i.e., stoks trae on te NASdAQ)
an a liquiity premium. In a similar way, Wei an Zang (2005) fin tat te signifiane of te
relationsip foun by GS isappeare for teir sample 1963:07 to 2002:12 an argue tat te
presumably temporary result of GS was riven mainly by te ata in te 1990s. Wei an Zang
(2005) ritiize te fat tat GS looke at te relationsip between an equally-weigte average
stok variane an te return on a ap-weigte average stok return, as oppose to an equally-
weigte portfolio return. Moreover, bot Bali et al. (2005) an Wei an Zang (2005) fin no
signifiant relationsip between te ap-weigte measures an te ap-weigte portfolio
return in all tree sample perios (ening in 1999, 2001 an 2002, respetively).
4.1 Monthly Evidence
In tis setion we onfirm existing results an exten tem in a number of imensions, inluing
a longer sample perio. Te first panel in Table 7 presents te preitability regression of equally-
weigte variane measures on te ap-weigte return as in Goyal an Santa-clara (2003) an
Bali et al. (2005) for teir sample perios, as well as te extene sample up to 2006:12. Te
regression is as in equation 15, were orrespons to te EW cAPM-base measure an te
cSV.20 For omparison purposes we start te sample perio in tis setion in 1963:07, as in Goyal
an Santa-clara (2003), Bali et al. (2005) an Wei an Zang (2005).
For te montly series, we onfirm tat tere is a signifiant positive relationsip in te first
sample, an also tat it weakens for te subsequent extene samples.21 Te Newey an West
(1987) autoorrelation orrete t-stat for 12 lags of te oeffiient of bot cSV an te cAPM-
base measures goes from 3:5 for te first sample perio own to 0:9 for te largest sample.
consequently, te ajuste R2 goes from 1:3% own to 0:04%. Tis result onfirms te finings
of Bali et al. (2005) an Wei an Zang (2005) for te furter extene sample. In setion 4.4 we
propose a possible explanation for tis puzzling result.
In te seon panel of Table 7 we present te results of te regression between te equally-
weigte average return wit te lagge equally-weigte iiosynrati variane measure, asgiven by:
(16)
were is taken as te cAPM-base average iiosynrati variane or as te cSV measure. In
ontrast wit te former regression, te relationsip is foun to be signifiantly positive for te
tree sample perios for bot measures.22
In te tir panel of Table 7 we present te results for te tree sample perios of te one-
mont-aea preitive regression of te ap-weigte market portfolio using te ap-weigte
iiosynrati variane return as a preitor. In tis ase, te beta of te iiosynrati variane is
not signifiant for all tree sample perios. Tis result onfirms te finings of Bali et al. (2005)
an Wei an Zang (2005) for te extene sample.
15
20 - As explained before, the monthly CSV is the average of its daily values during the month.
21 - We found a similar result using the GS measure of equally-weighed average variance. We do not present these regression results for the sake of brevity given that they generate a similar picture, which
has also been confirmed in Bali et al. (2005) and Wei and Zhang (2005).
22 - Wei and Zhang (2005) find a significantly positive relation between the equal-weighted GS measure and the equal-weighted market return for the initial sample. They also test the robustness of the
relation by using an equally-weighted cross-sectional variance of monthly returns. They found a significantly positive coefficient for predicting the equal-weighted portfolio return mainly for the long
samples starting in 1928 but not for the sample going from 1963 to 2002. Note that our cross-sectional measures dier. Ours is an average of the daily cross-sectional variances over the month. Theirs is the
cross-sectional variance of the returns computed over the month.
8/3/2019 EDHEC Working Paper Idiosyncratic Risk F
http://slidepdf.com/reader/full/edhec-working-paper-idiosyncratic-risk-f 16/40
4.2 New Predictability Evidence at Daily Frequency
Prevailing measures use in te literature require a sample of past ata to estimate aitional
parameters, onstraining existing eviene to te montly estimations. Fu (2009) fins tat ig
iiosynrati volatilities of iniviual stoks are ontemporaneous wit ig returns, wi ten
to reverse in te following mont. huang et al. (2009) fin tat te negative relationsip between
iiosynrati variane an expete returns at te stok level unovere in Ang et al. (2006) an
Ang et al. (2009) beomes positive after ontrolling for te return reversals. Tis provies aitional
motivation for looking at te preitability relation at a iger frequeny tan te montly basis.Using te cSV as a proxy for aggregate iiosynrati variane allows us to ek tis relationsip at
te aggregate (market) level in a more iret way (witout aving to ontrol for reversals). Taking
avantage of te instantaneous nature of te cSV, we run te same preitability regression (16)
on te one-ay-aea portfolio return using te average iiosynrati variane.
Te upper panel of Table 8 sows tat at a aily basis, tis relationsip is mu stronger, wit
(Newey-West orrete) t-stats of oeffiients for te average iiosynrati variane aross te
tree samples ranging between 4 an 4:7.
In te lower panel of Table 8 we report te results for te one-ay-aea preitive regression onte ap-weigte pairs (cSV an market return) for wi we fin te relation also to be positive
an signifiant, but wit a mu more obvious eterioration of te t-stat of te ap-weigte
iiosynrati variane oeffiient, going from about 5:91 in te first sample own to 1:97 for
te longest sample. For tis reason an for brevity, we now fous on te relationsip between
aggregate iiosynrati risk an te equal weigte market return.23
4.3 Interpretation of Predictability results
Given tis eviene on te preitability of average aggregate returns by iiosynrati risk, a
natural question to ask woul be: wy oes te relationsip between te equal-weigte measure
an te ap-weigte iffer aross ifferent sample perios?
Wei an Zang (2005), Bali et al. (2005) argue tat te relationsip between iiosynrati risk an
te market inex first foun by Goyal an Santa-clara (2003) on te sample ening in 1999:12
was riven by small stoks trae in te NASdAQ an te ata oming from te ot-om bubble
perio. Altoug we onfirm teir empirial finings for our sample perio, we isagree wit
teir onlusion tat te relationsip between average iiosynrati risk an expete returns
isappeare sine te en of te ot-om bubble. Even toug it appears lear tat NASdAQ
ompanies playe an important role in te relationsip of te equal-weigte average iiosynrati
variane wit te average market-apitalization expete return uring te en of te 1990s,
wi (obviously) weakene after te burst of te bubble, we fin tat te relationsip betweenaverage iiosynrati risk an future average market returns is robust to oies of te sample
perio, provie tat aequate weigting semes an orizons are osen to test tis inter-
temporal relationsip.
Te transitory relationsip between te equal-weigte average iiosynrati variane an
te ap-weigte market inex observe up to te en of te 1990, an be explaine by te
eterogeneous an transitory nature of te omitte soures of risk apture by iiosynrati risk
an its relation wit te inflate valuation of several NASdAQ ompanies uring tat perio.24
Some intuition bein te far more robust relationsip between te equally-weigte average
iiosynrati variane an te equally-weigte portfolio omes preisely from te logi of
stanar asset priing teory. As isusse in te introution, tere are multiple reasons for
wi average iiosynrati risk soul be relate to average returns, ue to te eterogeneous
23 - The corresponding results using a market cap-weighted scheme can be obtained from the authors upon request.
24 - The strongest omitted factors in that period (call it the irrational.com factor), partially captured by the equally weighted idiosyncratic variance, started to be increasingly represented in the market-
cap index, due to the suddenly-higher market capitalization of precisely the group of companies carrying this temporarily strong omitted factor. The posterior reversal of the situation ( i.e., the burst of the
bubble) subsequently explains the sharp fade in the relationship between the average idiosyncratic variance and the market- cap portfolio, precisely due to the posterior sudden deterioration of the market
capitalization of most stocks carr ying this irrational.com factor, and hence notably reducing their representation in the market-capitalization index.

8/3/2019 EDHEC Working Paper Idiosyncratic Risk F
http://slidepdf.com/reader/full/edhec-working-paper-idiosyncratic-risk-f 17/40
soures tat may ompose iiosynrati risk. Aoring to te cAPM, only systemati risk soul
explain future returns. however, if uring a ertain perio of time tere are anomalies of any
kin (prie omitte risk fators) tat, presumably, are not proportionally reflete in te urrent
market apitalization of te ompanies arrying tese fators, ten te omitte soures of risk
are more likely to explain te returns of a portfolio were all kins of firms are represente in a
similar manner, su as te EW as oppose to a portfolio were big ompanies are proportionally
better represente tan smaller ones.
Along tese lines, Ponti (2006) argues tat iiosynrati risk is te largest oling ost borne by
rational arbitrageurs in teir pursuit of mispriing opportunities. Tis teory implies tat te urrent
level of iiosynrati risk soul preit returns sine it soul measure te amount of urrent
mispriing opportunities present in te market. Assuming tat te same mispriing opportunities
isappear in te long run, it appears more likely to observe tis relationsip between iiosynrati
variane an returns over very sort orizons. Moreover, all tings being equal, large-ap stoks
are less likely to present misspriing an ene te preitability implie by tis teory woul
be more likely to be present on te equal-weigte inex return rater tan te ap-weigte
inex return, as we observe in preitive regressions at aily an montly orizons.25 Te sign of
te relationsip is not preite by Ponti's teory in general, beause it epens on weter teaverage (equal or ap-weigte) portfolio is over- or uner-prie (it preits a positive sign for
unerprie stoks an a negative sign for overprie stoks).
4.4 Robustness Checks
In tis setion, we test furter explore te relationsip oumente in te former setion in
several imensions. We first want to plae te return preitability by iiosynrati variane in
te ontext of te literature of te risk-return trae-off. Most of te literature on tis topi is
base on a linear regression between return an volatility. We want to see if inluing te return
variane in te regression anges te preitability results. Seon, we test te robustness of
te relationsip in te presene of an option implie volatility measure. Tir, we furter testte preitability relationsip at quarterly an annual orizons. Finally, we look for te potential
asymmetry in te relationsip between iiosynrati variane an future average returns, wen
te ross-setional variane is split in two an is ompute for returns above or below te mean.
Su an asymmetry often exists for positive an negative returns in te volatility moeling of
finanial time series. Te reporte presene of asymmetries will provie us wit a motivation
for extening te ross-setional ispersion measure to te tir moment an fin tis measure
is relate wit average iiosynrati skewness an as strong preitive power of te average
market return.
4.4.1 Inlusion of Return VarianeIn orer to ek weter te relationsip between te market portfolio expete return an te
aggregate level of iiosynrati variane (wi we oument at te montly an aily frequeny)
is robust to te inlusion of te variane of te market portfolio, we run te following joint
regression:
(17)
We also run te univariate regression:
(18)
For te montly estimations of we use te realize sample variane over te mont
(from aily returns). For aily estimations we fitte an AR(1)-EGARch(1,1) moel on te overall
sample.26 In te first two panels of Table 9, we report regression results at te montly an aily
1725 - It is well known that large cap stocks are more liquid than small-cap stocks, which implies a higher number of people trading them and usually a higher number of analysts looking at them. Together with
less constraints to short-selling, we expect a higher price efficiency for large cap stocks.
26 - Using the overall sample to estimate the parameters would only give the portfolio variance an advantage to predict future returns. However, from the results we see that even when using such for looking
estimates for , the significance of the CSV remains strong.

8/3/2019 EDHEC Working Paper Idiosyncratic Risk F
http://slidepdf.com/reader/full/edhec-working-paper-idiosyncratic-risk-f 18/40
frequeny of bot (17) an (18). In te latter univariate regression, te variane of te equally-
weigte portfolio returns oes not appear to be signifiant in explaining te average future
returns at te montly an aily frequenies.
In te regression from equation (17), te oeffiient of , υ , is negative an non-
signifiant at te montly frequeny. At te aily frequeny, te oeffiient υ was still foun to
be negative an (marginally) signifiant. Te signifiane of te cSV oeffiient remains vali for
bot montly an aily frequenies, an if anyting improves sligtly after te inlusion of teequally-weigte portfolio variane.
Te latter two panels of Table 9 present te regression results at te montly an aily frequeny
of bot (17) an (18) but using te ap-weigte inex an cSV equivalents. Te relationsip
at te aily orizon beomes non-signifiant after te inlusion of te realize variane of te
market-ap-weigte inex. At te montly orizon te relationsip remains non-signifiant.
In Table 10, were we report te quarterly an annual preitability wit an witout te market
variane, we onfirm tat te equally-weigte ross-setional variane oes not foreast future
average returns at low frequenies. however, for te ap-weigte measure of cSV, we observepreitability over te perio 1963 to 2006 wen it is joine wit market variane. Te sign is
negative wile te market variane enters wit a positive sign as preite by te benmark
risk-return trae-offff.27
One fair remark on te results of te preitability regressions is tat te relationsip using equal-
weigte measures only ols at sorter orizons (i.e., aily an montly). however, tis result
is in line wit Ponti's (2006) interpretation of iiosynrati risk as a barrier for arbitrageurs an
wit te eviene presente by Fu (2009) at te stok level, wo fins tat ig iiosynrati
volatilities of iniviual stoks are ontemporaneous wit ig returns, wi ten to reverse in
te following mont.
4.4.2 Inlusion of Market Realize Variane an Implie Variane
Oter measures of variane ave been use in trying to link market returns to a measure of market
risk. Implie variane (VIX 2 ) as been use as a forwar-looking measure of market variane in
aition to realize variane (te sum of square returns at iger frequeny tan te targete
frequeny for te measure of variane).28 We use tese measures in Table 11 along wit bot cSV
measures for aily an montly preitability. We repeat te exerise in Table 12 for quarterly an
annual frequenies. For tese regressions we start te sample in 1990 for ata availability for te
implie volatility.
Results are similar to te ones in te previous setion wit market variane. For cSV EW , we observe
preitability at ig-frequeny but not at low frequeny, wile it is te opposite for cSV cW . For
te aily estimates wit cSV EW , we fin a R 2 of almost 5% wen we inlue all tree measures of
variane, an all oeffiients are signifiant. But te remarkable result, unoumente until now
to our knowlege, is te very ig R 2 obtaine at quarterly an annual frequenies for te cSV cW
measure. Wen using cSV cW alone as a preitor we obtain R 2 s of 4% an 26% at quarterly an
annual frequenies, respetively. Aing te implie variane brings te R 2 s to almost 19% an
29%. If instea one uses te realize variane instea of implie variane te R 2 s are lose to 11%
an 34%. In all tese preitability regressions, te sign of te cSV cW variable is negative. Guo
an Savikas (2008) argue tat average iiosynrati volatility is negatively relate to future stok
market returns possibly beause of its negative orrelation wit te aggregate book-to-market
ratio.29 If iiosynrati volatility is measure from a cAPM moel ten it will apture te missing
book-to-market fator. Tis explanation runs ounter to our previous finings regaring te very
27 - See also Guo and Savickas (2008) for similar results.
28 - For example, for the monthly variance, one will sum the daily squared returns, while for the daily variance, it is customary to use five-minute or one-minute squared returns.
29 - The argument starts by considering average idiosyncratic volatility as a proxy for changes in the opportunity set related related to technological shocks. They argue that technological innovations have
two effects on the firm's stock price: they tend to increase the level of the firm's stock price because of growth options and they also tend to increase the volatility of the firm's stock price because of the
uncertainty about which firms will benefit from the new opportunities. The final argument is to say that the book-to-market ratio captures these investment opportunities.

8/3/2019 EDHEC Working Paper Idiosyncratic Risk F
http://slidepdf.com/reader/full/edhec-working-paper-idiosyncratic-risk-f 19/40
ig orrelation between te measures of iiosynrati volatility base on te cAPM an te
Fama-Fren moels. Te two series were almost iential. A more appealing explanation may be
to tink of ross-setional variane as a measure of ispersion of returns refleting te ispersion
of opinions among market partiipants. Te negative sign of tis relationsip at quarterly an
annual orizons in te presene of market variane as te seon preitor (an also at montly
orizons in te presene of implie variane as te seon preitor) is onsistent wit te moel
of cao et al. (2005), in wi ispersion of opinions among investors is positively relate to stok
market volatility but negatively relate to onitional exess stok market returns. Furtermore,one may argue tat ifferenes of opinions forge temselves over a perio of time an ene tis
effet is more likely to be present at orizons longer tan a ay.
More generally, we may interpret te cSV as measuring te eging terms in an intertemporal
cAPM moel. In tis regar, it is interesting to see tat te positive risk-return trae-off at te
aggregate level, i.e., te relationsip between market volatility an expete returns, beomes
signifiant only wen taking into aount te presene of te omitte fators as apture by te
cSV. It is also interesting to note tat te interations of te cSV wit te realize variane of te
market take plae at longer orizons (quarterly an annual), wile its interations wit implie
variane (VIX 2 ) ten to be more important at sorter orizons.
4.4.3 Asymmetry in te cross-setional distribution of Returns
We now explore for a potential asymmetry in te relationsip between iiosynrati variane
an future average returns, wen te ross-setional variane is split in two an is ompute for
returns above or below te mean.
Tis asymmetry may be te result of te leverage effet put forwar by Blak (1976) sine we
are onsiering iniviual firms in te ross setion. We also mentione in an earlier setion tat
onsumption volatility risk affets ifferently small an large firms or value an growt firms.
Terefore, we explore i ) weter te preitability power is te same for te cSV of returns tote left an right of te enter of te returns' istribution, ii ) weter te relationsip is riven
by one of te sies an iii ) weter te relationsip wit bot sies woul ave te same sign on
teir oeffiient. In orer to o tis, we efine te as te ross-setional variane of te
returns to te rigt of te ross-setional istribution (i.e., meaning te ross-setion istribution
tat inlues all stoks su tat ) an onversely efine te as te ross-
setional variane of te returns to te left of te ross-setional istribution (i.e., meaning te
ross-setion istribution tat inlues all stoks su tat ). Ten we run te following
regression:
(19)
Table 13 presents te results of regression (19) for aily, montly, quarterly an annual estimates,
an sows a ouple of interestingfinings. First, splitting te cSV into rigt an left sies of te
ross-setional istribution mae te ajuste R 2 of te preitive regression jump from 0:8% to
1:17% on montly ata an from 0:6% to 1:36% on aily ata. Seon, tere is an asymmetri
relationsip between te cSV of te returns to te rigt an left of te ross-setional istribution
an te expete market return: te oeffiient of te is positive wile te one of
is negative in bot aily an montly regressions. however, te oeffiients (of bot rigt an
left cSVs) are signifiant only on te aily regression. Te summary statistis of te preitive
regression on te ap-weigte inex using te equivalent ap-weigte cSV measures, isplaye
in te lower panel of Table 13, are qualitatively similar to te results on te equal-weigte
measures.
Tese finings suggest tat a measure of asymmetry of te ross-setional istribution woul
be relevant in te ontext of exploring te relationsip between market expete returns an
19

8/3/2019 EDHEC Working Paper Idiosyncratic Risk F
http://slidepdf.com/reader/full/edhec-working-paper-idiosyncratic-risk-f 20/40
aggregate iiosynrati risk. Anoter key avantage of te cSV measure is tat it an be easily
extene to iger-orer moments. We onsier below te skewness of te ross-setional
istribution of returns an assess its preitive power for future returns. To te best of our
knowlege, tis aitional fator, wi appears as a natural extension of te cSV for measuring
iiosynrati risk,30 is entirely new in tis ontext.31 We follow Kim an Wite (2004) an use a
quantile-base estimate (see Bowley (1920)), generalize by hinkley (1975), as a robust measure
of te skewness of te ross-setional istribution of returns:32
(20)
for any α 1 between 0 an 0.5 an Q 2 = F -1 (0.5). Te Bowley oeffiient of skewness is a speial
ase of hinkley's oeffiient wen α 1 = 0.25 an satisfies te Groenevel an Meeen's (1984)
properties for reasonable skewness oeffiients. It as upper an lower bouns {-1, 1}.
In Table 14, we report te results of preitive regressions at te aily an montly frequenies
were we a te robust measure of te ross-setional skewness to te equally-weigte cSV.
Te first observation is tat te cSV oeffiients are very lose to te values estimate wit tecSV as te only regressor (0.4 for te aily frequeny an 0.25 for te montly one). Te t-stats are
also almost iential to te ones foun in te cSV regressions. however, skewness appears to be
a major ontributor to te preitability of returns sine te R 2 inreases signifiantly ompare
to te regressions wit cSV alone. At te aily frequeny, te ajuste R 2 inreases to a value of
5.8%. At te montly frequeny, it is still 4.6%. Tis large inrease in preitability wen aing
skewness suggests tat maroeonomi or aggregate finanial soks affet asymmetrially te
istribution of returns.
5. Is Average Idiosyncratic Risk Priced?Aoring to Merton's IcAPM, a fator tat preits stok returns in te ross setion soul also
preit aggregate market returns (see campbell (1993)). By te reverse argument, motivate by
te preitability power of (equal-weigte) ross-setional variane on te average return in te
market, we explore in tis setion weter te cSV EW , interprete as a risk fator, is reware an
ommans a premium in te ross-setion.
5.1 CSV Quintiles' Premium
Using aily exess returns every mont we run te following regression for ea stok i:33
(21)
At te en of every mont in te sample, we sort stoks using te cSV EW fator loaing, β sv , an
form equally-weigte an ap-weigte quintile portfolios. We alulate te average return
uring te overall perio for ea quintile an te average return ifferene ( i.e., premium) -
between te first quintile an ea of te oter four quintiles.
Te results for te equally-weigte quintile portfolios are isplaye in te upper panel of Table
15 an in te lower panel for te ap-weigte quintiles. As we an see from tis table, all premia
are signifiantly ifferent from zero an eonomially meaningful. Te ifferene between te
first quintile (te one wit iger sensitivity) an te seon, tir an fourt quintiles, is aroun
an annualize 30%, wile te ifferene wit te fift quintile is aroun 15%. Tis result suggests
tat te relationsip of te cSV an stok returns migt not be best esribe in te simple linear
form, wi is in line wit te asymmetri effet foun in setion 4.4, wit te quantities cSV +
an cSV -.
30 - We show formally in an appendix available upon request from the authors that there is a link between idiosyncratic skewness and the skewness of the cross-sectional distribution of returns.
31 - At the stock level, Kapadia (2009) uses cross-sectional skewness to explain the puzzling nding in Ang et al. (2006) that stocks with high idiosyncratic volatility have low subsequent returns.
32 - The usual non-robust skewness measure of the cross-section of returns is highly noisy compared to the proposed robust measure, especially at the daily frequency. 33 - We use stocks with non-missing
values during the current month.

8/3/2019 EDHEC Working Paper Idiosyncratic Risk F
http://slidepdf.com/reader/full/edhec-working-paper-idiosyncratic-risk-f 21/40
5.2 Fama-MacBeth Procedure
In orer to use te stanar set of assets in te asset priing literature, we extrat aily returns
ata from Kennet Fren ata library on teir 100 (10x10) an 25 (5x5) size/book-to-market
portfolios for te perio July 1963 to deember 2006. Ten we run every alenar mont te
following regression for ea portfolio:34
(22)
Using te reore fator loaing, β (montly) time series, we run te following ross-setionalregression every mont on te next mont's exess returns an reor te oeffiients:
(23)
We finally test weter te average γ oeffiients are statistially ifferent from zero. In orer to
take into aount possible serial orrelation in te oeffiients, we ompute te t-statisti using
Newey an West (1987) stanar errors wit four lags (same number of lags as in Ang et al. (2009)).
We use four sets of assets: 100 (10x10) size/book-to-market equally-weigte portfolios an
ap-weigte weigte portfolios, an 25 (5x5) size/book-to-market equally-weigte an ap-
weigte portfolios. For ea of tem, we use te cSV EW as te fourt risk fator. Te first twopanels of Table 16 present te orresponing Fama-MaBet regression results. Te table isplays
te annualize oeffiients an stanar errors (multiplie by 12 from te original montly
values), as well as teir orresponing autoorrelation-orrete t-stat an te average R 2 . We
fin te γ oeffiient for cSV EW to be positive an signifiant wen we use te 100 an 25 size/
book-to-market Fama-Fren equally-weigte portfolios. however, it is not signifiant wen
we use te 25 market-ap-weigte portfolios an marginally signifiant for te 100 market
ap-weigte portfolios (altoug positive in bot ases). Tis later result, again, is not entirely
surprising onsiering tat te ross-setional variation in returns is reue troug te market-
apitalization ajustment.
6. ConclusionIn tis paper we formally introue an instantaneous ross-setional ispersion measure as a
proxy for aggregate iiosynrati risk tat as te istint avantage of being reaily omputable
at any frequeny, wit no nee to estimate oter parameters. It is terefore a moel-free measure
of iiosynrati risk. We extensively sow ow tis measure is relate to previous proxies of
iiosynrati variane, su as te Goyal an Santa-clara (2003) measure an measures relative
to te lassi Fama an Fren (1993) an cAPM moels, wi ave been previously sown to
be very lose to te campbell et al. (2001) proxy as well. We onfirm previous finings of Goyal
an Santa-clara (2003), Bali et al. (2005) an Wei an Zang (2005) on te montly preitabilityregressions for te extene sample perio using our ross-setional measure an more stanar
measures of iiosynrati variane. We fin tat te results are robust aross tese measures.
Tanks to te instantaneous nature of our measure, we are able to exten to aily ata te
eviene on te preitability power of iiosynrati variane on te future market portfolio
return. We provie a statistial argument to support te oie of an equally-weigte measure
of average iiosynrati variane as oppose to a market-ap-weigte one an explain wy
bot empirially an teoretially su a measure soul foreast better te equal-weigte
market return. We also sowe tat tis ross-setional measure isplays a sizable orrelation
wit eonomi unertainty, as measure by onsumption growt volatility, an wit several
eonomi an finanial variables. One aitional avantage of our measure is tat it generalizes
in a straigtforwar manner to iger moments an we sowe tat te asymmetry of te ross-
setional istribution is a very goo preitor for future returns. We leave for furter resear
an exaustive analysis of te properties of te skewness of ross-setional return istribution
as a measure of average iiosynrati skewness. We also leave for furter resear an empirial
analysis of te cSV measure using international ata.21
34 - As before, XMKT stands for excess market return, SMB and HML are the size and book-to-market Fama-French factors, also directly extracted from Kenneth French data library.

8/3/2019 EDHEC Working Paper Idiosyncratic Risk F
http://slidepdf.com/reader/full/edhec-working-paper-idiosyncratic-risk-f 22/40
References• Ang, A., R. Hodrick, Y. Xing, and X. Zhang (2006). The cross-section of volatility and expected
returns. Journal of Finane 61, 259-299.
• Ang, A., R. Hodrick, Y. Xing, and X. Zhang (2009). High idiosyncratic volatility and low returns:
International an furter US eviene. Journal of Finanial Eonomis 91 (1), 1-23.
• Bali, T., N. Cakici, X. Yan, and Z. Zhang (2005). Does idiosyncratic risk really matter? The Journal
of Finane 60 (2), 905-929.
• Bansal, R. and A. Yaron (2004). Risks for the long run: A potential resolution of asset pricing
puzzles. The Journal of Finane 59 (4), 1481-1509.
• Barberis, N., M. Huang, and T. Santos (2001). Prospect theory and asset prices. Quarterly Journal
of Eonomis 116 (1), 1-53.
• Bekaert, G., R. J. Hodrick, and X. Zhang (2008). Is there a trend in idiosyncratic volatility? SSRN
eLibrary.
• Black, F. (1976). The pricing of commodity contracts. Journal of finanial eonomis 3 (1-2),
167-179.
• Black, F. and M. Scholes (1973). The pricing of options and corporate liabilities. Journal of
politial eonomy 81 (3), 637.
• Bollerslev, T., N. Sizova, and G. Tauchen (2009). Volatility in equilibrium: Asymmetries and
ynami epenenies. Tenial report, duke University Working Paper.
• Bollerslev, T., G. Tauchen, and H. Zhou (2009). Expected stock returns and variance risk premia.
The Review of Finanial Stuies 22 (11), 4463-4492.
• Bowley, A. (1920). Elements of Statistis . New York: carles Sribner's Sons.
• Brandt, M., A. Brav, J. Graham, and A. Kumar (2009). The idiosyncratic volatility puzzle: Timetren or speulative episoes. Review of Finanial Stuies . Fortoming.
• Campbell, J. (1993). Intertemporal asset pricing without consumption data. Amerian Eonomi
Review 83 (3), 487-512.
• campbell, J., M. Lettau, B. Malkiel, an Y. Xu (2001). have iniviual stoks beome more volatile?
An empirial exploration of iiosynrati risk. Journal of Finane 56 (1), 1-43.
• cao, h., T. Wang, an h. Zang (2005). Moel unertainty, limite market partiipation, an asset
pries. Review of Finanial Stuies 18 (4), 1219.
• cuzik, J. (1995). A strong law for weigte sums of ii ranom variables. Journal of Theoretial Probability 8 (3), 625-641.
• diBartolomeo, d. (2006). Appliations of portfolio variety.
• Fama, E. an K. Fren (1993). common risk fators in te returns on stoks an bons. Journal
of Finanial Eonomis 33 (1), 3-56.
• Fren, K. R., G. W. Swert, an R. F. Stambaug (1987, September). Expete stok returns an
volatility. Journal of Finanial Eonomis 19 (1), 3-29.
• Fu, F. (2009). Iiosynrati risk an te ross-setion of expete stok returns. Journal of
Finanial Eonomis 91 (1), 24-37.• Goyal, A. an P. Santa-clara (2003). Iiosynrati risk matters! Journal of Finane 58 (3), 975-
1008.
• Groenevel, R. an G. Meeen (1984). Measuring skewness an kurtosis. The Statistiian 33,
391-399.

8/3/2019 EDHEC Working Paper Idiosyncratic Risk F
http://slidepdf.com/reader/full/edhec-working-paper-idiosyncratic-risk-f 23/40
• Guo, h. an R. Savikas (2008). Average iiosynrati volatility In G7 ountries. Review of
Finanial Stuies 21 (3), 1259-1296.
• hamilton, J. d. (1989). A new approa to te eonomi analysis of nonstationary time series
an te business yle. Eonometria 57 (2), 357-384.
• hinkley, d. (1975). On power transformations to symmetry. Biometrika 62 , 101-111.
• huang, W., Q. Liu, S. Ree, an L. Zang (2009). Return reversals, iiosynrati risk, an expetereturns. Review of Finanial Stuies .
• Kaman, S. d. (1999). distribution of linear transformations an quarati forms.
• Kapaia, N. (2009). Te next Mirosoft? Skewness, iiosynrati volatility, an expete returns.
unpublise paper.
• Kim, T. an h. Wite (2004). On more robust estimation of skewness an kurtosis. Finane
Researh Letters 1 (1), 56-73.
• Levy, h. (1978). Equilibrium in an imperfet market: A onstraint on te number of seurities in
te portfolio. Amerian Eonomi Review 68 (4), 643-658.
• Malkiel, B. G. an Y. Xu (2002). Iiosynrati risk an seurity returns.
• Merton, R. (1974). On te priing of orporate ebt: Te risk struture of interest rates. Journal
of Finane , 449-470.
• Merton, R. (1987). A simple moel of apital market equilibrium wit inomplete information.
Journal of Finane 42, 483-510.
• Newey, W. an K. West (1987). A simple, positive semi-efinite, eteroskeastiity an
autoorrelation onsistent ovariane matrix. Eonometria 55 (3), 703-708.
• Ponti, J. (2006). costly arbitrage an te myt of iiosynrati risk. Journal of Aounting an
Eonomis 42 (1-2), 35-52.
• Ross, S. (1976). Te arbitrage teory of apital asset priing. Journal of Eonomi Theory 13 (3),
341-360.
• Sarpe, W. (1963). A simpliefi moel for portfolio analysis. Management Siene, 277-293.
• Teongap, R. (2010). consumption volatility an te ross-setion of stok returns. Unpublise
paper, Stokolm Sool of Eonomis.
• Wei, S. an c. Zang (2005). Iiosynrati risk oes not matter: A re-examination of te
relationsip between average returns an average volatilities. Journal of Banking an Finane 29,
603-621.
• Wei, S. an c. Zang (2006). Wy i iniviual stoks beome more volatile? Journal of Business
79 (1), 259-292.
• Wel, I. an A. Goyal (2008). A ompreensive look at te empirial performane of equity
premium preition. Review of Finanial Stuies 21 (4), 1455.
23

8/3/2019 EDHEC Working Paper Idiosyncratic Risk F
http://slidepdf.com/reader/full/edhec-working-paper-idiosyncratic-risk-f 24/40
A. Proof of Proposition 1consier te fator moel eomposition
an
Uner te omogeneous betas assumption, we ave
(24)
an terefore
so tat
Noting tat
we finally ave:
We now argue tat te term onverges to 0 for inreasingly large numbers of stoks.
To sow tis, we nee to use a reent result by cuzik (1995) regaring te Marinkiewz−Zygmun
strong law of large numbers for weigte sums of i.i.. variables:
almost surely (25)
wen {X ,X N ,N ≥ 1} is a sequene of i.i.. ranom variables wit E (X ) = 0, E |X | < ∞ an {aNi , 1 ≤ i
≤ N ,N ≥ 1} is an array of onstants uniformly boune satisfying35
(26)
35 - See Theorem 1.1, particular case of Cuzick (1995).

8/3/2019 EDHEC Working Paper Idiosyncratic Risk F
http://slidepdf.com/reader/full/edhec-working-paper-idiosyncratic-risk-f 25/40
here we take an . For te result (25) to ol aNit nees to be uniformly
boune an to satisfy onition (26). We terefore restrit our attention to non-trivial weigting
semes, ruling out te situation su tat te inex is ompose by a single stok. Please note
tat tis onition togeter wit te fat tat implies N t > 1 an also restrit te
weigts to be (stritly) positive at every given point in time. hene, a weigting seme (w t ), is
efine as a vetor proess wi satisfies 0 < w it < 1 ∀ i , t . Tis onition seems reasonable sine
our fous is to measure iiosynrati risk in te market.
By efinition, te weigting seme w it an aNit is uniformly boune by N t an te following
onition ols,
0 < w it < 1 ∀ i , t (27)
Multiplying by N t , we get
wi implies tat onition (26) ols. Tus, for a positive weigting seme from te strong law
of large numbers for weigte sums of i.i.. variables, it follows tat:
,
Using similar arguments, an te omogeneous iiosynrati seon moment assumption,
, we obtain tat for a stritly positive weigting seme, w t , an i.i.. ε i ,
almost surely
Using tese results, we finally ave tat:
almost surely.
B. Properties of the CSV EstimatorB.1 Bias of the CSV Estimator
Uner te fator moel eomposition (1) an equation (2) an using te omogeneous beta
assumption, we ave:
(28)
Replaing result (28) in equation (3) we ave as before:
(29)
25

8/3/2019 EDHEC Working Paper Idiosyncratic Risk F
http://slidepdf.com/reader/full/edhec-working-paper-idiosyncratic-risk-f 26/40
By efinition of a strit fator moel, for i ≠ j , an Applying te
expetation operator in equation (29) we get:
(30)
Te seon term in (30) implies tat te cSV woul ten to unerestimate te average iiosynrati
variane. consiering te equal-weigte seme were , (29) simplifies into
an we obtain:
B.2 Variance of the CSV Estimator
Let w t an ε t be olumn vetors of te weigting seme an resiuals respetively anΩt = w t w' t ,Λt = iag (w t ), N t ×N t matries, an enote Σ ε te variane ovariane matrix of te resiuals,
wi is iagonal for a strit fator moel.
For a finite number of stoks in te ase were F t ≠ r (wt) , we ave from equation (29):
.
Letting Q t = Λt − Ωt , cSV t an be written in matrix form, as follows:
(31)
Using te quarati struture of te cSV an assuming normal resiuals, we ave (see for instane
Kaman (1999)):36
(32)
Uner te assumption of a strit fator moel, i.e. , equation (31) simplifies
to:
(33)
Assuming an upper boun for te iniviual iiosynrati varianes, enote as equation (33)
yiels te following inequality (replaing ea variane for its upper boun)
(34)
Wen w t = 1/N t , equation (34) simplifies to
(35)
36 - The operator tr stands for the trace of a matrix, which is the sum of the diagonal terms.

8/3/2019 EDHEC Working Paper Idiosyncratic Risk F
http://slidepdf.com/reader/full/edhec-working-paper-idiosyncratic-risk-f 27/40
For a large number of stoks,
(36)
C. Relaxing the Assumption of Homogeneous Betas
Te assumption tat β it = β t for all i is obviously a simplisti one an is one only for exposurepurposes. Starting wit te single fator eomposition on te efinition of te cSV we ave:
After simple rearrangement of terms we get:
Applying te expetation operator an assuming a strit fator moel, te last expression
simplifies so as to yiel:
Uner an equal-weigting seme, we finally ave:
27

8/3/2019 EDHEC Working Paper Idiosyncratic Risk F
http://slidepdf.com/reader/full/edhec-working-paper-idiosyncratic-risk-f 28/40
D. Tables and FiguresTable 1: Estimates of the biases due to the cross-sectional dispersion of betas and weight
concentration: Tis table ontains a summary of te istribution of te following time series: te
ross-setional ispersion of betas , estimate wit respet to te cAPM at te en of every
mont using aily returns; te average iiosynrati variane wit respet to te cAPM; te
prout of te average return of te market portfolio square, , an te beta ispersion, ;
te proportion of te prout to an te proportion of to . Te upper
panel orrespons to te equal-weigt seme (cSV EW ) an te lower panel to te market-apweigting (cSV cW ). All figures are aily. Te perio is July 1963 to deember 2006.
Table 2: Total bias associated with CSV: Tis table reports te output summary of te regression
, were represents montly estimates of te
weigte average iiosynrati variane estimate using te orresponing moel (eiter cAPM
or FF). Te average an te cSV are ompute wit eiter te ap-weigte seme (cW) or teequal-weigte one (EW). Te perio is July 1963 to deember 2006.

8/3/2019 EDHEC Working Paper Idiosyncratic Risk F
http://slidepdf.com/reader/full/edhec-working-paper-idiosyncratic-risk-f 29/40
Table 3: Comparison of monthly measures of idiosyncratic variance: Te upper panel of tis
table ontains te annualize mean an stanar eviation of te montly time series for te
cSV, te average iiosynrati variane base on te cAPM an te Fama-Fren moels an te
average Goyal an Santa-clara (2003) variane measure as in equations (4), (11) an (12) using
bot EW an cW weigting semes. Te lower panel presents te ross-orrelation matrix among
tese variables. Te perio is January 1964 to deember 2006.
Table 4: Comparison of daily measures of idiosyncratic variance: Te upper panel of tis tableontains te annualize mean an stanar eviation of te aily time series for te cSV an
te average iiosynrati variane base on te Fama-Fren moel as in equations (4) an (11)
using bot weigting semes. Te lower panel presents te ross-orrelation matrix among tese
variables. Te perio is January 1964 to deember 2006.
Table 5: Regime-switching parameters: Tis table ontains te parameter estimates of te
Markov regime-switing moel speifie in equation 14 for te cSV an te average iiosynrati
variane base on te FF moel as in equations (4) an (11) using bot, equalweigte an ap-
weigte semes. Te upper panel orrespons to montly estimates an te lower panel to
aily estimates. µ i is te average level of te variable on regime i , σ i is te stanar eviation
level of te variable on regime i , φ is te autoorrelation oeffiient, p an q are te probabilities
of remaining in regimes 1 an 2 orresponingly. Te perio is January 1964 to deember 2006.
29
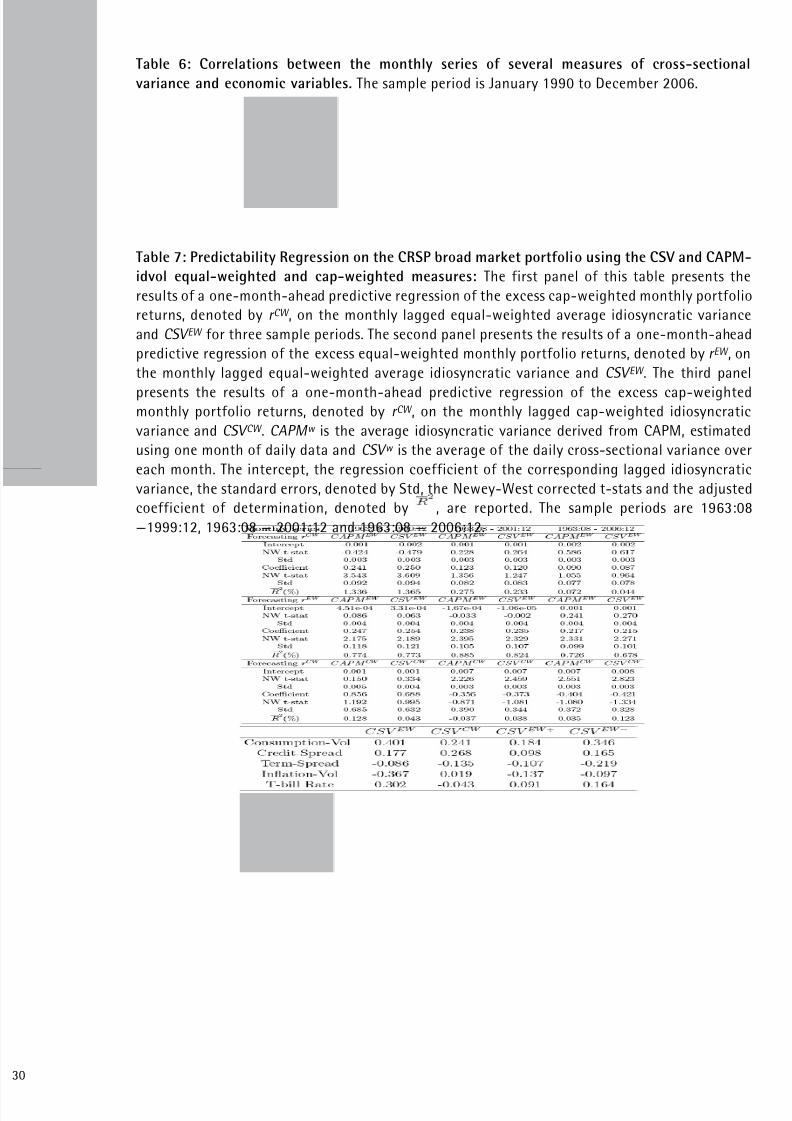
8/3/2019 EDHEC Working Paper Idiosyncratic Risk F
http://slidepdf.com/reader/full/edhec-working-paper-idiosyncratic-risk-f 30/40
Table 6: Correlations between the monthly series of several measures of cross-sectional
variance and economic variables. Te sample perio is January 1990 to deember 2006.
Table 7: Predictability Regression on the CRSP broad market portfolio using the CSV and CAPM-
idvol equal-weighted and cap-weighted measures: Te first panel of tis table presents te
results of a one-mont-aea preitive regression of te exess ap-weigte montly portfolio
returns, enote by r cW , on te montly lagge equal-weigte average iiosynrati variane
an cSV EW for tree sample perios. Te seon panel presents te results of a one-mont-aea
preitive regression of te exess equal-weigte montly portfolio returns, enote by r EW , on
te montly lagge equal-weigte average iiosynrati variane an cSV EW . Te tir panel
presents te results of a one-mont-aea preitive regression of te exess ap-weigtemontly portfolio returns, enote by r cW , on te montly lagge ap-weigte iiosynrati
variane an cSV cW . cAPM w is te average iiosynrati variane erive from cAPM, estimate
using one mont of aily ata an cSV w is te average of te aily ross-setional variane over
ea mont. Te interept, te regression oeffiient of te orresponing lagge iiosynrati
variane, te stanar errors, enote by St, te Newey-West orrete t-stats an te ajuste
oeffiient of etermination, enote by , are reporte. Te sample perios are 1963:08
—1999:12, 1963:08 — 2001:12 an 1963:08 — 2006:12.

8/3/2019 EDHEC Working Paper Idiosyncratic Risk F
http://slidepdf.com/reader/full/edhec-working-paper-idiosyncratic-risk-f 31/40
Table 8: Daily predictability Regression on CRSP broad market portfolio with average
idiosyncratic variance measures: Te upper panel presents te results of a one-ay-aea
preitive regression of te exess equal-weigte aily portfolio returns, enote by r EW , on te
aily lagge equal-weigte ross-setional variane enote as cSV EW estimate as in equation
(4) for tree sample perios. Te lower panel presents te results of te preitive regression on
te ap-weigte market portfolio using te ap-weigte cSV. Te interept, te regression
oeffiient orresponing to te cSV, te stanar error of te regression oeffiients, enote
by St, te Newey-West orrete t-stats (30 lags) an te ajuste oeffiient of etermination,enote by , are reporte. Te sample perios are 1963:07 to 1999:12, 1963:07 to 2001:12 an
1963:07 to 2006:12.
Table 9: Daily and monthly predictability with and without market volatility: Tis table presents
summary statistis for tree preitive regressions. Te first two panels orrespon to aily an
montly preitions on te equal-weigte broa market inex using equal-weigte cSV an
te realize variane of te equal-weigte broa market inex an te two lower panels teir
ounterparts using wit te ap-weigte inex an cSV. In ea panel, te first row orrespons
to te regression te seon row to an te tir
one to . Te sample perio is July 1963 to deember 2006
31

8/3/2019 EDHEC Working Paper Idiosyncratic Risk F
http://slidepdf.com/reader/full/edhec-working-paper-idiosyncratic-risk-f 32/40
Table 10: Quarterly and annual predictability with and without market variance: Tis table
presents summary statistis for tree preitive regressions. Te first two panels orrespon to
quarterly an annual preitions on te equal-weigte broa market inex using equal-weigte
cSV an te realize variane of te equal-weigte broa market inex an te two lower panels
teir ounterparts wit te ap-weigte inex an cSV. In ea panel, te first row orrespons
to te regression te seon row to an te tir
one to . Te sample perio is July 1963 to deember 2006

8/3/2019 EDHEC Working Paper Idiosyncratic Risk F
http://slidepdf.com/reader/full/edhec-working-paper-idiosyncratic-risk-f 33/40
Table 11: Daily predictability with and without market realized variance and implied variance
(V I X 2): Te first two panels orrespon to aily an montly preitions of te equal-weigte
broa market inex using equal-weigte cSV, te realize variane of te equal-weigte broa
market inex an te square VIX inex. Te two lower panels feature similar regressions wit
te ap-weigte ounterparts. In ea panel, we report regression results for ea preitor
iniviually an for ombinations of te tree orresponing preitors over te perio July 1990
to deember 2006
33

8/3/2019 EDHEC Working Paper Idiosyncratic Risk F
http://slidepdf.com/reader/full/edhec-working-paper-idiosyncratic-risk-f 34/40
Table 12: Quarterly and annual predictability with and without market realized variance and
implied variance (V I X 2): Te first two panels orrespon to aily an montly preitions of te
equal-weigte broa market inex using equal-weigte cSV, te realize variane of te equal-
weigte broa market inex an te square VIX inex. Te two lower panels feature similar
regressions wit te ap-weigte ounterparts. In ea panel, we report regression results for
ea preitor iniviually an for ombinations of te tree orresponing preitors over te
perio July 1990 to deember 2006

8/3/2019 EDHEC Working Paper Idiosyncratic Risk F
http://slidepdf.com/reader/full/edhec-working-paper-idiosyncratic-risk-f 35/40
Table 13: Predictability regression on CRSP broad market index with right and left CSV
measures: Te upper panel presents te results of a one-ay, one-mont, one quarter an
one -year-aea preitive regressions of te exess equal-weigte portfolio returns, enote by
, on te aily or montly (orresponingly) lagge equal-weigte ross-setional variane
of te returns to te rigt (iger tan) of te ross-setional istribution mean (wi is atually
) enote as cSV + an te ross-setional variane of te returns to te left (lower tan)
te mean of te ross-setional istribution , enote as cSV −. Te lower panel presents te
results of te preitive regressions on te ap-weigte market inex using te ap-weigtecSV measures as preitors. Te interept, te regression oeffiients orresponing to te cSV +
an cSV −, te stanar error of te regression oeffiients, enote by St, te Newey-West
orrete t-stats an te ajuste oeffiient of etermination, enote by , are reporte. Te
sample perio is 1963:07 to 2006:12.
35

8/3/2019 EDHEC Working Paper Idiosyncratic Risk F
http://slidepdf.com/reader/full/edhec-working-paper-idiosyncratic-risk-f 36/40
Table 14: Daily and Monthly predictability with skewness for : Tis table presents te
results of one-ay an one-mont aea preitive regressions of te exess equal-weigte
aily portfolio returns, enote by . Te first explanatory variable is lagge estimate of te
equal-weigte cSV estimate as in equation (4); Te seon ex- planatory variable is te robust
estimate of skewness estimate as in equations (20). Te interept, te orresponing regression
oeffiients togeter wit teir Newey-West auto-orrelation orrete t-stats (wit 30 lags for
aily an 12 lags for montly) an stanar errors are reporte. enotes ajuste oeffiient
of etermination. Te regression is reporte for te main sample perio from 1963:07 to 2006:12.
Table 15: Quintiles premium. Te upper panel present te results for equal-weigte quintile
portfolios an te lower panel on ap-weigte quintile portfolios. Te first olumn presents
te (aritmeti) average return annualize on quintiles forme at te en of every mont on te
cSV EW's oeffiient estimate wit one mont of aily returns. Te seon olumn presents te
average return ifferene of te first quintile wit every oter quintile. Te tir olumn presents
te p-value of te test of te ifferene to be signiantly positive. Te sample perio is July 1963
to deember 2006.

8/3/2019 EDHEC Working Paper Idiosyncratic Risk F
http://slidepdf.com/reader/full/edhec-working-paper-idiosyncratic-risk-f 37/40
Table 16: Tis table isplays te average values, stanar errors an Newey-West orrete t-stats
for te oeffiients in te Fama-MaBet regression run every mont in te sample, using te 3
Fama-Fren fators an cSV EW on 100 an 25 size/book2market Fama-Fren equally-weigte
(first two panels) an ap-weigte (last two panels) portfolios. It also isplays te average R 2
aross subsamples of Fama-MaBet regressions. Te sample perio is July 1963 to deember
2006.
37

8/3/2019 EDHEC Working Paper Idiosyncratic Risk F
http://slidepdf.com/reader/full/edhec-working-paper-idiosyncratic-risk-f 38/40
Figure 1: Annualize ap-weigte iiosynrati varianes, aily estimation: Te wite line is te
time series of te ap-weigte iiosynrati variane wit respet to te FF moel estimate
aily as in equation 11. Te arker line sows te time series of te ap-weigte version of cSV
estimate aily as in equation 5. Te sample perio is January 1964 to deember 2006.
Figure 2: Annualize equally-weigte iiosynrati varianes, aily estimation: Te wite line
is te time series of te equal-weigte average iiosynrati variane wit respet to te FF
moel estimate aily similar to equation 11. Te arker line sows te time series of te cSV EW
estimate aily as in equation 4. Te sample perio is January 1964 to deember 2006.
38

8/3/2019 EDHEC Working Paper Idiosyncratic Risk F
http://slidepdf.com/reader/full/edhec-working-paper-idiosyncratic-risk-f 39/40
Figure 3: Smoote probabilities an annualize ap-weigte cSV montly estimation: Te
re line plots te smoote (onitional) probability of te cSV cW being in te igmean ig-
variane regime of a Markov regime-switing moel speifie in equation 14. Te blue line sows
te montly time series of te cSV cW estimate at te en of ea mont as te average of te
aily estimations (as in equation 4) uring te mont. Te sae areas are te NBER reessions.
Te sample perio is July 1963 to deember 2006.
Figure 4: Smoote probabilities an annualize equal-weigte cSV montly estimation: Te
re line plots te smoote (onitional) probability of te cSV EW
being in te igmean ig-variane regime of a Markov regime-switing moel speifie in equation 14. Te blue line sows
te montly time series of te cSV EW estimate at te en of ea mont as te average of te
aily estimations (as in equation 4) uring te mont. Te sae areas are te NBER reessions.
Te sample perio is July 1963 to deember 2006.

8/3/2019 EDHEC Working Paper Idiosyncratic Risk F
http://slidepdf.com/reader/full/edhec-working-paper-idiosyncratic-risk-f 40/40
Figure 5: Montly time series of cSV EW on te rigt-an axis an onsumption volatility on te
left-an axis. Te sample perio is January 1990 to deember 2006.
Figure 6: Montly time series of cSV EW on te rigt-an axis an inflation volatility on te left-
an axis. Te sample perio is January 1990 to deember 2006.