ecuador: diversification and sustainable growth in an oil...
TRANSCRIPT

Report No. 46551-EC
Ecuador: Diversification and Sustainable Growth
In an Oil-Dependent Country
March 31, 2010
Poverty Reduction and Economic Management
Andean Country Management Unit
Latin America and the Caribbean Region
This document has a restricted distribution and may be used by recipients only in the performance of their
official duties. Its contents may not otherwise be disclosed without World Bank authorization.
Pub
lic D
iscl
osur
e A
utho
rized
Pub
lic D
iscl
osur
e A
utho
rized
Pub
lic D
iscl
osur
e A
utho
rized
Pub
lic D
iscl
osur
e A
utho
rized
Pub
lic D
iscl
osur
e A
utho
rized
Pub
lic D
iscl
osur
e A
utho
rized
Pub
lic D
iscl
osur
e A
utho
rized
Pub
lic D
iscl
osur
e A
utho
rized

January 1 to December 31
(as of March 31, 2010)
Currency unit
1 U.S. dollar
=
=
U.S. dollar (USD)
US$1.00
Metric System
Abbreviations
API American Petroleum Institute
ATPA Andean Trade Preference Act
ATPDEA Andean Trade Promotion and
Drug Eradication Act
BCE Central Bank of Ecuador
(Banco Central de Ecuador)
CAN Andean Community
CEPAL Comisión Económica para
América Latina y el Caribe
CEPE Corporación Estatal Petrolera
Ecuatoriana
CEREPS Special Account for Social and
Productive Investment,
Scientific Development, and
Fiscal Stabilization
CPI consumer price index
FAC Fund for Savings and
Contingencies
FD foreign direct investment
FEIREP Fund for Stabilization,
Investment, and Public Debt
Reduction
FEISEH Energy and Hydrocarbon
Investment Fund
FEP Oil Stabilization Fund (Fondo
de Estatización Petrolera)
FOB free on board
FOPEDEUPO Fondo Permanente de
Desarrollo Universitario y
Politécnico
FRTL Fiscal Responsibility Law,
with versions I and II
FTSRL Law on Fiscal Transparency,
Stabilization, and
Responsibility
GDP gross domestic product
ICE special consumption tax
ICSID International Center for
Settlement of Investment
Disputes
IMF International Monetary Fund
kWh kilowatt-hour
LAC Latin America and the
Caribbean
MERCOSUR Mercado Común del Cono Sur
NAFTA North American Free Trade
Agreement
NFPS Non Financial Public Sector
OCP Oleoducto de Crudos Pesados
SOTE Sistema de Oleoducto
Transecuatoriano
VAT Value added tax
WTI West Texas intermediate
Vice President: Pamela Cox Country Director: Carlos Felipe Jaramillo Sector Director: Marcelo Giugale Sector Manager: Rodrigo A. Chaves Sector Leader: Carlos Silva-Jauregui Task Team Leader: Christian Y. Gonzalez

Acknowledgments
This report was prepared by a team led by Christian Y. Gonzalez (LCSPE). Core team members
were Carolina Biagini (LCSPE), Kevin Carey (MNSPR), Simon Cueva (consultant, Universidad de las
Américas), Norbert Fiess (LCSPE), Daniel Lederman (DECRG), Oana Luca (DECRG), Roberto
Mosquera (consultant, Universidad de las Américas), Maria Ivanova Reyes (LCSPE), Steven Webb
(LCSPE), and Colin Xu (DECRG). Research assistance to the consultants from Pamela Rodríguez is
greatly appreciated. Useful inputs also come from Ariel Yepez (LCSEG).
Guidance throughout preparation of the report was provided by Carlos Felipe Jaramillo (LCC6C),
Jonas Frank (LCSPS), Carlos Silva (LCSPE, Lead Economist) and Rodrigo A. Chaves (LCSPE, Sector
Manager).
Very helpful logistical assistance was provided by Alexandra del Castillo (LCCEC), Michael
Geller (LCSPE), Patricia Holt (LCSPE), and Ana Maria Villaquirán (LCCEC). Elizabeth Forsyth
(consultant) and Richard Alm (consultant) edited the report. Christopher Humphrey (consultant) assisted
in drafting the Executive Summary.
The peer reviewers were Vicente Albornoz (consultant, CORDES), Emily Sinnott (LCSPE),
Eduardo Somensatto (DECRG), and Felix Vardy (LCSCE).
We would like to thank the Ecuadorian authorities for their cooperation in preparing the report. In
the Central Bank of Ecuador, we would like to thank Pedro Brito (Director of Economic Studies) and his
staff for their support. In the Ministry of Industry and Competitiveness, we would like to thank Andrés
Robalino and Dumani Sanchez for their guidance and support. And in the Ministry of Social
Development, we would like to thank Hector Rodriguez for his presentation on the Social Development
Plan.


Preface
Diversification is important to sustainable economic growth and economic development
in an oil-dependent country like Ecuador because it allows the country to be less vulnerable to
external shocks. An analysis of diversification in the Ecuadorian economy is needed at this time
because (a) the growth has been sluggish despite favorable terms of trade in recent years, and (b)
external and fiscal balances are highly vulnerable to shocks in oil prices. This study focuses on
the general concept of diversification, including diversification of public revenues, trading
partners, and production. It seeks to understand the linkages between the oil and non-oil sectors
and offer recommendations on how Ecuador could frame public policy to achieve diversification.
The current study on Ecuador is structured in four chapters.
Chapter 1 presents an overview of the Ecuadorian economy and the linkages between the
oil and non-oil tradable sectors, setting the stage for an in-depth analysis of each subsector in
subsequent chapters.
Chapter 2 provides an overview of oil sector activities, describing trends for oil
production, the legal and regulatory environment, direct linkages to other economic activities,
and fiscal matters related to the sector.
Chapter 3 provides an overview of non-oil activities in the tradable sector, describing
trends for non-oil production and growth, fiscal matters for the sector, constraints on growth,
trade agreements, and industrial policy affecting development of the non-oil sector. It also
examines the prospects for growth of Ecuador’s economy under various policy or external-shock
scenarios in the oil and non-oil sectors.
Chapter 4 looks at the experiences of other countries that have succeeded in diversifying
away from dependence on commodities and export products, seeking lessons for Ecuador.
The report was prepared for internal discussions. The study will be useful for the CMU
and for dialogue with the public and private sector as the opportunity arise.


Executive Summary ..................................................................................................................................... i 1. Overview Of The Ecuadorian Economy .......................................................................................... 1
1.1 History of Ecuador’s commodity booms, busts, and political instability ............................2 1.2 Recent Trends In GDP, Employment, and Exports .............................................................5
Employment........................................................................................................................11 Exports ...............................................................................................................................12
1.3 Intersectoral Dynamics for the Oil and Non-Oil Sectors ...................................................13 1.4 Export concentration and Macro Volatility .......................................................................15 1.5 Summary and Conclusions ................................................................................................17
2. The Oil Sector ................................................................................................................................... 19 2.1 Oil Sector Overview ..........................................................................................................19
Petroecuador......................................................................................................................25 Private firms.......................................................................................................................26
2.2 Regulations and Contracts for Oil Activities .....................................................................27
2.3 The Oil Sector’s Linkages to Other Economic Activities .................................................31 Main providers of the oil sector’s intermediate consumption ...........................................31 Main users of oil-sector production ...................................................................................32
2.4 Fiscal Policy and the Energy Sector ..................................................................................33 Oil Revenue ........................................................................................................................33
Off-budget subsidies and the linkage between oil and electricity......................................34 Subsidies’ persistence ........................................................................................................37 Stabilization funds for oil revenues....................................................................................38
2.5. Growth Potential of the Oil Sector....................................................................................41
2.6 Conclusions and Policy Recommendations .......................................................................43 3. The Non-Oil Tradable Sector .......................................................................................................... 45
3.1 Recent Experience of Export Growth in the Non-Oil Sector ............................................45 Non-oil primary products ..................................................................................................45
Manufactured products ......................................................................................................49 The Government’s Industrial Policy Plans ........................................................................53
3.2 Policies that affect the growth of the non oil sector ...........................................................55
Trade agreements, trade protection, and growth ..............................................................69 Tariff protection and export growth ..................................................................................79
3.4 Conclusions and Policy Recommendations .......................................................................80 4. Managing Natural Resources and Promoting Diversification In Other Mineral-Abundant
Countries ........................................................................................................................................... 83 4.1 Regional Overview ............................................................................................................83 4.2 Experiences in Three LAC Countries ................................................................................85
Chile ...................................................................................................................................85 Mexico ................................................................................................................................88 Trinidad and Tobago .........................................................................................................91
4.3 Experiences in the Persian Gulf .........................................................................................93 4.4 Conclusions ........................................................................................................................96
REFERENCES ........................................................................................................................................ 101 Appendix A. Sectoral Dynamics............................................................................................105

Appendix B. Export Concentration and Macro Volatility: A Time-Series Perspective from
Ecuador ..................................................................................................................................107 Appendix C. Oil Sector Complementary Data ......................................................................113 Appendix D. Intermediate Consumption of Extracting and Refining Sectors.......................115
Share of intermediate consumption by sector ..................................................................115 Share of the overall use of other sectors’ products .........................................................116
Share of the intermediate use of other sectors’ products in the economy ....................117 Appendix E. Real Growth Rates for Economic Sectors ........................................................119
and Main Export Products .....................................................................................................119 Appendix F. Tariffs and Effective Protection Indexes ..........................................................135 Appendix G. Simulated Cumulative Distribution Function (CDF) for Individual Sectors
and Probability of Observing the Growth Rate within a Range ............................................139
List of Tables
Table 1.1. Key Economic Indicators, 1993-2008 ........................................................................... 6
Table 1.2a. Sectors as a share of GDP, 1993–2008 (%) ............................................................... 10 Table 1.2b. Sector-specific growth rates in real terms, 1994–2008 (%) ....................................... 10
Table 1.3 Employment by Sector .................................................................................................. 12 Table 1.4. Bivariate cointegration of the oil sector ....................................................................... 14 Table 2.1 Contract type by company ............................................................................................ 30
Table 2.2. Intersectoral linkages of the oil sector ......................................................................... 33 Table 2.3. Non-Financial Public sector revenue in Ecuador, 1990–2008 .................................... 34
Table 2.4. Fuel Subsidies, 2001–08 .............................................................................................. 35 Table 2.5 Impact of Diesel Consumption for Electric Generation on Total Diesel Subsidy ........ 36
Table 2.6 Electric Tariffs in Latin America – 2006 ...................................................................... 36 Table 2.7. Oil-related stabilization funds in Ecuador in place until 2007 .................................... 38
Table 2.8. Estimates of Ecuador oil reserves ................................................................................ 42 Table 3.1. Manufacturing subsector’s average exports growth rate, ............................................ 50 Table 3.2. The government’s main industrial policy objectives ................................................... 55
Table 3.3. Non Financial Public sector (NFPS) revenue in Ecuador, 1990–2008........................ 62 Table 3.4. Non-Financial Public Sector (NFPS) Spending trends, 1990–2008 ............................ 64 Table 3.5. The Functional Classification of Public Expenditures, 1995–2006 ............................ 66
Table 3.6. Spending in Education and Transport in Latin America and East Asia ...................... 67 Table 3.7 Ecuador’s Major Trade Partners and its Exports .......................................................... 70 Table 3.8 U.S. Custom Tariffs ( 2004) ......................................................................................... 72 Table 3.9. Nominal growth rates of major non-oil exports ........................................................... 73
Table 3.10. Exports to Argentina: Most favored sectors, 2004–08 .............................................. 75 Table 3.11. Exports to Argentina: Sector with highest exports, 2004–08 .................................... 75 Table 3.12. Exports to Brazil: Most favored products, 2004–08 .................................................. 76
Table 3.13. Exports to Brazil: Sectors with highest exports, 2004–08 ......................................... 76 Table 4.1. Top two principal commodity exports for select countries in Latin America and the
Caribbean, 1962–2005 .................................................................................................................. 84 Table 4.2. Dependency of fiscal revenue sources: ........................................................................ 84 Table 4.3: GCC Oil Reserve ......................................................................................................... 93 Table 4.4: Per capita GDP and institutional quality in mineral-exporting countries (2007) ....... 98 Table 4.5. Policies in Chile, Mexico, and Trinidad and Tobago .................................................. 99

Table A.1. Correlation between a change in oil price and a change in sector output ................. 106
Table B.1. Growth rates and volatility during times of export concentration ............................ 110 Table B.2. Regression results with GDP volatility as the dependent variable ........................... 111 Table C.1. Main hydrocarbon-related laws................................................................................. 114
Table E.1. Intermediate consumption of the oil extraction subsector, 2000–07 ......................... 128 Table E.2. Intermediate consumption of the oil refinery and oil pipelines subsector, 2000–07 129 Table E.3. Intermediate consumption of the oil sector, 2000–07 ............................................... 130 Table E.4. Share of oil extraction in total input utilization, 2000–07 ......................................... 131 Table E.5. Share of total input use of the oil refinery subsector, 2000–07 ................................. 132
Table E.6. Share of the oil sector in total input use, 2000–07 .................................................... 133 Table F.1. Average tariff for final output of the tradable sectors of Ecuador’s national accounts
..................................................................................................................................................... 135 Table F.2. Average tariff for the inputs defined in Ecuador’s national accounts (%) ................ 136
Table F.3. Effective protection indexes for Ecuador’s tradable sectors ..................................... 137 Table G.1. Simulation results for GDP growth rate.................................................................... 140
List of Figures
Figure 1.1. Shares of Exports, 1927–2008 ...................................................................................... 3
Figure 1.2. Real GDP growth, by decades ...................................................................................... 3 Figure 1.3. GDP growth and its trend, 1928-2008 .......................................................................... 7
Figure 1.4. Terms of Trade, 2000-2008 .......................................................................................... 7 Figure 1.5. Growth Rate of Selected Countries ............................................................................. 8 Figure 1.6. Average GDP per capita (2000-2008) .......................................................................... 8
Figure 1.7. Total exports by sector, 1990–2008 ........................................................................... 13
Figure 1.8. Export concentration and output volatility—cross-country evidence, 1986-2006 ..... 16 Figure 2.1. Annual Growth of real GDP and of oil output, 1994–2007 ....................................... 20 Figure 2.2. Oil sector production, 1992–2008 .............................................................................. 22
Figure 2.3. Crude oil production, by type of company, 1992–2008 ............................................. 23 Figure 2.4. Oil sector export values and world prices, 1990–2008 .............................................. 24
Figure 2.5. Imports of oil derivatives, 1990–2008........................................................................ 25 Figure 2.6. Oil sector investment, 1993–2004 .............................................................................. 26 Figure 2.7. Foreign direct investment, 1993–2007 ....................................................................... 27
Figure 2.8. Intermediate consumption of the oil sector, 2000–07 ................................................ 32 Figure 2.9. Oil sector flow of funds .............................................................................................. 40
Figure 2.10. Oil sector investment, 1993–2019 ............................................................................ 43 Figure 3.1. Share of total primary exports, by product, 1990–2008 ............................................. 47
Figure 3.2. Export Diversification – Total Exports ...................................................................... 51 Figure 3.3. Export Diversification – Non Oil Exports .................................................................. 51 Figure 3.4. Inflation ...................................................................................................................... 58 Figure 3.5. Annual Exchange Rate ............................................................................................... 58 Figure 3.6. Financial Access of the Private Sector ....................................................................... 59
Figure 3.7. Real Effective Exchange Rate. ................................................................................... 60 Figure 3.8. Evolution of US dollar against other major currencies. ............................................. 61 Figure 3.9. Non-Financial Public Sector (NFPS) expenditures (excluding subsidies), NFPS
balance, and oil prices, 1990–2008 ............................................................................................... 64 Figure 3.10. NFPS capital expenditures and oil prices, 1990–2008 ............................................. 65

Figure 3.11. NFPS payroll and oil prices, 1990–2008 .................................................................. 65
Figure 3.12. Trade agreement destinations as percentage of total exports ................................... 70 Figure 3.13. Exports to Chile, 1990–2008 .................................................................................... 78 Figure 3.14. Export Growth: Free Trade Versus No Preferences ................................................. 79
Figure 3.15. Effective protection and sector GDP growth, 1993–2007 ........................................ 80 Figure A.1. Ratio of manufacturing to services GDP and HP filtered ratio ............................... 105 Figure A.2. Oil price and HP filtered series, 1993–2008, in log terms ...................................... 105 Figure A.3. Oil prices and ratio of manufacturing to services GDP, in log terms ...................... 106 Figure B.1. Export concentration and GDP per capita ............................................................... 108
Figure B.2. Export concentration and output volatility .............................................................. 108 Figure B.3. Export concentration and terms-of-trade volatility .................................................. 109 Figure B.4. Terms-of-trade volatility and output volatility ........................................................ 109 Figure C.1. Major components of oil sector exports, 1988–2008 .............................................. 113
Figure C.2. Share of oil sector in total exports, 1988–2008 ....................................................... 113 Figure C.3. Volume of oil exports, 1992–2008 .......................................................................... 114
Figure D.1. Intermediate consumption of the oil extraction sector, 2000–07 ............................ 115 Figure D.2. Intermediate consumption of the oil refining sector, 2000–07 ................................ 115
Figure D.3. Total use of the products of other sectors by the oil extraction sector, 2000–07 .... 116 Figure D.4. Total use of the products of other sectors by the oil refinery sector, 2000–07 ....... 116 Figure D.5. Intermediate use of the products of other sectors by the oil extraction sector 2000–07
..................................................................................................................................................... 117 Figure D.6. Intermediate use of the products of other sectors by the oil refinery sector, 2000–07
..................................................................................................................................................... 117 Figure E.1 Annual growth of oil real GDP, 1994–2007 ............................................................. 119 Figure E.2 Annual growth of fishing real GDP, 1994–2007 ...................................................... 119
Figure E.3 Annual growth of agriculture real GDP, 1994–2007 ................................................ 119
Figure E.4. Annual growth of industrial real GDP, 1994–2007 ................................................. 120 Figure E.5. Annual growth of construction real GDP, 1994–2007 ............................................ 120 Figure E.6. Annual growth of commerce real GDP, 1994–2007................................................ 120
Figure E.7. Annual growth of transportation real GDP, 1994–2007 .......................................... 121 Figure E.8. Annual growth of financial services real GDP, 1994–2007 .................................... 121
Figure E.9. Annual growth of real estate real GDP, 1994–2007 ................................................ 121 Figure E.10. Annual growth of public sector real GDP, 1994–2007 .......................................... 122
Figure E.11. Annual growth of other services real GDP, 1994–2007 ........................................ 122 Figure E.12. Growth of banana exports, 1994–2007 .................................................................. 122 Figure E.13. Growth of fish and shrimp exports, 1994–2007 .................................................... 123 Figure E.14. Growth of flower exports, 1994–2007 ................................................................... 123
Figure E.15. Growth of processed agricultural products exports, 1994–2007 ........................... 123 Figure E.16. Growth of other agricultural products exports, 1994–2007 ................................... 124 Figure E.17. Growth of cacao exports, 1994–2007 .................................................................... 124
Figure E.18. Growth of coffee exports, 1994–2007 ................................................................... 124 Figure E.19. Growth of industrial exports, 1991–2008 .............................................................. 125 Figure E.20. Growth of furniture exports, 1991–2008 ............................................................... 125 Figure E.21. Growth of mineral exports, 1991–2008 ................................................................. 125 Figure E.22. Growth of processed wood exports, 1991–2008 .................................................... 126 Figure E.23. Growth of textile exports, 1991–2008 ................................................................... 126

Figure E.24. Growth of clothes exports, 1991–2008 .................................................................. 126
Figure E.25. Growth of chemical exports, 1991–2008 ............................................................... 126 Figure E.26. Growth of ceramic exports, 1991–2008 ................................................................. 127 Figure E.27. Growth of rubber and plastic exports, 1991–2008 ................................................. 127
Figure G.1. CDF of growth rate of real GDP, 2010 ................................................................... 142 Figure G.2. CDF of growth rate of real GDP, 2011 ................................................................... 142 Figure G.3. CDF of growth rate of real GDP, 2012 ................................................................... 142 Figure G.4. CDF of growth rate of real GDP, 2013 ................................................................... 143 Figure G.5. Probability of observing growth rate of real GDP within a certain range, 2010 ..... 143
Figure G.6. Probability of observing growth rate of real GDP within a certain range, 2011 ..... 143 Figure G.7. Probability of observing growth rate of real GDP within a certain range, 2012 ..... 143 Figure G.8. Probability of observing growth rate of real GDP within a certain range, 2013 ..... 144 Figure G.9. CDF of growth rate of oil GDP, 2010 ..................................................................... 144
Figure G.10. CDF of growth rate of oil GDP, 2011 ................................................................... 144 Figure G.11. CDF of growth rate of oil GDP, 2012 ................................................................... 144
Figure G.12. CDF of growth rate of oil GDP, 2013 ................................................................... 145 Figure G.13. Probability of observing real growth rate of oil GDP within a certain range, 2010
..................................................................................................................................................... 145 Figure G.14. Probability of observing real growth rate of oil GDP within a certain range, 2011
..................................................................................................................................................... 145
Figure G.15. Probability of observing real growth rate of oil GDP within a certain range, 2012
..................................................................................................................................................... 145
Figure G.16. Probability of observing real growth rate of oil GDP within a certain range, 2013
..................................................................................................................................................... 146 Figure G.17. CDF of growth rate of industrial sector GDP, 2010 .............................................. 146
Figure G.18. CDF of growth rate of industrial sector GDP, 2011 .............................................. 146
Figure G.19. CDF of growth rate of industrial sector GDP, 2012 .............................................. 146 Figure G.20. CDF of growth rate of industrial sector GDP, 2013 .............................................. 147 Figure G.21. Probability of observing real growth rate of industrial sector GDP within a certain
range, 2010 .................................................................................................................................. 147 Figure G.22. Probability of observing real growth rate of industrial sector GDP within a certain
range, 2011 .................................................................................................................................. 147 Figure G.23. Probability of observing real growth rate of industrial sector GDP within a certain
range, 2012 .................................................................................................................................. 147 Figure G.24. Probability of observing real growth rate of industrial sector GDP within a certain
range, 2013 .................................................................................................................................. 148 Figure G.25. CDF of growth rate of primary sector GDP, 2010 ................................................ 148
Figure G.26. CDF of growth rate of primary sector GDP, 2011 ................................................ 148 Figure G.27. CDF of growth rate of primary sector GDP, 2012 ................................................ 148 Figure G.28. CDF of growth rate of primary sector GDP, 2013 ................................................ 149
Figure G.29. Probability of observing growth rate of real primary sector within a certain range,
2010............................................................................................................................................. 149 Figure G.30. Probability of observing growth rate of real primary sector within a certain range,
2011............................................................................................................................................. 149 Figure G.31. Probability of observing growth rate of real primary sector within a certain range,
2012............................................................................................................................................. 149

Figure G.32. Probability of observing growth rate of real primary sector within a certain range,
2013............................................................................................................................................. 150 Figure G.33. CDF of growth rate of public sector GDP, 2010 ................................................... 150 Figure G.34. CDF of growth rate of public sector GDP, 2011 ................................................... 150
Figure G.35. CDF of growth rate of public sector GDP, 2012 ................................................... 150 Figure G.36. CDF of growth rate of public sector GDP, 2013 ................................................... 151 Figure G.37. CDF of growth rate of construction GDP, 2010 .................................................... 151 Figure G.38. CDF of growth rate of construction GDP, 2011 .................................................... 151 Figure G.39. CDF of growth rate of construction GDP, 2012 .................................................... 151
Figure G.40. CDF of growth rate of construction GDP, 2013 .................................................... 152 Figure G.41. CDF of growth rate of production-related services GDP, 2010 ............................ 152 Figure G.42. CDF of growth rate of production-related services GDP, 2011 ............................ 152 Figure G.43. CDF of growth rate of production-related services GDP, 2012 ............................ 152
Figure G.44. CDF of growth rate of production-related services GDP, 2013 ............................ 153 Figure G.45. CDF of growth rate of other services GDP, 2010 ................................................. 153
Figure G.46. CDF of growth rate of other services GDP, 2011 ................................................. 153 Figure G.47. CDF of growth rate of other services GDP, 2012 ................................................. 153
Figure G.48. CDF of growth rate of other services GDP, 2013 ................................................. 154
Table of Boxes
Box 2.1. International oil prices, local derivative prices, and subsidies ...................................... 35 Box 2.2. Chile sovereign wealth funds ......................................................................................... 41 Box 3.1. The boom in flower exports: .......................................................................................... 47
Box 3.2. Broccoli exports ............................................................................................................. 48
Box 3.3. Heart of palm exports: .................................................................................................... 48 Box 3.4. Palm oil exports: ........................................................................................................................... 49 Box 3.5. Industrial manufacturing exports and trade agreements ................................................ 50

i
EXECUTIVE SUMMARY
There is a general perception among academics and politicians that Ecuador’s
economy has performed below its potential in recent decades. The country has made
less progress than it could have in creating jobs and improving the standard of living of
its citizens, despite the high priority placed by several administrations on social
improvement. This underperformance causes: Ecuador’s excessive dependence on
revenues from oil exports, pro-cyclical fiscal policies, limited growth of non-oil exports,
and recurring economic and political instability.
Sustaining faster growth in a small open economy such as Ecuador’s will require
both taking better advantage of the country’s oil resources and accelerating the
ongoing diversification of the economy. Growth in a more diversified economy would
have a stronger social impact in terms of employment and income distribution, since the
oil sector is capital-intensive, generates few jobs directly, and has few linkages to other
economic activities. Also, diversification will help to reduce macroeconomic volatility
and reduce the government’s vulnerability to changing world oil prices.
Ecuador could readily improve its economic performance. The country has a great
many natural, cultural, and human assets that it can use to achieve better economic and
social outcomes. While there is more political stability, as President Correa has remained
in power since 2007, in contrast to the presidential frequent turnovers earlier in the
decade there is still high uncertainty in the business climate that hinders the participation
of the private sector.
Overview of Economic Growth
The Ecuadoran economy depends primarily on natural resources, but the
composition of its exports and the number of export markets has gradually
diversified since the early 1990s. The tradable sectors represent about 33 percent of
GDP. Ecuador’s main exports are primary goods, with oil the most important (on
average, 44 percent of total exports).1 Despite oil’s continued dominance, other exports
have more than doubled from 1993 to 2008, while the volume of oil exports has only
increased 60 percent. Agriculture continues to be the largest sector of the economy,
representing about 10% of GDP and 30% of employment (see table 1.2a), although its
importance has declined as low productivity has led to migration from the countryside in
search of better job opportunities. Manufacturing has grown in recent years, and now
represents about 10 percent of GDP.
Economic growth during the 2003-2008 oil price boom averaged about 5 percent per
year, lower than other natural resource-dependent countries in the region such as
Colombia (5.3 percent), Trinidad and Tobago (8.2 percent), Peru (7.1 percent), and
Venezuela (7.4 percent). Ecuador’s economic performance is well below what could have
1 Over the 1993-2008 period.

ii
been expected considering the magnitude of the country’s terms of trade gains during the
period.2 Compared to other natural resource dependent countries such as Chile,
Colombia, Mexico, Trinidad and Tobago, and the United Arab Emirates, Ecuador had the
highest terms of trade gain but the lowest rate of economic growth during 2005-2007
period. In other words, the country has done relatively poorly in utilizing its energy
resources to generate broader economic growth.
While the oil sector is critically important to Ecuador’s fiscal and external accounts,
it appears to have few direct spillover impacts on the rest of the economy. The oil
industry accounts for only about 0.25 percent of all jobs in the country, and buys few
outputs from other sectors of the economy. Econometric analysis finds no evidence that
growth in the oil sector negatively impacts the performance of other economic sectors,
the so-called “Dutch disease.” The main transmission mechanism from the oil industry to
the rest of the economy is through the government’s fiscal accounts, which highlights the
importance of well-managed fiscal policy for Ecuador’s growth prospects.
The experiences of other countries in Latin America and the Caribbean and
Persian Gulf with high oil dependency suggests that Ecuador should follow a two-
pronged strategy of maximizing its oil industry while at the same time promoting
greater economic diversification. Growth of the resource sector is not a problem in
itself. Revenues from minerals can potentially overcome many other constraints on
growth. Chile, Trinidad, and the Persian Gulf states have found mechanisms that allow
private investment to efficiently develop the industry, while channeling resources for the
benefit of the entire nation. At the same time, encouraging the diversification of
Ecuador’s economy would provide more employment opportunities to the population and
mitigate the volatility caused by oil price fluctuations.
Oil Sector
The oil sector has grown in importance to the Ecuadoran economy over time, but oil
production has fallen in recent years. In 1993, oil accounted for 41 percent of total
exports, 6.8 percent of GDP and less than half of public sector revenue. But in 2008, oil
accounted for about two-thirds of total exports, 18 percent of GDP and half of public
sector revenue. Ecuador's crude oil output fell to 486,067 barrels per day (bpd) in 2009
from 504,721 bpd in 2008. This represents a 4 percent decline with respect to 2008.
Petroecuador's output rose nearly 5.6 percent to 281,556 bpd, but the output of the
foreign and private oil companies decreased 14.4 percent to 204,511 bpd. Oil’s real
growth all occurred in the early 1990s, when private oil companies were expanding, and
in 2003-2004, when the private sector constructed the OCP pipeline.
The oil sector has significant growth potential, but is constrained by
underinvestment. Ecuador has one of the lowest ratios of production to reserves (4.4
percent in 2007) among oil-producing countries with broadly similar reserve levels,
including the United Kingdom (16.6 percent), Colombia (13.7 percent), Norway (11.4
2 Terms of trade increased 33 percent during the 2003-2008 period.

iii
percent), and Argentina (9.8 percent). Moreover, the ratio of production to reserves in
Ecuador is much higher for private companies (11.4 percent) than for Petroecuador (1.9
percent), suggesting that additional investment could increase substantially
Petroecuador’s current production. Projections estimate that investments of
approximately US$8.6 billion over the next 10 years in overhauling Petroecuador’s
current oil fields would yield oil sector growth of 66 percent (an additional 122 million
barrels per year).
Prior to 2005, oil production of the state-run company Petroecuador has declined
steadily, while the production of private companies rose from 2.6 million barrels to
123 million barrels per year. In 2006 when the government terminated an oil contract
with Occidental Petroleum and renegotiated other contracts, Petroecuador’s sales
increased, but as a result, private companies have postponed or reduced investment plans.
Foreign investment in the oil sector actually turned negative in 2006 in and 2007 as
companies began liquidating assets in Ecuador, although oil sector FDI recovered from –
US$122 million in 2007 to US$161 million in 2008. A more transparent and stable
contract and regulatory environment for private companies would attract greater
investment to the sector, boost production, and increase revenue for the country.
Petroecuador has performed poorly, hampered by obsolete technologies, limited
resources for investment, and weak corporate governance. Much of Petroecuador’s
technology dates from the early 1990s, which is inefficient, costly and less
environmentally responsible than the more modern equipment of private companies. Low
investment in the company is due to financial constraints imposed by the government and
to poor management. Petroecuador had 18 CEOs in 1998-2008, and from 2007 to early
2010 was managed by naval officers. The company urgently requires further reforms to
overhaul management practices, increase technical expertise for investment and
production, and strengthen transparency and accountability.
Oil Revenues and Fiscal Policy
Like all countries reliant on commodity exports, Ecuador’s fiscal revenues are
vulnerable to sudden changes in international prices. The strongly pro-cyclical fiscal
policies have amplified the boom-and-bust cycles in the economy. During 2005-2008, for
example, government spending increased 162 percent in dollar terms and rose from 23
percent of GDP to 41 percent of GDP, an extraordinarily expansive fiscal stance in boom
years. Ecuador experimented with various oil revenue stabilization funds since 2000, in
order to reduce pro-cyclical fiscal policy and build up cushions for economic downturns.
However, these funds fell victim to political pressures to spend the extra oil revenue, and
all were eliminated in early 2008.
The sudden fall of oil prices during the second half of 2008, accompanied by a high
level of public expenditures, highlight the need for some mechanism to stabilize the
use of oil revenues over the medium term. Oil revenues fell from about 5 percent of
GDP collected in the second quarter to 2.4 percent of GDP collected in the fourth quarter,
while expenditures were kept above 11 percent of GDP during the second semester of

iv
2008. The country could employ a market-based hedging mechanism to stabilize the
minimum level of oil revenues without eliminating the benefits of higher prices like
Mexico. Alternatively, Ecuador could reinstate an oil fund with much simpler rules for
income sources, investments, and earmarking expenditure than the ones used until 2007.
Chile’s fund for copper revenues, governed by a participatory process centered on an
independent committee that includes experts from diverse ideological and technical
perspectives, could be a useful template for Ecuador.
Universal fuel subsidies for consumption, transportation and electricity generation
are costly and mainly benefit the non-poor. Fuel subsidies have risen from about 3
percent of GDP in 2003 to over 8 percent of GDP in 2008 (US$4.5 billion). This
compares to a combined budget for health and education in 2008 of about 4 percent of
GDP. Ecuador is heavily dependent on thermal electricity that burn oil fuels. The
subsidies for electric generation reached US$253 million dollars in 2008. Although
electric generation is subsidized, Ecuadorians still pay among the highest electrical tariffs
in Latin America. Also, the fuel price subsidies overwhelmingly benefit the non-poor: the
richest quintile of the population consumes 43 percent of Ecuador’s fuel, while the
poorest quintile consumes only 7 percent. Ecuador can greatly improve the equity of its
fiscal policy by replacing universal energy subsidies with targeted mechanisms to help
those most in need.
Non-Oil Tradable Sector
Ecuador’s non-oil tradable sector has gradually diversified since the 1990s,
supported by international market opportunities. The bulk of non-oil exports are
primary products such as bananas, cacao, fish, and shrimp. Non-traditional primary
exports such as flowers and processed agricultural products have grown steadily in recent
years. Manufacturing represents about 10 percent of exports by value, with recent growth
in the machinery, furniture and minerals sub-sectors. Overall, non-oil exports have
continued to grow since 2002, providing evidence that the oil price boom has not had a
“Dutch disease” effect.
Diversification is evident in the declining concentration of both export products and
export markets. The number of products representing three-quarters of total non-oil
exports increased from 5 in 1990 to 23 in 2008. Growth has come mainly from non-
traditional agricultural exports such as flowers, broccoli, heart of palm, tropical fruits,
and vegetable oils. The number of export markets has followed a similar pattern. The
number of markets representing three-quarters of total non-oil exports increased from 4 in
1990 to 11 in 2008.
Ecuador has not successfully used trade policy to further diversify its export
markets and create more job opportunities. A review of trade protection mechanisms
and sectoral performance reveals that protection policies have not led to strong export
growth for the most protected products. The fastest-growing export sectors tend to have
relatively low effective levels of protection, and their success has generally resulted from
favorable international market conditions and agile private sector strategies, not

v
government sectoral policies. At the same time, Ecuador has not signed free-trade
agreements with many of its major trading partners, and the preferences it has obtained in
trade negotiations have been for almost non-existent export goods, such as industrial
manufactures.
Products making up Ecuador’s non-oil export basket are still largely based on low
wages and have few links to other goods, meaning their capacity to promote broader
economic growth is weak. This is particularly true of traditional primary agricultural
products, although newer non-traditional exports have greater developmental potential.
The key for Ecuador is to increasing the importance of the non-oil tradable sector—
including both exports and industries that efficiently substitute for imports. The current
government is taking an active role in attempting to reshape the country’s productive
structure toward activities with dynamic comparative advantages and greater employment
opportunities through the implementation of a new industrial policy. While the policy’s
goals are laudable, its all-encompassing nature suggests a lack of clear strategic priorities.
Further, it runs the risk of repeating past mistakes in trying to pick winners, which is
subject to discretion and lobbying.
A less risky approach to promoting greater economic diversification in the non-
energy tradable sector would be with policies to improve the overall business
climate. As the experiences of Chile, the Persian Gulf states and, to a lesser extent,
Mexico and Trinidad and Tobago suggest, this means building the credibility that
investors need by sustaining policies over time—as Ecuador has already done with
dollarization. Ecuador will benefit from increased certainty of its regulatory and
macroeconomic policies, especially related to trade, fiscal policy and the business
climate. These issues are discussed in more detail below.
Policies to Promote Diversification and Sustained Growth
Ecuador could foster export growth and diversification by negotiating trade
agreements with large regions with which Ecuador has trade complementarities,
such as East Asia, the European Union, Canada and the US. Exports to countries
granting Ecuador trade preferences grew at an average of 13.2 percent, while exports to
countries without trade agreements only grew by 10.9 percent. This suggests that free
trade agreements generate somewhat more export growth. In addition, the positive effect
of free trade on exports growth and sector growth depend on the size of the market
granting Ecuador trade preferences. Ecuador should focus on securing trade preferences
with the largest economies in the world that offer trade complementarities.
Dollarization has brought both benefits and drawbacks to Ecuador, but on balance
the stability it has provided suggests that leaving it in place would be advantageous.
On the positive side, inflation has been brought under control, and monetary stability has
led to greater confidence for savers and investors. GDP growth averaged 2.6 percent a
year from 1993 to 1998 while investment remained at roughly 21 percent of GDP.
Adopting the US dollar as the country’s currency brought confidence to Ecuador’s
economy. As a result, growth increased from 2.8 percent in 2000 to 5.3 percent in 2001.

vi
Investment rose from 20 percent of GDP in 2000 to 24 percent in 2001. The decline in
inflation after dollarization was remarkable—from 91 percent in 2000 to about 20 percent
in 2001. Since dollarization, the economy has grown at an average of 5 percent, and
inflation has averaged 7 percent. Dollarization does have drawbacks—namely loss of the
use of the nominal exchange rate policy and independent monetary policy to help cushion
external shocks and economic cycles. In particular, in an oil dependent country when
there are changes in the commodity price it cannot use the exchange rate to adjust for the
change in the relative prices. Prudent fiscal management is necessary due to this
limitation. Considering dollarization’s positive role in promoting non-traditional exports
and the risk and cost of reintroducing a national currency, however, maintaining
dollarization appears to be the best policy course for Ecuador.
Keeping fiscal balances sustainable is essential to economic growth. Incentives to
invest in the non-oil sector—the essence of diversification—depend on expectations of
stability in overall demand and macroeconomic policy. During the run-up of oil prices
from 2002 to 2008, Ecuador acted as if the windfall were permanent. Budgeted public
spending increased significantly at the pace of oil revenues. All categories of spending,
except interest, grew in absolute dollar terms and as a share of GDP during the 2005-
2008 boom. There was no apparent effort to mitigate the procyclical pattern of fiscal
stimulus or to assure fiscal sustainability when revenues declined. This pro-cyclical fiscal
policy has not contributed to positive expectations to invest in the non-oil sector. Chile,
Trinidad and the Gulf states have done relatively well in maintaining fiscal balances and
stabilization funds, while Mexico ran surpluses in a more ad hoc way but paid off debt
during the recent boom, strengthening its access to credit markets. Keeping prudent fiscal
policy has allowed these countries to attract investment.
Ecuador can use fiscal policy more strategically to promote economic diversification
by reorienting spending priorities. In other resource-dependent countries in Latin
America and the Caribbean and the Persian Gulf, mineral sector revenues have an
important role in public spending, and the governments recognize the need to build up
human and physical capital to take the place of depleting mineral reserves. Putting oil
earnings into public investments rather than private consumption—most of it typically by
upper income groups—is critical but politically difficult. To improve its prospects for
future growth, Ecuador should increase the quality and amount of spending on public
education and on transport and communications infrastructure, which are low in Ecuador
(under 3 percent and 1 percent of GDP, respectively) compared to other Latin American
countries and dynamic East Asian exporters. Funding for this, as well as for increased oil-
sector investment, could come from eliminating subsidies for gasoline.
Sustained reforms are needed to improve the regulatory environment for opening
and operating businesses in Ecuador. Chile has been a world leader in business
regulation, and its experiences can offer Ecuador useful examples for designing and
implementing reforms. Mexico and Trinidad and Tobago have done less well, although
both have improved significantly in the past two decades. While laws and regulations can
change quickly on paper, it takes longer to alter the behavior and expectations of both
government officials and businessmen. In all the countries, sustained effort has been

vii
needed to establish credibility and build political support for a more efficient regulatory
regime that promotes business growth and job creation, while maintaining appropriate
public oversight. In Ecuador the government has helped local businesses by sustaining
the dollarization for a decade, and it could do more for them with international trade
agreements, simpler registration rules with less corrupt enforcement, and revised
financial sector regulation to make it more attractive for banks to lend to local firms.

viii

1
1. OVERVIEW OF THE ECUADORIAN ECONOMY
Ecuador’s growth has been sluggish over the past few years. Oil has been one of the main
drivers of the Ecuadorian economy. Despite the recent favorable terms of trade, Ecuador,
on average, has grown at about 5 percent during 2003-2008 period while other oil rich
countries such as Venezuela and the United Arab Emirates have grown at 7.4 percent and
8.8 percent, respectively. For instance, among resource rich countries that experienced
similar gains in terms of trade during 2005-2007 period, Ecuador had the highest terms of
trade gains and yet experienced the lowest economic growth rate during this period.
There are several possibilities on why Ecuador has not been growing as other natural
resource dependent countries. One of these reasons is that the country has fallen into one
of the main pitfalls of natural resource dependence: i) Macroeconomic volatility and
Populist Macroeconomic Management, 3 ii) Clientelistic Institutional Development and
Political Economy, 4 and iii) “Dutch Disease”
5 (See Ahren 2006).
This chapter looks at two of the main pitfalls of natural resource dependence,
macroeconomic volatility and “Dutch Disease,” while presenting an overview of the
Ecuadorian economy, including its history, its key components and its intersectoral
dynamics. Section 1.1 looks at the country’s commodity booms over the past century and
notes how they have affected politics—and how politics has influenced the way Ecuador
handled the commodity booms. Section 1.2 gives a cross-sectional overview since the
early 1990s, showing how sectors differ in their importance for GDP, employment, and
exports. Section 1.3 presents econometric evidence on interactions between oil and non-
oil activities and assesses whether the oil sector’s development led to Dutch disease and
3. Crises in emerging market economies are commonly caused by large terms of trade shocks arising from a
sharp fall in the prices of countries main export commodities, and resource-based economies are
particularly exposed to this kind of risk, with a smaller margin of error than economies that are more
diversified. Good macroeconomic management becomes a necessary condition for any attempt to reduce
the vulnerability of resource based economies to external shocks, and thus for successful economic
development. 4. The allocation of talent in natural resources economies may be biased in favor of the resource sectors, as
highly capable individuals focus on securing rents rather than building successful businesses in other
sectors. Also, countries with resource-based economies are more likely to experience large-scale rebellions
and civil wars- a likely consequence of extreme rent seeking behavior. Resource based economies are
associated with more corruption and therefore are associated with slower long- term growth. And finally, a
higher natural resource share in the economy is associated by greater inequality of income, which also
affects growth negatively. 5. A “Dutch Disease” becomes a problem when the weight of an existing resource sector in exports
increases relatively fast. The increased resource wealth tends to raise the equilibrium real exchange rate and
/or general wage levels, thereby putting pressure on the competitiveness of the other tradable sectors in the
economy. To be able to continue exporting the non-resource based tradable sectors must increase
productivity sufficiently fast in order to maintain their international competitiveness. A potential problem is
that the strong pressure from the appreciated exchange rate on the non-resource tradable sectors may affect
equilibrium employment levels. Therefore, if resource-based currency strength leads to a more capital and
less labor intensive production pattern in other industrial sectors,, it risks contributing to reductions in
industrial employment. This might not be a problem if growth in non-resource based activities is
sufficiently strong to create the necessary jobs.

2
retarded the long-term growth of non-oil sector. Section 1.4 examines the relationship
between export concentration and macroeconomic volatility.
1.1 HISTORY OF ECUADOR’S COMMODITY BOOMS, BUSTS, AND POLITICAL INSTABILITY
Since gaining independence in 1830, Ecuador has had three periods of dependence on a
key product—cacao (1860–1920), bananas (1948–66), and oil (since 1973). Each boom
was driven by strong external demand and high world prices (see figures 1.1–1.2). In the
intervals when the economy did not depend on a single commodity, traditional and
nontraditional products had roughly the same share of Ecuador’s total exports, reflecting
the diminished importance of the previously dynamic leading product (Acosta 2006).
During these intervals, exports became more diversified and less volatile. Commodity
booms reversed the diversification—but not by slowing growth in most of the other
export sectors that drive long-term diversification. They continued to grow at least as fast
as they did before, just not as fast as the booming sector. In other words, the economy
grew faster on average when it depended on a single commodity but export concentration
has led to higher macroeconomic volatility.
When leading exports declined, Ecuador’s economy faced major contractions, which
translated into political and social instability and further hampered sustainable growth.
For instance, cacao was the dominant export for six decades after 1860. Its boom ended
when price collapsed in 1920. The subsequent economic crisis, combined with corruption
and other social and political maladies, played a role in the political instability of the next
28 years. From 1920 to 1948, Ecuador had 35 presidents, with an average term of less
than 10 months. These governments included eight dictatorships, 12 transitional regimes,
and four administrations designated by Constitutional Assemblies. A military revolt
overthrew the government in 1925. In 1925-48, only three Presidents gained their offices
through direct elections—and the elections were fraudulent (Hurtado 2007). Similar
instability occurred in 1963–73, after a terms-of-trade shock brought a decline in banana
exports (Acosta 2006).

3
Figure 1.1. Shares of Exports, 1927–2008
Source: Banco Central de Ecuador.
Figure 1.2. Real GDP growth, by decades
Source: Banco Central de Ecuador.
Ecuador began oil extraction and refinery operations in the early 20th century, with the
discovery of oil on the Santa Elena peninsula. The country became a medium-sized
producer with the discovery of significant oil fields in the Amazon region in the 1960s
and early 1970s. The first oil boom started in 1972 and expanded through 1973 as the
Arab oil embargo pushed up world oil prices (Acosta 2006). At this time oil became
Ecuador’s main export.
0%
10%
20%
30%
40%
50%
60%
70%
80%
90%
100%
Non-traditional Exports Coffee Shrimp and Fisshing Bananas Cocoa Oil and Derivatives
-10.0%
-5.0%
0.0%
5.0%
10.0%
15.0%
20.0%
25.0%
30.0%
1928 1938 1948 1958 1968 1978 1988 1998 2008
Banana's Boom Oil Boom
Oil Boom

4
Ecuador benefited from favorable oil prices for the next decade, leading to a period of
strong growth. In real terms, the economy expanded an average of 9 percent in the 1970s,
including spurts of 14 percent in 1972 and 25 percent in 1973. GDP per capita increased
more than 66 percent. The growth reflected the oil sector’s development as well as major
infrastructure projects financed by oil revenues.
From 1972 to 1979, military regimes implemented economic policies aimed at fostering
import substitution, the development of local production to replace goods bought
overseas. The policy mix included direct and indirect subsidies, freezes on tariffs and
prices of basic goods, and tax exemptions (Acosta 2006). Oil sector development
benefitted from a surge in foreign direct investment, which went from US$571 million in
1973 to US$807 million in 1978. In addition, increasing international liquidity led to
increased public and private borrowing, boosting current spending, large investment
projects, military purchases, and debt service.
This era of high economic growth came to an end with the fall of international oil prices
in 1982. Declining oil revenue, coupled with the El Niño climatic phenomenon that
severely affected most of Ecuador’s primary exports in 1982-83, reduced real economic
growth to an average of 2.4 percent a year in the 1980s. In 1983, the country defaulted on
its debt, and the economy contracted 2.8 percent. President Hurtado’s government
implemented stabilization measures, including devaluation of the currency and increases
in local fuel prices. The economy recovered, growing by 4.2 percent in 1984 and 4.3
percent in 1985. However, another drop on oil prices in 1986 reduced growth to 3.1
percent. In 1987, an earthquake destroyed the oil pipeline (SOTE), stopping oil exports
for almost the entire year and leading to recession and another debt default.
Ecuador’s economy floundered in the 1990s, another decade of low oil prices. At mid-
decade, President Durán Ballén’s administration established an exchange rate policy
aimed at curbing inflation, boosted trade liberalization and promoted privatization of
some state companies. However, the policies were paralyzed by war with Peru in 1995
and corruption charges against the vice president. The rest of the decade was market by
political instability and economic setbacks. The El Niño phenomenon struck again in
1998, collapsing production in the coastal region. The same year, Ecuador signed a peace
treaty with Peru, but 1999 brought another financial crisis, which led to a surge in
inflation, exchange rate depreciation, and default on foreign debt. President Mahuad
adopted the US dollar as the country’s currency, but his administration was soon
overthrown.
Taking office in 2000, President Noboa moved ahead with dollarization and negotiated
new terms with external creditors. As part of establishing the monetary regime, the
government adopted a series of fiscal responsibility laws, including creation of the first
oil stabilization fund. One of President Gutierrez’s first decisions after taking office in
2003 was to increase domestic fuel prices, which had remained frozen for some time. A
series of political missteps led to large popular protests in 2005, resulting in the fall of
President Gutierrez. Vice President Palacios completed that term.

5
President Correa took office in January 2007. His main political project was a
Constitutional Assembly that started meeting in November 2007. The new Constitution—
aimed at enhancing the State role in the economy and introducing new social and
economic rights for the citizens—was adopted in September 2008. Throughout 2007-08,
Correa’s administration benefited from extraordinarily high oil prices, which supported
significantly higher public spending, especially for salaries, infrastructure, fuel subsidies,
and social transfers. In 2009, Correa was re-elected but under the new Constitution it is
considered his first term.
1.2 RECENT TRENDS IN GDP, EMPLOYMENT, AND EXPORTS
Four factors explain much of the economy’s behavior from 1993 to 2008.6 First, trade
liberalization policies, instituted during the 1990s, facilitated the development of new
exports.7 Second, the structure of Ecuador’s financial sector changed in the wake of a
major crisis in 1999, caused by the combined effects of domestic political turmoil, the El
Niño phenomenon, and the Brazilian debt crisis.8 Third, Ecuador emerged from the crisis
with a decision to adopt the dollar as its official currency in 2000, a measure taken as a
last resort to restore confidence and halt inflation. It fostered the development of
nontraditional primary exports. Fourth, international prices for several of Ecuador’s
export commodities, especially oil, rose from 2002 to 2008.
GDP growth—before and after the crisis and dollarization
GDP growth averaged 2.6 percent a year from 1993 to 1998 (see Table 1.1). Investment
remained at roughly 21 percent of GDP. During the 1999 crisis, the economy contracted
6.3 percent, investment plummeted from 21.7 percent to 14.7 percent of GDP, and
inflation soared from 30 percent to 61 percent. Adopting the US dollar as the country’s
currency brought confidence to Ecuador’s economy. As a result, growth increased from
2.8 percent in 2000 to 5.3 percent in 2001. Investment rose from 20 percent of GDP in
2000 to 24 percent in 2001. The decline in inflation after dollarization was remarkable—
from 91 percent in 2000 to about 20 percent in 2001. Since dollarization, the economy
has grown an average of 5 percent, but the behavior of commodity prices and political
uncertainty brought considerable fluctuations. Inflation declined from 2001 until 2008,
when it increased because of higher food prices.
6 Due to methodological issues regarding base-year changes, real sector GDP data before 1993 is not
comparable with later years. Thus, this analysis is constrained to 1993-2008. 7 Ecuador gained Andean Community free trade preferences in 1992-93; the United States granted ATPA
trade preferences (now ATPDEA) in 1992; and trade negotiations with other countries started in the
decade—for example, an FTA with Chile was signed in 1994. 8 The first hints of the financial crisis came with Banco Continental’s bankruptcy in 1996. The causes were
weak financial supervision, risky bank policies, macroeconomic difficulties, and governance issues. The
crisis worsened in late 1998, when the government took over Filanbanco, which had received several
emergency central bank loans. A full-blown crisis erupted in 1999 as three more large banks closed,
intervention reached almost 70 percent of the financial system, and the government declared a deposit
freeze. These events eroded people’s confidence on the government and the currency.

6
Table 1.1. Key Economic Indicators, 1993-2008
Source: Banco Central de Ecuador.
The second oil boom (2003-2008) hasn’t ignited growth in Ecuador. The country’s GDP
increased an average of 5.1 percent a year, significantly below fuel exporter countries
(6.9 percent) and OPEC countries (7.3 percent). Figure 1.3 shows that Ecuador’s growth
rate has been below its trend from 2005-2007, which implies that despite having
favorable terms of trade the economy was growing below its potential. Although,
Ecuador’s average growth rate is higher than the average in Latin America (4.2 percent)
over this period, it is significantly below such natural resource dependent countries such
as Colombia (5.3 percent), Trinidad and Tobago (8.2 percent), Peru (7.1 percent) and
Venezuela (7.4 percent). Moreover, five rich-resource countries experienced terms of
trade gains similar to Ecuador’s in 2005-2007—Colombia, Trinidad and Tobago,
Mexico, Saudi Arabia, Chile and United Arab Emirates. Among these countries, Ecuador
had the highest terms of trade gains and yet the lowest economic growth rate during
2005-2007 (See Figures 1.4, 1.5 and 1.6). Also, Ecuador ranks 11th
in the word in natural
wealth per capita (World Bank, 2006a) but has a GDP per capita of US$3,041.85, while a
country like Finland ranked 9th
in natural wealth per capita and has a GDP per capita of
US$39,855.93. This suggests that Ecuador has not exploited its natural bounty to create
considerable overall wealth.
Average
93-981999 2000 2001
Average
02-052006 2007 2008
Real GDP Growth (%) 2.6 -6.3 2.8 5.3 5.5 3.9 2.5 6.5
CPI ( end of year, %) 29.9 60.7 91.0 22.4 5.1 2.9 3.3 8.8
Exports (% of GDP) 24.8 31.5 37.1 26.7 27.2 34.0 35.1 37.8
As share of Total Exports
Oil 32.9 33.2 49.6 40.6 48.9 59.3 58.2 63.1
Non oil 67.1 66.8 50.4 59.4 51.1 40.7 41.8 36.9
Bananas 21.2 21.4 16.7 18.5 15.2 9.5 9.1 8.9
Coffee 4.7 1.8 0.9 0.9 1.0 0.8 0.9 0.7
Shrimp 15.9 13.6 5.8 6.0 4.7 4.6 4.3 3.6
Cacao 2.6 2.4 1.6 1.9 2.3 1.3 1.7 1.4
Tuna & other fish 1.9 1.6 1.5 1.9 1.4 1.0 1.2 1.0
Non traditional 20.8 26.0 24.0 30.2 26.6 23.4 24.8 21.3
Consumption(% of GDP) 80.0 78.7 73.8 80.1 79.2 75.5 75.0 71.7
Public 12.2 12.5 9.8 10.3 11.2 11.0 11.3 10.9
Private 67.9 66.2 64.0 69.8 68.0 64.4 63.6 60.8
Investment (% of GDP) * 21.7 14.7 20.1 24.3 23.8 23.4 24.1 28.2
Public 4.9 5.5 5.0 4.5 6.9 13.6
Private 15.2 18.8 18.8 18.9 17.2 14.7
Imports (% of GDP) 26.6 25.0 31.0 31.1 30.1 32.9 34.2 37.7
* Includes Changes in stocks.

7
Figure 1.3. GDP growth and its trend, 1928-2008
Source: WB staff preparation based on data from Banco Central de Ecuador.
Figure 1.4. Terms of Trade, 2000-2008
Source: WB staff preparation based on data from WDI.
-10%
-5%
0%
5%
10%
15%
20%
25%
30%
19
28
19
31
19
34
19
37
19
40
19
43
19
46
19
49
19
52
19
55
19
58
19
61
19
64
19
67
19
70
19
73
19
76
19
79
19
82
19
85
19
88
19
91
19
94
19
97
20
00
20
03
20
06
GDP Growth Rate
HP Filter Trend
Ecuador
75
95
115
135
155
175
195
215
2000 2001 2002 2003 2004 2005 2006 2007 2008
Term
s o
f Tra
de
Ind
ex
(200
0 =
100
)
Terms of Trade 2000-08
Ecuador Venezuela, RB Trinidad and Tobago United Arab Emirates
Saudi Arabia Mexico Chile Bolivia
Peru Colombia

8
Figure 1.5. Growth Rate of Selected Countries
Source: WB staff preparation based on data from WEO.
Figure 1.6. Average GDP per capita (2000-2008)
Source: WB staff preparation based on data from WDI.
Sector averages and trends of GDP shares since 1993
Over the past decade and a half, swings in oil prices have affected the petroleum sector’s
contribution to the economy and exports. Production of oil and derivatives increased
from 6.8 percent of nominal GDP in 1993 to 18.3 percent in 2008, averaging 9.8 percent
over the 15 years. In real terms, however, the industry declined from 14.7 percent of GDP
in 1993 to 10 percent in 2008. As a share of export revenues, oil first declined from 41
percent in 1993 to 19 percent in 1998, but it has moved upward since 1999, reaching 63
Ecuador
-10
-5
0
5
10
15
20
2000 2001 2002 2003 2004 2005 2006 2007 2008
An
nu
al g
row
th ra
te (%
)
Real GDP Growth (2000-08)
Ecuador Venezuela, RB Trinidad and Tobago
Saudi Arabia Mexico Chile
Bolivia Peru Colombia
22.4
9.58.6
6.1 5.55.0
2.6 2.31.5 1.1
0
5
10
15
20
25
United Arab
Emirates
Saudi Arabia
Trinidad & Tobago
Mexico Venezuela Chile Colombia Peru Ecuador Bolivia
Con
stan
t 200
0 U
S$, T
hous
and
Real GDP per capita (average 2000-2008)

9
percent in 2008. In value it has follow the same pattern, oil declined from US$1.15
billion in 1993 to US$786 million in 1998, but it has moved upward since then reaching
US$10.6 billion in 2008.
The non-oil tradable sector declined from 32.8 percent of nominal GDP in 1993 to 15
percent in 2008, averaging 23 percent during the period. In real terms, the sector has
increased slightly from 22.7 percent to 24.7 percent of GDP. Due to movements in oil
prices, the non-oil tradable sector as share of export revenues fluctuated between 36.9
percent and 78 percent of export revenues.
Despite the continued importance of oil, other Ecuadorian exports have grown
considerably in the past two decades, diversifying both the economy’s productive
activities and exporters’ markets. The volume of non-oil exports as a share of total
exports has increased from 30 percent in 1993 to 36 percent in 2008. The volume of non-
oil exports has more than doubled during this period, while the volume of oil exports has
grown only 60 percent.
The composition of Ecuador’s exports becomes more diverse.9 In 1990, 75 percent of
total export revenues came from three products, including oil.10
The number rose to eight
in 1999 as falling prices curtailed oil revenues.11
More recently, higher prices boosted the
oil’s share of exports, and five products made up 75 percent of exports in 2008.12
The
number of products representing three-quarters of total non-oil exports increased from
five in 1990 to 23 in 2008. The growth of non-oil sectors since the 1990s has come
mainly from non-traditional agricultural exports, such as flowers, broccoli, heart of palm,
tropical fruits, and vegetable oils. The development of these sectors has been due to a
combination of natural comparative advantage, trade openness, entrepreneurship, the
dollarization, and favorable international markets.
The number of markets that Ecuador exports to has also risen. In 1990, 75 percent of total
exports were sent to six countries.13
The number rose to 11 in 1999, then returned to six
markets in 2008.14
The number of markets representing three-quarters of total non-oil
exports increased from four in 1990 to 11 in 2008.15
Among nontradable sectors, construction and real estate have significantly increased their
share of GDP in 1993-2008 (see Table 1.2a). Other sectors have ebbed. Commerce has
lowered its contribution to GDP from about 13.4 percent in 1993 to about 11.7 percent in
9 In contrast, Hausmann and Klinger (2009) find that the export basket’s composition changed little from
2000 to 2007. They find that the shares don’t change much across export sectors during the period.
However, the number of products being exported actually increased significantly. In terms of export
volumes, the non-oil tradable sector had the fastest growth rate. 10
Bananas, Shrimp and Oil. 11
Oil, Bananas, Shrimp, Cacao, Roses, Tuna, Fuel and other fishing products. 12
Oil, Bananas, Fuel, Petroleum products and roses. 13
United States, Puerto Rico, Peru, Netherlands, Panama and Germany. 14
United States, Chile, Peru, Colombia, Panama and Venezuela. 15
United States, Venezuela, Colombia, Rusia, Italy, Panama, Spain, Germanyu, Netherlands, Peru and
Belgium.

10
2008. Finally, the public sector’s contribution to GDP has remained broadly stable at
around 5.7 percent since 1993.
Sector-specific figures for real growth reveal the following (see Table 1.2b):
During 1994–2008, the tradable sectors (including oil) and the nontradable sectors
grew at about the same pace—an average of 3 percent a year in real terms.
Table 1.2a. Sectors as a share of GDP, 1993–2008 (%)
Source: Banco Central de Ecuador.
Table 1.2b. Sector-specific growth rates in real terms, 1994–2008 (%)
Source: Banco Central de Ecuador.
The nontradable sector on average has grown faster than the tradable sector. Also, the
1999 economic crisis had a sharper initial impact on nontradable activities and a
faster recovery than the tradable sector, in particular oil. Nontradable sectors
Average
1993-1997
1998
Pre-Crisis
1999
Crisis
Average
2000-2008
Average
1993-2008
GDP 100.0 100.0 100.0 100.0 100.0
Tradable Sector 37.6 29.9 33.8 30.7 33.0
Agriculture 12.9 9.9 9.9 6.7 9.1
Fishing 3.7 3.9 1.8 0.9 2.0
Manufacturing 14.1 12.5 14.1 10.0 11.7
Oil 6.9 3.6 7.9 13.1 10.2
Nontradable Sector 62.4 70.1 66.2 69.3 67.0
Construction 3.5 5.5 5.4 8.3 6.5
Commerce 13.3 14.3 14.2 13.1 13.3
Transportation 7.6 8.3 9.3 8.0 8.0
Water and Electricity 1.2 1.4 1.4 1.6 1.5
Financial Services 3.6 3.1 1.5 2.2 2.7
Public Sector 6.0 6.6 7.0 5.2 5.7
Other Services 21.7 23.6 20.2 24.1 23.1
Other 5.4 7.3 7.3 6.7 6.4
Average 1998 1999 Average Average
1994-1997 2000-2008 1994-2008
Tradable Sector 3.8 0.6 -2.9 3.4 2.9
Agriculture 6.9 -5.0 13.0 4.4 5.0
Fishing 8.1 6.1 -6.7 4.8 5.0
Manufacturing 4.0 5.5 -5.2 4.2 3.6
Oil 1.8 -1.9 -8.9 2.1 1.0
Nontradable Sector 2.8 4.0 -6.4 4.6 3.3
Construction 2.8 -0.2 -24.9 9.6 4.8
Commerce 3.6 0.7 -11.2 4.2 2.8
Transportation 3.9 9.4 -0.3 5.2 4.8
Financial Services 11.9 -16.9 -47.3 7.1 3.1
Real Estate and Entrepreneur Activities 3.1 2.9 -6.3 5.5 3.9
Public Sector -3.1 6.0 -5.6 4.9 2.1
Other Services 3.3 4.6 -0.6 1.7 2.2
Other 3.5 2.7 -4.5 7.6 5.4

11
contracted 6.4 percent in 1999 before growing on average 4.6 percent in the
dollarization period that began in 2000. Tradable activities contracted 2.9 percent in
1999, then grew 3.4 percent in 2000-08.
Overall, the tradable sector’s real growth picked up somewhat since dollarization, but
its components have taken different paths :
a. Agriculture grew an average of 5 percent a year since 1994 but slowed
moderately in to 4.4 percent in 2000-08.
b. After being severely hit by the “Mancha Blanca” plague on shrimp in 2000,
fishing has recovered, led by 15.6 percent growth in the shrimp industry in 2001-
07.16
Overall, fishing’s 2001-08 growth of 8.1 percent matched the 1994-97
growth rate.
c. Manufacturing’s growth rose to 4.2 percent in 2000-08, slightly better than the
entire period’s 3.6 percent.
d. The oil sector contracted in most years and only had positive average real growth
due to the large jump in 2003–04, when private firms constructed a new pipeline
for heavy oil.
The service sectors grew faster than the economy overall:
a. Commerce grew an average of 2.8 percent in 1994-2008, but it has accelerated to
4.2 percent since dollarization.
b. Financial sector activities were greatly affected by the 1999 crisis, contracting
almost 50 percent. Under dollarization, they recovered markedly, with an average
growth of 7.1 percent over 2000–08.
c. The public sector has shown procyclical trends, with a contraction until 1997, a
subsequent recovery, and a strong contraction during the 1999 financial crisis.
Afterwards, it recovered strongly, with an average growth rate of 4.9 percent from
2000 to 2008.
Employment
In recent years, Ecuador’s labor resources have shifted gradually toward the nontradable
sector, especially from agriculture. Nontradable industries now account for 51.2 percent
of total employment, up from 48.8 percent in 2004 (see Table 1.3).
Agriculture remains Ecuador’s single most important employer, with 37.1 percent of all
jobs. In the past four years, agricultural employment has declined because the sector’s
low productivity led peasants to migrate to cities in search of better opportunities. Among
services, commerce is the main employer, providing 17.1 percent of jobs. Other
services—real estate, education, health, social security, and entrepreneurship—constitute
12 percent of total employment. The public sector represents 3.1 percent of total
16
“Mancha Blanca,” or White Stain, is a virus that affects mainly shrimp. It had its origins in Asia in the
early 1990s, hitting China and Thailand severely. The virus appeared in Latin America in 1999, mainly
Central America, Mexico, Ecuador, Colombia, and Peru.

12
employment, a larger share than such private sector activities as mining, fishing, and
hotels and restaurants. Employment remains marginal in oil refining and public utilities.
Table 1.3 Employment by Sector
Source: Encuestas de Empleo, Subempleo y Desempleo,
Instituto Nacional de Estadísticas y Censos INEC.
Methodological issues imply that the data from the Encuesta de
Empleo, Subempleo y Desempleo is not comparable with that
from the 2001 population Census.
Exports
Ecuador exports mainly commodities. Oil is the single most important export,
constituting about 60 percent of total exports in 2006-08. In 2009, its contribution to total
exports has declined, reflecting lower international oil prices and a fairly constant export
volume. Oil is discussed further in chapter 2.
Non-oil primary goods include traditional exports—bananas, cocoa, coffee, fishing,
shrimp, and flowers. Other exports are unprocessed products, such as broccoli, tropical
fruits, and dairy products, and processed agricultural products. As with most natural
resource–based products, growth rates for most primary subsectors are highly volatile
because they depend on international commodity prices and suffer when natural disasters
strike. For instance, the El Niño weather in 1997–98 hurt all primary exports with the
Industry 2004 2007
Tradable Sectors 52.7% 48.8%
Agriculture 41.3% 37.3%
Forestry 0.4% 0.4%
Fishing 1.1% 1.0%
Mining 0.3% 0.4%
Oil, natural gas 0.2% 0.2%
Manufacturing 9.4% 9.5%
Oil processing and refinery 0.0% 0.0%
Non-Tradable Sectors 47.3% 51.2%
Public utilities (water and electricity) 0.4% 0.4%
Construction 4.9% 5.9%
Commerce 16.9% 17.1%
Hotels and restaurants 3.0% 4.0%
Transportation 4.2% 4.9%
Financial Services 0.6% 0.7%
Real State and Entrepreneurship 2.1% 2.5%
Public Sector 2.9% 3.1%
Other Services 12.3% 12.6%
Total 100% 100%

13
exception of flowers and shrimp.17
After representing more than 50 percent of total
exports until 2000, primary products’ importance has slipped significantly in recent
years, reaching 30 percent of exports in 2006-08. The decline reflects lower prices for
primary products, not the volatility of the oil market. In volume terms, primary exports
have increased significantly from 2,541.45 tons in 1990 to 6,696.3 tons in 2009.
Manufacturing represents about 10 percent of total exports. Ecuador’s factories expanded
their export share quickly during the early 1990s; since then, they have held their share,
even when the value of oil exports climbed steeply. As shown in Figure 1.7, non-oil
exports—primary products and manufactures—continued to grow after 2002, presenting
some evidence against Dutch disease in Ecuador. However, Ecuador’s growth rate has
been slower than other oil-dependent countries, suggesting the need for more
sophisticated tests for Dutch disease. The following section discusses the intersectoral
dynamics of the oil and non-oil sectors and provides econometric evidence on whether
Ecuador might suffer from Dutch disease.
Figure 1.7. Total exports by sector, 1990–2008
Source: Banco Central de Ecuador.
1.3 INTERSECTORAL DYNAMICS FOR THE OIL AND NON-OIL SECTORS
Econometric analysis can identify links between the oil and non-oil sectors.18
Finding
these relationships would be evidence of long-term interrelationships between economic
sectors, with the relevant coefficients pointing to a positive or negative link between two
sector’s growth rates. For example, a negative long-term linkage between the oil and
industrial sectors would suggest some Dutch disease because stronger growth in the oil
17
Flowers are grown in the Andes mountains, and they were not affected by the floods. Shrimp are grown
in farms that were not affected significantly by El Niño. 18
We are following the cointegration procedures of Johansen (1988) and Johansen and Juselius (1990,
1992).
0
500
1,000
1,500
2,000
2,500
3,000
3,500
4,000
4,500
5,000
1990 1991 1992 1993 1994 1995 1996 1997 1998 1999 2000 2001 2002 2003 2004 2005 2006 2007 2008
Co
nst
an U
S$,
Tho
usa
nd
s
Oil Other Primary Manufactures

14
sector would be accompanied by less dynamism in industrial activities. Table 1.4 shows
the results for oil and six non-oil sectors in Ecuador. The sample is split in two due to a
possible structural shock in the oil sector in 2003. Many of the linkages found for the first
period (1993–2002) do not hold for the second one (2004–08). The exceptions are
transportation and financial services, both important components of the oil cluster
discussed in Chapter 2.
Table 1.4. Bivariate cointegration of the oil sector
Long-term parameter ()
1993q1–2002q4 2004q1–2008q3
Cointegration
relationship Coefficient
Standard
error z-value Coefficient
Standard
error
z-
value
Agriculture vs. oil -1.8 0.4 4.5
Electricity vs. oil -2.7 0.3 8.4
Transportation vs. oil -1.1 0.2 5.0 -0.5 0.1 7.8
Financial vs. oil 5.2 1.3 -4.0 -2.6 0.3 7.7
Other services vs. oil -1.2 0.2 6.5
Public services vs. oil -0.6 0.2 3.2 -0.2a 0.3 0.7
Note: The coefficients are presented in equation form y = Xβ, where X is the oil sector and y is the other sector. The
table only presents the results for those sectors where there is statistical evidence of cointegration.
a. Cointegration with the public sector requires four lags. Over 2004q1–2008q3, there are not enough degrees of
freedom to fully support four lags.
Source: Bank staff calculations.
The strong positive relationship between oil and finance during 1994-2002 is explained
by links between the insurance and oil sectors, a finding that is consistent with the work
of Fiess and Verner (2003). Chapter 2 discusses this relationship further.
The change in the bivariate relations between periods may be related to two events. First,
the Oleoducto de Crudos Pesados (OCP) pipeline built in 2003 brought a sharp increase
in oil production from private companies operating mainly in the heavy crude fields. The
changing shares of publicly versus privately produced oil modified the channels through
which oil interacts with other sectors. Second, the post-2004 period saw high oil prices as
well as the 2005 termination of the production contract with US-controlled Occidental
Petroleum and the transfer of related fields to Petroecuador. These factors may have
altered the impact of channeling oil resources to other sectors through the public sector.
Due to the relatively short sample, we could not test for a multivariate cointegration
between all sectors. Fiess and Verner (2000, 2003) analyze the growth dynamics within
and between sectors in Ecuador during 1965 and 1998. They identify strong links
between the oil industry, financial services, transport, and public services. They find no
direct link, either positive or negative, between the oil and non-oil industrial sectors. This
does not rule out indirect linkages through other sectors—in particular, the public
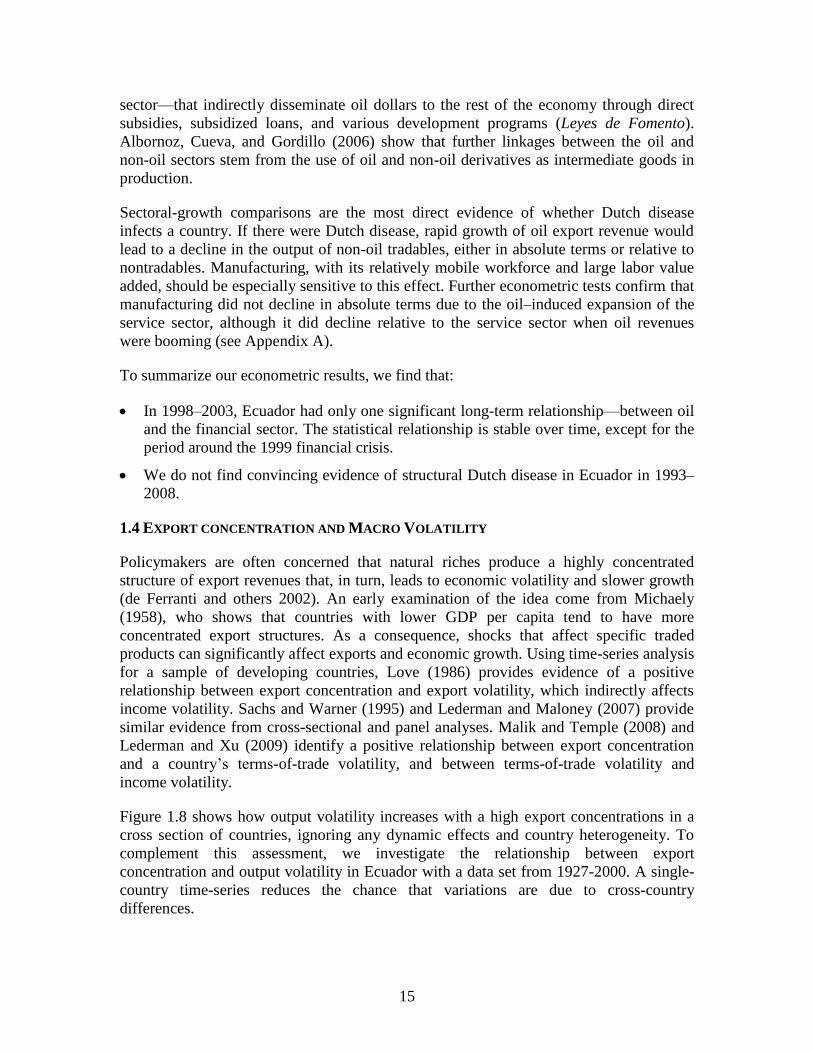
15
sector—that indirectly disseminate oil dollars to the rest of the economy through direct
subsidies, subsidized loans, and various development programs (Leyes de Fomento).
Albornoz, Cueva, and Gordillo (2006) show that further linkages between the oil and
non-oil sectors stem from the use of oil and non-oil derivatives as intermediate goods in
production.
Sectoral-growth comparisons are the most direct evidence of whether Dutch disease
infects a country. If there were Dutch disease, rapid growth of oil export revenue would
lead to a decline in the output of non-oil tradables, either in absolute terms or relative to
nontradables. Manufacturing, with its relatively mobile workforce and large labor value
added, should be especially sensitive to this effect. Further econometric tests confirm that
manufacturing did not decline in absolute terms due to the oil–induced expansion of the
service sector, although it did decline relative to the service sector when oil revenues
were booming (see Appendix A).
To summarize our econometric results, we find that:
In 1998–2003, Ecuador had only one significant long-term relationship—between oil
and the financial sector. The statistical relationship is stable over time, except for the
period around the 1999 financial crisis.
We do not find convincing evidence of structural Dutch disease in Ecuador in 1993–
2008.
1.4 EXPORT CONCENTRATION AND MACRO VOLATILITY
Policymakers are often concerned that natural riches produce a highly concentrated
structure of export revenues that, in turn, leads to economic volatility and slower growth
(de Ferranti and others 2002). An early examination of the idea come from Michaely
(1958), who shows that countries with lower GDP per capita tend to have more
concentrated export structures. As a consequence, shocks that affect specific traded
products can significantly affect exports and economic growth. Using time-series analysis
for a sample of developing countries, Love (1986) provides evidence of a positive
relationship between export concentration and export volatility, which indirectly affects
income volatility. Sachs and Warner (1995) and Lederman and Maloney (2007) provide
similar evidence from cross-sectional and panel analyses. Malik and Temple (2008) and
Lederman and Xu (2009) identify a positive relationship between export concentration
and a country’s terms-of-trade volatility, and between terms-of-trade volatility and
income volatility.
Figure 1.8 shows how output volatility increases with a high export concentrations in a
cross section of countries, ignoring any dynamic effects and country heterogeneity. To
complement this assessment, we investigate the relationship between export
concentration and output volatility in Ecuador with a data set from 1927-2000. A single-
country time-series reduces the chance that variations are due to cross-country
differences.

16
Figure 1.8. Export concentration and output volatility—cross-country evidence, 1986-2006
Source: Bank staff calculations based on World Development Indicators and United Nations Conference
on Trade and Development (UNCTAD) Handbook of Statistics. Based on 171 countries. Export
concentration refers to UNCTAD export concentration index for 2006. Output volatility is calculated as
the standard deviation of real GDP growth from 1986 to 2006.
We find a clear positive link between export concentration and volatility in Ecuador (see
Appendix B). This relationship holds under different measures of export concentration
and a series of control variables, including GDP growth, average volatility from eight
Latin American countries, and dummy variables to account for periods of relatively
concentrated exports.
This positive relationship between export concentration and macroeconomic volatility
carries some implications for policy: Countries can either take export concentration as a
given and attempt to mitigate against it by adopting a macroeconomic policy, or they can
adopt economic policies that support the growth of the non-oil tradable sector. Lederman
and Xu (2007) suggest that good institutions can partly offset output volatility from
commodity dependency, and Malik and Temple (2008) cite the case of Uganda as an
example of how improved macroeconomic management can overcome the adverse
effects of export concentration. Chile’s structural balance rules, which isolate fiscal
policy from cycles in copper prices, is another example of successful macroeconomic
mitigation against macroeconomic volatility induced by commodity dependence.
Industrial policy geared at actively promoting export diversification carries the caveat
that such policies can reduce welfare, particularly if export diversification is achieved by
artificially keeping uncompetitive industries alive or by suboptimal trade agreements that
foster trade diversion. Active industrial policy also requires the government to pick the
right industries—a very difficult task, politically and economically.
EC

17
1.5 SUMMARY AND CONCLUSIONS
The Ecuadorian economy depends primarily on natural resources, but the composition of
exports and the number of export markets has been gradually diversified. The tradable
sector represents about 33 percent of GDP. Ecuador’s main exports are primary goods,
with oil the most important. Since the mid-1970s, oil’s share of total exports has
fluctuated from 22 percent to 63 percent, a level reached in 2008. In volume terms,
however, oil production and exports have stagnated in the past five years. Therefore, the
increase of oil as a share of export revenues has been due to higher oil prices. Despite
oil’s continued dominance, other Ecuadorian exports have grown substantially in the past
two decades, diversifying both the economy’s productive activities and exporters’
markets. The volume of non-oil exports has more than doubled during the 1993-2008
period, while the volume of oil exports has only increased 60 percent. Also, the number
of markets representing 75 percent of total non-oil exports increased from 4 in 1990 to 11
in 2008.
Ecuador’s growth has been sluggish over the past few years. Oil has been one of the
main drivers of the Ecuadorian economy. Despite the recent favorable terms of trade,
Ecuador grew slower than other natural resource dependent countries and than its
potential. The literature cites that countries may not growth as others if the country has
fallen into one of the main pitfalls of natural resource dependence: i) Macroeconomic
volatility and Populist Macroeconomic Management, ii) Institutional Development and
Political Economy, and iii) “Dutch Disease” (See Ahren 2006). This chapter explores two
of these pitfalls and we didn’t find any evidence that Ecuador suffers from “Dutch
disease”- one of the pitfalls- but we find that it suffers from macroeconomic volatility
when the country has a high degree of export concentration. This implies that Ecuador
can either take export concentration as a given and attempt to mitigate against it by
adopting appropriate macroeconomic policy, or they can adopt economic policies that
support the growth of the non-oil tradable sector.
A weak relationship between the oil and non-oil sectors helps explain why we find no
convincing evidence of long-run Dutch disease in Ecuador. Employment in the oil sector
remains marginal and highly specialized, and so oil and other primary sectors do not
compete for labor. Faster growth in the oil sector has had a limited impact on industrial
sector activity but could boost services, especially for some closely related sectors, such
as transportation, construction, or finance, especially insurance. 19
Thus, while there may
be some short term relationships between oil and other sectors, the evidence is lacking for
a long-term negative relationship that would suggest a “Dutch disease.” These questions
will be discussed more fully in Chapters 2 and 3.
19
As a result of cointegration analysis, there appears to be positive long-term and broadly stable
relationship between the oil and financial sectors.

18

19
2. THE OIL SECTOR
Oil is the country’s single most important export in the past four decades, however
Ecuador’s economy is gradually diversifying. This chapter explores Ecuador’s oil sector.
How has it contributed to overall economic growth? Has the legal and regulatory
environment helped or hindered development of the sector’s potential? How has the
country made use of the large fiscal revenues flowing from this important commodity?
To help answer these questions, this chapter provides an overview of oil sector activities.
Section 2.1 describes trends for oil production and growth. Section 2.2 looks at the
sector’s legal and regulatory environment. Section 2.3 examines the sector’s direct
linkages to other economic activities. Section 2.4 covers fiscal matters relating to the
sector. Section 2.5 considers the growth potential for Ecuador’s oil sector. Section 2.6
offers some conclusions and policy recommendations.
2.1 OIL SECTOR OVERVIEW
The oil sector’s share of nominal GDP increased from 7 percent in 1995 to 18 percent in
2008. The expansion allowed oil to contribute a growing share of public sector revenues,
which financed spending in diverse economic sectors, such as public services and
construction. However, the oil sector’s real growth was slower than the non-oil tradable
and non-tradable sectors and GDP (1 percent vs. 3.3 percent). Oil’s real growth all
occurred in the early 1990s, when private oil companies were expanding, and in 2003-
2004, when the private sector constructed the Oleoducto de Crudos Pesados (OCP). This
pipeline, designed to carry heavy oil, was the only large investment in the oil sector after
the 1970s. In addition, the increase in the oil sector’s share of nominal GDP since 2005
was because of higher oil prices.
Despite Ecuador’s diversification, oil still has a significant bearing on GDP. The years of
high and low real growth coincide for the oil sector and GDP. Indeed, large oil sector
investments that led to higher production had direct positive impacts on the overall
economy. Most notable, the economy’s 8 percent real growth in 2004 was largely fueled
by the oil sector’s 35 percent real growth from the new pipeline (see Figure 2.1).

20
Figure 2.1. Annual Growth of real GDP and of oil output, 1994–2007
Source: Banco Central de Ecuador.
Structure
The producing, importing, and selling of oil and its derivatives in Ecuador is controlled
entirely by Petroecuador, a state company. The Petroproducción division is charged with
oil industry exploration, production, and commercialization. Some private companies
pump crude oil, operating in the smaller fields that produce heavy crude oil. Petroecuador
controls the largest oil fields, which produce the easier to refine light sweet crude oil.
Ecuador’s oil is produced mainly in the Amazon region, although some fields are in
Santa Elena province and in the Gulf of Guayaquil in the Pacific Ocean. Most of
Petroecuador’s technology dates from the early 1990s; its fields are producing less, and
its operations are not up to current environmental standards. Private companies employ
more modern technology and obtain increasing returns from their fields, with lower
environmental impact. The country’s oil reserves are relatively unexplored, suggesting a
clear potential to expand production, a point made by Espinasa (2007).20
20
The Ecuadorian society presents a social fragmentation between some social groups (mestizos vs.
indigenous and afro Ecuadorians), and between geographical regions (Costa vs. Sierra and Quito vs.
Guayaquil), which is especially reflected between urban and rural areas. For instance, poverty levels in
rural areas—in general, with a much larger proportion of indigenous population--almost double the
corresponding levels in urban areas (about 40%). Such differences must be considered when analyzing the
oil sector, as indigenous communities in the Amazon region, which includes some of the poorest areas in
-15.0%
-10.0%
-5.0%
0.0%
5.0%
10.0%
15.0%
20.0%
25.0%
30.0%
35.0%
40.0%
1994 1995 1996 1997 1998 1999 2000 2001 2002 2003 2004 2005 2006 2007
Oil Sector GDP

21
Two major pipelines move the oil to market. The state-owned Sistema de Oleoducto
Transecuatoriano (SOTE), built in the 1970s, has a capacity of 400,000 barrels per day,
manual operation, and antiquated mechanical technology. The privately owned OCP,
built in 2003, has a capacity of 450,000 barrels per day, automatic operation, and current
technology.
Ecuador’s main refinery and export facilities are in the Esmeraldas province on the
northern coast. The three refineries lack modern processing technology and are not able
to satisfy the country’s demand for oil derivatives, especially fuels and household gas.
Production
The volume of Ecuador’s oil production has increased slowly in recent years, despite
reserve levels high enough to support more production. The sluggish growth reflects a
combination of underinvestment, technological limitations, governance issues at
Petroecuador, and unstable contract relations with private oil companies. Meanwhile, oil
export revenues have mainly reflected international price fluctuations, and oil derivatives
have represented a growing share of imports. Nonetheless, Ecuador has remained a net
oil exporter.
From 1993 to 2008, total oil production increased 47 percent, going from 125 to 184
million barrels—but output has stagnated in recent years (see Figure 2.2). In 2007,
production was 520,000 barrels per day (b/d)—but other oil-producing countries broadly
similar to Ecuador in reserves have larger production volumes. The United Kingdom
produced 1,636,000 b/d, Argentina 698,000 b/d, and Oman 718,000 b/d. Colombia,
which has a partly state-owned oil company and slightly lower reserves than Ecuador,
produced 561,000 b/d in 2007. Ecuador’s stagnation of crude oil production in recent
years reflects insufficient investment to maintain Petroecuador’s existing oil fields, drill
new fields, and explore for reserves. Exploration for new reserves has not taken place for
almost 10 years.
the country, look after specific compensation from oil companies to allow them to operate in the area,
mostly in terms of public services development (roads or infrastructure) in order to fulfill the limited
service provision by the State.
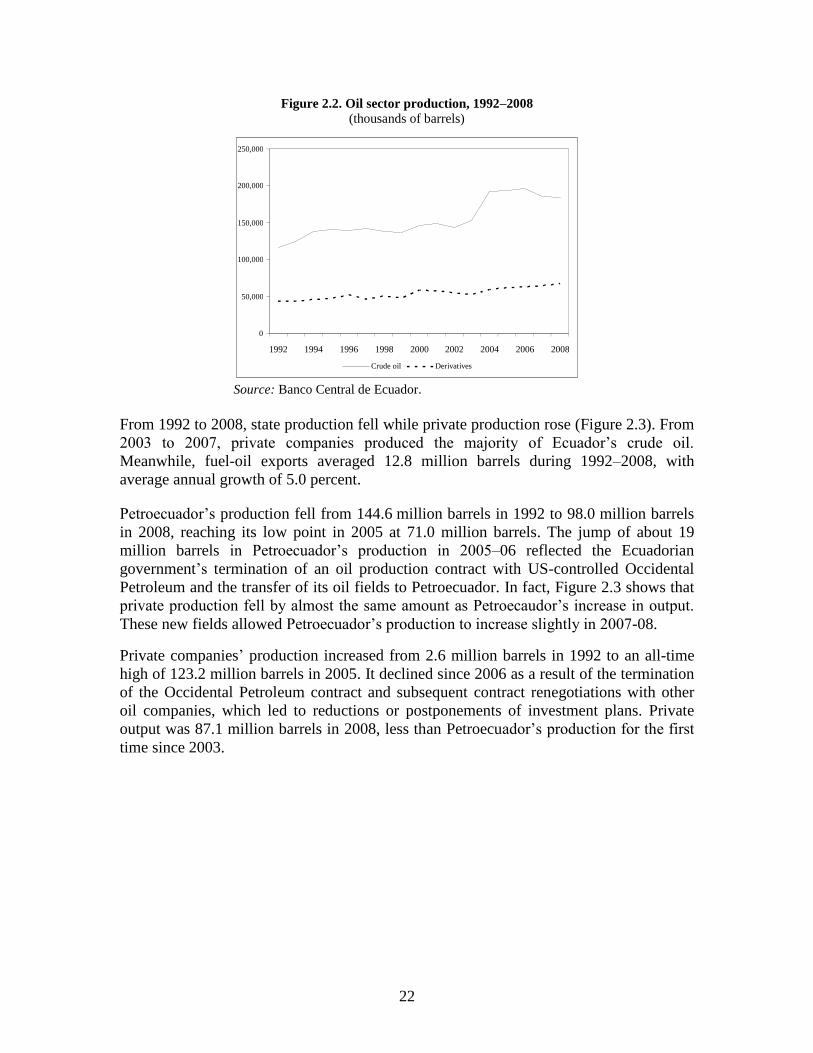
22
Figure 2.2. Oil sector production, 1992–2008
(thousands of barrels)
Source: Banco Central de Ecuador.
From 1992 to 2008, state production fell while private production rose (Figure 2.3). From
2003 to 2007, private companies produced the majority of Ecuador’s crude oil.
Meanwhile, fuel-oil exports averaged 12.8 million barrels during 1992–2008, with
average annual growth of 5.0 percent.
Petroecuador’s production fell from 144.6 million barrels in 1992 to 98.0 million barrels
in 2008, reaching its low point in 2005 at 71.0 million barrels. The jump of about 19
million barrels in Petroecuador’s production in 2005–06 reflected the Ecuadorian
government’s termination of an oil production contract with US-controlled Occidental
Petroleum and the transfer of its oil fields to Petroecuador. In fact, Figure 2.3 shows that
private production fell by almost the same amount as Petroecaudor’s increase in output.
These new fields allowed Petroecuador’s production to increase slightly in 2007-08.
Private companies’ production increased from 2.6 million barrels in 1992 to an all-time
high of 123.2 million barrels in 2005. It declined since 2006 as a result of the termination
of the Occidental Petroleum contract and subsequent contract renegotiations with other
oil companies, which led to reductions or postponements of investment plans. Private
output was 87.1 million barrels in 2008, less than Petroecuador’s production for the first
time since 2003.
0
50,000
100,000
150,000
200,000
250,000
1992 1994 1996 1998 2000 2002 2004 2006 2008 Crude oil Derivatives

23
Figure 2.3. Crude oil production, by type of company, 1992–2008
(thousands of barrels)
Source: Banco Central de Ecuador.
Ecuador’s output of oil derivatives is growing, going from 43.3 million barrels in 1992 to
67.6 million barrels in 2008, a growth rate of 55.9 percent. The production of oil
derivatives depends on imports of high-octane gasoline to mix with the domestic inputs,
which lowers the aggregate value added of this subsector.
Oil exports
Oil exports represented about 20 percent of GDP in 2008. Measured in free on board
(FOB) prices, the dollar value of Ecuador’s oil exports grew from US$ 2.4 billion in 2003
to US$10.6 billion in 2008, following the trend of West Texas Intermediate (WTI) prices
(see Figure 2.4). The volume of oil increased significantly in 2004 due to the OCP, but it
has remained almost flat since then. Therefore, the increase in exports’ value can be
attributed to rising oil prices and the jump in private companies’ production s from 2003
to 2004. The OCP allowed the companies to transport more heavy oil, the production of
which was formerly constrained by transport capacity.
0
20,000
40,000
60,000
80,000
100,000
120,000
140,000
1992 1994 1996 1998 2000 2002 2004 2006 2008
Petroecuador Private Companies

24
Figure 2.4. Oil sector export values and world prices, 1990–2008
Source: Banco Central de Ecuador.
Oil derivative imports
Oil derivative imports, which consist mainly of high-octane gasoline and lubricants, rose
from an average of US$213 million a year in 1990–2002 to US$2.1 billion in 2003–08
(see Figure 2.5). The share of oil derivatives in total imports increased from an average of
5 percent in 1990–2002 to 17 percent in 2003–08.
The rise in the value of oil derivative imports is due mainly to increases in oil prices since
2003 and Ecuador’s policy of subsidizing local fuel prices. Keeping local prices
substantially below international prices has boosted demand for fuel for many uses—
including generation of electricity and smuggling to neighboring countries. Fuel subsidies
represent on average 4.4 percent of GDP, almost double what Ecuador spends in
education.
0.00
20.00
40.00
60.00
80.00
100.00
120.00
0.00
2,000.00
4,000.00
6,000.00
8,000.00
10,000.00
12,000.00
1990 1992 1994 1996 1998 2000 2002 2004 2006 2008
US
Do
llars
pe
r b
arre
l
Tho
usa
nd
s o
f U
S D
olla
rs,
FOB
Oil Sector Exports
Oil WTI Average Price ($ right scale)

25
Figure 2.5. Imports of oil derivatives, 1990–2008
(millions of US$, including cost, insurance, and freight)
Source: Banco Central de Ecuador.
Petroecuador
Several factors contribute to Petroecuador’s poor performance in discovering new fields
and exploiting existing ones—technology, availability of investment funds, and corporate
governance. Obsolete technology has been a major constraint on production. Most of the
company’s technology dates from the early 1990s, when Texaco operated Petroecuador’s
oil fields. Production relies on vertical oil wells spaced throughout the fields, requiring a
series of access roads and secondary pipes to link wells with a central station and the
main pipelines. In contrast, private companies generally use more modern technology,
such as horizontally drilled wells that are capable of covering a whole field from a single
location, where the oil can be pumped into the main pipeline. Such technology is more
efficient, less costly, and more environmentally responsible than Petroecuador’s methods
(Albornoz, Cueva, and Gordillo 2006).
When Texaco started production in the late 1970s and 1980s, the technology in use relied
on high underground water pressure to push oil up the wells. As water pressure declined
over time, each well’s yield decreased. Today’s third-generation technology for oil
recovery could restore the Petroecuador fields’ production volumes—but it would require
large new investments.
Petroecuador’s low investment levels result partly from financing constraints -including
the need to subsidize imports of derivatives- and partly from weak corporate governance.
Ecuador’s ongoing political instability has brought abrupt changes in Petroecuador’s
management—not surprising, perhaps, given the oil sector’s importance in generating
fiscal revenues. In 1998–2008, Petroecuador has had 18 CEOs, including two navy
officers in the past two years. From November 2007 to early 2010, President Correa put
the Navy in charge of Petroecuador, with the objective to reduce corruption and enhance
the company’s efficiency. The instability over the past ten years has had a negative effect
on continuity, including investment policies. It has allowed certain interests—among
0
500
1,000
1,500
2,000
2,500
3,000
3,500
4,000
1990 1992 1994 1996 1998 2000 2002 2004 2006 2008

26
them, suppliers, a cartel that buys crude oil and sells derivatives, and unions—to exert
excessive influence over the company’s decision-making process, fueling rent-seeking
behavior. All of these issues translate into lack of transparency and weak accountability.
The Ministry of Mines and Petroleum now recognizes that Petroecuador’s inefficiencies
have brought the company to the brink of collapse.21
Private firms
In the past two decades, private companies have done most of the investment in
Ecuador’s oil sector (see Figure 2.6). In 1994–2004, private companies’ investment was
eight times Petroecuador’s annual average of US$100 million. The investment gap helps
explain why private production grew consistently while Petroecuador’s output declined
from 1994 to 2005, when the government terminated Occidental Petroleum’s contract.
Figure 2.6. Oil sector investment, 1993–2004
Source: Espinasa 2007.
On average, the oil sector represented 67 percent of total foreign direct investment (FDI)
in Ecuador until 2005. Oil as a share of FDI increased to 95 percent in 2000; afterward, it
declined to 46 percent in 2004. The decline in oil FDI registered during the 2001-2003
period was related to a local subsidiary’s decision to finance investment with credits with
its foreign headquarters. As a result, total investment in the oil sector increased during
this period, while oil FDI declined. Since 2005, however, legal and contract instability
severely limited oil sector FDI, which even turned negative in 2006 (-US$116 million)
and 2007 (-US$122 million) as foreign companies started to liquidate their assets in
Ecuador. In 2008, the oil sector’s FDI recovered to US$161 million, equivalent to 28
percent of total FDI, which coincides with the entrance of some Chinese oil companies
(see Figure 2.7).
21
Ministerio de Minas y Petróleos de Ecuador (2008).
Oil Sector Investment PE & PC (M$) 1993-2004
0 200 400 600 800
1000 1200 1400
1993 1994 1995 1996 1997 1998 1999 2000 2001 2002 2003 2004
Private companies (M$)
Petroecuador (M$)

27
Figure 2.7. Foreign direct investment, 1993–2007
Source: Banco Central de Ecuador.
2.2 REGULATIONS AND CONTRACTS FOR OIL ACTIVITIES
The way the government has worked with private contractors and organized
Petroecuador’s activities has contributed to the stagnation of oil production. Laws have
been written and contracts have been negotiated to regulate oil exploration, development,
and production and to define the payment of taxes and royalties to the government. A key
aspect of the process has been the relationship between the Ecuadorian state and foreign
oil companies.
Until 1973, the oil sector had been treated as part of the general mining sector and
followed rules established in the Ley de Minas. Oil production in the new Amazon fields
started just before a period of high prices in the 1970s and early 1980s, and foreign
investment in exploration and extraction accounted for almost all oil-output growth. The
oil sector’s sudden importance prompted the first sector-specific law—the Ley de
Hidrocarburos (1973). It created a state company dedicated to the oil sector, the
Corporación Estatal Petrolera Ecuatoriana (CEPE), which subsequently became
Petroecuador. The company had two main objectives: to manage the relationship of the
state with the foreign oil companies and to explore, develop, produce, and sell oil and its
derivatives. After 1973, oil contracts have been signed by Petroecuador, not by the
Ecuadorian government. Since 2008, the government has been trying to reform the law to
allow the government to sign contracts directly and to make Petroecuador like any other
company.
Originally, the Ley de Hidrocarburos defined two types of contracts with foreign
companies—association contracts and mixed-economy companies. Subsequent reforms
have created other types of arrangements.
- 200 0
200 400 600 800
1000 1200 1400 1600
1993 1994 1995 1996 1997 1998 1999 2000 2001 2002 2003 2004 2005 2006 2007 2008
Millions of Dollars
FDI FDI Non Oil FDI Oil

28
Association contracts. CEPE provided the oil fields and the company covered all
necessary investments. The company accepted all of the exploration risks, and CEPE and
the company shared price and production risks in proportions established in the contract.
This is a common and effective arrangement in many countries. In Ecuador, this was the
most popular type of contract during the 1970s. Currently, there are no association
contracts because the government disapproves of them.
Mixed-economy companies. CEPE was authorized to form new companies for the
exploration, development, and production of oil fields in partnership with foreign entities
that have legal representation in Ecuador. This type of incorporated joint venture is
common and effective in many countries. Since 1993, when the contract with Texaco
expired, there have been no mixed-economy contracts in Ecuador.
Service-provider contracts. During the 1970s, market conditions made the original types
of contracts unattractive to foreign firms. A 1982 reform changed the law to include
service-provider contracts, under which CEPE owned the entire production after covering
production costs and a private company profit margin not linked to oil prices. On one
hand, CEPE took all price risk, upside and downside. On the other hand, the private
company carried all of the exploration risks; that is, it covered all exploration expenses,
even if the field turned out to be commercially viable. CEPE determined whether a field
was commercially viable, which allowed the government to pursue expropriation without
compensation.
With service contracts, CEPE allocated some oil fields to foreign companies during the
1980s and the early 1990s. Investors found these contracts attractive because they
eliminated the risk from low oil prices. However, this period’s low oil prices meant
CEPE’s revenues were low. In 1993, the government eliminated the state’s exposure to
price and other risks, passing them to the private firms. The government found this
attractive but investors did not. They have to take the risk of oil exploration and accept a
fixed price at a time when market prices have been high. Currently, only one company
(AGIP) has this type of contract.
Production-sharing contracts. When Texaco’s mixed-economy company contract
expired in 1993, CEPE became Petroecuador and took control of the US-based
company’s operating fields. In the same year, reform of the Ley de Hidrocarburos
included production-sharing contracts that assign almost all risks to private companies,
which pay all the costs of exploration, determine the viability of the field’s production,
decide whether to develop and produce the field, and cover the costs of development and
production. Since 1993, most contracts have been of this type.
Petroecuador receives a share of the revenues, determined by the volume of production,
the quality of the oil, provisions of the Ley de Hidrocarburos and contracts with each
company. According to the law, Petroecuador’s shares range from 12.5 percent of
expenses for 0 to 30,000 b/d to 14.5 percent for 30,000 to 60,000 b/d and 18.5 percent for
more than 60,000 b/d. Petroecuador’s share grows with the oil’s American Petroleum
Institute (API) degree of density. The private company receives a larger share of
compensation when the quality of oil is lower on the API scale.

29
Marginal field contracts. In 1993, a special contract form was established for marginal
fields, defined as those with production of less than 1 percent of the national total. These
fields are generally located away from existing pipelines and other fields. Typically, they
are already in production, and Petroecuador looks for a private company to take over,
bring in new technology, and increase production. Petroecuador and the company agree
on baseline production without new investment. Up to the baseline, the arrangement
works as a service-provider contract. When production exceeds the baseline, the contract
converts to a production-sharing deal.
Under these contracts, Petroecuador allocated oil fields to private companies, which
increased their production from 7.5 million barrels in 1993 to 46.0 million barrels in
1999. By then, it became evident that the capacity of SOTE, the state-owned and
operated pipeline, was restricting private production’s growth. Mixing high-quality and
low-quality oil for transport reduced overall revenues. Since Petroecuador was producing
the highest quality oil, it demanded compensation. This led to the construction of the
OCP, a conduit for low-quality heavy oil built entirely by the private companies. The
OCP started operating by end-2003, which enabled private production to rise from 78.0
million barrels in 2003 to 120.4 million barrels in 2004.
In 2003, as international prices for oil started to rise, the Ecuadorian government felt that
it was not getting all the revenues it deserved from oil, especially from private companies
with pre-1999 contracts that did not adjust Petroecuador’s share according to changes in
international prices. In 2005, the government tried to renegotiate these contracts but no
agreement was reached. In May 2006, the government passed Law 42 (Ley 42), which
declared that Petroecuador should receive at least 50 percent of the income from the
difference between current oil prices and the reference prices on the day the contract was
signed.22
In July 2007, Executive Decree 662 modified this share, declaring that
Pertroecuador should get 99 percent of these revenues. This change led to threats of legal
action on behalf of the oil companies, and the share was established as a tax and reduced
to 70 percent in the Ley Reformatoria para la Equidad Tributaria en el Ecuador,
approved by the Constitutional Assembly in December 2007. Under this law, new
negotiations started between Petroecuador and private companies. By April 2008,
agreements had been reached with almost all companies to reform the contracts. The
following are the most important changes:
Adoption of the 70–30 percent rule for extraordinary income related to the difference
between current and reference oil prices.23
This increases the government’s share.
22
Law 42 sets a floor of 50 percent of the extra income for Petroecuador. The actual share is defined by
executive decree. 23
According to the Ley Reformatoria para la Equidad Tributaria, 70 percent of extraordinary income due
to the difference between current and reference prices goes to the government as a tax, while the company
keeps the remaining 30 percent.

30
The reference price would no longer be the level in effect when the contract was
signed. The new reference price varies by company, depending on the characteristics
of the extracted oil. This measure effectively adjusts the government’s share back
down, partly counteracting the 70-30 rule.
For resolving conflicts, the competent tribunal changed from the World Bank–based
International Center for Settlement of Investment Disputes (ICSID) to Latin
American–based organizations, such as the Arbitrage Panel of Comisión Económica
para América Latina y el Caribe (CEPAL) in Santiago, Chile.
Contracts were extended through 2017–18, depending on the company.
A new clause signaled the commitment to move from production-sharing contracts
back to service-provider contracts.
Table 2.1 Contract type by company
Company Contract State’s Share*
Petrobell Marginal 51%
Petróleos Sudamericanos Marginal 57%
Petróleos Sudamericanos Marginal 45%
Tecpecuador Marginal 63.4%
AEC Ecuador Production-sharing 30%
AEC Ecuador Production-sharing 21%
Ecuadortlc 18 Production-sharing 50.5%
Occidental** Production-sharing 63.7%
Occidental** Production-sharing 35%
Perenco Production-sharing 30%
Repsol YPF Production-sharing 22%
* The share includes the mandatory share defined by the Law.
** Occidental’s contract was terminated in 2006.
Source: Albornoz, Cueva and Gordillo (2006)
24 Appendix D lists the most important laws and regulations pertaining to the oil sector in Ecuador from
1973 through 2008. New discussions between the government and the private oil firms have been taking
place since December 2008.

31
Overall, Ecuador has revised oil regulations and renegotiated contracts between the state
and private companies frequently. Most contracts did not have clauses to adjust for
potential changes in the sector’s environment and relevant prices, and political decisions
came in response to changes in national and international attitudes. Such volatility has
discouraged investment by foreign companies and reduced the country’s ability to
develop and expand its oil-production capacities.
2.3 THE OIL SECTOR’S LINKAGES TO OTHER ECONOMIC ACTIVITIES
The oil sector is capital intensive, providing only a limited number of jobs. Its share of
total employment was only about 0.25 percent in 2004–07. Since most of their capital
inputs are imported, oil producers make only small purchases from other sectors. To
analyze the direct linkages between the oil and non-oil sectors, we use the input-output
matrixes of Ecuador’s national accounts.25
Main providers of the oil sector’s intermediate consumption
The oil industry’s intermediate inputs come mainly from the two oil subsectors. As a
share of the oil sector’s intermediate consumption in 2000-07, crude oil averaged 50
percent and oil derivatives 20 percent (see Figure 2.8). Other inputs are mainly
nontraded: services provided to businesses (5.5 percent), insurance (2.3 percent),
construction (2.1 percent), and transportation and storage (1.4 percent). The only tradable
inputs are chemical products (3.0 percent) and transportation equipment, including
vehicles (1.8 percent).
The oil sector is an important buyer for only a few subsectors of the economy in 2000–
07. The oil sector’s intermediate consumption as a share of the total domestic production
is significant for only five sectors: insurance services (50 percent), crude oil (35 percent),
chemical products (36 percent), oil derivatives (29 percent), and services provided to
businesses (18 percent). Insurance services high share reflects the large risks and scale of
oil activities. By law, Petroecuador must contract insurance services from local
companies, which generally reinsure with foreign companies.26
Other sectors with
25
. This non-econometric approximation reveals direct linkages between the sectors, but fails to consider
spillover effects, which are discussed in Chapter 1 using econometric techniques. We use the input-output
matrixes from 2000 to 2007, measured at 2000 prices, to highlight trends regarding the intermediate
consumption of the oil sector as well as the intermediate consumption of oil products by other sectors. The
matrixes consider 48 productive subsectors (output or “industries,” as they are called in the matrixes) and
61 input categories (“products”). Two of the 48 productive subsectors correspond to the oil sector: oil
extraction and oil refining. Other oil-related activities, such as commercialization and transportation, are
included in other subsectors and are not separable with the available data. Two of the 61 inputs correspond
to the oil sector: crude oil and oil derivatives. Crude oil is produced locally, while oil derivatives are
basically refined and mostly imported oils, although it is not possible to distinguish the products’ origin in
the national accounts. We use the input-output matrixes over 2000–07, measured at 2000 prices, to
highlight trends regarding the intermediate consumption of the oil sector as well as the intermediate
consumption of oil products by other sectors. 26
. According to Albornoz, Cueva, and Gordillo (2006), Petroecuador had 17 insurance contracts in 2006,
covering five areas: oil production assets (US$3.8 billion); civil responsibility damages, including
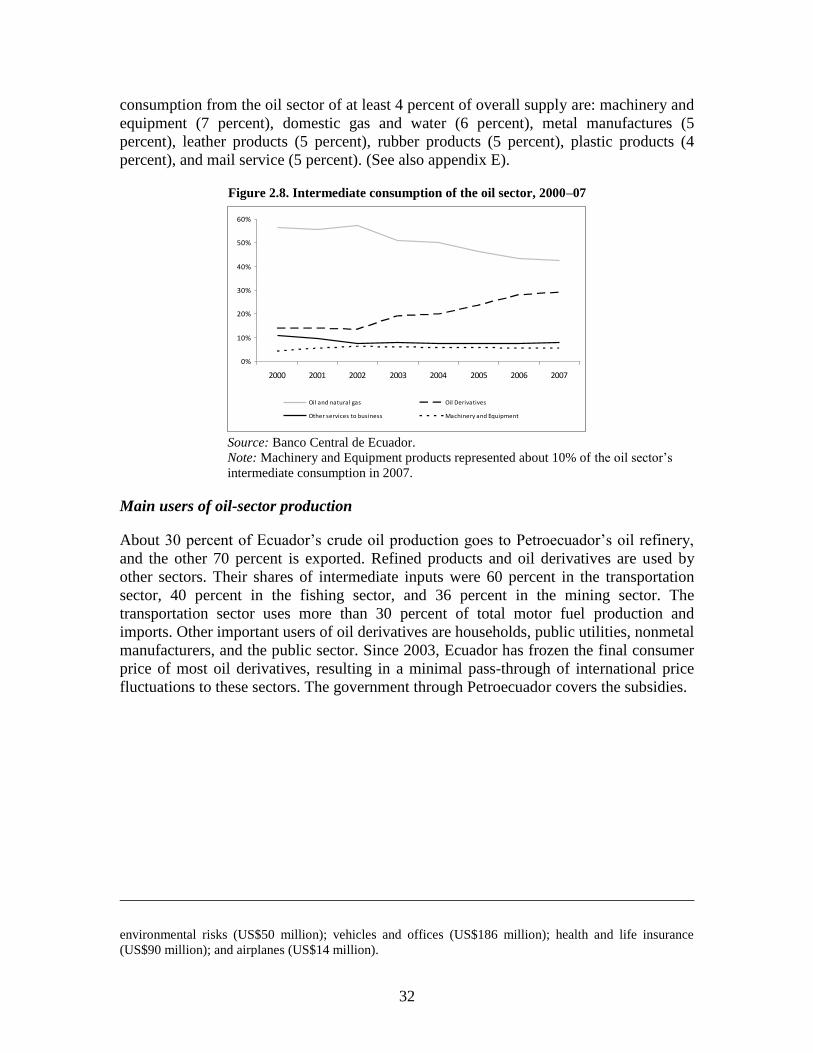
32
consumption from the oil sector of at least 4 percent of overall supply are: machinery and
equipment (7 percent), domestic gas and water (6 percent), metal manufactures (5
percent), leather products (5 percent), rubber products (5 percent), plastic products (4
percent), and mail service (5 percent). (See also appendix E).
Figure 2.8. Intermediate consumption of the oil sector, 2000–07
Source: Banco Central de Ecuador.
Note: Machinery and Equipment products represented about 10% of the oil sector’s
intermediate consumption in 2007.
Main users of oil-sector production
About 30 percent of Ecuador’s crude oil production goes to Petroecuador’s oil refinery,
and the other 70 percent is exported. Refined products and oil derivatives are used by
other sectors. Their shares of intermediate inputs were 60 percent in the transportation
sector, 40 percent in the fishing sector, and 36 percent in the mining sector. The
transportation sector uses more than 30 percent of total motor fuel production and
imports. Other important users of oil derivatives are households, public utilities, nonmetal
manufacturers, and the public sector. Since 2003, Ecuador has frozen the final consumer
price of most oil derivatives, resulting in a minimal pass-through of international price
fluctuations to these sectors. The government through Petroecuador covers the subsidies.
environmental risks (US$50 million); vehicles and offices (US$186 million); health and life insurance
(US$90 million); and airplanes (US$14 million).
0%
10%
20%
30%
40%
50%
60%
2000 2001 2002 2003 2004 2005 2006 2007
Oil and natural gas Oil Derivatives
Other services to business Machinery and Equipment

33
Table 2.2. Intersectoral linkages of the oil sector
On one hand, the oil sector in Ecuador has strong intersectoral linkages with a small
cluster of three industries through its upstream and downstream activities (see Table 2.1).
For only three sectors, the oil sector uses more than 10 percent of their total domestic
supply. For six additional sectors, the oil sector consumption is between 4 and 10 percent
of the sector´s total domestic production. Thus, oil sector activities, in terms of buying
output from other sectors, resemble an enclave. Thus, faster growth in the oil sector has a
limited impact on industrial growth but could boost growth in services, especially
insurance activities. On the other hand, the sector’s direct contribution to employment is
marginal and its labor is highly specialized, limiting labor mobility from the oil sector to
other activities and vice versa. This implies weak linkages between the oil sector and the
rest of the economy in terms of competing for production factors. As a result, oil
activities interact with other areas largely through the fiscal arena, via spending.
2.4 FISCAL POLICY AND THE ENERGY SECTOR
Oil has been an important component of Ecuador’s fiscal revenues since the early 1970.
Fluctuations in the international price of oil have been critical drivers of public spending,
and oil revenues have had major impacts on Ecuador’s overall fiscal trends, their pro-
cyclicality, oil-related subsidies, and the allocation and quality of public expenditures.
This section will discuss the dimensions that are particular to the energy sector, including
oil, and the next chapter will cover the issues that pertain more to overall public finances.
Data availability limits this section to 1990-2008. In this period, high oil prices have
fueled public spending, providing a lift to public services and construction.
Oil Revenue
Ecuador’s oil revenues grew slower than GDP in the late 1990s and early in this decade;
from 2003 to 2008, it grew rapidly (see Table 2.3). Revenue increases since 2005 were
all due to rising prices; actual quantities of oil production declined.
Upstream Downstream
Sectors for which more than 10% of total domestic production is used by the oil sector
Chemical products Insurance
Services provided to businesses
Sectors for which 4-10% of total domestic production is used by the oil sector
Insurance Machinery and Equipment
Domestic gas and water
Metallic manufactures
Leather productions
Rubber products
Plastic products

34
Table 2.3. Non-Financial Public sector revenue in Ecuador, 1990–2008
(US$ and % of GDP)
Source: Banco Central de Ecuador.
Most oil revenue comes from Petroecuador’s exports and from arrangements specified in
individual contracts with firms developing Ecuador’s fields discussed above. About 25
fields are currently producing, 20 of which were explored and are now being exploited by
private firms with contracts that give the state a share of gross production via
Petroecuador.
All companies have to pay income tax on their profits, which for exploration and
production firms in the oil sector means the proceeds from the sale of oil minus costs of
production. The corporate income tax standard rate is 25 percent; the top personal income
tax rate was raised in 2007 from 25 percent to 35 percent. Companies are also required to
distribute 15 percent of their annual net income to their workers.27
Contract terms determine the incentive effects of tax and contract arrangements. These
terms are set in one-on-one bargaining—not in competitive auctions—so we cannot
determine whether they favor oil over other sectors in Ecuador. The 2006 change in the
law probably discouraged the private sector’s expansion in response to price increases—
by raising the state’s share and by showing that the state might unilaterally change
contracts to take advantage of windfalls.
Off-budget subsidies and the linkage between oil and electricity
Petroecuador has had a monopoly on domestic sales of refined oil products at various
times, including now. It has controlled prices. The company has some refining capacity,
but not enough to meet domestic demand, so it imports a growing share of refined
products. Until 2005, Petroecuador sold its own production and booked a profit that was
counted in government revenues (see Table 2.2). Government data did not report either
the opportunity cost of not selling oil at world market prices or the cost of using its own
crude oil to supply the refinery instead of exporting it at international prices.
27
. Ley Reformatoria para la Equidad Tributaria del Ecuador, Article 96, Registro Oficial no. 242,
December 29, 2007. Besides the corporate income tax, firms have to pay 15 percent of profits into workers
pension funds, as discussed in Chapter 3. This payment, like the royalties, is not creditable for US firms
against their US tax obligation.
1990-94 1995-99 2000-01 2002-03 2004-05 2006 2007 2008
Total revenue (US$) 3,366 4,348 4,540 6,636 8,661 11,263 13,451 20,781
Total expenditure (US$) 3,379 4,978 4,418 6,374 8,186 9,928 12,554 21,458
Overall Balance— US$ -13 -630 122 262 475 1,335 897 -677
Non- Oil Overall Balance -1,602 -2,164 -1,458 -1,398 -1,830 -1,588 -3,017 -10,323
Total revenue --% GDP 25.0 20.7 24.6 24.9 24.8 27.0 29.5 39.5
Oil revenue 11.8 7.3 8.5 6.2 6.6 7.0 8.5 17.6
Exports 6.8 3.2 6.3 3.9 5.4 7.7 7.2 16.9
Sale of products 2.2 2.7 1.5 1.8 0.8 0.0 0.0 0.0
Public enterp. Surplus (PetroEcuador) 2.8 1.4 0.7 0.5 0.4 -0.7 1.3 0.7
Non oil revenue 13.2 13.4 16.1 18.7 18.2 20.0 20.9 21.9

35
Box 2.1. International oil prices, local derivative prices, and subsidies
In 2004-08, international oil prices trended upwards on strong global growth and rising demand for natural
resources, especially from Asian countries. Ecuador benefited, its average crude oil price rising from
US$30 per gallon in 2004 to US$83.30 per gallon in 2008 (see chart at left).
Due to the lower quality of its crude, Ecuador sells at a discount compared to the WTI price. According to
BCE data, the price differential between Ecuador’s oil and the WTI averaged US$5.20 per barrel in1998-
2004. The differential has seen some very large changes in short periods of time, which seem hard to
explain in the absence of sudden and large changes in the quality of Ecuador’s crude oil or the other
relevant factors.
International oil derivative prices grew in parallel with oil crude prices, pushing up subsidies because
domestic fuel prices have remained frozen since mid-2003 (see chart at right). This policy and its related
incentives has boosted the demand for oil derivatives, particularly from high-income families (through
increased gas and LPG consumption for recreational activities), industries (that have migrated to subsidized
energy for several needs), and smuggling activities to neighbor countries. The additional demand for oil
derivatives has led to a faster growth of the overall oil subsidy than that of oil prices.
Source: BCE
Starting in 2003, Petroecuador had to subsidize the international purchase of products for
domestic sale, including private consumption, transportation, and electric generation. In
2004, fuel subsidies were about 2.9 percent of GDP, and they jumped to about 6.6
percent in 2007 and about 8.3 percent in 2008 (See Table 2.4). By the oil price boom’s
peak, these subsidies for imported products were costing about half of the fiscal revenue
from crude oil export. This subsidy does not appear directly in the budget; nevertheless, it
is a drain of resources that could have been used for new exploration or construction of
refining capacity.
Table 2.4. Fuel Subsidies, 2001–08
Susidy 2001 2002 2003 2004 2005 2006 2007 2008 (P)
Fuel Subsidies (US$ Million) 650 387 500 962 1,868 2,602 3,036 4,522
Fuel Subsidies (% of GDP) 3.1% 1.6% 1.7% 2.9% 5.0% 6.2% 6.6% 8.3%
Source: IMF, Hurtado (2009)
Hurtado, Felipe, 2009, 30 años de subsidios, Carta Económica, CORDES 10
Ecuador is heavily dependent on thermal electricity generation plants that burn oil fuels.
Oil derivatives, mainly diesel, represent about 20 percent of all inputs used to generate
electricity. Table 2.5 presents an approximate calculation of diesel subsidies for
electricity generation. In dollar terms, they rose markedly with the high international oil
prices in 2007-08. However, electricity generation has represented a declining share of
0
500
1000
1500
2000
0
20
40
60
80
100
120
2004 2005 2006 2007 2008
Mill
ion
s o
f d
olla
rs
Do
llars
Oil Price and Direct Subsidy Dynamics
WTI Price Ecuador crude price Direct Subsidy (right scale)
020
40
60
80
100
120
140
160
0.00
0.50
1.00
1.50
2.00
Jan
-00
Jul-
00
Jan
-01
Jul-
01
Jan
-02
Jul-
02
Jan
-03
Jul-
03
Jan
-04
Jul-
04
Jan
-05
Jul-
05
Jan
-06
Jul-
06
Jan
-07
Jul-
07
Jan
-08
Jul-
08
Jan
-09
Jul-
09
Do
llars
pe
r b
arre
l
Do
llars
pe
r ga
llon
Domestic Fuel Prices at Distribution Terminal
WTI price (right scale) Super Gasoline
Extra Gasoline Diesel

36
the total diesel subsidy partly because of the growing use of diesel for other purposes,
such as transportation, since 2004. At the same time, thermal electricity’s share of
electricity generation declined due to favorable weather conditions and some investments
that increased hydroelectric capacity—for example, a new hydroelectric plant in San
Francisco.
Table 2.5 Impact of Diesel Consumption for Electric Generation on Total Diesel Subsidy
Year Diesel (barrel)
Subsidy for Electric
Generation (in millions
of dollars)
Total Diesel Subsidy (in
millions of dollars)
% Of Total Diesel
Subsidy
2004 2,197,610 28.5 71.8 40%
2005 2,872,300 112.6 318.3 35%
2006 3,873,311 171.0 499.9 34%
2007 3,933,244 201.7 607.3 33%
2008 3,007,377 252.7 937.5 27%
Source: CONELEC, BCE, authors’ calculations
The subsidies do not mean bargain electricity for Ecuadorians. As a result of
inefficiencies, Ecuador’s electricity tariffs remain high for Latin America (see Table 2.6).
Table 2.6 Electric Tariffs in Latin America – 2006
US$ cent/kWh
Country Residential Commercial Industrial
Brazil 19.06 16.64 12.37
Nicaragua 17.13 21.42 16.61
Uruguay 15.61 10.44 6.49
El Salvador 14.34 14.54 14.00
Chile 13.06 13.98 8.53
Panama 12.71 12.43 10.36
Ecuador 12.50 11.00 9.56
Peru 12.40 10.02 7.31
Guatemala 11.79 11.57 11.21
Argentina 9.72 6.30 6.40
Colombia 9.12 10.95 8.40
Costa Rica 8.06 10.46 8.41
Honduras 7.76 12.84 10.40
Mexico 7.65 19.50 10.06
Bolivia 6.72 10.14 4.68
Paraguay 6.17 8.58 4.14
Venezuela 4.50 4.02 3.17
Average 12.62 13.21 10.41
Source: OLADE
37
In June 2007, the government established a cross-subsidy in which households with high
electricity usage subsidize households with monthly consumption below 100 kilowatt-
hours (kWh) in the highlands or 130 kWh in the coastlands. Subsidized families pay
US$0.04 per kWh. In July 2008, the Constitutional Assembly replaced an incremental
marginal cost scheme in the wholesale tariff regime with a system of an average flat tariff
of US$0.0838 per kWh. The aim was to lower electricity costs for the industrial,
commercial and residential sectors. However, this could worsen the utility companies’
existing debt with electricity generation firms, and the generating companies’ debt with
Petroecuador. At the same time, this policy promotes a more intensive use of electricity
from generation utilities with high marginal costs (thermoelectric production). The main
problem of inefficiencies and distorted prices sending the wrong incentives has not been
fixed. A more structural solution would imply developing more hydroelectric generation
projects involving lower marginal costs. The current administration has taken some steps
in this direction: a new hydroelectric plant started operations in 2007, another one is
expected to start operations as soon as its reservoir fills up, and the government is looking
for financing for three additional plants.
Subsidies’ persistence
From an equity perspective, the subsidies are problematic because the rich consume a
large share of fuels and liquefied petroleum gas (LPG). SIISE-STFS (2003) and World
Bank-IADB (2004) show that 85 percent of the gasoline subsidy benefits the richest
quintile of the population. The LPG subsidy’s benefit is five times higher for the richest
quintile than the poorest quintile. More recently, Hurtado (2008) showed that the richest
quintile consumed 43 percent of Ecuador’s fuel in 2007, while the poorest quintile used
only 7 percent. In monetary terms, the benefit for an average family in the richest quintile
was US$1,053 in 2007; a family in the poorest quintile only received US$173. Given
these inequities, maintaining the subsidies does not appear to be justified. In 2008,
government health and education expenditures represented about 4 percent of GDP, while
the fuel subsidies amounted to 8.3 percent of GDP. Thus, eliminating or improving the
targeting of fuel subsidies could free up fiscal resources to increase expenditure in areas
with higher social impact while maintaining fiscal stability.
On several occasions, previous governments have attempted to partly lift or better target
fuel subsidies, which would imply significant price increases. Not surprisingly, the issue
is politically sensitive because the vocal middle classes benefit from a large share of fuel
subsidies. In addition, designing well-targeted subsidies to compensate part of the
population for a potential lifting of fuel subsidies is a complex task.
Lifting oil subsidies would imply confronting the issue of indirect subsidies to thermal
electricity generation, an industry backed by a strong lobby with regional interests.
Several local electricity distributors suffer from weak governance, excess personnel, and
weak collection processes. These problems have translated into growing debts to the
generation companies, estimated at US$1.5 billion in 2006. In turn, the generators owe
about US$500 million to Petroecuador for diesel purchases. From a political economy
perspective, groups benefiting from local utilities’ weak governance have added their
voice to those rejecting any move on fuel subsidies.

38
The arguments for lifting non-targeted subsidies for efficiency and equity considerations
have not been able to overcome the political power of diverse coalitions that either
benefit from the status quo or think they do. Attempts to reduce or eliminate subsidies
face opposition and protests from the transportation sector, the electricity generation and
distribution sector, and the middle and low-income classes—with de facto support from
other groups, such as those engaged in large scale smuggling to neighbor countries.
Stabilization funds for oil revenues
Like many commodity exporters, Ecuador has tried a variety of stabilization funds over
the 2000-2006 period (see Table 2.7). After the 1998-99 crisis, the country started to
recover in 2000. Oil prices also started to increase in 2000, translating into higher fiscal
revenues. Cueva (2008) argues that improved fiscal conditions were one of several
factors that explain the emergence of the political will to establish these funds. The others
were constraints on access to market financing, limits to fiscal financing related to
dollarization, and some awareness of fiscal responsibility’s importance after the crisis.
Table 2.7. Oil-related stabilization funds in Ecuador in place until 2007
Stabilization Fund (date of
establishment)
Source of stabilization
funds Use of stabilization funds
FEP (2000): Oil Stabilization
Fund
Originally (until 2002), 45
percent of oil revenues above
those in the annual budget
Cover fluctuations in net oil revenue; in
2007–08, covered the subsidy for
imported oil derivatives
CEREPS (2005): Special
Account for Social and
Productive Investment,
Scientific Development and
Fiscal Stabilization (formerly
FEIREP, 2002–05)
State revenue from heavy
crude oil production and 45
percent of oil revenues above
those in the annual budget,
and after earmarks for
regional projects
Low-interest credit lines, old debt to
social security, debt buybacks,
infrastructure projects, social
investment, research and development,
roads, environment, stabilization of oil
revenues, and emergencies
FAC (2005): Fund for
Savings and Contingencies
Unused funds from CEREPS Cover shortfalls in oil revenues;
emergency spending
FEISEH (2006): Energy and
Hydrocarbon Investment
Fund
All net oil revenues from the
Bloque 15 field, formerly
operated by Occidental
Petroleum
27 percent to CEREPS; reimbursement
of Petroecuador costs for Bloque 15,
US$145 million for the budget,
electricity, hydrocarbon investments,
and others
Source: Cueva 2008.
The most recent stabilization vehicle was the Fund for Savings and Contingencies (FAC),
set up in 2005 and managed by the central bank. FAC had an accumulation ceiling of 2.4
percent of GDP (Cueva 2008). Its resources could only be used for revenue stabilization
and emergency spending. Oil-revenue earmarks from both oil funds and the regular
budget included resources for subnational governments. For instance, the first oil fund,
the Oil Stabilization Fund (2000-2007), allocated revenues to road building in the
Amazon region and development projects in border provinces. According to Cueva
(2008), US$0.005 per barrel from service-provision contracts was allocated to
Esmeraldas, Napo, and Sucumbíos provinces, and 2.6 percent of oil revenues from
traditional Petroecuador’s fields was allocated to Esmeraldas province.

39
In April 2008, the oil funds and almost all other oil-revenue earmarks were eliminated
through the Ley Orgánica para la Recuperación del Uso de los Recursos Petroleros del
Estado y Racionalización Administrativa de los Procesos de Endeudamiento. Only the
earmarks for the Amazon Development Fund were maintained, tapping services provided
to Petroecuador at the equivalent of 2.5 percent for national companies and 4.5 percent
for foreign firms.
This law was approved five months before the referendum for the approval of a new
Constitution in a period of extraordinary high oil revenues. In its preamble, the law
mentions the need for flexibility in the use of oil resources to carry out an efficient
economic policy and to promote development. In this context, public expenditure
increased at a 30 percent rate from the first to second quarter of 2008. The bill transferred
all current and future resources from the oil funds to the general budget and replaced all
existing fiscal rules with the sole stipulation that current spending cannot be financed
with revenues arising from public debt operations or oil exports. An important political
consideration was that some funds were initially presented as saving oil resources and
prioritizing them for debt reduction. The message that eliminating the funds would
reduce resources previously earmarked for paying foreign debt and use them to pay the
“historic social debt” proved politically savvy.
Figure 2.9 shows the complexity of the flow of funds existing in Ecuador’s oil sector
until 2007. Since then, the flows are much more straightforward. Most of them go
directly to the general treasury, with the exception of the marginal earmarks for the
Amazon Development Fund.

40
Figure 2.9. Oil sector flow of funds
Source: Cueva 2008.
Even though the current administration suppressed the oil funds, the sudden fall of oil
prices during the second half of 2008, accompanied by a high level of public
expenditures, highlight the need for some mechanism to stabilize the flow of oil revenues
over the medium-term. The country could, for example, employ some market-based
mechanism (hedging) to smooth out the oil price fluctuations, thus stabilizing its revenue
flow. If the country chooses this instrument, it would successfully stabilize the minimum
level of oil revenues the country would receive without eliminating the benefits of higher
prices. However, there are some disadvantages in employing these mechanisms, such as:
i) the money required to purchase the instrument, which is difficult to justify to Congress
and explain to the people and could be politically unpopular, ii) flexibility of action,
which may be legally hampered, and finally iii) a system of check and controls that may

41
not be available for a state company with weak corporate governance (See Mexico’s
experience in Chapter 4). Alternatively, some kind of oil fund could be reinstated, with a
much simpler stipulations for income sources, investments, and earmarking expenditure
than the ones used until 2007. Chile has developed useful experience with respect to
copper revenues (see Box 2.2). In particular, Chile shows how Ecuador could build a
participatory process centered on an independent committee, which could include experts
from diverse ideological and technical perspectives. The committee could help generate
support for a scheme to smooth the volatility of oil-related revenues and ensure a more
stable financing for social expenditure in the medium-term, while bringing a wider social
acceptance to an oil stabilization fund scheme.
Box 2.2. Chile sovereign wealth funds
Since 2006, Chile has had two sovereign wealth funds fueled by copper revenues: the Pension Reserve
Fund (PRF) and the Economic and Social Stabilization Fund (ESSF). Annual expenditures come from
government surpluses, with the aim of reducing vulnerability to short-term fluctuations of copper prices or
export volumes. Chile has a structural fiscal surplus target—0.5 percent of GDP in 2008—and all revenues
above that are directed to the two funds. This provides an automatic adjustment mechanism that allows the
public sector to save during income upswings and draw resources from the ESSF to avoid drastic restraint
on expenditures during downturns (see Ministerio de Finanzas de Chile 2009a, b and c).
Clear rules allocate fiscal revenues to feed the funds. In any year with an excess fiscal surplus, the PRF
receives a capital contribution equivalent to 0.2 to 0.5 percent of GDP. Additional flows up to 0.5 percent
of GDP go to capitalize the central bank. All remaining funds go to the ESSF. The PRF can only be used to
complement financing of pension and social security liabilities. The ESSF may be used to finance fiscal
deficits and pay public debt.
To estimate structural income, the government relies on two separate advisory committees: the Comité
Consultivo del PIB and the Comité Consultivo del Precio del Cobre. The members of these committees are
private experts in their fields, with diverse ideological positions. The Comité Consultivo del PIB provides
an estimation of the trend value of next year’s GDP, excluding the impact of exogenous shocks. The
Comité Consultivo del Precio del Cobre defines copper’s reference price for the following year, taking into
account the expertise of its members and their expectations for the following year. The Ministry of Finance
uses these two inputs to calculate the government’s structural income for following year’s budget.
Finally, a Financial Committee—made up of independent professionals with vast experience in economic
and financial issues—provides advice to the Finance Minister on the funds’ long-term investment policies,
acceptable assets and investments, and the funds’ management and custody.
These committees increase social control over the stabilization funds’ management and its inflows and
outflows as well as helping provide transparency and accountability
2.5. GROWTH POTENTIAL OF THE OIL SECTOR
Even though no new major reserves have been found in the past 18 years, current
reserves will support current production levels for approximately 23 years (see
Table 2.8). Furthermore, Ecuador’s oil sector has the potential to grow. Espinasa (2007)
points out that Ecuador has one of the lowest ratios of production to reserves (4.4 percent
in 2007) among oil-producing countries with broadly similar reserve levels, including the
United Kingdom (16.6 percent), Colombia (13.7 percent), Norway (11.4 percent),

42
Argentina (9.8 percent), and Oman (4.7 percent). Moreover, the ratio of production to
reserves in Ecuador is much higher for private companies (11.4 percent) than for
Petroecuador (1.9 percent), suggesting additional investment could increase substantially
Petroecuador’s current production. Oil transport does not represent a binding constraint
on growth. Both SOTE and OCP are not operating at full capacity: currently, production
is close to 520,000 barrels per day, while the pipelines can carry up to 850,000 barrels per
day, not counting the potential connection to Colombia’s pipelines.
Table 2.8. Estimates of Ecuador oil reserves
Source
Reserves
(million barrels)
Year of
estimation
BP Statistical Review of World Energy 4,300 2007
BP Statistical Review of World Energy 4,500 2006
CIA Fact Book 4,517 2008
OPEC Annual Report 4,664 2006
In view of the potential for increased production, some new investments could be
directed to overhauling Petroecuador’s current oil fields, with total investments adding up
to approximately US$8.6 billion for 2009–20. This alternative has the potential to
generate oil sector growth of 66 percent, which would translate in GDP growth (see
Figure 2.10). New investments of approximately US$11.4 billion for 2009–20 could go
toward developing the ITT oil field (Espinasa, 2007).28
The project would be more
expensive than overhauling existing fields because new infrastructure would be needed to
develop the field and connect it to existing pipelines and storage facilities. This
alternative has the potential to generate oil sector growth of 22 percent.
28
. ITT is a large heavy oil field located in the Yasuní National Park, one of the world’s biodiversity
hotspots. Currently, the Ecuadorian government is campaigning to collect international funds to
compensate Ecuador for a decision to keep the field’s oil in the ground.

43
Figure 2.10. Oil sector investment, 1993–2019
Source: Espinasa 2007.
2.6 CONCLUSIONS AND POLICY RECOMMENDATIONS
Oil activities remain a key sector for Ecuador’s economy—by the size of its related fiscal
revenues, export proceeds, and contribution to GDP. However, potential development of
the sector has been hindered by:
A long-standing tendency to underinvest in the oil sector, coupled with weaknesses in
Petroecuador’s governance, a lack of longer-term planning, and outdated
technology—all of which hurt Ecuador’s ability to exploit its large oil reserves.
A growing dependence on imported oil products for domestic sale, which has been
heightened by the presence of large and untargeted subsidies to consumption of oil
derivatives.
Volatile relations with private companies, characterized by repeated changes in the
legal and regulatory environment and contract renegotiations, have hurt the country´s
ability to develop and expand its production capacities or attract foreign direct
investment.
A marked dependence on oil and vulnerability to fluctuations in international oil
prices, which leads to volatility in oil revenues and weakens public finances while
making them more procyclical.
The lack mechanisms for fiscal stabilization over the medium term and the tendency
to introduce highly complex and hard-to-track earmarking mechanisms for oil-related
revenues.
A coalition of diverse interest groups benefiting one way or another from inefficient
and highly-regressive oil-related subsidies, constraining the governments’ ability to
reform.
0
200
400
600
800
1000
1200
1400
1993 1995 1997 1999 2001 2003 2005 2007 2009 2011 2013 2015 2017 2019
Investment (M$)
CAPACITY EXPANSION ITT
US
$ M
illi
on

44
Because of these factors, Ecuador’s oil sector has failed to realize its potential to support
sustainable output growth and public revenue. To strengthen the oil sector’s contribution
and reduce the country’s vulnerability to external and fiscal shocks, we offer the
following recommendations:
Improve the decision-making processes for oil sector investing, introduce technical
criteria and priorities, and enhance Petroecuador’s transparency and accountability.
Petroecuador’s extractive activities require more investment. To make such
investments effective would require the government to restructure the company, to
enhance its general management, to increase the transparency of its decision making
processes, and to bring more technical expertise to adequately channel the company’s
investment towards the goal of increasing production.
Clearly differentiate between the two roles devoted to Petroecuador since its creation,
e.g. managing the relationship of the state with private oil-producing companies while
being a producing company itself. International experience suggests the need to
separate these tasks to avoid conflicts of interest. The current government has taken
some steps in this direction, as it seeks to strengthen the regulatory faculties of the
Dirección Nacional de Hidrocarburos and as Petroecuador transforms into an oil
producing company.
Design oil contracts that take into account potential variations in prices and the
market environment, with the aim of protecting the public sector interests while
ensuring a longer-term duration of contracts. Recent examples of contracts involving
natural resources with rules-based taxation clauses capturing part of the windfall for
the government include the recent laws in Chile (for copper producing companies)
and in Trinidad and Tobago (for oil and gas activities)..
Replace the existing oil-derivative subsidies with a more focused and well-designed
mechanism, aimed at protecting vulnerable populations while freeing up more
resources to maintain social spending. Achieving this goal will require a careful
unwinding the subsidies to minimize opposition by a coalition of interests.
Design a fiscal stabilization mechanism to provide a cushion against external shocks
or volatility. A key issue would be to ensure a long-lasting scheme, resistant to abrupt
political changes.

45
3. THE NON-OIL TRADABLE SECTOR
The previous chapters showed that Ecuador’s public sector depends heavily on the oil
sector for its revenue and that the main linkages between the country’s oil and non-oil
sectors operate through the public sector, especially fuel subsidies and other government
spending. They also showed that Ecuador’s economic growth will depend upon the
performance of both the oil and non-oil sectors. Chapter 2 focused on the former. This
chapter looks at the latter. How has the non-oil sector contributed to Ecuador’s economic
growth? Has fiscal and trade policy helped or hindered the sector’s potential? Does the
non-oil sector have potential to grow on its own—that is, are the appropriate investment
climate and market conditions in place?
To address these questions, this chapter analyzes Ecuador’s economy outside the oil-
industry. Section 3.1 provides an overview of non-oil tradable sector’s activities,
describing trends for non-oil production and growth. Section 3.2 considers fiscal policy’s
influences on the non-oil sector. Section 3.3 takes up trade agreements, and industrial
policies affecting the development of the non-oil sector. Section 3.4 offers some
conclusions and policy recommendations.
3.1 RECENT EXPERIENCE OF EXPORT GROWTH IN THE NON-OIL SECTOR
Ecuador has three main categories of exports: oil, other primary products (mainly from
agriculture and fishing), and manufacturing. This chapter discusses the latter.
Non-oil primary products
The primary sector can be divided into three main categories: (1) traditional export
products, such as bananas, cocoa, coffee, fish, and shrimp; (2) nontraditional unprocessed
products, such as flowers, broccoli, tropical fruits, and dairy items; and (3) processed
agricultural products, such as cooked and frozen vegetables, heart of palm, fruit pulp, and
vegetable oils.29
One of Ecuador’s comparative advantages stems from its geographic
location and weather—many agricultural products can be produced throughout the year.
The revenues from most primary subsectors are volatile, dependent on international
commodity prices and subject to natural disasters.30
Except for flowers and shrimp, all
primary sectors were hit hard by the El Niño phenomenon in 1997–98. Unlike oil, these
export sectors are almost entirely private sector, with little direct connection to public
revenues, except through general taxation of economic activity and income.
Several primary products—such as roses and other flowers, shrimp, broccoli, heart of
palm, and asparagus—benefited from trade liberalization policies and favorable
29
. Because it involves industrial processing, this subsector is a hybrid of the primary and industrial sectors.
It is listed within the primary sector because its competitive advantage relies on the richness of Ecuador’s
natural resources. 30
. See Appendix F for annual real growth and trends for specific primary products.

46
international prices in the 1990s. All of these products make use of Ecuador’s natural
comparative advantages and require limited industrial processing.
After constituting more than 50 percent of total exports in the 1990s, primary products
have seen their export share fall significantly in recent years. An important factor was
prices rising more slowly for primary exports than for oil. Most primary products have
had positive but declining real growth rates since the 1990s. Trends in average annual
growth rates from the 1990s to the 2000s were 11 percent to 6 percent for bananas; 11
percent to 8 percent for fish and shrimp; 19 percent to -3 percent for coffee; 34 percent to
13 percent for flowers; 20 percent to 15 percent for processed agricultural products; and
55 percent to 11 percent for other agricultural products. An exception is cacao, which saw
its average growth rate increase from 9 percent in the 1990s to 12 percent in the 2000s,
reflecting growing demand for a high-quality niche product.
Bananas and shrimp are Ecuador’s main primary exports. Bananas have seen their
average share of primary exports fall from 39 percent to 36 percent in the 2000s (see
Figure 3.1). Shrimp declined from 38 percent to 31 percent.31
Other traditional
commodity exports also declined; coffee’s share became marginal due to increased
competition from Colombia and Brazil, even though Ecuador is one of the few countries
that still grows both Robusta and Arabica varieties of coffee. Cacao’s share dropped in
the 1990s but stabilized in the 2000s, with an average share of 5 percent, thanks to rising
demand for high-quality Ecuadorian cacao. Three-quarter of cacao exports are used for
high-quality chocolate.
New products have gained importance. The share of flowers in total exports increased
from an average of 4 percent in the 1990s to 11 percent in the 2000s. This trend has
flattened in recent years. Benefiting from the same favorable natural and international
price conditions, other agricultural products also increased their relative contribution,
though more slowly, going from an average share of 2 percent in 1990s to about 4
percent in the 2000s. With a more stable growth rate, processed agricultural products,
which require few industrial inputs, increased their share of total primary exports from an
average of 6 percent in the 1990s to 13 percent in the 2000s.
In general, the most dynamic new export commodities, such as flowers, broccoli, and
processed agricultural products, benefit from a mixture of natural comparative
advantages, trade openness, and opportunistic behavior in exploiting favorable
international markets (see Boxes 3.1 to 3.4). The government’s role in the development
of these products has been limited, except in trade negotiations.
31.
Ecuador is the world’s largest producer and exporter of bananas. The industry covers 131,000 hectares
and is the country’s main employer, providing jobs for 16 percent of the population. After oil, bananas
were the second source of gross export revenues until 2005, then they fell to third place in 2006–08. Fish
and shrimp had increased their gross revenues, benefiting from the country’s geographic location and the
Humboldt’s cold ocean current. Shrimp production takes place in offshore farms to control for diseases and
achieve better quality.

47
Figure 3.1. Share of total primary exports, by product, 1990–2008
Source: Banco Central de Ecuador.
Box 3.1. The boom in flower exports:
Trade liberalization and comparative advantages
The growth of flower exports started in the late 1980s, following trade liberalization policies and increasing
difficulties for Colombian flower exporters confronted by security problems. The elimination of US tariffs
for Andean flowers further boosted Ecuadorian exports, which grew 60 percent in 1992. In the early 1990s,
new markets opened in Eastern Europe after the fall of the Soviet Union.
These favorable conditions were hindered at the end of the 1990s by internal factors, including volcanic
eruptions and financial and economic instability. Nonetheless, the sector grew 11.7 percent in 1999 and 8.0
percent in 2000. The growth rate in 2007 and 2008 remained close to 10 percent, although the current
international economic crisis could hamper further expansion.
Compared to other agricultural products, land used to grow flowers is very productive; relatively small
farms can produce high yields. This labor-intensive sector has become a major employer for rural
communities near the plantations, raising household incomes and discouraging migration to urban areas.
However, the intensive use of pesticides and fertilizers raises environmental and health-related issues.
Three factors could hinder the sector’s continuous growth. First, the international demand for flowers, a
luxury commodity, could be volatile in periods of global economic crisis, while the sustainability of some
plantations depends on minimum volumes. Second, no global marketplace for flowers has emerged. Miami
and Amsterdam, the two major hubs for flower marketing, have limited transparency in the negotiation
process, preventing a more efficient allocation of Ecuadorian flowers despite the country’s natural
advantages. Third, increasing international attention to the use of chemicals in the plantations could imply a
switch toward international demand for organic products, which could potentially hit Ecuadorian
producers. Some companies are already addressing this issue, but some government policies and technical
assistance could help the sector to take advantage of shifts in demand.
Source: Sawers (2005), BCE
0%
10%
20%
30%
40%
50%
60%
70%
80%
90%
100%
1990 1991 1992 1993 1994 1995 1996 1997 1998 1999 2000 2001 2002 2003 2004 2005 2006 2007 2008
Agricultural products
Flowers
Processed agricultural products
Coffee
Cacao
Fish and Shrimp
Bananas

48
Box 3.2. Broccoli exports:
Favorable trade conditions among growing worldwide demand
Broccoli illustrates the dynamic growth of new agricultural products. CORPEI points out that in the early
1990s, new medical studies stressed broccoli’s benefits as a significant source of vitamins, minerals,
antioxidants, and nutrients that help prevent heart disease and cancer. These finding motivated a change in
food habits in industrial countries, particularly in Europe, boosting demand for broccoli.
Ecuador’s natural conditions, especially in the Sierra, allowed private entrepreneurs to develop this crop.
Changes in trade preferences, such as the European Union zero-tariff policy for Ecuadorian broccoli, have
also had a favorable impact on exports.
International demand boosted export revenues and production. For instance, exports to Germany rose from
US$0.3 million in 1990 to US$10.1 million in 1999, although they subsequently declined to US$5.7 million
in 2000, as new nontariff barriers hurt exports. Trade preferences have also sustained exports to the US,
which grew from US$0.7 million annually in the 1990s to US$11.3 million in the 2000s, making the US the
largest importer of Ecuadorian broccoli.
Source: Centro de Inteligencia e Información CORPEI, BCE
Box 3.3. Heart of palm exports:
Self-discovery and seizing opportunity
Commercial plantations of heart of palm started in 1987. Even with the subsequent development of canning
and packing facilities, exports remained marginal in the early 1990s, averaging US$0.8 million in 1990–94.
France, the world’s largest consumer of heart of palm, had largely relied on Brazilian supplies from 1983 to
1994. In 1994, France increased its standards for quality and health and blocked the sale of wild heart of
palm due to environmental concerns. These regulations almost halved Brazilian heart of palm exports,
providing an opportunity for Ecuadorian exports, which grew 589 percent in 1995.
A subsequent boom in worldwide production created excess supply and brought price declines in 1998–
2001. Some Ecuadorian producers switched to other crops, but the volume of exports has grown, with the
exception of a sharp fall in volume and prices in 2002, reflecting Argentina’s economic crisis. Ecuador’s
exports grew 159 percent in 2003–08, although the trend changed in 2008 with the global financial crisis.
Heart of palm exports benefit from trade preferences from the European Union and the US. For instance,
the US granted zero-tariff entrance to Ecuadorian heart of palm beginning in 1992, although Ecuador’s US
sales did not accelerate until the product’s US popularity rose in the 2000s. Argentina has been the second
largest market for Ecuadorian heart of palm since the early 1990s, even though the product has only
benefited from a bilateral free trade agreement since 2004.
The success of this product reflects private entrepreneurship, which took advantage of favorable
international conditions and successfully coped with several periods of adverse external shocks.
Source: Centro de Inteligencia e Información CORPEI, BCE I

49
Box 3.4. Palm oil exports:
World demand and environmental issues
Commercial palm plantations started in Ecuador in the mid-1950s, with small levels of production mainly
because the product was used for the local oils and soaps industry. Export volumes remained marginal
through the end of the century, averaging US$7.6 million in the 1990s.
Three main factors supported the growth in worldwide palm oil demand in the 2000s: (a) its growing use in
the production of margarines and other processed fats, reflecting medical studies that highlighted better
health properties for palm oil compared to other hydrogenated oils; (b) the growing demand for vegetable
oils resulting from economic growth in China and India; and (c) the higher demand for biofuels—including
palm oil—in the context of a global call to reduce carbon emissions.
Responding to growing demand, Ecuador boosted the amount of land devoted to palm oil production,
raising exports to an average of US$58.0 million in the 2000s, including a startling US$129.3 million in
2007. The industry’s prospects depend on international demand for biofuels and the outcome of discussions
over the net impact on carbon emissions. New palm plantations, especially in Indonesia and Malaysia, are
destroying primary tropical forests, threatening biodiversity, and increasing short-term carbon emissions.
The crop’s medium-term future could be bolstered by government policies supporting “greener” options,
including certifications for Ecuadorian crops and limits on destruction of tropical forests.
Source: Fundación de Fomento de Exportaciones de Aceite de Palma y sus Derivados de Origen Nacional
Manufactured products
Manufacturing exports have gradually expanded, particularly in the early 1990s,
constituting between 9 percent and 11 percent of total exports since 1993,32
but have been
volatile. The fastest growing sectors during in 1993-2008 were machinery, furniture, and
minerals. Growth has slowed in most subsectors, particularly rubber and plastic,
ceramics, and chemicals (see Table 3.1). The general slowdown in the industrial
subsectors reflects the lack of further progress regarding trade openness since the early
1990s (see Box 3.5).
32
. Ecuador’s main manufacturing products include machinery (machinery and equipment, clocks, watches,
stationery, pens); furniture (medical, bedroom); minerals (salt, iron and steel and their manufactures, wood
pulp and paper); textiles (cotton fibers, wool fabrics, synthetic fibers, carpets, down); clothes (clothes,
shoes, hats including leather manufactures); chemicals (pesticides, fertilizers, soaps, inks, tints,
pharmaceuticals); ceramics (manufactures of gypsum, ceramic [bathroom fixtures], and glass); and rubber
and plastic manufactures. See Appendix C for annual real growth and trends for specific subsectors.

50
Table 3.1. Manufacturing subsector’s average exports growth rate,
1990s and 2000s
(%)
Average growth rate
Subsector 1990s 2000s
Machinery 31 35
Furniture 38 35
Minerals 33 24
Processed woods 17 11
Textiles 16 9
Clothes 19 11
Chemicals 26 10
Ceramics 25 9
Rubber and plastic 51 10
Source: Banco Central de Ecuador.
Box 3.5. Industrial manufacturing exports and trade agreements
The main markets for Ecuador’s industrial manufacturing exports are Colombia, Peru, Venezuela, and the
US, highlighting the importance of the Andean Free Trade Zone. Growth since 2003 mostly reflects exports
of cars to Colombia, rubber and plastic to Colombia, Venezuela, and Peru, and more recently minerals and
furniture to Venezuela and the US.
Textiles and clothes, industries dating back to colonial times, now include cotton as well as polyester, wool,
nylon, acrylic, and silk fabrics. While production has traditionally been oriented to the local market, exports
have become the main driver of the sector’s growth, thanks to the Andean Free Trade Zone and the US
Andean Trade Promotion and Drug Eradication Act. Clothes exports grew from US$2.7 million in 1990 to
US$63.7 million in 2008, although strong Chinese competition has hurt exports to the US and the European
Union and heightened competition in the market, both for clothes and fabrics.
The manufacturing subsectors—including such resource-intensive sectors as wood processing—have seen
their shares of total exports decline. Source: Centro de Inteligencia e Información CORPEI, BCE, Asociación de Industriales Textiles del Ecuador
Export Diversification
Ecuador’s export basket has diversified in terms of number of export products and the
number of export markets, especially in the 1990s. One measure of diversification
involves tracking over time the number of products and markets that add up to 75 percent
of exports. We consider both total exports, including crude oil, and non-oil exports to
separate the impact of oil prices that were generally lower during the 1990s and higher
during the 2000s. When including oil, an average of five products and nine markets added
up to 75 percent of total exports during the 1990s; in the next decade, it was seven 7
products and seven markets (see Figure 3.2). Excluding oil, an average of 10 products and
nine markets added up to 75 percent of non-oil exports during the 1990s. The averages
rose to 26 products and 10 markets during the 2000s (see Figure 3.3), signaling a gradual
move towards diversification.

51
Figure 3.2. Export Diversification – Total Exports
Source: Banco Central de Ecuador.
Figure 3.3. Export Diversification – Non Oil Exports
Source: Banco Central de Ecuador.
0
1
2
3
4
5
6
7
8
9
10
11
12
1990 1991 1992 1993 1994 1995 1996 1997 1998 1999 2000 2001 2002 2003 2004 2005 2006 2007 2008
# of products that represent 75% of total exports # of markets that represent 75% of total exports
0123456789
10111213141516171819202122232425262728293031323334353637
1990 1991 1992 1993 1994 1995 1996 1997 1998 1999 2000 2001 2002 2003 2004 2005 2006 2007 2008
# of products that represent 75% of total non crude oil exports # of markets that represent 75% of total non crude oil exports

52
While those measures point to a gradual diversification of Ecuador’s non-oil exports,
they do not provide any insight about the exports’ quality and degree of sophistication or
about possibilities for developing new export products. Haussmann and Klinger (2009)
explore these issues and suggest the following findings (See Box 3.6):
Ecuador’s non-oil exports generally have unit prices that are close to the highest
for similar products in world trade, suggesting that the current export basket does
not have much room to continue growing through quality improvements—that is,
by moving towards higher prices for the same products through better quality;
The current non-oil export basket has a low level of sophistication in the sense
that most of its products are goods and services generally exported by countries
with lower GDP per capita than Ecuador. As a result, those products call for
labor input with relatively low wages;
Ecuador’s traditional exports—primary products such as oil, bananas, cacao, and
coffee—occupy a very peripheral part of the “product space,” with few
connections to other goods.33
Exports Ecuador has developed more recently—
such as shrimp, fishing, flowers, and processed agricultural product—are less
peripheral in the product space, implying that they could favor the development
of similar new products.
33
The “product space” provides a mapping that represents connections among different goods and services
and the distance between all pairs of products. A country will find it easier to start producing goods and
services that lay close to those it already produces because similar products require similar input
specializations or productive skills. Close connections between products already exported and new products
that might be developed for overseas sales will make it easier for a country to diversify toward the new
products and gradually move up to more sophisticated products. It helps if the closely connected new
product is growing rapidly in world trade.

53
Box 3.6. Structural Transformation in Ecuador, by Haussman and Klinger
Haussmann and Klinger consider that a product that a country exports has, depending on its quality and
characteristics, a strategic value that helps promoting slower or faster growth. From that perspective, for a
country whose current export products have a relatively low strategic value (generally primary or extractive
goods), new products that could be easily incorporated to the exports basket (in the sense that they require
similar inputs or technology than the existing products) will probably have a low strategic value too. On the
other hand, products with high strategic value would likely require more specialized inputs, making it
harder for a country to start producing and exporting them. Thus, the development of strategies aimed at
producing similar products than those already exported should be easier to implement but may only bring
limited impacts in terms of growth. Meanwhile, starting to produce more sophisticated products may
provide stronger growth opportunities but would require more complex policies, as new products would
typically require fairly different production factors and technologies than the existing ones.
Haussmann and Klinger apply this analysis to the list of priority sectors for Ecuador’s development,
defined by the Ministry’s for the Coordination of Production, Competitiveness, and Commercialization and
conclude the following:
1. Some products of Ecuador’s current export basket (including flowers, fish & aquiculture, bio-fuels, and
fruits & vegetables) have a relatively low strategic value, but it should be relatively easy to develop new
products from these sectors;
2. The country’s exports also include products (such as forestry, textiles, and appliances) with a higher
strategic value, though developing all the necessary inputs and production capabilities to produce these
goods may require more aggressive policies;
3. Finally, some specific products (i.e., the metal-mechanic and automotive sectors) hold an even higher
strategic value, but jump-starting larger production in those sectors would require large investments and
more complex technologies than those available locally. In other words, these sectors are more typical of
countries with radically different productive structures that Ecuador.
Source: Haussman, R., Klinger, B. (2009). “Structural Transformation in Ecuador”. IADB
Thus, the increased diversification of Ecuador’s exports still falls short of ensuring a
growing sophistication of the exported products, as the country continues exporting rather
simple goods with a limited potential, in their view, to promote economic growth.
Haussman and Klinger conclude that the country should consider more active policies to
start producing different goods, which should be chosen by looking at the revealed
sophistication or “strategic value” of potential product candidates. Ultimately, this
strategy implies “picking winners” through a more sophisticated manner, which carries
the risk of favoring some sectors that become dependent losers, rather than winners. An
alternative approach would be to implement policies that address the constraints to
growth, such as improving Ecuador´s business climate for all non oil sectors. However,
the government is leaning in the direction of a “picking winners” approach, as discussed
below.
The Government’s Industrial Policy Plans
Ecuador’s government launched a new industrial policy plan in 2008. It aims to change
Ecuador’s productive structure towards activities with more dynamic comparative
advantage and create better employment opportunities. Specific objectives include
increasing productivity; changing the extraction-based production model; contributing to
“food and economic sovereignty”; increasing local value added in production; reducing
asymmetries in regional development; encouraging technological innovation; and

54
promoting development of the industrial sector. Table 3.2 summarizes some mechanisms
envisioned under such strategy.
The government’s view is that the industrial sector is sluggish and requires stimulus from
the state for several reasons: (a) industrial GDP has remained stable at around 13 percent
of GDP since the mid-1990s; (b) industrial production and exports are concentrated in
activities with low technological development and limited sophistication; and (c) the
industrial sector generated only about 11 percent of total employment over the past
decade. The plan establishes nine general policies to obtain the proposed objectives (see
Table 3.2). Initially, the government set an implementation phase of four years.
International funding would likely be needed to continue implementation, and Ecuador’s
contentious relationship with the international community has limited the funds available.
Some parts of the plan appear to address some growth constraints—such as financing
availability, technologies, or human capital. Others confront some coordination and
signaling issues, including certification programs, environmentally friendly products, or
technological externalities. The plan remains vague and encompasses almost every
sector, however, making it hard to develop focused priorities. The rationale for choosing
the sectors to be supported remains unclear, although the plan mentions some such as the
railroad, cement and steel industries, and this strategy has the risk of becoming subject to
discretion and lobbying (see Nabli and others, 2006).

55
Table 3.2. The government’s main industrial policy objectives
Policy objective Explanation
Promote subsectors that generate
more value added
The government proposes to establish incentives to attract
investment, to enhance local capacity, to increase the production
of high value added goods, and to promote nontraditional
activities with high multiplier effects.
Although the government document does not make clear how it
would decide which sectors to promote, the government’s program
mentions several of its top priorities, including the cement
industry, oil refining, the steel industry, railroads and
transportation, and fertilizers (urea).
Promote scale economies through
local production chains
This policy potentially includes all industrial subsectors. The
government does not indicate how it would achieve scale
economies and whether it would target specific growth constraints.
Develop micro, small, and medium
companies
This policy aims to increase credit lines with preferential
conditions for these companies, support productivity, promote
entrepreneurship, and address financial constraints for industrial
development.
Improve human capital This policy seeks to raise the level of technical and administrative
knowledge of people working in the industrial sector through
government loans, grants, or scholarships. The aim is to lift a
major constraint to industrial growth over the medium term and to
generate positive externalities (such as boosting entrepreneurship)
to promote growth.
Promote the production of quality
goods and services
The proposed mechanism would involve enrolling businesses in a
government certification program.
Add new technologies to existing
productive processes
This policy seeks to promote scientific research and technological
transfers to the industrial sector, aiming to generate positive
externalities, scale economies, and high-quality goods.
Promote clean production processes This policy focuses on improving the management of industrial
waste, encouraging recycling, and reducing the use of products
that are harmful to the environment. It would seek to help generate
additional comparative advantages, raise export prices, and expand
markets for environmentally friendly products.
Reduce transaction costs This policy aims to improve distribution chains and storage
facilities and to develop stronger public institutions. It could help
removing information asymmetries within distribution chains,
which would lead to better prices for small producers and to
increased industrial output, especially for processed agricultural
products.
Extend the supply of industrial
products for both the local market
and exports
This policy seeks to open new international markets for
Ecuadorian products, although no clear details are provided on
how trade negotiations and priorities would be set.
Source: Government of Ecuador, “Política Industrial del Ecuador”, February 2009.
3.2 POLICIES THAT AFFECT THE GROWTH OF THE NON OIL SECTOR
Sustainable growth in a small open economy like Ecuador’s will not depend solely upon
growth in the oil sector or solely on growth of the non-oil sectors. A probabilistic

56
simulation compares some alternative combinations (see Appendix G). Boosting oil
production by addressing some of the sector’s weaknesses and boosting the industrial and
non-oil primary production to diversify the economy would have similar effects on long-
term growth. Accelerating oil production would be slightly better for overall growth in
the short run, but diversified export production would be better in the long run. This
would occur because oil production has only a small effect on industrial growth but it
stimulates growth in services. Economic diversification has a slightly stronger long-run
impact due to stronger intersectoral linkages between the non-oil tradable sectors and the
rest of the economy. In terms of employment and income distribution, economic
diversification would be better in the long run.
Through several policies to improve the overall business climate, the government could
increase the growth of the non oil tradable sectors (see Box 3.7 on how labor and wage
regulations affect the non-oil tradable sector). This section focuses on three policy areas
that historically had an impact in Ecuador: (i) dollarization that could have an impact on
the development opportunities of non oil products if it tends to appreciate the real
exchange rate and lower the competitiveness of non-oil sectors; (ii) fiscal policy that
could affect the business environment, as they may change economic incentives,
particularly for small and medium size companies (in the 2010 Doing Business report,
Ecuador ranks 77 out of 183 countries regarding the impact taxes have on the general
business climate); and (iii) trade policies, which can impulse or hamper the development
of non oil sector, including tariffs, quotas and trade agreements (in the 2010 Doing
Business report, Ecuador ranks 125 out of 183 countries regarding the effect trade
conditions have on general business climate).
Box 3.7. Labor and Wage Policies and the Non-oil tradable sector
Labor and wage policies may have an impact on the non oil sector’s competitiveness and growth. On the
one hand, wage determination is critical to determine the competitive position of non oil exports. Albornoz
(1999) highlights through econometric tests the importance of real exchange rate depreciation—
specifically, the bilateral real exchange rate with the US—as a key factor in stimulating non-oil primary
exports, although with a long (six years) lag. As a dollarized economy, Ecuador cannot devaluate its
nominal currency to grant a short-term competitive advantage to its exports. In this scenario, policies for
determining wage increases that are not based on productivity gains can translate into higher inflation and
thus into a real exchange rate appreciation.
In Ecuador, the minimum wage is set in two meetings conducted by the Consejo Nacional de Salarios
(CONADE), which includes representatives of the main labor unions, the employers (Production and
Commerce chambers) and the Ministry of Labor. In case a consensus cannot be reached during the
meetings, the Minister of Labor has the final decision regarding the wage increase, considering inflation
projections for the following year and other aspects.
Year
Minimum
Wage
Wage
Increase
Annual
Inflation
2006 160
3.3% 2007 170 6.3% 2.3% 2008 200 17.6% 8.4% 2009 218 9.0% 5.2%
Source: BCE
The Table above shows that the minimum wage increases for 2006-09 have largely surpassed inflation

57
rates. Such wage increases have not considered labor productivity trends, thus increasing the relative
production costs for the non oil sector, especially labor-intensive agricultural activities requiring non
specialized labor and paying low wages close to the minimum wage levels. As a result, wage increases can
hurt export competitiveness as well as formal employment.
Ecuador’s labor regulations are rigid and may not facilitate job creation. In March 2008, the Constitutional
Assembly prohibited labor intermediation and hourly work agreements, with the aim of addressing a
perceived abusive usage of such alternatives. Meanwhile, this decision reduced the flexibility of companies
to boost temporary or seasonal hiring. As a result, labor costs have increased as workers previously hired
through intermediary companies must now be included in their formal workforce, which includes the social
and pecuniary benefits set by the Labor Code. Such higher costs led some medium and small companies to
reduce their formal workforce.
Dollarization and Growth
Dollarization brought important changes positive and negative to the Ecuadorian
economy since 2001. The adoption of the dollar as national currency almost a decade ago
transformed the relations between the different sectors, including modifying the time
horizon for economic agents. It also implied a drastic change in the scope for public
policy, because the country could no longer issue new money or rely on autonomous
monetary and exchange rate policies.
Highlights of the positive side are:
Dollarization brought stability to the economy, particularly regarding inflation
and the exchange rate. Before dollarization, inflation had an explosive upward
trend, with a 34.2 percent average annual rate in the 1990s that culminated in 90
percent by 2000 (see Figure 3.4). Subsequently, inflation decreased dramatically,
the intended result under an exchange rate nominal anchor. In 2001-08, inflation
averaged 7.3 percent. Price stability has translated into strengthened budgeting
and planning for both the private and the public sectors and allowed many
businesses to focus on their core activities rather than short-term financial
considerations and liquidity management, thus strengthening long-term growth.
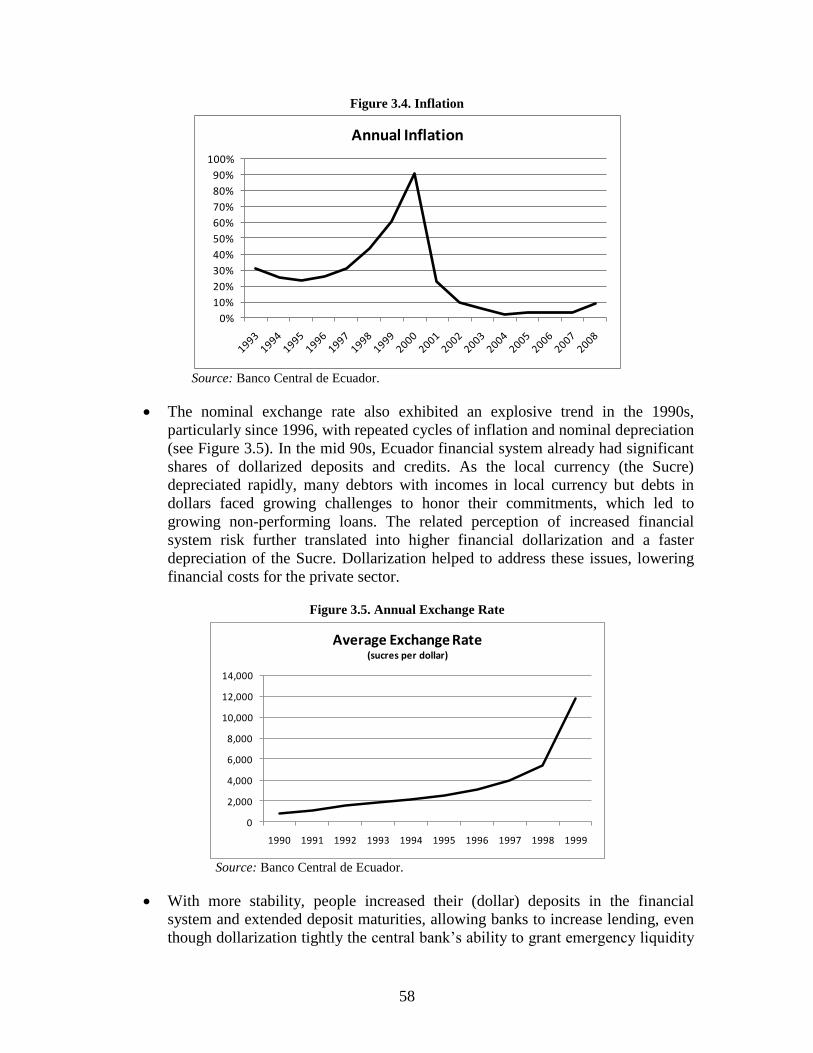
58
Figure 3.4. Inflation
Source: Banco Central de Ecuador.
The nominal exchange rate also exhibited an explosive trend in the 1990s,
particularly since 1996, with repeated cycles of inflation and nominal depreciation
(see Figure 3.5). In the mid 90s, Ecuador financial system already had significant
shares of dollarized deposits and credits. As the local currency (the Sucre)
depreciated rapidly, many debtors with incomes in local currency but debts in
dollars faced growing challenges to honor their commitments, which led to
growing non-performing loans. The related perception of increased financial
system risk further translated into higher financial dollarization and a faster
depreciation of the Sucre. Dollarization helped to address these issues, lowering
financial costs for the private sector.
Figure 3.5. Annual Exchange Rate
Source: Banco Central de Ecuador.
With more stability, people increased their (dollar) deposits in the financial
system and extended deposit maturities, allowing banks to increase lending, even
though dollarization tightly the central bank’s ability to grant emergency liquidity
0%
10%
20%
30%
40%
50%
60%
70%
80%
90%
100%
Annual Inflation
0
2,000
4,000
6,000
8,000
10,000
12,000
14,000
1990 1991 1992 1993 1994 1995 1996 1997 1998 1999
Average Exchange Rate(sucres per dollar)

59
loans, as it cannot issue its own currency. Bank deposits averaged US$3,522
million in the 1990s, with a slightly increasing trend until 1998. They fell
drastically in 1999, when the weakening conditions of several large financial
institutions became obvious. With dollarization, bank deposits have averaged
US$8,013 million in the 2000s, with a growing and stable trend.
Bank credits have followed similar trends. Annual average credit to the private
sector was US$3,424 million during the 1990s. It increased to US$8,053 million
after dollarization, helping to overcome one of the constraints to growth in
Ecuador’s non-oil sectors. Moreover, bank deposits and credits have remained
stable despite episodes of political instability, including several unexpected
changes of administrations. Thus, dollarization has helped isolate economic and
financial trends from political instability.
Figure 3.6. Financial Access of the Private Sector
Source: Banco Central de Ecuador.
In theory, the negative impact of dollarization for growth would be related to external
sector considerations, including the constraints it poses on export competitiveness and on
countercyclical policy responses in the face of volatile exchange rates or growth
fluctuations.
Important considerations on the negative side are:
Dollarization has meant the loss of the nominal exchange rate as a policy
instrument to cushion external shocks, such as the global financial crisis of 2009.
If (non-dollar) trade partner countries devaluate against the U.S. dollar it hurts
Ecuador’s competitiveness. At certain times, Ecuador’s bilateral real exchange
rate appreciated with Colombia (November 2001 to March 2005), Peru
(September 2001 to December 2007 and again since May 2008) and Ecuador’s
main European trade partners (for Germany, October 2000 to October 2004 and
0
2000
4000
6000
8000
10000
12000
14000
16000
19
90
19
91
19
92
19
93
19
94
19
95
19
96
19
97
19
98
19
99
20
00
20
01
20
02
20
03
20
04
20
05
20
06
20
07
20
08
Financial Access of the Private Sector(Millions of Dollars)
Deposits Credit

60
April 2005 to January 2007). Overall, Ecuador’s effective real rate index
appreciated gradually from January 2002 to January 2007- as it should have with
rising oil export prices, and it also depreciated as oil prices fell in late 2008 (see
Figure 3.7).
Figure 3.7. Real Effective Exchange Rate.
Source: Banco Central de Ecuador.
Note: A depreciation is represented as an increase in the RER index.
Dollarization has also implied the loss of an independent monetary policy to
cushion external shocks and economic fluctuations. The factors driving the US
monetary policy are not necessarily correlated with Ecuador’s economic
environment. This could result in adverse conditions for growth or the financial
system if, for example, the US monetary authorities were to raise interest rates in
a period when Ecuador was experiencing a recession. The dollar has become
relatively weaker against other major currencies, thus limiting the risks of real
exchange appreciation (see Figure 3.8). Indeed, except from April 2008 to April
2009,34
there is no evidence suggesting any substantial appreciation in real terms
since dollarization. In addition, international interest rates have remained at
moderate levels, including a sharp decline with the recent international financial
crisis. Until mid-2008, moreover, growing world demand for natural resources
boosted export prices of several Ecuadorian commodities to record levels. Despite
their decline since mid-2008, oil prices have remained relatively high, supporting
Ecuador’s balance of payments.
34
In this period of time the US dollar appreciated against other major currencies and also Ecuador’s major
trading partners currencies depreciated lead to an appreciation of the real exchange rate.
80
100
120
140
160
180
200
220Ja
n-9
4
Oct
-94
Jul-
95
Ap
r-9
6
Jan
-97
Oct
-97
Jul-
98
Ap
r-9
9
Jan
-00
Oct
-00
Jul-
01
Ap
r-0
2
Jan
-03
Oct
-03
Jul-
04
Ap
r-0
5
Jan
-06
Oct
-06
Jul-
07
Ap
r-0
8
Jan
-09

61
Figure 3.8. Evolution of US dollar against other major currencies.
Source: Banco Central de Ecuador.
Given the important growth of nontraditional exports in the 2000s, and considering the
relatively benign external environment since dollarization, one could conclude that the
favorable growth impacts have exceeded the negative consequences over dollarization’s
first decade in Ecuador. Up to now, dollarization has promoted favorable conditions for
long term decision making for businesses and has sheltered the economy from the
country´s political instability. Thus, dollarization can be seen as a factor that has
promoted growth of the non oil sectors. In addition, as witnessed by the Argentinean
experience of exiting convertibility (a somewhat more soft regime than dollarization),
exit costs from dollarization could be extremely high, as lifting the regime would likely
result in a severe depreciation of the new currency and may need to be accompanied by
some compulsory measures to induce the population to accept the new currency. All in
all, it has become even more important to implement adequate policies that ensure the
sustainability of the dollarization regime.
Fiscal Policy and Growth
Diversifying Ecuador’s economy does not mean shrinking the oil sector or even
hindering its efficient growth; it does mean faster growth and increasing shares of GDP
for the non-oil tradable sectors—both those that export and those that substitute
efficiently for imports. Diversification also means broadening the government’s sources
of revenue, which have become more dependent than the economy as a whole on oil. The
public sector has received 26 percent (2006) to 47 percent (2000) of its revenues from the
oil sector, depending on oil price fluctuations. The following discussion focuses on how
fiscal policy affects the allocation of resources between the nontraded and tradable non-
oil sectors.
Some of the effects are direct: hiring more workers in the public sector (nontraded) leaves
fewer for employment in producing private goods and services, both nontraded and
tradable, but in Ecuador this effect is relatively small. More govenment borrowing may
0
20
40
60
80
100
120
140
160
0.00
0.20
0.40
0.60
0.80
1.00
1.20
1.40
Jan
-94
No
v-9
4
Sep
-95
Jul-
96
May
-97
Mar
-98
Jan
-99
No
v-9
9
Sep
-00
Jul-
01
May
-02
Mar
-03
Jan
-04
No
v-0
4
Sep
-05
Jul-
06
May
-07
Mar
-08
Jan
-09
JPY
pe
r d
olla
r
EUR
pe
r d
olla
r
Euro Yen (right scale)

62
crowd Ecuador’s entrepreneurs and investors out of local capital markets. Other indirect
effects may be positive, but do not particularly favor traded versus non-traded sectors.
Good public provision of transportation and communication services, efficient customs
service, good police, a well-educated workforce, and good regulation could make private
production in all sectors more efficient and more attractive for investors.
Ecuador’s public sector revenues grew modestly in the 1990s—an important achievement
in a time of declining oil prices. Government revenues grew rapidly after 2000 at first
because of macroeconomic stabilization and dollarization and after 2004 because of
rising oil prices (see Table 3.3). The higher oil prices boosted oil-export revenues
fourfold and had other important fiscal effects. For example, net revenue from domestic
sales of petroleum derivatives disappeared and turned into a large deficit for
Petroecuador, reflecting off-budget subsidies for consumption of increasingly expensive
imports of derivatives.35
This reduced substantially—by 8.3 % of GDP in 2008—the
surplus that Petroecuador was able to pay to the government, compared to what it could
have paid without the burden of the subsidy. All tax revenues rose—especially value
added tax and income tax—due in part to higher aggregate incomes and spending based
on the public sector distribution of oil revenues. Non-oil tax revenue as a share of GDP
also rose, which suggests that the greater wealth of the public sector from oil did not
dampen the efforts of tax collectors, as it did in other countries.
Table 3.3. Non Financial Public sector (NFPS) revenue in Ecuador, 1990–2008
(US$ and % of GDP)
Source: Banco Central de Ecuador.
35
“Sale of products” includes revenues from the domestic sale of fuels and other derivatives. Since the
local consumer prices were frozen as international prices rose in recent years, the government started
subsidizing them on a net basis rather than receiving revenues from the sales. Thus, the corresponding
revenue is null since 2006, with the remainder of the subsidy being discounted in “other incomes.” The
2010 budget discloses revenues from oil derivative sales and spending in oil derivative subsidies in a more
transparent way. Petroecuador profits are recorded under “public enterprises surplus.”
1990-94 1995-99 2000-01 2002-03 2004-05 2006 2007 2008
Total revenue (US$) 3,366 4,348 4,540 6,636 8,661 11,263 13,451 20,781
Total expenditure (US$) 3,379 4,978 4,418 6,374 8,186 9,928 12,554 21,458
Overall Balance— US$ -13 -630 122 262 475 1,335 897 -677
Non- Oil Overall Balance -1,602 -2,164 -1,458 -1,398 -1,830 -1,588 -3,017 -10,323
Total revenue --% GDP 25.0 20.7 24.6 24.9 24.8 27.0 29.5 39.5
Oil revenue 11.8 7.3 8.5 6.2 6.6 7.0 8.5 17.6
Exports 6.8 3.2 6.3 3.9 5.4 7.7 7.2 16.9
Sale of products 2.2 2.7 1.5 1.8 0.8 0.0 0.0 0.0
Public enterp. Surplus (PetroEcuador) 2.8 1.4 0.7 0.5 0.4 -0.7 1.3 0.7
Non oil revenue 13.2 13.4 16.1 18.7 18.2 20.0 20.9 21.9
VAT 3.0 3.3 6.2 6.4 5.8 5.9 6.0 5.9
Excise taxes 0.7 0.5 0.6 0.9 0.8 0.8 0.8 0.9
Income tax 1.4 1.4 2.3 2.5 2.9 3.5 3.7 4.4
Capital flows tax 0.0 0.4 0.5 0.0 0.0 0.0 0.0 0.0
Customs 1.7 1.8 1.5 1.6 1.5 1.5 1.5 1.6
Other Taxes 0.5 0.3 0.1 0.0 0.0 0.0 0.0 0.0
Social security contr. 2.6 2.0 1.8 3.1 3.1 3.7 3.9 4.0
Other 3.3 3.7 3.1 4.2 4.1 4.5 5.0 5.1

63
Government spending grew strongly during the oil boom—162 percent in dollar terms
from 2005 to 2008 and from 23.4 percent to 40.8 percent of GDP (see Table 3.2). This
corresponded to a big increase in the nontraded sector, and it crowded out the tradable
non-oil sectors as a share of non-oil GDP, although the absolute level of non-oil exports
continued to grow slowly in real terms during these years.
During the run-up of oil prices from 2002 to 2008, Ecuador acted as if the windfall were
permanent. Budgeted public spending increased at the same pace as revenues. In 2000–
06, budgeted spending as a share of GDP stayed around 24 percent, where it had
remained since the mid-1990s. Then public spending jumped to 27 percent in 2007 and
then to 41 (see table 3.4) percent of GDP in 2008. For 2007, the absolute GDP increase
was bigger than the increase in budgeted spending. For 2008, however, the absolute
increase in public spending was larger than the GPD increase and there was a fiscal
deficit —an extraordinarily expansive fiscal policy in boom times. Given that spending is
harder to cut than to increase, the fiscal stance could prove unsustainable if oil revenues
decline.
Incentives to invest in the non-oil sector—the essence of diversification—depend on
expectations of stability in overall demand and macroeconomic policy. The procyclical
aggregate fiscal policy in recent years has not contributed to this goal.
Although overall public spending should be countercyclical to stabilize aggregate
demand, the composition of public spending also matters for fiscal sustainability. During
the cycle’s boom phase, a government should increase its saving and limit spending
increases to areas where outlays will be relatively easy to reduce when the cycle turns.
These considerations imply that most of any temporary increase in public spending
should go to investment, a form of saving if the projects are worthwhile. When revenues
start to falter, expenditures should be adjusted. The Correa administration increased
investment during the cycle’s boom, but when revenues started to falter expenditures
were not adjusted.
In Ecuador, government spending has increased significantly. All categories of spending,
except interest, grew in absolute dollar terms and as a share of GDP during the 2005-
2008 boom (see Table 3.4). There was no apparent effort to mitigate the procyclical
pattern of fiscal stimulus or to assure fiscal sustainability when revenues declined. Public
investment more than doubled as a share of GDP, which raises questions as to whether
they managed efficiently the investment increase. Within current spending, purchases of
goods and services—a relatively flexible category—stayed about constant as a share of
GDP. The category showing the biggest increase was other current spending (including
some social transfers), which rose from 3.5 percent of GDP in 2002–03 to 12.5 percent in
2008. Salaries’ share of GDP rose from 8.0 percent in 2002–05 to 9.3 percent in 2008; it
will rise further if GDP declines and the wages do not (World Bank 2004a: 49) (see
Figures 3.9 to 3.11).

64
Table 3.4. Non-Financial Public Sector (NFPS) Spending trends, 1990–2008
Source: Banco Central de Ecuador.
Figure 3.9. Non-Financial Public Sector (NFPS) expenditures (excluding subsidies), NFPS balance,
and oil prices, 1990–2008
Source: Banco Central de Ecuador.
1990-94 1995-99 2000-01 2002-03 2004-05 2006 2007 2008
Total revenue (US$) 3,366 4,348 4,540 6,636 8,661 11,263 13,451 20,781
Total expenditure (US$) 3,379 4,978 4,418 6,374 8,186 9,928 12,554 21,458
Overall Balance— US$ -13 -630 122 262 475 1,335 897 -677
Total expenditure, % GDP 25.1 23.7 23.9 23.8 23.4 23.7 27.4 40.8
Current expenditure 18.3 17.8 18.1 18.1 18.5 19.1 20.0 27.1
Interest 5.0 4.7 5.6 3.1 2.3 2.1 1.9 1.4
External 4.5 3.6 4.5 2.4 1.8 1.8 1.7 1.3
Domestic 0.5 1.1 1.1 0.7 0.5 0.3 0.2 0.1
Salaries 7.1 6.8 5.6 8.0 7.9 7.6 8.1 9.3
Goods & services 2.7 2.3 2.7 3.5 3.1 3.6 3.4 4.0
Other 3.5 4.0 4.2 3.5 5.2 5.8 6.6 12.5
Capital expenditure 6.8 5.9 5.8 5.7 4.9 4.6 7.4 13.7
Investment 6.4 5.5 5.2 5.2 4.7 4.5 6.9 13.6
Central government 1.0 2.4 2.8 2.4 2.2 2.0 3.7 8.2
Public enterprises 2.7 1.8 0.6 0.8 0.7 0.8 1.2 2.4
Local governments 0.7 1.0 1.5 1.8 1.7 1.6 1.8 2.4
Other 2.0 0.3 0.2 0.2 0.1 0.2 0.3 0.6
Other capital exp. 0.4 0.4 0.6 0.5 0.2 0.1 0.5 0.1
Overall balance -0.1 -3.0 0.8 1.2 1.4 3.3 2.1 -1.3
Non- Oil Overall Balance -11.9 -10.3 -7.7 -5.0 -5.2 -3.7 -6.4 -18.9
0
20
40
60
80
100
120
(2,500)
2,500
7,500
12,500
17,500
22,500
1990
1991
1992
1993
1994
1995
1996
1997
1998
1999
2000
2001
2002
2003
2004
2005
2006
2007
2008
NFPS Expenditures (US$ Million)
NFPS Balance (US$ Million)
International Oil Price (US$/Barrel)

65
Figure 3.10. NFPS capital expenditures and oil prices, 1990–2008
Source: Banco Central de Ecuador.
Figure 3.11. NFPS payroll and oil prices, 1990–2008
Source: Banco Central de Ecuador.
In terms of sectoral distribution, the public spending itself expands the non-traded sector
as a direct effect, but one can also look for secondary effects in improving the business
climate, which supports both the tradable and nontraded sectors. About 4 percent of GDP
goes to public spending goes to these areas, including education and transport &
communications (see Table 3.5). Ecuador’s spending for education and transport is low
compared to the rest of Latin American and the dynamic exporters of East Asia (see
0
20
40
60
80
100
120
0
1,000
2,000
3,000
4,000
5,000
6,000
7,000
8,000
1990 1992 1994 1996 1998 2000 2002 2004 2006 2008
Capital Expenditure (US$ Million)
International Oil Price (US$/Barrel)
0
20
40
60
80
100
120
0
500
1,000
1,500
2,000
2,500
3,000
3,500
4,000
4,500
5,000
1990 1992 1994 1996 1998 2000 2002 2004 2006 2008
Salaries (US$ Million)
International Oil Price (US$/Barrel)

66
Table 3.6). Data for 2007-09, when available, may reveal some new trends. The steep
rise of overall public investment in 2007-08 (Figure 3.20 and Table 3. 4) suggests a
positive development impact, if the investment was well chosen and implemented. Of
course, the large off-budget spending for subsidizing fuel imports in recent years did not
help with economic development, traded or non-traded.
Table 3.5. The Functional Classification of Public Expenditures, 1995–2006
(Central government, % of GDP)
Note: General administration includes national treasury, global spending and planning.
Source: Prepared from data of the Ministry of Finance of Ecuador and Central Bank of Ecuador.
1995-99 1998-2000 2001-03 2004 2005 2006
Education 2.55 2.23 2.49 2.63 2.54 2.63
Agriculture 0.83 0.63 0.74 0.34 0.44 0.29
Natural Resources 0.30 0.35 0.07 0.05 0.06 0.05
Industry and Trade 0.03 0.02 0.07 0.04 0.04 0.03
Tourism 0.00 0.00 0.02 0.01 0.01 0.02
Transport and Communications 0.87 0.77 0.91 1.05 0.93 0.87
General Administration 1.57 1.13 4.76 4.07 4.10 4.73
Environment 0.02 0.01 0.05 0.04 0.08 0.05
Internal Affairs 1.27 0.96 1.24 1.30 1.33 1.26
Defense 2.11 1.94 2.14 2.18 1.78 1.67
External Affairs 0.20 0.23 0.20 0.18 0.15 0.14
Public Finance 0.65 1.72 0.76 0.62 0.07 0.08
Social Welfare 0.34 0.31 0.42 0.27 0.71 0.70
Labor 0.04 0.03 0.03 0.02 0.03 0.03
Health 0.82 0.70 1.00 1.14 1.14 1.22
Urban Development & Housing 0.20 0.13 0.35 0.23 0.23 0.20
Sectoral Development 0.62 1.43 0.00 0.00 0.00 0.00
Other 0.09 0.06 0.09 0.15 0.05 0.13
TOTAL (without debt service) 14.09 13.79 20.10 18.38 17.78 18.82
Debt Service 8.98 9.58 7.84 8.13 7.60 9.14
TOTAL (with debt service) 23.07 23.37 27.94 26.51 25.38 27.96

67
Table 3.6. Spending in Education and Transport in Latin America and East Asia
1. For LAC, transport spending refers to investment in roads and railways (average for 1996–2001). For
Ecuador, it also includes telecommunication spending. For East Asia, transport spending refers to 2003. 2. Latest year available.
3. For Ecuador, data come from Ministry of Finance and Central Bank of Ecuador.
… Not Available. Source: Based on World Development Indicators, Calderon and Serven 2004; Fay and Morrison 2005;
ADB, World Bank, and Japan Bank for International Cooperation 2005; Ministry of Finance of Ecuador,
and Central Bank of Ecuador.
Ecuador’s tax laws specified some direct distribution of revenue until December 2007,
when the Ley Reformatoria para la Equidad Tributaria en el Ecuador eliminated most of
the earmarks. The direct distribution had, for instance, channeled 10 percent of personal
and corporate income tax revenue to the Development Fund, 11 percent to universities
and technical schools, and 6 percent to the local government or municipality where the
tax was collected (Ley de Régimen Tributario Interno, November 2004, Article 51).
Regarding oil revenues, the Ley Orgánica para la Recuperación del Uso de los Recursos
Petroleros del Estado y Racionalización Administrativa de los Procesos de
Endeudamiento eliminated most earmarks and the Oil Funds in April 2008.36
The
rationale was to give the government more flexibility to reallocate resources. For
intersectoral reallocation, this was perhaps a good idea; on the other hand, the
36
Ecuador’s Constitution of September 2008 only allows earmarks for decentralized regional governments,
health, education, universities, and research and development.
Total Public Private
LAC:
Argentina 3.8 0.3 0.2 0.2
Bolivia 6.4 2.8 2.6 0.2
Brazil 4.5 0.1 0.0 0.1
Colombia 4.9 0.9 0.7 0.2Chile 3.2 2.0 1.0 1.0
Ecuador 3/ 2.6 0.8 0.8 …
Mexico 5.5 0.4 0.1 0.3
Peru 2.5 0.3 0.1 0.1
East Asia:Cambodia 1.6 1.0 1.0 …
China … 3.6 3.6 …
Indonesia 3.5 1.0 1.0 …
Lao PDR 3.2 1.3 1.3 …
Mongolia 5.1 1.5 1.5 …
Philippines 2.5 0.8 0.8 …Thailand 4.3 1.0 1.0 …
Vietnam … 4.9 4.9 …
Transport Spending 1/
Public Education Spending 2/Country

68
intertemporal reallocation out of the stabilization fund (from smoother future spending to
more spending now) was detrimental to macroeconomic stability.
The tax side of fiscal policy could use some reforms to improve the incentives for overall
private sector investment and for the allocation between tradeable and nontradable non-
oil sectors.
Income taxes. The corporate income tax is 25 percent, but companies are required
to distribute an additional 15 percent of profits to their employees. Therefore, the
effective corporate income tax rate should be considered 40 percent.37
This is the
biggest tax impediment to private investment. By comparison, rates are 32 percent
in Colombia, 28 percent in Mexico, 27 percent in Peru, and 17 percent in Chile.
Ecuador’s tax regime is not overly distortive, with no special rates for certain
regions or sectors, except for the oil industry. Also, the corporate income tax has a
clause reducing by half the tax on retained earnings. While not directly affecting
the balance between tradable and nontraded sectors, this feature constitutes a tax
incentive for established firms to reinvest, compared to new firms needing to raise
funds from after-tax sources of savings. This may discourage competition and
innovation in the private sector because it benefits established economic interests,
which typically have greater political connections. To encourage investment
without discriminating against smaller and newer firms and without costing as
much revenue, the government might consider other tax strategies, such as
allowing firms to count at least part of increased investment outlays as expenses,
thus reducing their taxable income.
Value added tax (VAT). The VAT is Ecuador’s most important source of non-oil
fiscal revenue. With a rate of 12 percent, it brought in about 6 percent of GDP in
2006–08, or 30 percent of all non-oil revenues, which is typical for the LAC
region. Some reforms of the VAT could give more encouragement to the tradable
sectors, as well as raise more revenue. A destination-based VAT, if well
implemented, should tax domestic consumption from domestic production and
from imports; it should leave production untaxed, which should encourage the
exportable segment of tradables, including tourism services sold to foreigners.
Ecuador’s VAT, however, is more complex. Like many countries in Latin
America, Ecuador’s zero rates apply to many items in domestic consumption,
including food (processed as well as not), medicines, publications, book printing,
agricultural inputs, passenger transport, utilities, public entertainment,
craftsmanship, education, and health services. A shorter list of untaxed items
would suffice to shield most low-income households’ consumption from the
VAT—so this tax structure lowers revenues and gives large tax benefits to upper-
37
The 15 percent redistribution requirement differs from a tax in at least two ways. First, it is compensation
to workers and could to some extent lower the wages the company needs to pay to attract workers. From
the employer’s point of view, this quasi-wage is attractive because it only has to be paid when the company
is doing well; however, it is paid with after-tax income. Second, foreign companies--especially those based
in the US—may find the distribution to workers less attractive than an equivalent payment in income tax.
Only the income tax can be credited against tax obligations in the US.

69
income households. In addition, a long list of items at zero rates dilutes the VAT’s
incentives in favor of tradable goods. Indeed, Ecuador’s zero-rate list includes a
large share of nontraded goods and services, which leaves the VAT primarily on
consumption of tradable goods, domestically produced or imported.38
Another
issue involves tax-rebate schemes. How well they help exporters get back the
VAT paid on earlier stages of production is important for the question of
incentives for tradable versus nontraded sectors. In our meetings with a small
sample of industry representatives, only a few respondents from the tourism
sector raised the issue of VAT rebates.
In summary, the tax system is not a major hinderance to the tradable sector in Ecuador,
but some areas could be improved. First, many non-tradable goods and services have zero
VAT rates, while most tradable goods face the VAT, except for exports. Second, the
effective income tax rates on capital are high, and only well-established enterprises
already making profits benefit from the reduced tax rate on reinvested profits. The latter
puts start-up firms, which do not have profits yet, are at a relative disadvantage.
Trade agreements, trade protection, and growth
This section examines the correlation between sector growth and freer trade and whether
successful sectors—those with growth of output and exports—have benefited more than
unsuccessful ones from preferential trade agreements. This review includes the Andean
Trade Promotion and Drug Eradication Act (ATPDEA) with the US, the free-trade
component of the Andean Community (CAN) agreements, and the free-trade agreements
between the CAN and Mercado Común del Cono Sur (MERCOSUR) and between
Ecuador and Chile. They represent the main agreements with Ecuador’s largest trading
partners. The countries included in these agreements received an average of 60 percent of
Ecuador’s total exports in 1990-2008, measured either in volume or in FOB dollars (see
Figure 3.12 and Table 3.7).
38
In August 2009, President Correa recommended some tax policy changes, two of which would make the
VAT more favorable to the tradable sectors—rebating the VAT to tourism firms (tradable sector) and
requiring public enterprises and periodicals (mostly nontraded) to pay the VAT. These changes were still
under discussion in November 2009.

70
Figure 3.12. Trade agreement destinations as percentage of total exports
Table 3.7 Ecuador’s Major Trade Partners and its Exports
(In USD millions)
Source: Banco Central de Ecuador
0.00%
10.00%
20.00%
30.00%
40.00%
50.00%
60.00%
70.00%
80.00%
19
90
19
91
19
92
19
93
19
94
19
95
19
96
19
97
19
98
19
99
20
00
20
01
20
02
20
03
20
04
20
05
20
06
20
07
20
08
Volume FOB Dollars
Country 2008Average Exports
1990-2008
Average Exports
1990-99
Average Exports
2000-08
Average
Growth
UNITED STATES 8,350.2 2,793.5 1,545.3 4,180.3 171%
CAN 3,199.3 941.3 371.7 1,574.1 323%
PERU 1,702.4 463.0 141.6 820.1 479%
COLOMBIA 775.3 333.6 193.1 489.8 154%
VENEZUELA 700.0 138.4 33.6 254.8 658%
BOLIVIA 21.6 6.2 3.4 9.4 178%
MERCOSUR 143.0 94.1 89.3 99.4 11%
ARGENTINA 91.4 57.6 58.7 56.3 -4%
BRASIL 45.2 30.1 22.4 38.7 73%
URUGUAY 4.7 5.3 7.2 3.3 -55%
PARAGUAY 1.7 1.1 1.1 1.2 15%
CHILE 1,503.4 275.8 162.3 402.0 148%
Countries without trade agreements 5,316.5 2,371.9 1,708.1 3,109.5 82%

71
ATPDEA. This agreement went into effect in 2002, replacing the decade-old Andean
Trade Preference Act (ATPA). The ATPDEA grants trade preferences to Bolivia,
Colombia, Ecuador, and Peru, seeking to strengthen legal industries in the Andean
countries as alternatives to the production and trafficking of drugs. These unilateral
preferences represent an important benefit for the Andean countries.39
The US has 13,613 tariff categories, 29 percent of which are currently duty free for all
countries (see Table 3.8). The ATPDEA provides zero or reduced tariffs for an additional
46 percent of categories for exports from the Andean countries. Overall, Andean
countries face zero or reduced tariffs for three-quarters of the total US tariff categories.
The ATPDEA and its predecessor pact have boosted Ecuador’s exports to the US,
especially for agricultural products (see Table 3.9). For example, flower sales grew from
US$11.8 million in 1990, before any trade preference, to US$407.3 million in 2008, with
steady increases over that period. The impact has been similar for other agricultural
products, such as heart of palm, broccoli, and asparagus, which collectively rose from
US$2.0 million in 1990 to US$46.6 million in 2008. Processed agricultural products,
such as juice and pulps, also benefited from the trade preferences, particularly in the
2000s under ATPDEA. Although tariff reductions extended to industrial manufactures,
their growth was slower.
39
. In 2008, Peru left the ATPDEA after signing a full free-trade agreement with the US. In November
2008, President Bush asked Congress to remove Bolivia from the program for failure to cooperate in efforts
to eradicate the cultivation and sale of narcotics.

72
Table 3.8 U.S. Custom Tariffs ( 2004)
(percentage of sector with preferences)
Sector
No
Tariffs
Extra
ATPDEA
Preferences Average tariff
Agriculture and Farming 21% 67% 1%
Fishing 66% 30% 4%
Oil and derivatives 39% 29% 32%
Petrochemicals 35% 65% 0%
Plastic and Rubber 23% 76% 2%
Leather products 10% 71% 19%
Wood and paper 44% 56% 0%
Textiles 6% 13% 81%
Precious Mineral 45% 55% 0%
Steel and manufactures 17% 83% 0%
Copper and manufactures 14% 87% 0%
Aluminum and manufactures 6% 94% 0%
Other metals and manufactures 28% 72% 0%
Machinery 56% 44% 0%
Vehicles and parts 48% 52% 0%
Others parts 83% 17% 0%
Other 27% 24% 49%
Total 29% 46% 25% Source: USITC, CAN
Reading: Out of all Agriculture and Farming products imported to the U.S., 21 percent of categories
have no tariffs, and 67 percent of categories benefit from additional trade preferences (no protection or
reduced tariffs) under the ATPDEA. The last column shows the average tariff applied for that sector
under the ATPDEA
CAN tariff agreements. In 1992, CAN member countries adopted Decision 24,40
aimed
at establishing a free-trade area by the end of 1992. Ecuador was allowed to postpone the
process until December 1993. The agreement implies that all goods satisfying CAN’s
origin regulations will be traded free of tariffs and other restrictions. Peru did not
participate in this process, but subsequently approved Decision 414, which deregulated
trade with other member countries in December 2005. Andean countries are allowed to
impose restrictions due to sanitary and health issues and can request authorization to
impose temporary restrictions aimed at addressing balance-of-payments imbalances.
40
CAN member countries are Bolivia, Colombia, Ecuador, Peru, and Venezuela.

73
Table 3.9. Nominal growth rates of major non-oil exports
FOB Dollars Volume
United States United States
1990–99 2000–08 1990–99 2000–08
Fish, shrimp, and other sea products 6% 4% 3% 4%
Flowers 31% 14% 29% 10%
Bananas 3% 3% 1% -2%
Oil derivatives 20% 32% 13% 4%
Cacao 35% 15% 57% 2%
Processed agricultural products 5% 17% 9% 14%
Minerals 80% 30% 15% 0%
Wood and paper 11% 8% 12% 4%
Agricultural products 29% 18% 38% 15%
Colombia Colombia
1990-99 2000-08 1990-99 2000-08
Manufacturing 100% 42% 162% 37%
Fish, shrimp, and other sea products 15% 15% 15% 10%
Processed agricultural products 16% 16% 21% 10%
Minerals 34% 20% 26% 6%
Clothes 579% 18% 554% 10%
Wood and paper 46% 18% 28% 16%
Rubber and plastic products 171% 10% 280% -3%
Peru Peru
1990-99 2000-08 1990-99 2000-08
Processed agricultural products 35% 26% 180% 74%
Minerals 7% 24% 19% 16%
Manufacturing 34% 86% 93% 153%
Wood and paper 36% 19% 26% 16%
Chemical products 40% 15% 50% 24%
Rubber and plastic products 26% 10% 26% 6%
Fish, shrimp, and other sea products 112% 19% 170% 19%
Clothes 480% 18% 299% 82%
Chile Chile
1990-99 2000-08 1990-99 2000-08
Processed agricultural products 30% 29% 16% 13%
Bananas 8% 4% 8% 3%
Fish, shrimp, and other sea products 28% 7% 26% 4%
Manufacturing 78% 142% 1133% 86%
Cacao 7% 17% 10% 1%
Minerals 29% 26% 35% 23%
Flowers 59% 24% 54% 28%
Agricultural products 13% 16% 38% 27%
Source: Banco Central de Ecuador.

74
In general, the average growth rate of exports is lower for 2000-08 than for the 1990-99
period when the main trade agreements took place. A first explanation could reflect the
potential impact of dollarization over exports growth and competitiveness but, as
previously discussed, there is no evidence of significant real appreciation (except in
2008). The lower growth rates in the 2000s could simply imply the convergence of
exports to a more stable pattern, following the initial boom of nontraditional primary
exports in the 1990s, with initial growth rates at unsustainable levels over the medium-
term.
Colombia has historically been Ecuador’s second most important trading partner, but
only a few sectors have gained from freer trade with Colombia. Industrial manufacturing,
especially vehicles and parts, grew from US$86.8 million in 2003 to US$301.4 million in
2008. Clothes and accessories went from US$30.5 million in 1990 to US$53.4 million in
2008). Other beneficiaries have been rubber and plastic products and processed wood and
paper. No other sectors have significantly increased exports to Colombia.
Oil represents 80 percent of Ecuador’s exports to Peru. Non-oil exports to Peru were
limited during the 1990s, partly due to border issues, which ended in 1998, opening the
way to more dynamic trade in the 2000s, especially for processed agricultural products,
minerals, industrial manufacturing, processed wood and paper, and fish and shrimp.
CAN-MERCOSUR free-trade agreement. The pact between MERCOSUR members
Argentina, Brazil, Paraguay, and Uruguay and Andean Community members Colombia,
Ecuador, and Venezuela was ratified in April 2005. It includes a gradual and automatic
tariff reduction, with a specific schedule and scale by country and a pledge not to
introduce new trade barriers.
Focusing on Ecuador’s trade with Argentina and Brazil from 2005 to 2008, Table 3.10
presents export trends for the six most-favored items in terms of tariff preferences and the
six sectors with the largest Ecuadorian exports to the two countries. For example,
bananas had a 100 percent trade preference—a zero tariff—for the entire period, but
exports to Argentina only began to increase after 2007. Despite having a zero tariff for
crude oil, no trade took place because both countries export oil. Fish and shrimp exports
grew as trade preferences increased from 2004 to 2007 but fell in 2008. Arts and
antiques, flowers, and cacao remained marginal in bilateral trade, despite enjoying strong
trade preferences. Some sectors, such as processed agricultural products and industrial
manufacturing, increased the value of exports to Argentina, despite having more modest
reductions in tariffs of 50 percent to 80 percent. This suggests that negotiated trade
preferences had a limited impact on the volume of trade with MERCOSUR (see Table
3.11).

75
Table 3.10. Exports to Argentina: Most favored sectors, 2004–08
*Percentage of completion of the process of removing trade barriers and tariffs Source: Banco Central de Ecuador.
Table 3.11. Exports to Argentina: Sector with highest exports, 2004–08
*Percentage of completion of the process of removing trade barriers and tariffs Source: Banco Central de Ecuador.
Trade
Liberalization
(%)*
Exports (US
Thousands)
Trade
Liberalization
(%)*
Exports (US
Thousands)
Trade
Liberalization
(%)*
Exports (US
Thousands)
Trade
Liberalization
(%)*
Exports (US
Thousands)
Trade
Liberalization
(%)*
Exports (US
Thousands)
Bananas 100% 19,686 100% 18,211 100% 18,017 100% 30,733 100% 48,598
Oil 68% 0 76% 0 84% 0 92% 0 100% 0
Cacao 81% 802 88% 887 95% 473 96% 760 98% 2,478
Fish, shrimp and other sea products 84% 5,153 88% 8,976 92% 12,979 95% 19,918 98% 15,492
Art and Antiques 92% 0 93% 0 94% 0 95% 1 96% 0
Flowers 91% 223 92% 824 93% 972 94% 1,476 95% 1,483
2004 2005 2006 2007 2008
Trade
Liberalization
(%)*
Exports (US
Thousands)
Trade
Liberalization
(%)*
Exports (US
Thousands)
Trade
Liberalization
(%)*
Exports (US
Thousands)
Trade
Liberalization
(%)*
Exports (US
Thousands)
Trade
Liberalization
(%)*
Exports (US
Thousands)
Bananas 100% 19,686 100% 18,211 100% 18,017 100% 30,733 100% 48,598
Fish, shrimp and other sea products 84% 5,153 88% 8,976 92% 12,979 95% 19,918 98% 15,492
Processed agricultural products 56% 6,358 61% 8,853 66% 7,710 72% 16,005 77% 14,474
Manufacturing 51% 1,439 57% 2,018 63% 1,853 69% 4,605 75% 5,103
Cacao 81% 802 88% 887 95% 473 96% 760 98% 2,478
Flowers 91% 223 92% 824 93% 972 94% 1,476 95% 1,483
2004 2005 2006 2007 2008

76
Table 3.12. Exports to Brazil: Most favored products, 2004–08
*Percentage of completion of the process of removing trade barriers and tariffs Source: Banco Central de Ecuador.
Table 3.13. Exports to Brazil: Sectors with highest exports, 2004–08
*Percentage of completion of the process of removing trade barriers and tariffs Source: Banco Central de Ecuador.
Trade
Liberalization
(%)*
Exports (US
Thousands)
Trade
Liberalization
(%)*
Exports (US
Thousands)
Trade
Liberalization
(%)*
Exports (US
Thousands)
Trade
Liberalization
(%)*
Exports (US
Thousands)
Trade
Liberalization
(%)*
Exports (US
Thousands)
Art and Antiques 100% 0 100% 0 100% 0 100% 0 100% 0
Bananas 100% 0 100% 0 100% 0 100% 0 100% 0
Oil (petroleum) 100% 52,128 100% 68,936 100% 0 100% 0 100% 0
Petroleum Derivatives 98% 31 98% 0 99% 0 99% 0 100% 0
Cacao 90% 425 92% 173 94% 0 96% 0 99% 114
Flowers 92% 3 93% 19 94% 81 95% 154 96% 85
2004 2005 2006 2007 2008
Trade
Liberalization
(%)*
Exports (US
Thousands)
Trade
Liberalization
(%)*
Exports (US
Thousands)Trade
Liberalization (%)
Exports (US
Thousands)
Trade
Liberalization
(%)*
Exports (US
Thousands)
Trade
Liberalization
(%)*
Exports (US
Thousands)
Fish, shrimp and other sea products 74% 3,030 80% 3,904 86% 6,118 90% 6,735 95% 11,455
Manufacturing 52% 698 60% 649 68% 1,400 76% 11,614 82% 7,084
Wood and Paper 59% 8 67% 6 75% 26 83% 1,365 88% 3,835
Minerals 67% 106 73% 303 80% 828 86% 1,493 90% 1,892
Chemical Products 64% 11,164 71% 6,073 78% 6,271 85% 3,009 89% 2,027
Processed Agricultural Products 59% 4,527 66% 7,363 73% 6,307 81% 6,320 86% 11,703
2004 2005 2006 2007 2008

77
Turning to Ecuador’s trade with Brazil, none of the six sectors receiving from the
strongest trade preferences posted significant exports, with the exception of oil in 2004–
05, which later fell to zero (see Table 3.12). The gains from all products favored under
the trade agreements added up to less than 1 percent of bilateral trade over the entire
period.
The six sectors with the highest export value to Brazil show a positive correlation
between increasing trade preferences and export growth (see Table 3.13). This is
especially important for processed agricultural products, fish and shrimp, industrial
manufacturing, and processed wood products. As preferences increased from 60 percent
to 75 percent, industrial manufacturing sales to Brazil increased from less than 1 percent
of total exports in 2005 to 28 percent in 2007. The shares of processed agricultural
products and fish and shrimp in total exports fluctuated, but the trend is clearly positive
following the gradual liberalization of trade.
The Ecuador-Chile free-trade agreement. The two countries established their free-trade
agreement in December 1994. After completing a schedule of gradual trade liberalization,
all bilateral trade restrictions were lifted in 2000. Temporary trade restrictions for up to
one year are allowed when the countries face balance-of-payments problems and when
imports temporarily affect local production of similar products. Ecuador’s exports grew
slowly in 1995–2000, but more quickly afterward as full trade liberalization took effect.
Sales of flowers, minerals, processed agricultural products, and fish and shrimp increased
as trade became freer (see Figure 3.13). In contrast, trade liberalization apparently had
little to no effect on other sectors, such as cacao, bananas, and oil.

78
Figure 3.13. Exports to Chile, 1990–2008
(thousands of US$)
Source: Banco Central de Ecuador.
Exports to other countries. Countries that do not grant trade preference to Ecuador are
typically markets for traditional primary exports, such as bananas, oil, fishing, shrimp and
flowers. The main markets without trade preferences are Panama (crude oil and
derivatives), Russia (bananas and flowers), Italy (shrimp and bananas), Spain (shrimp and
fish) and recently China (crude oil). In 2008, exports to these five countries represented
52 percent of all exports without trade preferences and 15 percent of total exports. In
1990-2008, Ecuador’s shipments to countries it does not have trade agreements with
represented an average of 40 percent of total exports (see Figure 3.14). These exports
grew at an average annual rate of 10.9 percent, compared with 13.2 percent for countries
granting Ecuador trade preferences. This suggests that free trade agreements do generate
somewhat more export growth.
0 1000 2000 3000 4000 5000 6000 7000 8000
1990 1992 1994 1996 1998 2000 2002 2004 2006 2008
Cacao Minerals Flowers Agricultural products
0
10000
20000
30000
40000
50000
1990 1992 1994 1996 1998 2000 2002 2004 2006 2008 Processed agricultural products Bananas Fish and shrimp Industrial manufactures

79
Figure 3.14. Export Growth: Free Trade Versus No Preferences
The positive effect of free trade on exports and sector growth seems to depend on the size
of the market granting Ecuador trade preferences and differences in the pre-preference
export mix between the two countries. Ecuador should focus on securing trade
preferences with the largest economies in the world that offer trade complementarities,
whether they are individual countries or groups of countries, such as the European Union.
Furthermore, agreements should be negotiated with a view toward the sectors in which
Ecuador has potential competitive advantages.
Tariff protection and export growth
Ecuador’s decisions on tariffs are partly based on industrial development theories
suggesting that providing temporary tariff protection to some local sectors may give them
time to grow, become more efficient, and compete with the rest of the world. These ideas
have supported some of Ecuador’s decisions on tariffs. However, overly protected sectors
face less market competition and may be less inclined to innovate and introduce efficient
processes, hurting their ability to grow and export. Given these conflicting forces, it
would be useful to evaluate whether Ecuador’s import barriers have contributed to the
development of sectors with export potential.
Based on the country’s existing tariff levels, we constructed effective protection indexes
for the tradable sectors in Ecuador’s national accounts. We estimated an average tariff
level for final products in each sector—considered as the tariff for the final output of the
sector—and then calculated an average tariff for the sector’s inputs from Ecuador’s real
input-output matrix for 2007. The weight of each input in the total output of each sector
is taken as a proxy for the proportion of each imported input used by the sector. In other
words, we make the assumption that the origin is not relevant to determine the
contribution of each input to the final production of each sector. With that assumption,
the calculated average tariffs and effective protection indexes by sector are presented in
Appendix F.
-30%
-20%
-10%
0%
10%
20%
30%
40%
50%
60%
19
91
19
92
19
93
19
94
19
95
19
96
19
97
19
98
19
99
20
00
20
01
20
02
20
03
20
04
20
05
20
06
20
07
20
08
Exports with trade preferences Exports without trade preferences
Total exports

80
Figure 3.1 compares each sector’s current effective protection and real GDP growth in
1993–2007 5.41
As detailed in Appendix F, 18 out of 32 sectors currently enjoy effective
protection levels higher than 40 percent, with levels higher than 80 percent for 6 sectors.
In general, this exercise finds no clear correlation between trade barriers and growth.
Indeed, several sectors with the highest effective levels of protection had below average
real growth. Mills and bakery and metallic products are the clearest cases. Looking only
at the period since 2000, when the crisis years of the 1990s had passed, yields similar
results of no correlation between high tariffs and growth.
Thus, the evidence indicates that a higher growth did not happen in sectors with high
effective protection. In other words, effective protection has not benefitted infant
industries with strong growth potential but rather industries with strong political
connections (some of them with a long history, such as mills). The outcome is not
surprising as a tax on imports is equivalent to a tax on exports.
Figure 3.15. Effective protection and sector GDP growth, 1993–2007
Source: Bank staff estimations.
3.4 CONCLUSIONS AND POLICY RECOMMENDATIONS
The review of non-oil sectors suggests the following conclusions regarding prospects for
growth:
Export diversification has made progress in Ecuador for some primary products, such
as flowers, processed agricultural products, and other agricultural products, and for a
41
This procedure makes the implicit assumption that the country’s tariff structure has not changed much
since 1993. While imperfect, this assumption provides a view of the impact of tariff protection on growth.
Fish Processing
Oil Processing
Other Manufactures
Metallic Products
Vehicles
Mills and Bakery
-20%
0%
20%
40%
60%
80%
100%
120%
140%
160%
180%
-50% 0% 50% 100% 150% 200% 250%
Effe
ctiv
e T
arif
f R
ate
Sectoral GDP Growth Rate

81
few specific industrial products, such as cars. The most dynamic non-oil export
products take advantage of the country’s natural comparative advantages and have
been supported by trade openness, regional trade agreements, and favorable
international markets.
Despite this export diversification, Ecuador’s export basket remains largely
unsophisticated, and export products are generally located far from the dynamic
products in world trade involving high value added.
The adoption of the dollar as a national currency in 2000 has had a positive effect on
private business in virtually all sectors, because it encouraged policy discipline. The
dollarization has given confidence to investors and hasn’t hindered the growth rate of
the non-oil tradable sector.
The distribution of government spending could be improved to support the tradable
sector. Ecuador’s spending levels for education and infrastructure have increased in
recent years, but they remain low compared to those of other Latin American
countries.
The tax side of fiscal policy is not especially problematic in Ecuador, but some
reforms could improve the incentives for overall private sector investment and for the
allocation between tradeable and nontradable non-oil sectors.
In international negotiations, Ecuador has often failed to obtain trade preferences for
its exports, but when it has trade agreements with large and complementary
economies, they indeed helped boost exports.
Protection policies have not led to strong export growth for the most protected
products. The fastest-growing export sectors tend to have relatively low effective
levels of protection, and their success has generally resulted from favorable
international and market conditions and agile private sector strategies, not specific
protectionist policies.
While the government’s industrial policy plans include some areas where the state
could play a useful role in addressing existing weaknesses for business development,
the plan is vague and picking sector winners could end up subject to lobbying.
These results suggest the following policy recommendations:
Implement adequate policies that ensure the sustainability of the dollarization regime.
In a challenging international environment, maintaining and expanding expenditures
for social and infrastructure areas critical to expansion of traded sectors and reducing
poverty will require difficult reallocations away from support for nontraded sectors.
This calls for a thorough review of current spending, including generalized subsidies
on oil derivatives, with the aim to open further fiscal space for more spending on
basic services, such as education and health, and productive infrastructure in the
transportation and energy sectors.
The tax system is not a major hindrance to the tradable sector in Ecuador, but some
areas could be improved. First, many non-tradable goods and services have zero VAT
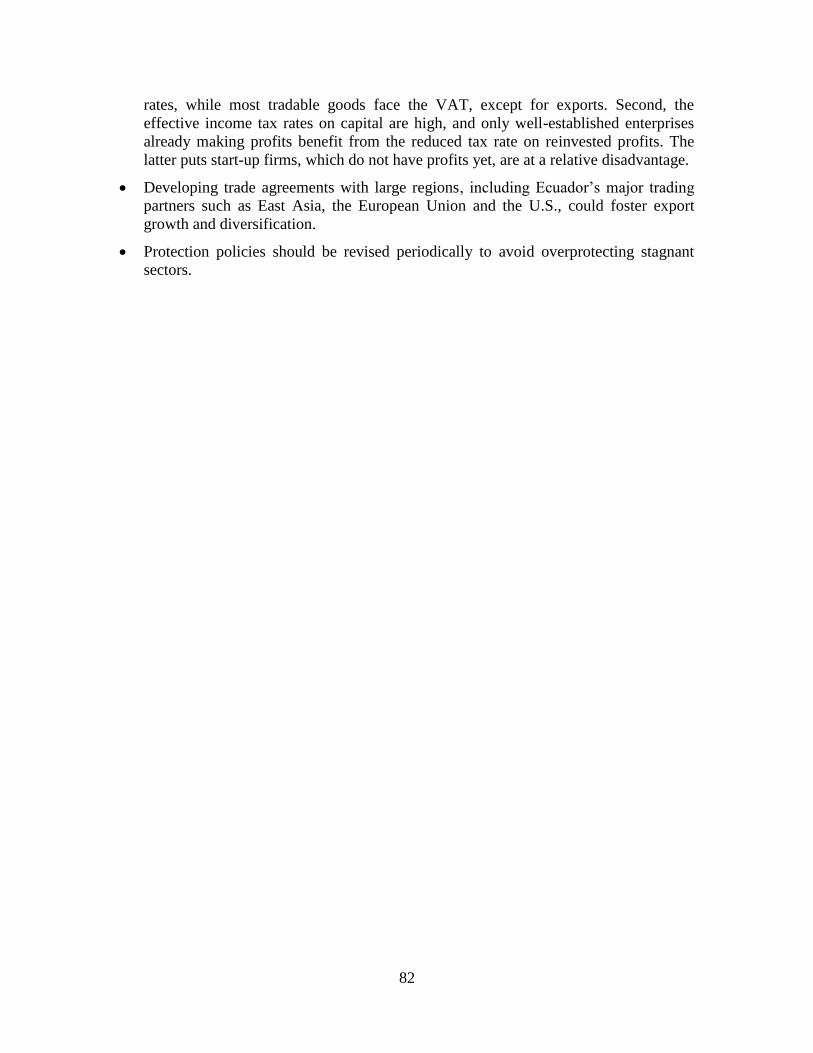
82
rates, while most tradable goods face the VAT, except for exports. Second, the
effective income tax rates on capital are high, and only well-established enterprises
already making profits benefit from the reduced tax rate on reinvested profits. The
latter puts start-up firms, which do not have profits yet, are at a relative disadvantage.
Developing trade agreements with large regions, including Ecuador’s major trading
partners such as East Asia, the European Union and the U.S., could foster export
growth and diversification.
Protection policies should be revised periodically to avoid overprotecting stagnant
sectors.

83
4. MANAGING NATURAL RESOURCES AND
PROMOTING DIVERSIFICATION IN OTHER
MINERAL-ABUNDANT COUNTRIES
As discussed in the preceding chapters, promoting sustainable growth in Ecuador will
require both better management of the oil sector and an improved business climate for
non-oil sectors. Other nations with abundant mineral resources have dealt with these
issues, with varying degrees of success. This chapter looks at some of the experiences.
Section 4.1 provides an overview of diversification among Latin America and Caribbean
countries. Section 4.2 looks at the natural resource management and diversification
experiences of three resource-abundant LAC countries in greater detail —Chile, Mexico,
and Trinidad and Tobago. These countries share three other characteristics with
Ecuador—middle income level, democracy, and a large workforce that needs
employment in non-oil sectors. Section 4.3 widens the perspective by examining the
experiences of some Persian Gulf countries. Section 4.4 concludes with lessons for
Ecuador to improve the management of its oil wealth and to lay the groundwork for
further diversification
4.1 REGIONAL OVERVIEW
In terms of exports and the orientation of the overall economy, most countries in Latin
America and the Caribbean (LAC) have become more diversified and more oriented
toward manufacturing over the past four decades. Aside from Venezuela, the countries
have expanded their range of exports. This diversification has not diminished the mineral
export sectors in absolute terms, but other sectors’ export shares have grown more,
especially manufacturing in most countries.
Table 4.1 shows more details on exports in the major LAC countries and verifies the
trend toward diversification. For all but one of the eight countries, including Ecuador, the
combined export share of the top two categories declined from 1962 to 2005, often
dramatically. In 1962, the top two categories’ share was more than two-thirds in five of
the eight countries; by 2005, it was that high in only two countries—Venezuela and
Ecuador. And for Ecuador, the top two categories’ share fell from 85.5 percent to 71.5
percent, suggesting some diversification in exports. There has been some stability amid
the diversification: four of the eight countries had one commodity that stayed among the
top two exports in all four years, and the other three had one commodity that showed up
in three of the four years.

84
Table 4.1. Top two principal commodity exports for select countries in Latin
America and the Caribbean, 1962–2005
(% of total exports)
Source: Calculations are based on WITS database, SITC Rev 1 at the four-digit level.
One reason often cited for poor outcomes in resource-dependent economies is
governments’ dependence on revenues from mineral exports, rather than taxes on citizens
who might demand accountability. Table 4.2 shows the pattern of revenue dependency in
the early 2000s—before the latest boom of commodity prices, which increased the shares
of fiscal revenues from mineral-industry taxes and royalties. The wide variations do not
seem closely correlated with quality of governance (See Table 4.2 and Table 4.5).
Table 4.2. Dependency of fiscal revenue sources:
Commodity revenue as a share of fiscal revenues, 2000–05
Country Commodity % of government revenue
Argentinaa Agriculture commodities 17.0
Bolivia Hydrocarbon 20.9
Colombia Hydrocarbon 10.0
Chile Copper 9.4
Ecuador Hydrocarbon 26.0
Mexico Hydrocarbon 33.3
Peru Gold, copper, silver 3.3
Trinidad and Tobago Hydrocarbon 41.5
Venezuela Hydrocarbon 48.8
Source: IMF 2007.
a. Based on export taxes from World Development Indicators.
1962 1975 1990 2005
Cereals Cereals Cereals Petroleum and petroleum products
28.7 37.4 11.8 13
Meat and meat preparations Meat and meat preparations Feed stuff for animals Feed,stuff for animals
18.7 9.7 9.7 10.1
Coffee, tea, cocoa Coffee, tea, cocoa Iron and steel Iron and steel
57.2 15.1 11.4 7.7
Textile fibres, not manufactured Sugar, sugar preparations and honey Metalliferous ores and metal scrap Metalliferous ores and metal scrap
11.6 13.4 8.5 6.9
Non-ferrous metals Non-ferrous metals Non-ferrous metals Non-ferrous metals
66.3 61.6 43.4 30.7
Metalliferous ores and metal scrap Metalliferous ores and metal scrap Fruit and vegetables Metalliferous ores and metal scrap
15.5 8.2 10.9 24.9
Coffee, tea, cocoa Coffee, tea, cocoa Petroleum and petroleum products Petroleum and petroleum products
71.6 46.3 28.8 27
Petroleum and petroleum products Petroleum and petroleum products Coffee, tea, cocoa Coal, coke and briquettes
14.7 7 22.2 12.6
Fruit and vegetables Petroleum and petroleum products Petroleum and petroleum products Petroleum and petroleum products
53.9 60.4 51.9 58.4
Coffee, tea, cocoa Fruit and vegetables Fruit and vegetables Fruit and vegetables
31.6 14.5 17.7 13.1
Textile fibres, not manufactured Petroleum and petroleum products Petroleum and petroleum products Petroleum and petroleum products
20.7 15.4 36.4 14.61
Non-ferrous metals Non-ferrous metals Fruit and vegetables Fruit and vegetables
13.3 9.5 5.6 2.41
Meat and meat preparations Meat and meat preparations Petroleum and petroleum products Oil-seeds, oil nuts and oil kernels
22 17.9 36.4 35.9
Wood, lumber and cork Wood, lumber and cork Textile fibres, not manufactured Meat and meat preparations
19.9 13.3 34.5 15.1
Petroleum and petroleum products Petroleum and petroleum products Petroleum and petroleum products Petroleum and petroleum products
92.1 92.7 79.7 88.2
Iron and steel Metalliferous ores and metal scrap Non-ferrous metals Iron and steel
4.8 3.2 5.2 4.2
Ecuador
Mexico
Peru
Venezuela
Argentina
Brazil
Chile
Colombia
85
Neither mineral exports nor diversification are ends in themselves. Mineral exports can
provide countries with financial resources for development investments as well as some
consumption. Diversification is an intermediate outcome that may help increase
employment and value added per worker. To discuss the international experience, this
chapter considers four types of policies that can support production and employment
growth in export sectors: promoting efficient growth in the extractive industry,
maintaining fiscal balances, public spending that specifically supports export sectors, and
other policies to improve the business environment for tradable sectors.
4.2 EXPERIENCES IN THREE LAC COUNTRIES
Chile, Mexico and Trinidad and Tobago offer three contrasting experiences with
managing mineral resource extraction and revenue and with fostering diversification of
the rest of their economies. Table 4.3 shows an overview of the shares of their main
minerals in export earnings and in fiscal revenue. For Chile and Trinidad, mineral exports
are a large share of the total exports—half or more in 2008—, but much less in Mexico—
under 20 percent even in 2008. Fiscal revenue shares are higher in Mexico and Trinidad,
but much lower in Chile. Both Chile and Trinidad substantially increased their fiscal
revenue shares in 2005-08, in part because the generous tax treatment for private mineral-
extraction firms expired in those years.
Table 4.3: Shares of minerals in export earnings and in fiscal revenue
Sources: Banco Central de Chile (Sintesis Estadistica de 2000 y 2008); Banco Central de
Mexico (Informa Annual, 2000 y 2008); Central Bank of TT&T, Annual Economic Survey 202
and 2008.
Chile
Chile has been a major copper exporter since the mid-20th century, and before that it was
a major source of nitrates. The country has not always used this mineral abundance to
support balanced, poverty-reducing growth, but it has done relatively well for the past
two decades.
Amid much controversy, a newly elected socialist government nationalized the copper-
mining industry in early 1973. When a right-wing military government took over later
that year, it retained the nationalization, but it liberalized much of the rest of the economy
by the late 1970s. Many state enterprises were privatized. Excess spending and borrowing
during the copper boom of the 1970s led to economic crisis in the early 1980s. After that,
the government undertook a wide range of reforms, including some to improve
management of financial flows from copper. The fiscal reforms have continued to deepen
since 1990 under democratic left-center governments.
Share of Export Earnings Share of Fiscal Revenue
2000 2008 2000 2008
Chile 37.9% 50.4% 3.1% 13.6%
Mexico 9.8% 17.4% 31.2% 36.8%
Trinidad y Tobago 65.3% 70.0% 34.3% 54.5%

86
At first, the copper price and revenue stabilization fund was separate from the rest of
public finances. But Chile has increasingly integrated institutions for stabilization within
the overall public finance framework, set by the fiscal surplus rule (discussed below).
Chile has a unitary government (not federal), and public finances have remained
centralized, although the government has decentralized the execution of a growing
number of public services. This contrasts with some other unitary but increasingly
decentralized countries, such as Colombia and Peru, and even more with decentralized
federations, such as Argentina, Brazil, and Mexico. As a result, the national government
has had to manage almost all of the volatility in public finances arising from the
fluctuating mineral prices.
The copper sector still looms large in Chile’s export profile and in its public finances,
particularly in times of high prices. Copper was over 60 percent of exports in the 1960s
and 70s, only 30 percent in the early 2000s, but back up to 57 percent in 2006. Copper
provided over 60 percent of fiscal revenues in 1989-91, dropped under 2% by 1998, and
rose to 16 percent in 2005. Even so, the country has done well in diversifying its GDP
and exports—especially high-value agricultural exports, an accomplishment evident in
the wine and produce sections of stores in Europe and the US. As in Ecuador, factor
inputs to Chile’s mineral sector do not take significant resources away from other sectors.
The industry relies on underground copper deposits and has minimal need for above-
ground activities. Its labor force consists of a small number of internationally mobile
workers in a highly mechanized sector. Capital for such a sound investment is readily
available on the international market.
The government uses revenues from the copper sector to pay for investments in
infrastructure and human capital, which benefit non-mineral sectors in the long term, and
for social protection programs, such as a pension fund for low-income aged persons..
Chile has been a leader in implementing efficient budgeting practices, with strong
programs to assure good performance. The government owns the largest copper company
and runs it like a business—not a social welfare agency, cash cow, or fiefdom of union
workers. Since the late 1970s, Chile has had an open regime for private investment in the
sector by multinational or Chilean firms. Since the 1990s, private copper firms have
grown faster than the state company, and they now produce most of the copper output
and exports. The state firm still accounts for more of the state’s revenue. Corporate tax
rates, including the levies in the mineral sector, are modest—17 percent—but accelerated
depreciation allowances made the effective rates much lower for many years. The rate is
low by international standards and helped make investment in the sector attractive—
perhaps more attractive than necessary, at least in retrospect.42
Since 2000, Chile has conducted its fiscal policy in accordance with a structural surplus
rule. The rule deepened a commitment to fiscal responsibility developed in the mid-1980s
by introducing a more explicit medium-term orientation. Initially, it was not enshrined in
law, but this changed with the Fiscal Responsibility Law in 2006, which set the procedure
42
The Disputada mine, owned by Exxon, exported over 5 million tons of copper from 1978 to 2002, but paid no income tax in that period (Aguilera 2004).

87
but not the percent that had to be set aside and also introduced new rules on the
investment of accumulated assets. The executive can vary the set-aside rate, and has
done so.
The structural surplus rule implies countercyclical behavior of ex ante
government surpluses. In its original form, it stated that the central government’s overall
structural balance each year should equal a surplus of 1 percent of actual GDP.43
The
structural surplus target was changed to 0.5 percent of GDP, effective 2008, and in the
context of the global recession target went to zero in January 2009—effectively
suspending it. A positive target is expected again from 2010 onwards. The structural
balance equals structural revenue plus interest on net government assets, which are
positive in Chile, minus actual expenditures on goods and services. Structural revenue is
determined by two independent panels of experts and reflects what tax revenue would
have been if the economy had operated at potential rather than actual output and what
copper revenue would have been at a long-term world reference price rather than the
actual price. The rule, therefore, specifies permissible annual expenditures on goods and
services as a residual, derived from the target values, structural revenues, government
asset levels, interest rates, and GDP. The resulting countercyclicality of fiscal deficits
isolates government expenditures on goods and services from the cycle and keeps them
growing with trend output. No distinction is made between government consumption and
investment expenditures because this is difficult to do in practice.
Consistent surpluses imply significant asset accumulation by government. The surplus
rule was adopted with the intent of providing for future social commitments and
addressing contingent liabilities. The Fiscal Responsibility Law formalized this by
establishing rules for allocating the surpluses, stipulating investments in a government
pension fund, gradual central bank recapitalization, and a fund for economic and social
stabilization. When the surplus target was lowered during the recession, the additional
resources that became available for current spending were devoted to education and other
pro-poor measures. Application of the rule during the copper boom led to the
accumulation of substantial savings in the two stabilization funds, which meant that the
government was not credit constrained in the crisis. Hence it could announce in early
2009 that it would use US$4 billion in a large-scale fiscal stimulus to counteract the
global recession’s impact on Chile.
While the details of Chile’s fiscal rule are important, they should not be regarded as a
magic bullet. The deeper roots of success lie in the social consensus on the need to avoid
disruptive fiscal policy, to respect the rules that guide fiscally responsible behavior (even
before they are enshrined in law), and to follow a participatory but legally defined
process for setting the fiscal regime’s parameters. Extensive public and congressional
discussion focuses on assumptions for copper’s long-term price, long-term sustainable
growth rates, and the definition of full employment. In short, success has depended a lot
43
In the context of the global recession, Chile reduced the structural surplus target to zero in January
2009—effectively suspending it. A positive target is expected again from 2010 onwards.

88
on a political process of building consensus behind the technocratic mechanisms for
setting fiscal policy.
Besides improving fiscal policy, Chile has for over two decades followed policies that
assured a competitive and sustainable real exchange rate, relatively open international
trade, and moderate business regulation. Private sector firms of all sizes have grown in
this environment, and they now constitute a formidable interest group, spanning the
political spectrum and making continuation of the policies more likely. The credibility of
pro-growth policies had to build over time.
The Chilean experience holds four key lessons for Ecuador:
Private firms can operate alongside a state company in the mineral sector,
producing output and revenue that might be lost if the state firm had a monopoly.
A stabilization fund can make public finances smoother and more predictable.
They can assure that the government has resources to maintain social services
during a price downturn and to conduct countercyclical fiscal policy.
Trade liberalization, unilaterally and with bilateral treaties, and stable business
regulation has led to growth of non-mineral tradable sectors.
Public information and discussion of these policies has helped to build consensus
behind them and to make them more credible to investors.
Mexico
For much of the 20th
century, Mexico’s economic growth rose and fell with world oil
prices. In the oil boom of the 1970s, the government spent its receipts and more, taking
advantage of easy access to credit to borrow heavily. This led to the debt crisis of 1982
and its volatile aftermath. Since the early 1990s, however, Mexico has diversified away
from oil as the driver of growth and, to a lesser extent, as the main source of fiscal
revenue. From 1990 to 2005—just before oil prices and GDP really jumped—Mexico’s
purchasing-power adjusted GDP per capita rose from US$9,176 to US$11,387.
Government revenue depends disproportionately on oil, and fiscal policy has micro-
managed the sector since the 1980s, when Pemex, the national oil company, was brought
inside the government budget. The company’s net revenue from exports and domestic
sales became part of the government’s revenue. Pemex pays more than 60 percent of its
revenue in royalties and taxes (Lajous in Levy and Walton 2009). This contributes a large
portion of the budget of the federal government—more than 40 percent in boom years.44
With oil prices falling in the past year, the situation has worsened. Pemex experienced a
net loss of 27 billion pesos (US$1.9 billion) in the first quarter of 2009.
Appropriations for Pemex investments pass through the regular budgetary process. These
appropriations have usually been much lower than what sound business considerations
44
After the fiscal reform in 2005, the rates changed, the fiscal treatment was different for exploration and
production and the rest of Pemex’s activities got a standard income tax regime.

89
would warrant. In recent years, the difficulty of getting government funding has forced
the company to finance much of its investment through massive borrowing, and it now
owes US$46.1 billion, including US$14.4 billion in off-balance-sheet debt. A lack of
investments has prevented the addition of adequate refining capacity. Pemex also lacks
the money or technical capability to tap deepwater offshore fields.
Pemex’s oil output dropped 9 percent in 2008 to about 2.8 million barrels per day. More
glaring, production is down from 3.8 million barrels per day in 2004. Pemex faces a
constitutional ban on partnerships with foreign companies, which would entail foreign
ownership of part of Mexico’s oil output. The ban rules out joint-venture or production-
sharing agreements, the common practices for risk sharing and attracting foreign
investment. After attempts to enact constitutional changes to allow these agreements
failed, the Mexican government passed an energy reform package in October 2008 that
will restructure Pemex to improve efficiency and allow the company to hire international
oil companies, increasing access to technological expertise (Stratford Global Intelligence,
January 20, 2009). As of September 2009, Pemex had not yet reached any deals under
this new arrangement.
To deal with volatility of oil prices, Pemex has been using the forward market on behalf
of the Ministry of Finance. To safeguard against an unexpected drop in oil prices, the
authorities hedge 70 percent of Pemex gross exports at the budgeted price of US$70 per
barrel for the Mexican oil mix. The Ministry of Finance made profits from this of over a
US$ 1 billion in 2008.
Mexico has not developed other major mineral extraction activities. Silver, once the
source of enormous wealth, has continued to decline. Natural gas has been a missed
opportunity—at least so far. Pemex lacks the technical know-how to exploit the gas from
deepwater fields, and legal constraints have prevented substantial participation by
multinational companies with the necessary expertise. So the country imports substantial
amounts of natural gas, even though it has large proven and suspected gas reserves.
Mexico’s overall macroeconomic management has improved significantly since the
tequila crisis in the mid-1990s. Congress has reined in the president’s discretionary
spending, and federal budgets now take serious aim at multiyear targets for fiscal
balance. The government has gained investment-grade status for its bonds, prepaid a lot
of its expensive internal and external debt from the 1990s, and built up reserves during
the oil boom. Tax reform has been implemented, despite congressional opposition that
kept the government from going as far as it wanted. In addition, tax administration has
been strengthened. Tax revenues have grown as a share of GDP since 2005—even though
oil revenues were booming. This is a significant improvement over the past, when the tax
effort increased only as needed and relaxed when oil revenues were high (World Bank
2002).
The quality of public spending has improved over the past 20 years, mainly by including
low-income groups in programs for education, health, and income protection, notably
conditional cash transfers (World Bank 2004b, 2006b). In the long run, this may auger
well for diversification, but it probably has done little in the short and medium term to
90
promote export industries’ growth. Educational quality—the social spending that
probably provides the most benefits for export competitiveness—remains poor by
international standards.
Investment in electric power, transport, and communications—key for growing export
industries—has a mixed record in Mexico. By constitutional provision, electric power
remains a government monopoly. Generation capacity and distribution systems have not
improved much in the past 20 years; now, Mexico lags many other Latin American
countries and East Asia in this area. In transport, the public sector remains dominant,
except for trucking. Some components of the transport network have been improved,
notably the interstate highways, railroads, and some aspects of airports and seaports. The
weak points are often at the transfer points between modes—truck to rail, rail to sea, and
so forth. Despite their country’s proximity to the US, Mexican producers’ costs of
shipping to the US are often higher than their Chinese competitors (World Bank 2005a).
Telecommunications in Mexico were privatized in the 1980s, and service has improved
greatly—an important plus for exporters. However, the privatized system is a virtual
monopoly, and services are overpriced relative to other LAC countries. This puts a
damper on use of an important input to other businesses.
Mexico’s exchange rate and trade policies have improved considerably since the mid-
1990s. In the past, an unsustainable exchange-rate peg was maintained until it collapsed
spectacularly. Mexico’s currency is now allowed to float fairly freely, with interventions
to dampen short-term volatility but not to prevent responses to shifts in fundamentals. For
instance, the peso’s value against the US dollar has fluctuated in response to the recent
movement of oil prices—appreciating in 2006–08 and depreciating since late 2008.
Maintaining a better fiscal balance has been crucial to accepting flexible exchange rates.
Trade policy has become much more open, notably with the North American Free Trade
Agreement (NAFTA) and other bilateral agreements. This has intensified the links
between the Mexican economy and the rest of North America. On average this has had
benefits, but it has made Mexico more sensitive to economic fluctuation in the US.
NAFTA has also strengthened the interest groups in favor of economic integration and a
business-friendly regulatory environment. Business regulations are still somewhat
problematic on paper and present opportunities for corruption and cronyism in practice
(World Bank 2009). Nonetheless, business practices are improving through more
efficient and less personalized regimes, which reduces opportunities for corruption.
Mexico has also successfully diversified into the tourism sector, which is the largest
earner of foreign exchange in years of average oil prices. The government promoted this
with infrastructure investment, environmental protection, improved immigration and
customs administration (including reduced corruption), and investment-friendly
regulation for domestic and international hotel chains.
For Mexico, the most improved policy areas for supporting non-oil exports and overall
growth have been in fiscal stability and other policies, especially improved trade
relations, more business-friendly regulation, and flexible exchange rates. Weak points
have been the poor quality of public education, inadequate infrastructure for export

91
logistics, and the poor treatment of the extractive industries, especially Pemex. The
national oil company faces problems with internal management, fiscal treatment, and the
exclusion of foreigners that could bring needed expertise; recent legal changes may
address some of these problems, but remain to be implemented.
Trinidad and Tobago
In the 1980s, Trinidad and Tobago’s economy suffered serious disruption from the after-
effects of overexpansion during the oil boom of the previous decade. The country made
the classic mistakes—unsustainable public spending as well as subsidies and protectionist
measures for inefficient nontraded and import-competing sectors (Velculescu and Rizavi
2005).
Since the 1990s, Trinidad and Tobago has made progress in several areas. The energy
sector is still predominant—41 percent of GDP in 2003, two years before the 2005–08
runup in oil prices. The sector has become more diversified as it grew. Crude-oil exports,
once predominant, have become relatively less important, with the growing importance
of oil refining, the extraction and liquefaction of natural gas, and petrochemicals―all
largely for export. Liquefied natural gas sales are mostly under long-term contracts,
which provides more stability to the economy and fiscal accounts. This results mostly
from a characteristic of the natural-gas industry—the need for large up-front investments
in transportation infrastructure and conversion plants, both at the supplier and recipient
ends. This characteristic not only leads to long-term contracts but also requires that both
parties have a reputation for reliability and compliance with contract terms.
Trinidad and Tobago shows the results and some of the pitfalls of an energy-based
industrial policy. The provision of heavily subsidized natural gas to the local
petrochemical industry has led to strong growth but to inefficiency as well. The price
paid for gas does not fully cover the opportunity cost of not exporting from existing fields
or the cost of exploring new, less accessible fields. Foreign investors have been reluctant
to come into the new fields without some relief from the obligation to make a substantial
share of new gas production available to domestic users at the subsidized price. The
political influence of these gas users has so far blocked agreements to allow more output
to be sent abroad, where it has the highest market value.
In 2005, the International Monetary Fund rated Trinidad and Tobago as having the best
macroeconomic performance in the English-speaking Caribbean (IMF 2005). During the
recent boom, the government brought its debt down from more than 50 percent of GDP in
the 1990s to 16 percent in 2007, with external debt reduced to only 6 percent.
International reserves grew to more than 30 percent by 2007. Public expenditures as a
share of GDP declined from 28 percent in the mid-1990s to 24 percent in 2003–04, but
they rebounded to 30 percent by 2008 (World Bank 2005b; IMF 2009).
Beyond the energy sector, Trinidad and Tobago has established itself as the Anglophone
Caribbean’s main industrial and financial center through growth in the high-tech ferrous
metal, plastics, and petrochemical industries and banking and insurance. Although it has
half the population of Jamaica, Trinidad and Tobago’s total GDP is larger. Its greater

92
macroeconomic stability makes it (along with Barbados) an attractive locale for financial
firms. The private sector’s diversified growth has occurred in part thanks to an “open
investment climate” (U.S. State Department Web site on Trinidad and Tobago, March
2009). The World Bank (2009) gives a less favorable assessment of the de jure regulatory
environment. Foreign direct investment averaged 8 percent of GDP in the 1990s and 9
percent in 2000–02; in 2008, it jumped to about 12 percent but has since dropped below 5
percent, showing this activity’s volatility in a small economy.
The exchange rate has been de facto fixed since at least the 1990s. Relative to Ecuador,
with its dollarization, Trinidad and Tobago shows that a hydrocarbon-exporting economy
can have growth and stability with a fixed exchange rate, even in the long run. To do this,
however, the country needs to develop fiscal institutions to ensure that fiscal policies can
adjust with circumstances. A small economy will not likely have the fiscal space to
conduct truly countercyclical fiscal policies, but by saving during boom times, as
Trinidad did, it can minimize the extent to which its fiscal policy is procyclical.
Spending on education averaged 3.75 percent of GDP in 1995–2002, more than a
percentage point less than the Caribbean average and also below the Latin American
average of 4.0 percent (World Bank 2005b: 36). Nonetheless, education in Trinidad and
Tobago seems relatively good, with 99 percent literacy and children not leaving school
until after 11 years on average. The entire adult population has an average of 7.8 years of
schooling, well above the 6.0 years for all of the Caribbean and 6.3 years for all of Latin
America. Like the rest of the Caribbean, the labor market is very open internationally. So
the quality of the labor force depends more on effective demand and improving living
conditions, which are necessary conditions to attract qualified labor from the rest of the
Caribbean, repatriate the Trinidad and Tobago diaspora, and retain workers from the pool
of local graduates. In this, the country has done relatively well for the subregion, with
strong labor reforms in the 1990s (World Bank 2005b).
Trinidad and Tobago had low public investment in the 1990s, spending only an average
of 1.8 percent of GDP in 1995–2003 (World Bank 2005b). In the past decade, however,
public investment grew strongly, going from 4.2 percent of GDP in 2003 to more than 10
percent by 2006 and afterward (IMF 2009). Infrastructure is adequate on average—good
for the export sectors and substandard for domestic residents, especially in rural areas.
The private sector is probably responsible for much of the infrastructure to support
exports of minerals in raw and processed form.
Trinidad and Tobago has had considerable success in keeping the hydrocarbon export
sector growing by forming joint ventures with foreign investors, in getting a good share
of revenue from the boom with a price-sensitive tax regime on those investors, in using a
fixed exchange rate and a rule-based stabilization fund for economic stability, and in
providing an open investment climate to promote some diversification beyond the
hydrocarbon sector. The policy of subsidizing hydrocarbon inputs relative to world prices
for downstream processing industries has contributed to their growth—but only with a
high cost to public finances and without much payoff in terms of domestic employment.

93
4.3 EXPERIENCES IN THE PERSIAN GULF
While the Gulf Cooperation Council (GCC) countries seem quite different from Ecuador,
they share an intense interest in diversification. Qatar,
Bahrain, Dubai and Oman face an end to economically
extractable oil reserves in the next decade or two, while
Saudi Arabia and Kuwait have massive reserves that
will allow production to continue for at least two more
generations (see Table 4.3).45
Unlike Ecuador, none of
them has a largely poor national population and
predominately low-wage labor.
The GCC countries are pursuing three types of
diversification strategies.
Countries have sought to develop natural gas resources to supplement oil for use
in domestic power generation, as feedstock to the petrochemical industry, or as an
additional source of export earnings via pipeline or liquefaction.
Countries have attempted to move beyond the basics of crude-oil production to
complex refining and industrial sectors. Some have focused on such energy-
intensive industries as aluminum, petrochemicals, and plastics. Qatar has taken
aim at the supply chain for liquefied natural gas exports, including ships and
receiving terminals in the destination countries.
Perhaps best corresponding to the common understanding of diversification, the
countries have supported development of non-energy sectors as sources of growth
and employment for nationals.
Oil abundance plays an important role in determining the relative importance of each
type of diversification in each country. In Saudi Arabia and Kuwait, where crude oil
reserves are large, the main priority has been adding refining capacity, developing gas as
a substitute for domestic oil use, and expanding into petrochemicals. Qatar and Oman
have low oil reserves and view the mainstay of their economies as natural gas, whether
used for export or domestic industry. Bahrain is already a crude oil importer. The United
Arab Emirates is more complex because most oil reserves belong to a single emirate—
Abu Dhabi. The other emirates have by necessity looked for non-energy sources of
45
Among the resource-rich countries in the Middle East and North Africa, only Algeria shares with
Ecuador the combination of democracy and a large, mostly poor labor force. With the hydrocarbon sector
accounting for 60 percent of budget revenues, 30 percent of GDP, and more than 95 percent of export
earnings, Algeria does not present a successful model of diversification (World Bank 2008, MENA Region:
2008 Economic Developments and Prospects, p. 7; Wikipedia: Algeria, 11 August 2009). Elsewhere,
Malaysia is an oil producer comparable to Ecuador with successful diversification and democracy. The oil
comes from two provinces on the island of Borneo, which is widely separated from the rest of the country
on the mainland peninsula. Substantial fiscal revenue from this enclave has helped finance public spending
in support of diversified agriculture and industry on the mainland, although the main impetus for
industrialization has come from regulatory and tax policies that encouraged local private and foreign direct
investment (Nabeshima and Yusuf 2009).
Table 4.3: GCC Oil Reserve Estimates (billion barrels)
Saudi Arabia 264.2
United Arab Emirates 97.8
Kuwait 101.5
Qatar 27.4
Oman 5.5
Bahrain n/a
Source: BP Statistical Review 2007

94
growth, while policymakers in Abu Dhabi have been concerned about being too exposed
to oil-sector volatility.
GCC diversification strategies are also influenced by employment concerns. The core
energy sector is highly capital-intensive and offers limited employment prospects. This is
especially pertinent in light of the open but temporary immigration of low-cost labor,
which has created a segmented economic structure. Most nationals work in high-salary
occupations for the government, while low-cost migrant labor works in a construction
and the services-dominated private sector. Since many GCC nationals show a preference
for public-sector employment, they have a high reservation wage for occupations in
tradable sectors.
The GCC countries have pursued the diversification objectives within similar institutional
and macroeconomic policy frameworks. All countries but Kuwait maintain long-standing
exchange-rate pegs to the dollar. Kuwait has a basket peg dominated by the dollar. The
countries rely on a dominant national firm in the oil sector but have been open to
significant foreign participation in natural gas.46
Oil revenue is cautiously managed;
budgets are typically prepared based on reference oil prices somewhat below prevailing
market prices, with “windfalls” going to stabilization or future generations funds
managed outside the budgetary process. As a result, public expenditure changes only
slowly over the commodity price cycle, with reserve funds used to smooth spending in
the face of revenue fluctuations.
A new generation of funds has emerged in tandem with the increased emphasis on
diversification. These vehicles are given an objective linked to industrial strategy,
diversification, or other policy goals of the government. The new funds may be
capitalized from existing funds or earmarked revenues but may also take on some debt.
Examples include Mubadala in Abu Dhabi, the Qatar Investment Authority, and various
tourism development corporations. This illustrates an important point about economic
GCC countries’ diversification: with limited exceptions, the government plays a
dominant role in its implementation. Diversification had not emphasized attracting the
private sector; indeed, the policy environment for foreign private investors has
traditionally been difficult, featuring requirements for majority local ownership and high
corporate tax rates.
GCC diversification strategies have had mixed outcomes. Natural gas offers an attractive
source of feedstock or power for domestic industry, permitting a higher exportable
surplus of crude oil. However, countries have found that exploration and extraction costs
for gas are substantial, and governments have been reluctant to bear the full risks on their
own. In addition, gas may diversify away from oil but it still leaves the country exposed
to energy-price swings, with the additional complication that specialized factors in gas
46
Petroleum Development Oman is not a national oil company in the strictest sense because it has some
private ownership and operates under a concession from the government. But it is majority owned by the
government and dominates the upstream oil sector in Oman.

95
production and marketing create higher risks than oil. Nevertheless, GCC countries
continue to view natural gas as a key pillar of their diversification strategies.
GCC diversification has usually emphasized energy-intensive industries. Bahrain
provides a noteworthy example. It now operates one of the world’s largest aluminum
smelters, which runs on gas-fired power and is easily the country’s largest source of non-
oil exports. The underlying advantage is the ability to offer low energy prices, which can
make it economical to ship raw material inputs across huge distances—for example,
bauxite from West Africa or Australia. Bahrain also refines and exports crude oil it
imports from Saudi Arabia.
Other GCC countries have established a substantial presence in petrochemicals, and
homegrown heavy industry firms like Saudi Arabian Basic Industries (Sabic) are now
among the large global players in this sector. Although these companies have
successfully nurtured an elite managerial tier among nationals, their overall employment
impact is small. Furthermore, the global financial crisis highlighted the cyclicality of
energy-linked industries, illustrating again the challenge of achieving real diversification
while remaining specialized in energy.
Finally, the Gulf countries with limited or declining hydrocarbon resources have looked
for sources of growth outside the energy sector, with the most significant examples being
financial services, logistics and communications services, tourism, and real estate. The
general rationale has been that the energy-rich and rapidly growing GCC region offers
substantial opportunities for countries well positioned to meet the associated demand for
services like financial intermediation, travel, and property. Bahrain and the UAE have
had the most success with this strategy, but elements of it are cited by policymakers in
every GCC country.
This service-sector strategy has had some notable successes. Notwithstanding the effects
of the financial crisis, Dubai has produced one of the world’s largest and most efficient
port operators (Dubai Ports World); Bahrain has a major presence in some important
financial sector niches (like Islamic finance); and several GCC-based telecom firms have
expanded beyond their bases to develop new markets, especially in Africa. In Dubai and
Oman, the strategy has been implemented by majority or wholly state-owned companies.
Other governments have let the private sector operate within a relatively liberalized
market framework, like Bahrain’s financial sector and Kuwait’s telecommunications
market.
The strategy has fared less well, however, as a way to reduce macroeconomic risk. As a
result of diversification, several GCC countries ended up with heavy exposures to the
financial sector and real estate—the sectors hit hardest by the global crisis. Furthermore,
entry into these sectors has often involved the megaproject, a debt-financed large-scale
property development with a planned cluster of banks, hotels or whatever was the
industry of focus. These projects typically had high import content both for labor and
materials, and their debt-dependent financing structure left them vulnerable to the credit
crunch of the past two years. After the initial gross investment boost wears off, the long-
term contribution of these projects to GDP is less clear. In many GCC countries, there

96
remains a “missing middle”—a high value-added non-energy sector capable of providing
productive job opportunities for nationals.
The experience of the GCC countries shows how budget surpluses and fixed exchange
rates can contribute to macroeconomic stability, even when there is high dependency on
hydrocarbon exports. The experience also shows that even successful development of
downstream hydrocarbon-processing industries does not insulate the economy from
global shocks or solve the problem of employing a larger share of the nation’s workers in
tradable sectors.
4.4 CONCLUSIONS
Table 4.5 summarizes the international experiences that might provide some lessons to
help Ecuador to lay the groundwork for further economic diversification, growth
stability, and poverty reduction over the medium term:
Take advantage of opportunities that arise from mineral-resources revenues. When
the revenues are temporarily high because of an upswing in international prices or
because of a peak in supply for export, the challenges are to increase spending with
efficiency, quality, and restraint and save enough resources in good years to sustain
spending during recessions.
Keep investing in the mineral industry. Growth of the mineral sector is not a
problem in itself. Revenues from minerals can potentially overcome many other
constraints on growth. Chile lets its nationalized mining sector operate on a relatively
commercial basis, and it has allowed private competition to grow within the sector,
achieving growing output, sustainable revenue for the government, and good
indicators of efficiency by international standards. In Trinidad and the Gulf states, the
private foreign firms contribute capital and expertise, but always in joint venture with
the national firm. This has been especially important for developing natural gas,
where Ecuador has lagged. In contrast to Trinidad and the Gulf States, Mexico and
Bolivia have kept out international firms and nationalized their industries. Mexico
shows the danger of this: the Pemex monopoly leaves the industry bereft of much-
needed expertise and investment and at the mercy of a strong union. The union and
other sectoral interests defend this monopoly and the inefficiencies from which they
derive rents; in return, the government does not give Pemex enough resources for
investment, so oil output is dropping and gas reserves are wasted. Bolivia, like
Ecuador, recently turned against the foreign firms that developed the hydrocarbon
sector, and at least in the short run the national firm lacks the expertise and capital to
expand or even properly run the sector.
Keep fiscal balances sustainable and develop non-mineral sources of revenue. In all
countries we reviewed, mineral revenue is important to the government but volatile;
to varying degrees, they have all instituted mechanisms to cushion the volatility.
Chile has the best institutionalized mechanism for revenue stabilization in LAC, and
it has benefited from both capacity for fiscal stimulus and improved credit ratings
during the crisis. Chile has also strengthened its revenue administration over several
decades. Mexico ran surpluses in a more ad hoc way but paid off debt during the

97
recent boom, strengthening its access to credit markets. It has also given sustained
attention to tax administration in the 2000s. Trinidad and Tobago and the Gulf States
have done relatively well in maintaining fiscal balances and stabilization funds. In the
recent economic crisis, the three LAC countries were in a better position than they
were after the 1970s commodity boom, when they ran up debt and faced the double
burden of repayment and lack of access to credit when the oil bubble burst in the
early 1980s.
Use public spending strategically. In three LAC countries and the GCC, mineral-
sector revenues have an important role public spending, and the governments
recognize the need to build up alternative assets (human and physical capital) to take
the place of depleting mineral reserves (oil, gas, and copper). The new human and
physical assets need to be oriented adequately but not exclusively toward the export
market. Accomplishing this goal is difficult, however, because various interests
compete for the mineral revenue going to and through the public sector. Sachs (2007)
points out making good use of oil wealth requires countries to follow a long-term
development strategy that both takes into account the volatility of oil revenues and
allocates public investment to complement productive private sector investment.
Putting oil earnings into public investments rather than private consumption—most of
it typically by upper income groups—is critical even if politically difficult.
Use other policies to support the non-oil tradable sectors. These include exchange
rate, international trade agreements, and business regulations.
o Larger economies like Chile and Mexico have maintained floating exchange rates
without letting their currencies move nearly as much as commodity prices, but
other economies like Trinidad and Tobago and the Gulf States benefit from the
stability provided by a fixed-rate regime. A peg requires strong fiscal discipline
because most of the adjustment to a terms-of-trade shock comes through fiscal
rather than monetary policy, which must dedicate itself to maintaining the
exchange rate.
o International trade agreements have been especially important for Chile and
Mexico over the past 15 years, with their non-mineral sectors benefiting from
improved access to the North American market.
o In business regulations, Chile has been a world leader. Mexico and Trinidad and
Tobago have done less well, although both have improved a lot in the past two
decades. The Gulf States have a mixed record on regulatory reform, with the
reformers doing betting in attracting investment outside of the hydrocarbon
sectors. While laws and regulations can change quickly on paper, it takes longer
to alter the behavior and expectations of both government officials and
businessmen. In all the countries, sustained effort has been needed to establish
credibility and build political support for the improved regulatory regimes,
including reduced red tape.
Table 4.4 shows some indicators of institutional quality that affect the ability of a country
to attract investment that would contribute to diversification.

98
Table 4.4: Per capita GDP and institutional quality in mineral-exporting countries (2007)
Country PCGDP
(US$PPP 2007)
Voice +
account-ability
Political
stability
Effective
governance
Regulatio
n burden
Rule of
law
Control of
graft
Aggregate
index
Bolivia 4,206 0.02 -0.99 -0.83 -1.18 -0.98 -0.49 -4.45
Ecuador 7,449 -0.23 -0.91 -1.04 -1.09 -1.04 -0.87 -5.18 Azerbaijan 7,851 -1.13 -0.69 -0.66 -0.50 -0.83 -1.04 -4.85
Venezuela 12,156 -0.58 -1.23 -0.87 -1.56 -1.47 -1.04 -6.75
Botswana 13,604 0.49 0.84 0.70 0.48 0.67 0.90 4.08 Chile 13,880 0.98 0.55 1.22 1.45 1.17 1.35 6.72
Mexico 14,104 -0.02 -0.57 0.13 0.39 -0.58 -0.35 -1.00
Russia 14,690 -1.01 -0.75 -0.40 -0.44 -0.97 -0.72 -4.29 Trinidad +
Tobago
23,507 0.61 0.08 0.37 0.68 -0.22 -0.19 1.33
Oman 22,2251 -1.03 0.76 0.38 0.63 0.73 0.82 2.29 Norway 53,433 1.53 1.28 2.12 1.44 2.00 2.09 10.46
Memo Item
Trinidad + T.
1998
10,145. 0.83 0.44 0.01 0.79 0.36 0.15 2.58
Source: World Bank Governance Indexes (2007). Each index ranges from 2.5 to -2.5 where this indicate the standard deviation above
and below the international average for that indicator and are based on several surveys in each country. Note: 1. 2006
To strengthen its mineral sector and increase its diversification—as have Chile, the Gulf
States and, to a lesser extent, Mexico and Trinidad and Tobago—Ecuador will need to
make policy changes suggested in the examples above—develop natural gas to
supplement the oil as a domestic power source, move beyond crude-oil production into
more sophisticated processing (with foreign participation, as appropriate), and improve
the business environment for non-energy tradable sectors. It will also need to invest in
building the credibility that investors want by sustaining these policies over time—as it
has already done with dollarization. It will need to increase the certainty of its regulatory
and macroeconomic policies—i.e. clarify the rules of the game and abide by them.

99
Table 4.5. Policies in Chile, Mexico, and Trinidad and Tobago
Policy Chile Mexico Trinidad and Tobago Gulf CC
Public spending Education Good Improved coverage
but still poor
quality
Good for male citizens.
Less for the non-citizens.
Infrastructure Good for copper and for
nontraditional exports
(agriculture)
Improved but still
bottlenecks at
nodes
Good investment for the
export industry, which has
effective priority over the
domestic residents
Good for oil and tradable
service sectors
Subsidies for exports No No
Subsidized inputs
Tax Policy
Favors investment over
consumption,
administration strong
No, except for
electricity to
(large-scale)
agriculture
General taxation
weak but improved
some since 2002.
Yes
Other policies
Exchange rate Flexible Flexible Pegged to US $ Pegged to US $
Customs Free trade agreement
with US; state-of-the-art
administration
Joined NAFTA;
good for big firms;
improved for small
and medium
enterprises, but still
a delay
Regulation Predictable and low cost
to business, but still
protects workers and
customers
Somewhat
problematic on
paper and presents
opportunities for
corruption and
cronyism in
practice, but the
practice is
improving and
becoming more
impersonal
Predictable and good for
HC sector. Varies across
countries for tradable
service sectors. Governance
of the countries depends on
ruling personalities, which
have been friendly to
business in recent decades.
Mineral extraction sector
Diversification Yes, copper remains top,
but other minerals
(nitrates) are catching
up, growing from 25
percent to 80 percent of
the value of copper
exports
No, failed to
develop gas, silver
and other metals
faded out
Yes, strong expansion into
natural gas and liquefied
natural gas
Yes, strong expansion into
downstream processing
Financial support Pemex starved of
investment funding
since reforms of
1980s, partial fix in
2007–08
Joint ventures, with good
access to financing
Downstream use of
mineral resources
No, except for oil
refining, oil used to
generate electricity
inefficiently and
going to subsidize
wasteful uses
Substantial development of
gas-based industry (fertilizer,
high-tech steel, plastics),
some further processing of
these materials
Substantial development –
varies by country,
according to extent of
natural resource
endowment
Source: IMF 2009; Velculescu and Rizavi 2005.

100

101
REFERENCES
ADB (Asia Development Bank), World Bank, and Japan Bank for International
Cooperation. 2005. Connecting East Asia: A New Framework for Infrastructure.
Tokyo: ADB.
Acosta, Alberto. 2006. Breve historia económica del Ecuador. 6th ed. Quito:
Corporación Editora Nacional.
Aizenman, Joshua and Brian Pinto 2004. Managing Volatility and Crises: A
Practitioner’s Guide Overview. NBER Working Paper 10602.
Albornoz, Vicente, Simón Cueva, and Ramiro Gordillo. 2006. “El sector petrolero en el
Ecuador y su potencial de crecimiento.” Corporación e Estudios para el Desarrollo,
Quito.
Albornoz, Vicente. 1999. “El tipo de cambio y las exportaciones en el Ecuador.”
Tendencias, Segundo Semestre, Corporación de Estudios para el Desarrollo, Quito.
Asociación de Industriales Textiles del Ecuador. n.d. “Experiencia y evolución del sector
textilero ecuatoriano.” Asociación de Industriales Textiles del Ecuador, Quito.
http://www.aite.com.ec/home.asp?idsubmenu=12.
———. n.d. “Historia y actualidad.” Asociación de Industriales Textiles del Ecuador,
Quito. http://www.aite.com.ec/home.asp?idsubmenu=10.
Auty, Richard M. 2009. “The Political Economy of Hydrocarbon Revenue Cycling in
Trinidad and Tobago.” Processed.
BP (British Petroleum). 2006. Statistical Review of World Energy. London, UK.
———. 2007. Statistical Review of World Energy. London, UK.
Calderon, Cesar, and Luis Serven. 2004. “Trends in Infrastructure in Latin America:
1980–2001.” Working Paper Series 3401. World Bank, Washington, DC.
Comunidad Andina. 2004. “Intercambio Comercial Comunidad Andina – Estados
Unidos: Dinámica reciente, composición sectorial y potencialidad comercial.”
Documentos Informativos. Secretaría General CAN, Lima.
Centro de Inteligencia Comercial e Información. 2008a. “Perfiles de productos: Brócoli.”
CORPEI.
———. 2008b. “Perfiles de productos: Palmito.” CORPEI.
———. 2008c. “Perfiles de productos: Textiles y confecciones.” CORPEI.
———. 2008d. “Perfiles de productos: Sector Automotriz.” CORPEI.
———. 2008e. “Perfiles de productos: Productos Cerámicos.” CORPEI.
———. 2008f. “Perfiles de productos: Cuero y Elaborados.” CORPEI.
———. 2008g. “Perfiles de productos: Sector Metalmecanica.” CORPEI.
———. 2008h. “Perfiles de productos: Muebles.” CORPEI.
CIA (Central Intelligence Agency). 2008. CIA Factbook.

102
Cueva, Simón. 2008. “Ecuador: Fiscal Stabilization Funds and Prospects.” Inter-
American Development Bank, Washington, DC.
Cueva, Simón, Vicente Albornoz, and Leopoldo Avellán. 2007. “Ecuador: Binding
Constraints to Growth.” Inter-American Development Bank, Washington, DC.
de Ferranti, David, Guillermo E. Perry, Daniel Lederman, and William Maloney. 2002.
“From Natural Resources to the Knowledge Economy.” World Bank, Washington,
DC.
Dunning, Thad. 2009. Crude Democracy: Natural Resource Wealth and Political
Regimes. Cambridge Studies in Comparative Politics.
Espinasa, Ramón. 2007. “Oil Sector Growth Diagnostics.” PowerPoint presentation of
“Comments to the paper ‘Ecuador: Binding Constraints to Growth.’”
Fay, Marianne, and Mary Morrison. 2005. Infrastructure in Latin America and the
Caribbean: Recent Developments and Key Challenges. Washington, DC: World
Bank.
Fretes, Vicente, M. Giugale and E. Somensatto. 2008. Ecuador’s Economic and Social
Agenda in an Evolving Landscape. Washington, DC. World Bank.
Fundación de Fomento de Exportaciones de Aceite de Palma y sus Derivados de Origen
Nacional. 2008. “La palma aceitera en el Ecuador y el mundo,” Flash presentation.
www.fedapal.com, submenu Publicaciones y Presentaciones.
Gavin, Michael and Ricardo Hausmann 1998. Nature, Development and Distribution in
Latin America: Evidence on the Role of Geography, Climate and Natural Resources.
Washington DC: IADB Working Paper 378.
Hausmann, Ricardo and Bailey Klinger 2009. Structural Transformation in Ecuador.
Washington DC: IADB.
Hurtado, Felipe, 2008. ¿A Quién Favorece la Política de Subsidios de Combustibles?
Carta Económica, CORDES 12: 4, 4.
Hurtado, Osvaldo. 2007. El Poder Político en el Ecuador. 17th
ed, Planeta del Ecuador,
Quito.
IMF (International Monetary Fund). 2005. Stabilization, Debt, and Fiscal Policy in the
Caribbean. Washington, DC: IMF.
———. 2009. Trinidad and Tobago: 2008 Article IV Review. Washington, DC: IMF,
March.
———. 2007. Guide for Resource Revenue Transparency. Washington, DC: IMF.
Johansen, S. (1988): Statistical analysis of cointegration vectors, Journal of Economic
Dynamic and Control, 12, 231-254.
Johansen, S.; Juselius, K. 1990. “Maximum likelihood estimation and inference on
cointegration. With applications to the demand of money.” Oxford Bulletin of
Economics and Statistics, 52, 169-210.
———. 1992. “Testing structural hypothesis in a multivariate cointegration analysis of
PPP and the UIP for UK.” Journal of Econometrics, 53, 169-209.

103
Koren, Miklós, and Silvano Tenreyro. 2007. “Volatility and Development.” Quarterly
Journal of Economics 122 (1): 243–87.
Kumhof, Michael and D. Laxton. 2009. “Chile's Structural Fiscal Surplus Rule: A
Model-Based Evaluation.” IMF working paper 09/88, Washington, DC. IMF.
Lederman, Daniel, and William Maloney, eds. 2007. Natural Resources: Neither Curse
nor Destiny. Palo Alto, CA: Stanford University Press.
Lederman, Daniel, and Colin Xu. 2009. “The Macroeconomic Volatility of Ecuador in
International Perspective: Commodity Dependence and Macroeconomic
Uncertainty.” World Bank, Washington, DC.
Levy, Santiago, and Michael Walton. 2009. No Growth without Equity? Inequality,
Interests, and Competition in Mexico. Washington, DC: World Bank.
Love, James. 1986. “Commodity Concentration and Export Earnings Instability.” Journal
of Development Economics 24 (2): 239–48.
Malik, Adeel, and Jonathan Temple. 2008. “The Geography of Output Volatility.”
Journal of Development Economics 84 (1): 155–87.
Michaely, Michael. 1958. “Concentration of Exports and Imports.” Economic Journal 68
(272): 722–36.
Ministerio de Finanzas de Chile. 2009a. Acta de Resultados del Comité Consultivo del
Precio de Referencia del Cobre. Santiago, Chile.
Ministerio de Finanzas de Chile. 2009b. Acta de Resultados del Comité Consultivo del
PIB Tendencial. Santiago, Chile.
Ministerio de Finanzas de Chile. 2009c. Annual Report Sovereign Wealth Funds 2008.
Santiago, Chile.
Ministerio de Minas y Petroleos de Ecuador. 2008. “Visión de largo plazo del sector
petrolero utilizando una matriz energética.” PowerPoint presentation.
Nabeshima, Kaoru and Shahid Yusuf 2009. Can Malaysia Escape the Middle-Income
Trap? A Strategy for Penang. World Bank Policy and Research Working Paper 4971.
Nabli, Mustapha, Jennifer Keller, Claudia Nassif, and Carlos Silva-Jauregui. 2006. “The
Political Economy of Industrial Policy in the Middle East and North Africa.” World
Bank, Washington, DC.
OPEC. 2006. Annual Report. Vienna, AU.
Proaño, Estefanía, 2008. “Subsidios 2008.” Carta Económica, CORDES 12: 2, 3.
Richardson, James and G. Condra. 1981. “Farm Size Evaluation in the El Paso Valley: A
Survival/Success Approach.” American Journal of Agricultural Economics, August
1981, v. 63, iss. 3, pp. 430-37
Sachs, Jeffrey 2007. “The Macroeconomics of Oil Wealth”, in Macartan Humphreys,
Jeffrey D. Sachs and Joseph E. Stiglitz, ed., Escaping the Resource Curse. NY:
Colombia Univ. Press.

104
Sachs, Jeffrey, and Andrew Warner. 1995. “Natural Resource Abundance and Economic
Growth.” NBER Working Paper 5398. National Bureau of Economic Research,
Cambridge, MA.
Sahay, Ratna and Rishi Goyal 2006. Volatility and Growth in Latin America: An
Episodic Approach. IMF Working Paper WP/06/287
Sawers, Larry. 2005. “Sustainable Floriculture in Ecuador.” American University
Department of Economics Working Paper Series, American University, Washington
DC.
Schott, Peter K. 2003. “One Size Fits All? Heckscher-Ohlin Specialization in Global
Production.” American Economic Review 93 (3): 687–708.
SIISE-STFS, Vos, Rob, Ponce, Juan, León, Mauricio, Cuestas, José and Brovorich,
Wladimir. 2003. El subsidio al gas y el Bono Solidario en el Ecuador, Cuaderno N.6,
Quito.
Sistema de Información sobre Comercio Exterior. nd. Organization of American States,
Washington DC. http://www.sice.oas.org/ctyindex/ECU/ECUAgreements_s.asp
UNCTAD (United Nations Conference on Trade and Development). 2008. Handbook of
Statistics. Geneve, SW.
Vardy, Felix and E. Sinnott. 2009. Role of Commodities in LAC. Washington, DC. World
Bank.
Velculescu, Delia, and Saqib Rizavi. 2005. “Trinidad and Tobago: The Energy Boom and
Proposals for a Sustainable Fiscal Policy.” IMF Working Paper WP/05/197. IMF,
Washington, DC.
World Bank. 2002. Mexico. Country Economic Memorandum: Challenges and Prospects
for Tax Reform. World Bank, Washington, DC.
———. 2004a. Ecuador. Creating fiscal space for poverty reduction - A fiscal
management and public expenditure review. World Bank, Washington, DC.
———. 2004b. Mexico: Public Expenditure Review. World Bank, Washington, DC.
———. 2005a. Mexico: Infrastructure Public Expenditure Review. World Bank,
Washington, DC.
———. 2005b. A Time to Choose: Caribbean Development in the 21st Century.
Washington, DC: World Bank.
———. 2006a. Where is the Wealth of Nations? Measuring Capital for the XXI Century.
Washington, DC: World Bank.
———. 2006b. Mexico. Decentralized service delivery for the poor. World Bank,
Washington, DC.
———. 2009. Doing Business. Washington, DC.
World Bank – IADB. 2004. Ecuador: Creating fiscal space for poverty reduction. A
fiscal management and public expenditure review, Washington DC.
Xiang, Chong. 2007. “Diversification Cones, Trade Costs, and Factor Market Linkages.”
Journal of International Economics 71 (1): 448–66.

105
APPENDIX A. SECTORAL DYNAMICS
Figure A.1 displays the ratio of manufacturing GDP to services GDP in log terms from
1993 to 2008 alongside its Hodrick Prescott (HP) filtered series.47
Figure A.2 shows price
of oil for Ecuador over the same period with its HP filtered series. Figure A.3 combines
the two. An increase in the ratio, which serves as a proxy for the ratio of non-oil tradable
to nontradable products, implies faster growth in manufacturing relative to services. A
decrease implies slower growth of manufacturing compared to services, which could be a
sign of Dutch disease. While we can rule out an absolute decline in manufacturing
throughout the sample, we find episodes of relative decline and an episode of
convergence. These periods appear to be related to fluctuations in the price of oil, with
higher oil prices associated with slower relative manufacturing growth.
Figure A.1. Ratio of manufacturing to services GDP and HP filtered ratio,
1993–2008, in log terms
Source: Bank staff calculations.
Figure A.2. Oil price and HP filtered series, 1993–2008, in log terms
Source: Bank staff calculations.
47
The Hodrick-Prescott filter is a mathematical tool used in macroeconomics, especially in real business-
cycle theory. It is used to obtain a smoothed, non-linear representation of a time series, one more sensitive
to long-term rather than to short-term fluctuations. The cyclical component of extracted by the Hodrick-
Prescott filter is interpreted as short-term fluctuations at business-cycle frequency.
-1.15
-1.05
-0.95
-0.851993q1 1995q3 1998q1 2000q3 2003q1 2005q3 2008q1
HP_rat3_sm_1
rat3
12.8
12.9
13
13.1
13.2
13.3
13.4
13.5
13.6
1993q1 1995q3 1998q1 2000q3 2003q1 2005q3 2008q1
loil
HP_loil_sm_1

106
Figure A.3. Oil prices and ratio of manufacturing to services GDP, in log terms
Source: Bank staff calculations.
Correlations are −0.47 between the raw data series and −0.96 at lag 4 between the HP
filtered series. Contemporaneous correlations are −0.44 and −0.87, respectively. This
indicates an increase in oil prices is associated with a decline in manufacturing output.
Table A.1. Correlation between a change in oil price and a change in sector output
Sector Correlation
industry -0.04
manufacturing -0.03
electricity -0.04
services 0.34*
transports 0.06
construction 0.24*
commerce 0.14
financial 0.27*
other services 0.46*
*Significant at 10% level.
Table A.1 shows that real growth reacts with a statistically significant coefficient to
changes in oil prices in only three sectors—construction, financial services, and other
services. They experience increasing output with higher oil prices. These sectors match
the critical ones identified as part of the oil cluster in Chapter 2, confirming the proximity
of those sectors as providers of the oil sector. Financial services includes insurance, and
other services includes services to businesses.
While the industrial sector reacts negatively to higher oil prices, the effect is not
statistically significant. The lack of a significant impact of oil prices on transportation and
electricity may be explained by Ecuador’s large fuel subsidies, which help to keep the
consumer prices of oil derivatives unchanged and isolate these sectors from fluctuations
in oil prices. The story may be similar in the industrial sector. In the absence of oil price
subsidies, higher oil prices should lead to a reduction in output due to increasing
production costs. The absence of statistical significance for the oil-industry coefficient
confirms that evidence of Dutch disease over the period is weak at best.
12.95
13.05
13.15
13.25
13.35
13.45
13.55
1 4 7 10 13 16 19 22 25 28 31 34 37 40 43 46 49 52 55 58
-1.12
-1.07
-1.02
-0.97
-0.92
-0.87
-0.82loil
HP_loil_sm_1
rat3
HP_rat3_sm_1

107
APPENDIX B. EXPORT CONCENTRATION AND MACRO VOLATILITY:
A TIME-SERIES PERSPECTIVE FROM ECUADOR
A recurrent preoccupation among policymakers involves the idea that natural riches
produce a highly concentrated structure of export revenues, leading to economic volatility
and slower growth (de Ferranti and others, 2002). Michaely (1958) confirmed this
contention by showing that countries with lower GDP per capita tend to have more
concentrated export structures. As a consequence, shocks that affect specific export
categories can significantly affect exports and economic growth. Using time-series
analysis for a sample of developing countries, Love (1986) provides evidence of a
positive relationship between export concentration and export volatility, which indirectly
affects income volatility. Sachs and Warner (1995) and Lederman and Maloney (2007)
provide similar evidence from cross-sectional and panel analysis. In a more recent study,
Malik and Temple (2008) identify a positive relationship between export concentration
and a country’s terms-of-trade volatility, which they identify as a significant determinant
of income volatility. Lederman and Xu (2009) reach a similar conclusion.
Export concentration is not exogenously determined. Malik and Temple (2008) show that
it is explained largely by such geographic variables as coastal access, distance to markets
and size, as well as by commodity dependence, particularly fuels, minerals, and
plantation crops. In addition, Lederman and Xu (2009) find evidence that quality
institutions can partly ameliorate the adverse impact of commodity dependency. Carrère,
Strauss-Kahn, and Cadot (2007) link export concentration to the path of economic
development, with diversification increasing as countries grow richer. However, export
diversification starts to decrease again above a very high per capita income threshold—
purchasing power parity US$24,000. The authors explain this hump-shaped pattern by
the fact that new export sectors are emerging faster than old ones are vanishing in
middle-income countries.
Figures B.1 to B.4 depict various cross-plots between UNCTAD export concentration
indexes, GDP per capita, terms-of-trade volatility, and output volatility. The figures
confirm a negative relationship between GDP per capita and export concentration and a
positive relationship between export concentration and both output and terms-of-trade
volatility. One finding is somewhat surprising—the relationship between terms-of-trade
and output volatility appears rather weak for our sample of countries.

108
Figure B.1. Export concentration and GDP per capita
Source: Bank staff calculations based on World Development Indicators and UNCTAD Handbook of
Statistics. Based on 171 countries. Export concentration refers to UNCTAD export concentration index
for 2006; GDP per capita is for 2006.
Figure B.2. Export concentration and output volatility
Source: Bank staff calculations based on World Development Indicators and UNCTAD Handbook of
Statistics. Based on 171 countries. Export concentration refers to UNCTAD export concentration index
for 2006. Output volatility is calculated as the standard deviation of real GDP growth from 1986 to
2006.
y = -2.348x + 8.667
R2 = 0.15
0
2
4
6
8
10
12
0 0.2 0.4 0.6 0.8 1export concentration
GD
P p
er
capita
y = 2.193x + 1.877
R2 = 0.31
0
1
2
3
4
5
0 0.2 0.4 0.6 0.8 1export concentration
outp
ut
vola
tilit
y

109
Figure B.3. Export concentration and terms-of-trade volatility
Source: Bank staff calculations based on World Development Indicators and UNCTAD Handbook of
Statistics. Based on 120 countries. Export concentration refers to UNCTAD export concentration index
for 2006. Terms-of-trade volatility is calculated as the standard deviation of net barter terms of trade
from 1986 to 2006.
Figure B.4. Terms-of-trade volatility and output volatility
Source: Authors’ own calculations based on World Development Indicators and UNCTAD Handbook of
Statistics. Based on 120 countries. Terms-of-trade volatility is calculated as the standard deviation of net
barter terms of trade from 1986 to 2006. Output volatility is calculated as the standard deviation of real
GDP growth from 1986 to 2006.
We complement the cross-sectional analysis in Figures B.1 to B.4 by investigating the
relationship between export concentration and output volatility over time. A time-series
approach seems justified by the fact that export concentration in Ecuador has been
fluctuating quite dramatically over the past century. This suggests that time-variant
explanatory variables must also play a significant role in determining export
concentration; thus, existing cross-country analyses would benefit by widening our
y = 30.6x + 5.13
R2 = 0.25
0
10
20
30
40
50
60
70
80
90
0 0.2 0.4 0.6 0.8 1
export concentration
term
s o
f tr
ade v
ola
tility
y = 1.57x + 10.80
R2 = 0.06
0
10
20
30
40
50
60
70
80
90
0 5 10 15 20
output volatility
term
s o
f tr
ade v
ola
tility

110
inquiry beyond time-invariant (for example, geography) or slow-changing determinants
(for example, institutions) of export concentration.
A time-series perspective ensures that variations are due to time effects not cross-country
differences. Cross-sectional regressions ignore country heterogeneity and dynamic
effects. Fixed-effects panel studies allow for a certain degree of country heterogeneity,
but parameter heterogeneity is restricted to level differences and slope parameters are
treated as homogeneous. Fixed-effect models are also inappropriate in the presence of a
unit root. A time-series study of export concentration and macroeconomic volatility gives
us a way around these limitations.
Ecuador’s economy has been largely dependent on successive key products since the
country’s independence in 1830. According to Acosta (2006), three products have been
the key drivers of Ecuador’s exports and growth: cacao (1860–1920), bananas (1948–66),
and oil (since 1973). During transitions to different commodity cycles, traditional and
nontraditional exports had roughly the same share of Ecuador’s total exports, reflecting
both a fall of the previously leading product and efforts to diversify trade. For example,
nontraditional non-oil exports, such as balsawood and small manufactures, acquired a
significant role during 1938–47. During the transition phases, the economy was more
diversified in terms of exports and experienced less output volatility but not necessarily
slower rates of growth.
We use intervention dummies for periods of high export concentration due to booms in
bananas (1948–66) and oil (1972–86), finding that volatility was significantly higher
during periods of export concentration. We don’t identify significant differences in
growth rates (see Table B.1).
Table B.1. Growth rates and volatility during times of export concentration
Indicator
Real GDP
growth
Real per capita
GDP growth
Real GDP
growth
volatility
Real GDP
per capita
volatility
Constant 0.0350643***
(0.0566)
0.01045*
(0.0536)
0.1142***
(0.00590)
0.042000***
(0.0085)
Dum48-66 0.0171
(0.1000)
0.0116
(0.0094)
0.07188***
(0.0104)
0.0410***
(0.0084)
Dum72-86 0.0159
(0.01085)
0.0130
(0.0127)
0.0860***
(0.0113)
0.0509***
(0.0092)
Note: Based on an ordinary least squares regression on interventions dummies that take the value of
1 during 1948 and 1966 for Dum48_66 and during 1972 and 1986 for Dum72_86. Sample period:
1927 to 2000.
*** Significant at 1% level.
* Significant at 10% level.
We measure income volatility as the 10-year rolling coefficient of determination of real
GDP. As a measure of export concentration, we apply the Herfindahl index, normalized
to range between 0 and 1:

111
n
nsH i i
/11
/12
,
where si = xi / x is the share of export line i in total exports and n is the number of export
lines (omitting time subscripts). We only have data on eight export lines—oil, traditional
agriculture, banana, coffee, shrimp, cacao, tuna, fish, and nontraditional exports—so our
Herfindahl index is a rather crude measure of export concentration. To strengthen the
results, we also construct a series of dummy variables that takes the value of 1 during
1938–47, 1948–71, and 1972–86 and 0 otherwise. According to Figure C.1, these are
periods of relatively large export concentration.
We run the following ordinary least squares regression:
ttt Z 2 ,
where volatility, 2 , is a function of export concentration, t , and a vector of control
variables Zt. We include real GDP growth to account for the fact that volatility is higher
during times of rapid growth. We also include different measures of the common
component of Latin American countries (LAC) volatility: the simple average of eight
LAC, the first principal component of eight LAC, and average LAC volatility.
The regression reveals a clear positive link between export concentration and volatility
(see Table B.2). This relationship holds independent of the measure of export
concentration used and is robust to a series of control variables.
Table B.2. Regression results with GDP volatility as the dependent variable
Independent variable (1) (2) (3)
Global volatility 0.9336***
(0.1348541)
0.7648***
(0.12302)
0.73786***
(0.1336)
Time dummies 0.01740***
(0.00584)
Herfindahl index 0.0481**
(0.0244623)
dum38_47 -0.00398
(0.01006)
dum48_71 0.01507*
(0.0083)
dum72_86 0.0368***
(0.0069)
gdp growth 0.1410
(0.0951)
0.1171
(0.0909)
0.1280
(0.0978)
Constant -0.0891***
(0.0198275)
-0.0637***
(0.0160)
-0.0606***
(0.0173)
R2
0.48 0.49 0.57
*** Significant at 1%.
** Significant at 5%.


113
APPENDIX C. OIL SECTOR COMPLEMENTARY DATA
The following series of graphs and tables present auxiliary data on Ecuador’s oil sector.
Figure C.1. Major components of oil sector exports, 1988–2008
(millions of dollars FOB)
Source: Banco Central de Ecuador.
Figure C.2. Share of oil sector in total exports, 1988–2008
Source: Banco Central de Ecuador.
0%
10%
20%
30%
40%
50%
60%
70%
1988 1990 1992 1994 1996 1998 2000 2002 2004 2006 2008
Crude oil Fuel oil Oil sector
0
2,000
4,000
6,000
8,000
10,000
12,000
1988 1990 1992 1994 1996 1998 2000 2002 2004 2006 2008 Crude oil Fuel oil Oil sector

114
Figure C.3. Volume of oil exports, 1992–2008
(thousands of barrels)
Source: Banco Central de Ecuador.
Table C.1. Main hydrocarbon-related laws
Year Law
1973 Ley de Hidrocarburos
1974 Ley de Exploración y Explotación de Asfaltos
1993
Reglamento para la Aplicación de la Ley Reformatoria a la Ley de Hidrocarburos no.
44
1995
Ley de Regulación de la Producción y Comercialización de Combustibles en el
Ecuador
2001
Ley Especial de la Empresa Estatal Petróleos del Ecuador (Petroecuador) y sus
Empresas Filiales
2001
Reglamento Sustitutivo al Reglamento General a la Ley Especial de la Empresa
Estatal Petróleos del Ecuador (Petroecuador) y sus Empresas Filiales
2001
Reglamento para la Transferencia o Cesión de Derechos y Obligaciones de los
Contratos de Hidrocarburos
2003 Reglamento del Sistema Especial de Licitación
2003 Reglamento del Contrato de Asociación Previsto en la Ley de Hidrocarburos
2006
Reglamento para la Transferencia o Cesión de Derechos y Obligaciones de los
Contratos Inherentes a Las Actividades de Comercialización de Combustibles, Gas
Licuado de Petróleo y Otros Productos Derivados de Hidrocarburos
2007
Reglamento de Aplicación de la Ley no. 42-2006 Reformatoria a la Ley de
Hidrocarburos (Decreto 662)
2008 Constitución Política del Estado (Articles 261, 313, and 408)
2008
Ley Orgánica para la Recuperación del uso de los Recursos Petroleros del Estado y
Racionalización Administrativa de los Procesos de Endeudamiento
2008 Ley Reformatoria para la Equidad Tributaria
Source: Albornoz, Cueva, and Gordillo 2006.
0 20,000 40,000 60,000 80,000
100,000 120,000 140,000 160,000
1992 1994 1996 1998 2000 2002 2004 2006 2008 Crude oil Fuel oil

115
APPENDIX D. INTERMEDIATE CONSUMPTION OF EXTRACTING AND REFINING SECTORS
This appendix presents each subsector’s share of intermediate consumption, share of the
overall supply of other sectors’ products, and share of the overall intermediate
consumption of other sectors’ products in the economy.
Share of intermediate consumption by sector
The intermediate consumption of oil-extraction activities is concentrated in five areas:
services provided to businesses, basic chemical products, oil derivatives, construction,
and transportation and storage (see figures D.1 and D.2). These subsectors represent an
average of 88.6 percent of the oil-extraction sector’s intermediate consumption in 2000–
07. Its share was mostly stable throughout the period, with a gradual decline in the
required inputs from services provided to businesses.
Other important subsectors that supply oil extraction with intermediate consumption
include machinery and equipment (average intermediate consumption of 3.1 percent in
2000-07), crude oil and natural gas (the product of the subsector, with an average of 2.5
percent), insurance (1.5 percent), and transportation equipment including vehicles (1.3
percent). These nine subsectors (out of 61) add up to 97 percent of total oil-extraction
intermediate consumption in the period.
Figure D.1. Intermediate consumption of the oil extraction sector, 2000–07
Figure D.2. Intermediate consumption of the oil refining sector, 2000–07
0%
10%
20%
30%
40%
50%
60%
2000 2001 2002 2003 2004 2005 2006 2007
Other services to business Chemical ProductsOil Derivatives ConstructionTransportation and storage
0%
10%
20%
30%
40%
50%
60%
70%
80%
2000 2001 2002 2003 2004 2005 2006 2007
Oil and natural gas Oil Derivatives
Machinery and Equipment Insurance

116
The intermediate consumption of the oil-refining subsector is even more concentrated
than that of the oil-extraction subsector. The main component of oil refining’s
intermediate consumption is crude oil, with a 60 percent average share in 2000–07.
However, a decline from 68.1 percent in 2000 to 49.8 percent in 2007 reflects aging
refineries’ increasing difficulties in efficiently processing the heavier Ecuadorian crude
oil. It has created a growing need to use imported oil derivatives—mainly high-octane
naphtha and related products—to improve the quality of the final products. Other
intermediate products for oil refining include machinery and equipment (with average
share of 6.0 percent), insurance activities (2.4 percent), and transportation equipment
including vehicles (1.9 percent).
Share of the overall use of other sectors’ products
Figure D.3. Total use of the products of other sectors by the oil extraction sector, 2000–07
Figure D.4. Total use of the products of other sectors by the oil refinery sector, 2000–07
0%
5%
10%
15%
20%
25%
30%
35%
40%
2000 2001 2002 2003 2004 2005 2006 2007
Chemical Products Other services to business
Insurance Oil Derivatives
0%
10%
20%
30%
40%
50%
60%
2000 2001 2002 2003 2004 2005 2006 2007
Insurance Oil Derivatives
Oil and natural gas Machinery and Equipment

117
Share of the intermediate use of other sectors’ products in the economy
Figure D.5. Intermediate use of the products of other sectors by the oil extraction sector 2000–07
Figure D.6. Intermediate use of the products of other sectors by the oil refinery sector, 2000–07
0%
5%
10%
15%
20%
25%
30%
35%
40%
2000 2001 2002 2003 2004 2005 2006 2007
Chemical Products Other services to business
Construction Insurance
0%
20%
40%
60%
80%
100%
120%
2000 2001 2002 2003 2004 2005 2006 2007Oil and natural gas Insurance
Oil Derivatives Machinery and Equipment


119
APPENDIX E. REAL GROWTH RATES FOR ECONOMIC SECTORS
AND MAIN EXPORT PRODUCTS
The following series of graphs present annual real sector GDP growth and trends for
specific sectors.
Figure E.1 Annual growth of oil real GDP, 1994–2007
Figure E.2 Annual growth of fishing real GDP, 1994–2007
Figure E.3 Annual growth of agriculture real GDP, 1994–2007
-20%
-10%
0%
10%
20%
30%
40%
-8%
-6%
-4%
-2%
0%
2%
4%
6%
8%
10%
1993 1995 1997 1999 2001 2003 2005 2007
Real GDP Oil
Linear (Real GDP) Linear (Oil)
-30%
-20%
-10%
0%
10%
20%
30%
1993 1995 1997 1999 2001 2003 2005 2007
Fishing
Real GDP
Linear (Fishing)
Linear (Real GDP)
-10%
-5%
0%
5%
10%
15%
1993 1995 1997 1999 2001 2003 2005 2007
Agriculture
Real GDP
Trend(Agriculture)
Trend(Real GDP)

120
Figure E.4. Annual growth of industrial real GDP, 1994–2007
Figure E.5. Annual growth of construction real GDP, 1994–2007
Figure E.6. Annual growth of commerce real GDP, 1994–2007
-8%
-6%
-4%
-2%
0%
2%
4%
6%
8%
10%
12%
1993 1995 1997 1999 2001 2003 2005 2007
Industrial Manufactures
Real GDP
Linear (Industrial Manufactures )
Linear (Real GDP)
-30%
-25%
-20%
-15%
-10%
-5%
0%
5%
10%
15%
20%
25%
1993 1995 1997 1999 2001 2003 2005 2007
Construction
Real GDP
Linear (Construction)
Linear (Real GDP)
-15%
-10%
-5%
0%
5%
10%
1993 1995 1997 1999 2001 2003 2005 2007
Commerce
Real GDP
Linear (Commerce)
Linear (Real GDP)

121
Figure E.7. Annual growth of transportation real GDP, 1994–2007
Figure E.8. Annual growth of financial services real GDP, 1994–2007
Figure E.9. Annual growth of real estate real GDP, 1994–2007
-8%
-6%
-4%
-2%
0%
2%
4%
6%
8%
10%
12%
1993 1995 1997 1999 2001 2003 2005 2007
Transportation
Real GDP
Linear (Transportation)
Linear (Real GDP)
-60%
-50%
-40%
-30%
-20%
-10%
0%
10%
20%
30%
1993 1995 1997 1999 2001 2003 2005 2007
Financial Services
Real GDP
Linear (Financial Services)
Linear (Real GDP)
-8%
-6%
-4%
-2%
0%
2%
4%
6%
8%
10%
1993 1995 1997 1999 2001 2003 2005 2007
Real State
Real GDP
Linear (Real State)
Linear (Real GDP)

122
Figure E.10. Annual growth of public sector real GDP, 1994–2007
Figure E.11. Annual growth of other services real GDP, 1994–2007
Annual real export growth and trends for main export products
Figure E.12. Growth of banana exports, 1994–2007
-10%
-8%
-6%
-4%
-2%
0%
2%
4%
6%
8%
10%
12%
1993 1995 1997 1999 2001 2003 2005 2007
Public Sector
Real GDP
Linear (Public Sector)
Linear (Real GDP)
-8%
-6%
-4%
-2%
0%
2%
4%
6%
8%
10%
1993 1995 1997 1999 2001 2003 2005 2007
Other Services Real GDP
Linear (Other Services) Linear (Real GDP)
-30%
-20%
-10%
0%
10%
20%
30%
40%
50%
60%
1991 1993 1995 1997 1999 2001 2003 2005 2007
Bananas Total Exports Tend. (Bananas)

123
Figure E.13. Growth of fish and shrimp exports, 1994–2007
Figure E.14. Growth of flower exports, 1994–2007
Figure E.15. Growth of processed agricultural products exports, 1994–2007
-50%
-40%
-30%
-20%
-10%
0%
10%
20%
30%
40%
1991 1993 1995 1997 1999 2001 2003 2005 2007
Fish and Shrimp
Total Exports
Linear (Fish and Shrimp)
-30%
-20%
-10%
0%
10%
20%
30%
40%
50%
60%
70%
1991 1993 1995 1997 1999 2001 2003 2005 2007
Flowers Total Exports Linear (Flowers)
-30%
-20%
-10%
0%
10%
20%
30%
40%
50%
1991 1993 1995 1997 1999 2001 2003 2005 2007
Proc. Agric. Total Exports Linear (Proc. Agric.)

124
Figure E.16. Growth of other agricultural products exports, 1994–2007
Figure E.17. Growth of cacao exports, 1994–2007
Figure E.18. Growth of coffee exports, 1994–2007
-100%
-50%
0%
50%
100%
150%
200%
250%
300%
1991 1993 1995 1997 1999 2001 2003 2005 2007
Agric. Prod. Total Exports Linear (Agric. Prod.)
-100%
-50%
0%
50%
100%
150%
1991 1993 1995 1997 1999 2001 2003 2005 2007
Cacao Total Exports Linear (Cacao)
-100%
-50%
0%
50%
100%
150%
200%
250%
300%
350%
1991 1993 1995 1997 1999 2001 2003 2005 2007
Coffee Total Exports Linear (Coffee)

125
The following series of graphs show annual real export growth and trends for main
manufactured industrial products:
Figure E.19. Growth of industrial exports, 1991–2008
Figure E.20. Growth of furniture exports, 1991–2008
Figure E.21. Growth of mineral exports, 1991–2008
-50%
0%
50%
100%
150%
200%
1991 1993 1995 1997 1999 2001 2003 2005 2007
Industrial Total Exports Linear (Industrial)
-100%
-50%
0%
50%
100%
150%
200%
250%
1991 1993 1995 1997 1999 2001 2003 2005 2007
Furniture Total Exports Linear (Furniture)
-100%
-50%
0%
50%
100%
150%
200%
250%
1991 1993 1995 1997 1999 2001 2003 2005 2007
Minerals Total Exports Linear (Minerals)

126
Figure E.22. Growth of processed wood exports, 1991–2008
Figure E.23. Growth of textile exports, 1991–2008
Figure E.24. Growth of clothes exports, 1991–2008
Figure E.25. Growth of chemical exports, 1991–2008
-30%
-20%
-10%
0%
10%
20%
30%
40%
50%
1991 1993 1995 1997 1999 2001 2003 2005 2007
Proc. Wood Total Exports Linear (Proc. Wood)
-40%
-20%
0%
20%
40%
60%
80%
1991 1993 1995 1997 1999 2001 2003 2005 2007
Textile Total Exports Linear (Textile)
-40%
-20%
0%
20%
40%
60%
80%
100%
1991 1993 1995 1997 1999 2001 2003 2005 2007
Clothes Total Exports Linear (Clothes)
-40%
-20%
0%
20%
40%
60%
80%
100%
1991 1993 1995 1997 1999 2001 2003 2005 2007
Chemicals Total Exports Linear (Chemicals)

127
Figure E.26. Growth of ceramic exports, 1991–2008
Figure E.27. Growth of rubber and plastic exports, 1991–2008
-50%
0%
50%
100%
150%
200%
1991 1993 1995 1997 1999 2001 2003 2005 2007
Ceramic Total Exports Linear (Ceramic)
-50%
0%
50%
100%
150%
200%
1991 1993 1995 1997 1999 2001 2003 2005 2007
Rubber, plastic
Total Exports
Linear (Rubber, plastic)

128
Table E.1. Intermediate consumption of the oil extraction subsector, 2000–07 (%)
Source: Banco Central del Ecuador; Bank staff calculations.
Products 2000 2001 2002 2003 2004 2005 2006 2007 Other services to business 56.52% 50.76% 42.91% 44.26% 38.73% 40.85% 42.33% 45.82% Chemical products 13.08% 15.76% 18.84% 18.14% 16.94% 16.54% 16.06% 15.13% Oil derivatives 7.67% 8.19% 9.83% 10.09% 11.34% 11.07% 10.75% 10.13% Construction 10.50% 11.03% 12.19% 11.74% 10.90% 10.64% 10.33% 9.73% Transportation and storage 3.30% 3.81% 4.37% 4.32% 9.59% 8.67% 8.31% 7.72% Machinery and equipment 1.86% 3.06% 3.72% 3.58% 3.33% 3.25% 3.15% 2.97% Oil and natural gas 2.03% 2.07% 2.27% 2.22% 2.69% 2.68% 2.95% 2.74% Insurance 0.95% 1.01% 1.11% 1.07% 1.97% 1.90% 1.83% 1.72% Transportation equipment, including vehicles 1.22% 1.28% 1.42% 1.37% 1.42% 1.39% 1.35% 1.27% Hotels and restaurants 0.44% 0.47% 0.51% 0.50% 0.50% 0.49% 0.48% 0.45% Metallic manufactures 0.41% 0.43% 0.47% 0.46% 0.42% 0.41% 0.40% 0.38% Other products derived from nonmetallic minerals 0.33% 0.35% 0.39% 0.38% 0.35% 0.34% 0.33% 0.31% Rubber and plastic products 0.21% 0.22% 0.24% 0.23% 0.25% 0.24% 0.24% 0.22% Telecommunications 0.23% 0.25% 0.27% 0.26% 0.24% 0.24% 0.23% 0.22% Leather products 0.21% 0.22% 0.25% 0.24% 0.22% 0.22% 0.21% 0.20% Social services 0.15% 0.16% 0.17% 0.17% 0.16% 0.15% 0.15% 0.14% Textiles and clothes 0.13% 0.14% 0.15% 0.15% 0.16% 0.15% 0.15% 0.14% Electricity 0.14% 0.15% 0.16% 0.16% 0.15% 0.14% 0.14% 0.13% Nonmetallic minerals 0.14% 0.15% 0.16% 0.15% 0.14% 0.14% 0.14% 0.13% Rubber products 0.13% 0.14% 0.16% 0.15% 0.14% 0.14% 0.13% 0.13% Processed wood 0.09% 0.10% 0.11% 0.10% 0.10% 0.09% 0.09% 0.09% Paper products 0.06% 0.07% 0.08% 0.07% 0.07% 0.07% 0.06% 0.06% Domestic gas and water 0.06% 0.07% 0.07% 0.07% 0.07% 0.06% 0.06% 0.06% Other chemical products 0.05% 0.05% 0.06% 0.06% 0.05% 0.05% 0.05% 0.05% Mail 0.03% 0.03% 0.03% 0.03% 0.03% 0.03% 0.03% 0.03% Education 0.02% 0.02% 0.02% 0.02% 0.02% 0.02% 0.02% 0.02% Nonalcoholic beverages 0.01% 0.01% 0.01% 0.01% 0.01% 0.01% 0.01% 0.01% Other manufactures 0.01% 0.01% 0.01% 0.01% 0.01% 0.01% 0.01% 0.01% Other food products 0.00% 0.00% 0.00% 0.00% 0.00% 0.00% 0.00% 0.00% Financial services (banking) 0.00% 0.00% 0.00% 0.00% 0.00% 0.00% 0.00% 0.00% TOTAL 100.00% 100.00% 100.00% 100.00% 100.00% 100.00% 100.00% 100.00%

129
Table E.2. Intermediate consumption of the oil refinery and oil pipelines subsector, 2000–07 (%)
Source: Banco Central del Ecuador; Bank staff calculations.
Products 2000 2001 2002 2003 2004 2005 2006 2007 Oil and natural gas 68.06% 66.51% 66.95% 60.02% 59.41% 55.12% 51.29% 49.83% Oil derivatives 15.19% 15.20% 13.93% 20.69% 21.70% 26.21% 31.27% 32.70% Machinery and equipment 4.66% 5.89% 6.56% 6.34% 6.27% 6.26% 5.86% 5.88% Insurance 2.04% 2.48% 2.57% 2.75% 2.60% 2.51% 2.32% 2.29% Transportation equipment, including vehicles 2.00% 1.97% 1.99% 1.98% 1.95% 1.93% 1.81% 1.81% Metallic manufactures 1.29% 1.27% 1.28% 1.28% 1.26% 1.25% 1.17% 1.17% Rubber and plastic products 0.73% 0.72% 0.72% 0.83% 0.82% 0.81% 0.76% 0.76% Electricity 0.79% 0.78% 0.78% 0.75% 0.74% 0.74% 0.69% 0.69% Other services to business 0.63% 0.66% 0.66% 0.70% 0.69% 0.68% 0.62% 0.62% Leather products 0.65% 0.64% 0.65% 0.66% 0.65% 0.64% 0.60% 0.61% Transportation and storage 0.52% 0.52% 0.51% 0.49% 0.49% 0.48% 0.45% 0.45% Textiles and clothes 0.39% 0.38% 0.38% 0.48% 0.47% 0.47% 0.44% 0.44% Rubber products 0.43% 0.43% 0.43% 0.41% 0.41% 0.40% 0.38% 0.38% Telecommunications 0.41% 0.41% 0.41% 0.40% 0.39% 0.39% 0.36% 0.36% Chemical products 0.40% 0.40% 0.40% 0.39% 0.38% 0.38% 0.36% 0.36% Other products derived from nonmetallic minerals 0.31% 0.30% 0.31% 0.37% 0.33% 0.33% 0.31% 0.31% Construction 0.34% 0.31% 0.31% 0.30% 0.29% 0.29% 0.27% 0.27% Social services 0.24% 0.23% 0.24% 0.25% 0.24% 0.24% 0.22% 0.23% Hotels and restaurants 0.16% 0.16% 0.16% 0.16% 0.15% 0.15% 0.14% 0.14% Paper products 0.15% 0.15% 0.15% 0.15% 0.15% 0.14% 0.14% 0.14% Domestic gas and water 0.15% 0.15% 0.15% 0.15% 0.14% 0.12% 0.11% 0.11% Nonmetallic minerals 0.12% 0.12% 0.12% 0.11% 0.11% 0.11% 0.10% 0.10% Processed wood 0.08% 0.08% 0.08% 0.09% 0.09% 0.09% 0.08% 0.08% Mail 0.08% 0.08% 0.08% 0.08% 0.07% 0.07% 0.07% 0.07% Nonalcoholic beverages 0.06% 0.06% 0.06% 0.05% 0.05% 0.05% 0.05% 0.05% Other chemical products 0.05% 0.04% 0.05% 0.05% 0.05% 0.05% 0.05% 0.05% Other manufactures 0.02% 0.02% 0.02% 0.03% 0.03% 0.03% 0.03% 0.03% Other food products 0.03% 0.03% 0.03% 0.03% 0.02% 0.02% 0.02% 0.02% Education 0.02% 0.02% 0.02% 0.02% 0.02% 0.02% 0.02% 0.02% Financial services (banking) 0.00% 0.01% 0.01% 0.01% 0.01% 0.01% 0.01% 0.01% TOTAL 100.00% 100.00% 100.00% 100.00% 100.00% 100.00% 100.00% 100.00%

130
Table E.3. Intermediate consumption of the oil sector, 2000–07 (%)
Source: Banco Central del Ecuador; Bank staff calculations.
Products 2000 2001 2002 2003 2004 2005 2006 2007 Oil and natural gas 56.34% 55.23% 56.91% 50.87% 49.86% 46.27% 43.43% 42.27% Oil derivatives 13.85% 13.97% 13.29% 19.01% 19.96% 23.66% 27.93% 29.08% Other services to business 10.55% 9.43% 7.22% 7.59% 7.09% 7.46% 7.40% 7.87% Machinery and equipment 4.17% 5.39% 6.12% 5.90% 5.78% 5.75% 5.42% 5.42% Chemical products 2.65% 3.09% 3.26% 3.20% 3.17% 3.11% 2.91% 2.73% Insurance 1.85% 2.22% 2.34% 2.49% 2.49% 2.41% 2.24% 2.20% Construction 2.14% 2.18% 2.15% 2.11% 2.08% 2.04% 1.91% 1.79% Transportation equipment, including vehicles 1.86% 1.85% 1.90% 1.88% 1.86% 1.84% 1.73% 1.73% Transportation and storage 1.01% 1.09% 1.11% 1.10% 2.02% 1.86% 1.73% 1.62% Metallic manufactures 1.13% 1.12% 1.15% 1.15% 1.12% 1.11% 1.04% 1.05% Rubber and plastic products 0.64% 0.63% 0.65% 0.74% 0.72% 0.72% 0.67% 0.68% Electricity 0.67% 0.67% 0.69% 0.66% 0.64% 0.64% 0.60% 0.60% Leather products 0.57% 0.57% 0.58% 0.59% 0.58% 0.57% 0.54% 0.55% Textiles and clothes 0.34% 0.34% 0.35% 0.43% 0.42% 0.42% 0.39% 0.39% Telecommunications 0.38% 0.38% 0.39% 0.38% 0.37% 0.36% 0.34% 0.34% Rubber products 0.38% 0.38% 0.39% 0.37% 0.36% 0.36% 0.34% 0.34% Other products derived from nonmetallic minerals 0.31% 0.31% 0.32% 0.37% 0.33% 0.33% 0.31% 0.31% Social services 0.22% 0.22% 0.23% 0.23% 0.23% 0.23% 0.21% 0.21% Hotels and restaurants 0.21% 0.21% 0.22% 0.21% 0.21% 0.21% 0.20% 0.19% Paper products 0.14% 0.14% 0.14% 0.14% 0.13% 0.13% 0.12% 0.12% Nonmetallic minerals 0.12% 0.12% 0.12% 0.12% 0.12% 0.11% 0.11% 0.11% Domestic gas and water 0.14% 0.14% 0.14% 0.13% 0.13% 0.11% 0.10% 0.10% Processed wood 0.08% 0.08% 0.08% 0.09% 0.09% 0.09% 0.08% 0.08% Mail 0.07% 0.07% 0.07% 0.07% 0.07% 0.07% 0.06% 0.06% Other chemical products 0.05% 0.05% 0.05% 0.05% 0.05% 0.05% 0.05% 0.05% Nonalcoholic beverages 0.05% 0.05% 0.05% 0.05% 0.05% 0.05% 0.04% 0.04% Other manufactures 0.02% 0.02% 0.02% 0.03% 0.03% 0.03% 0.02% 0.02% Education 0.02% 0.02% 0.02% 0.02% 0.02% 0.02% 0.02% 0.02% Other food products 0.02% 0.02% 0.02% 0.02% 0.02% 0.02% 0.02% 0.02% Financial services (banking) 0.00% 0.01% 0.01% 0.01% 0.01% 0.01% 0.01% 0.01% TOTAL 100.00% 100.00% 100.00% 100.00% 100.00% 100.00% 100.00% 100.00%

131
Table E.4. Share of oil extraction in total input utilization, 2000–07 (%)
Source: Banco Central del Ecuador; Bank staff calculations.
Products 2000 2001 2002 2003 2004 2005 2006 2007 Chemical products 28.48% 32.91% 32.80% 34.36% 35.58% 34.15% 32.09% 28.83% Other services to business 22.64% 20.12% 14.28% 14.95% 14.87% 15.23% 15.63% 16.30% Insurance 4.54% 4.18% 3.80% 3.61% 6.77% 6.65% 6.37% 5.77% Oil derivatives 2.08% 2.28% 2.36% 2.32% 2.95% 2.70% 2.44% 2.22% Construction 2.19% 1.90% 1.51% 1.56% 1.65% 1.57% 1.52% 1.45% Transportation and storage 0.60% 0.66% 0.63% 0.64% 1.61% 1.45% 1.38% 1.24% Machinery and equipment 0.62% 0.69% 0.61% 0.66% 0.68% 0.59% 0.58% 0.52% Domestic gas and water 0.54% 0.56% 0.50% 0.50% 0.53% 0.52% 0.50% 0.47% Nonmetallic minerals 0.59% 0.56% 0.53% 0.50% 0.53% 0.54% 0.49% 0.46% Transportation equipment, including vehicles 0.68% 0.45% 0.39% 0.51% 0.59% 0.46% 0.40% 0.36% Social services 0.33% 0.39% 0.35% 0.35% 0.37% 0.38% 0.36% 0.33% Oil and natural gas 0.26% 0.26% 0.25% 0.25% 0.28% 0.29% 0.33% 0.33% Hotels and restaurants 0.39% 0.38% 0.34% 0.34% 0.39% 0.37% 0.35% 0.32% Other products derived from nonmetallic minerals 0.40% 0.37% 0.33% 0.34% 0.36% 0.35% 0.32% 0.28% Mail 0.41% 0.40% 0.37% 0.36% 0.36% 0.36% 0.33% 0.28% Metallic manufactures 0.41% 0.35% 0.26% 0.32% 0.34% 0.31% 0.28% 0.27% Rubber products 0.31% 0.30% 0.30% 0.33% 0.34% 0.32% 0.29% 0.26% Leather products 0.42% 0.35% 0.31% 0.31% 0.32% 0.31% 0.30% 0.26% Rubber and plastic products 0.29% 0.26% 0.21% 0.20% 0.26% 0.26% 0.24% 0.22% Telecommunications 0.22% 0.22% 0.19% 0.17% 0.16% 0.12% 0.11% 0.09% Electricity 0.11% 0.10% 0.09% 0.09% 0.10% 0.09% 0.09% 0.08% Processed wood 0.09% 0.09% 0.08% 0.08% 0.09% 0.08% 0.08% 0.07% Textiles and clothes 0.06% 0.05% 0.05% 0.05% 0.06% 0.06% 0.06% 0.05% Paper products 0.04% 0.04% 0.04% 0.04% 0.04% 0.04% 0.04% 0.03% Nonalcoholic beverages 0.02% 0.03% 0.02% 0.02% 0.02% 0.02% 0.02% 0.02% Education 0.01% 0.02% 0.01% 0.01% 0.02% 0.01% 0.01% 0.01% Other chemical products 0.02% 0.02% 0.02% 0.02% 0.01% 0.01% 0.01% 0.01% Other manufactures 0.01% 0.00% 0.00% 0.00% 0.00% 0.00% 0.00% 0.00% Other food products 0.00% 0.00% 0.00% 0.00% 0.00% 0.00% 0.00% 0.00% Financial services (banking) 0.00% 0.00% 0.00% 0.00% 0.00% 0.00% 0.00% 0.00% TOTAL 1.33% 1.21% 0.99% 1.03% 1.14% 1.10% 1.08% 1.05%

132
Table E.5. Share of total input use of the oil refinery subsector, 2000–07 (%)
Source: Banco Central del Ecuador; Bank staff calculations.
Products 2000 2001 2002 2003 2004 2005 2006 2007 Insurance 45.01% 48.51% 47.82% 49.34% 44.00% 43.08% 41.62% 40.08% Oil derivatives 19.13% 19.93% 18.17% 25.25% 27.95% 31.46% 36.56% 37.57% Oil and natural gas 40.37% 38.82% 40.46% 35.72% 31.02% 29.53% 29.64% 31.30% Machinery and equipment 7.14% 6.24% 5.85% 6.25% 6.32% 5.59% 5.56% 5.37% Domestic gas and water 6.17% 6.03% 5.69% 5.62% 5.79% 4.69% 4.58% 4.61% Metallic manufactures 6.04% 4.93% 3.83% 4.80% 5.02% 4.58% 4.25% 4.32% Leather products 5.92% 4.75% 4.36% 4.56% 4.63% 4.53% 4.36% 4.13% Rubber products 4.66% 4.29% 4.52% 4.82% 4.91% 4.71% 4.30% 4.09% Plastic products 4.67% 4.01% 3.49% 3.91% 4.12% 4.24% 3.97% 3.94% Mail 5.18% 4.76% 4.75% 4.47% 4.43% 4.47% 4.13% 3.80% Chemical products 4.07% 3.91% 3.79% 3.92% 3.98% 3.86% 3.66% 3.56% Social services 2.40% 2.72% 2.56% 2.71% 2.85% 2.92% 2.86% 2.81% Transportation equipment, including vehicles 5.19% 3.25% 2.95% 3.92% 3.96% 3.13% 2.77% 2.69% Electricity 2.78% 2.51% 2.46% 2.35% 2.40% 2.32% 2.25% 2.24% Nonmetallic minerals 2.32% 2.11% 2.09% 1.94% 2.04% 2.07% 1.90% 1.91% Other products derived from nonmetallic minerals 1.73% 1.51% 1.42% 1.76% 1.70% 1.65% 1.51% 1.46% Other services to business 1.16% 1.24% 1.19% 1.25% 1.30% 1.25% 1.18% 1.16% Telecommunications 1.77% 1.72% 1.53% 1.34% 1.26% 0.96% 0.88% 0.82% Textiles and clothes 0.75% 0.68% 0.69% 0.89% 0.89% 0.87% 0.85% 0.82% Nonalcoholic beverages 0.58% 0.61% 0.56% 0.58% 0.59% 0.59% 0.59% 0.56% Hotels and restaurants 0.68% 0.62% 0.59% 0.57% 0.59% 0.58% 0.55% 0.55% Paper products 0.45% 0.44% 0.43% 0.40% 0.41% 0.40% 0.39% 0.39% Transportation and storage 0.43% 0.42% 0.40% 0.39% 0.40% 0.40% 0.38% 0.38% Processed wood 0.35% 0.34% 0.32% 0.38% 0.39% 0.37% 0.37% 0.36% Construction 0.33% 0.25% 0.21% 0.21% 0.22% 0.21% 0.21% 0.21% Other food products 0.13% 0.11% 0.10% 0.09% 0.10% 0.09% 0.09% 0.09% Education 0.09% 0.08% 0.08% 0.08% 0.08% 0.08% 0.08% 0.08% Other manufactures 0.07% 0.06% 0.06% 0.08% 0.08% 0.08% 0.08% 0.08% Other chemical products 0.07% 0.07% 0.06% 0.08% 0.07% 0.07% 0.07% 0.06% Financial services (banking) 0.00% 0.03% 0.02% 0.02% 0.02% 0.02% 0.02% 0.02% TOTAL 6.17% 5.73% 5.37% 5.48% 5.62% 5.41% 5.55% 5.49%

133
Table E.6. Share of the oil sector in total input use, 2000–07 (%)
Source: Banco Central del Ecuador; Bank staff calculations
Products 2000 2001 2002 2003 2004 2005 2006 2007 Insurance 49.55% 52.69% 51.62% 52.95% 50.77% 49.73% 47.99% 45.85% Oil derivatives 21.21% 22.21% 20.53% 27.57% 30.90% 34.16% 39.00% 39.80% Chemical products 32.56% 36.82% 36.59% 38.28% 39.56% 38.01% 35.75% 32.39% Oil and natural gas 40.63% 39.08% 40.71% 35.97% 31.30% 29.82% 29.97% 31.63% Other services to business 23.80% 21.36% 15.47% 16.20% 16.17% 16.48% 16.81% 17.45% Machinery and equipment 7.76% 6.93% 6.45% 6.91% 6.99% 6.18% 6.15% 5.89% Domestic gas and water 6.72% 6.59% 6.19% 6.12% 6.32% 5.21% 5.09% 5.08% Metallic manufactures 6.45% 5.29% 4.09% 5.12% 5.36% 4.89% 4.54% 4.59% Leather products 6.33% 5.10% 4.67% 4.87% 4.95% 4.84% 4.65% 4.39% Rubber products 4.98% 4.59% 4.82% 5.15% 5.25% 5.03% 4.59% 4.34% Rubber and plastic products 4.96% 4.27% 3.70% 4.12% 4.38% 4.50% 4.21% 4.16% Mail 5.59% 5.16% 5.13% 4.83% 4.79% 4.83% 4.46% 4.08% Social services 2.73% 3.11% 2.90% 3.06% 3.22% 3.30% 3.22% 3.14% Transportation equipment, including vehicles 5.87% 3.70% 3.34% 4.43% 4.54% 3.59% 3.17% 3.05% Nonmetallic minerals 2.91% 2.67% 2.61% 2.44% 2.57% 2.60% 2.39% 2.37% Electricity 2.89% 2.61% 2.56% 2.44% 2.49% 2.41% 2.34% 2.32% Other products derived from nonmetallic minerals 2.13% 1.89% 1.75% 2.10% 2.07% 1.99% 1.82% 1.74% Construction 2.52% 2.15% 1.72% 1.77% 1.87% 1.78% 1.73% 1.66% Transportation and storage 1.03% 1.09% 1.03% 1.03% 2.02% 1.85% 1.76% 1.62% Telecommunications 1.99% 1.94% 1.71% 1.50% 1.42% 1.08% 0.99% 0.92% Hotels and restaurants 1.07% 1.01% 0.93% 0.91% 0.98% 0.95% 0.90% 0.87% Textiles and clothes 0.81% 0.73% 0.74% 0.94% 0.95% 0.92% 0.91% 0.87% Nonalcoholic beverages 0.61% 0.64% 0.58% 0.60% 0.61% 0.62% 0.61% 0.58% Processed wood 0.43% 0.43% 0.40% 0.46% 0.48% 0.45% 0.45% 0.43% Paper products 0.49% 0.48% 0.46% 0.43% 0.44% 0.43% 0.42% 0.42% Education 0.10% 0.10% 0.09% 0.09% 0.10% 0.10% 0.10% 0.09% Other food products 0.13% 0.11% 0.10% 0.10% 0.10% 0.10% 0.09% 0.09% Other manufactures 0.07% 0.07% 0.06% 0.09% 0.09% 0.09% 0.08% 0.08% Other chemical products 0.09% 0.08% 0.08% 0.09% 0.09% 0.09% 0.08% 0.08% Financial services (banking) 0.00% 0.03% 0.02% 0.02% 0.02% 0.02% 0.02% 0.02% Total 7.50% 6.94% 6.35% 6.52% 6.76% 6.51% 6.63% 6.54%


135
APPENDIX F. TARIFFS AND EFFECTIVE PROTECTION INDEXES
Table F.1. Average tariff for final output of the tradable sectors of Ecuador’s national accounts (%)
Sector
Average tariff for final
output
Bananas, coffee, cacao 23.93
Cereals 29.50
Flowers 20.00
Other crops 24.27
Farming 17.50
Forestry 15.00
Shrimp 30.00
Fishing 29.51
Oil, natural gas 0.00
Mining 15.58
Processed meat 39.78
Processed shrimp 30.00
Processed fish 29.51
Vegetable oil and fats 21.45
Dairy products 32.30
Mills and bakery 28.46
Processed sugar 27.50
Chocolate and sweets 25.00
Other food products 27.73
Beverages 28.53
Tobacco products 30.00
Textiles 29.49
Wood processing 27.68
Paper products 29.76
Oil processing and refinery 5.00
Chemical products 9.41
Rubber and plastic products 23.50
Nonmetallic products 23.46
Metallic products 22.82
Machinery and industrial
equipment
21.68
Vehicles and parts 21.38
Other manufactures 27.31
Source: Banco Central del Ecuador, COMEXI. Authors’ calculations.

136
Table F.2. Average tariff for the inputs defined in Ecuador’s national accounts (%)
Product Average tariff
Bananas, coffee, cacao 24.58
Cereals 4.84
Flowers 16.84
Other crops 23.44
Farming 11.14
Forestry 15.00
Shrimp 30.00
Processed shrimp 30.00
Fish 24.20
Processed fish 24.20
Other sea products 24.20
Oil and natural gas 0.00
Metallic minerals 0.07
Nonmetallic minerals 1.86
Meat processing 39.78
Vegetable oil and fats 7.66
Dairy products 32.30
Flour 21.76
Bakery 5.00
Sugars 5.00
Processed cacao 20.00
Chocolate and sweets 30.00
Other food products 19.67
Processed coffee 30.00
Alcoholic beverages 27.86
Nonalcoholic beverages 4.75
Tobacco products 30.00
Textiles 23.16
Leather products 24.66
Wood processing 24.22
Paper production 8.33
Oil derivatives 0.28
Chemical products 0.28
Other chemicals 0.28
Rubber products 3.15
Plastic products 0.05
Nonmetallic products 9.34
Other nonmetallic products 9.34
Common metallic products 7.01
Other metallic products 7.01
Machinery and industrial equipment 3.30
Vehicles and parts 4.59
Other manufactures 15.54
Source: Banco Central del Ecuador, COMEXI. Authors’ calculations.

137
Table F.3. Effective protection indexes for Ecuador’s tradable sectors (%)
Sector GDP growth Growth of exports
Sector
Effective rate
of protection
Nominal rate
of protection 2006–07 1993–2007 2000–07 2006–07 1993–2007 2000–07
Bananas, coffee, cacao 31.53 23.93 5.10 91.52 29.38 9.87 116.19 72.68
Cereals 41.45 29.50 7.79 30.54 38.34 -6.17 1747.41 196.92
Flowers 21.63 20.00 1.00 838.84 46.29 7.62 1068.44 139.04
Other crops 29.95 24.27 4.47 72.70 36.96 10.06 2236.02 260.88
Farming 16.46 17.50 5.02 50.20 32.22 -46.64 -49.83 -0.72
Forestry 15.47 15.00 3.63 92.96 23.36 56.39 1033.59 165.28
Shrimp 36.31 30.00 7.80 96.34 169.71 0.00 0.00 0.00
Fishing 43.07 29.51 2.42 80.44 70.35 43.95 27.45 34.81
Oil, natural gas -0.05 0.00 -4.92 56.11 27.36 7.13 544.74 246.47
Mining 18.60 15.58 -4.79 54.85 27.36 72.56 673.68 455.77
Processed meat 89.11 39.78 4.07 52.95 35.39 46.52 -47.76 -81.20
Processed shrimp 31.40 30.00 8.28 65.77 174.19 3.93 32.21 111.16
Processed fish 40.34 29.51 0.49 141.25 48.48 20.32 829.52 200.13
Vegetable oil and fats 47.13 21.45 6.24 95.47 42.97 101.21 2015.80 730.07
Dairy products 57.77 32.30 4.26 66.29 38.35 900.15 89.06 14.12
Mills and bakery 158.61 28.46 -1.93 28.33 22.00 16.25 274.99 -8.27
Sugar processing 32.46 27.50 2.05 53.79 24.16 -36.83 374.22 72.70
Chocolate and sweets 38.37 25.00 8.88 87.28 30.52 45.28 15.19 2.45
Other food products 42.47 27.73 15.47 77.58 40.14 26.77 494.39 201.70
Beverages 47.52 28.53 14.28 47.71 23.69 63.78 733.01 230.61
Tobacco products 42.51 30.00 0.11 -0.78 -3.93 1930.24 -57.11 53.50
Textiles 39.06 29.49 2.60 25.70 8.10 17.37 193.88 67.16
Processed wood 47.48 27.68 4.26 79.36 27.62 31.46 251.51 121.32
Paper products 79.72 29.76 4.29 51.71 19.42 27.00 386.73 205.63
Oil processing and refinery 79.89 5.00 2.37 193.19 40.12 47.45 761.29 201.59
Chemical products 14.89 9.41 3.28 22.52 25.54 -12.99 357.09 99.90
Rubber and plastic products 92.08 23.50 0.13 21.97 15.69 40.46 1825.21 122.89
Nonmetallic products 46.55 23.46 5.34 63.55 37.14 -13.25 293.25 72.95
Metallic products 129.93 22.82 2.31 5.05 70.35 37.87 286.45 565.50
Machinery and industrial
equipment 38.79 21.68 7.58 51.42 35.11 27.57 779.37 416.95
Vehicles and parts 158.38 21.38 11.76 61.58 151.83 12.81 609.14 479.29
Other manufactures 81.78 27.31 0.81 109.77 5.55 51.02 455.20 157.27
Source: Banco Central del Ecuador, COMEXI. Authors’ calculations.


139
APPENDIX G. SIMULATED CUMULATIVE DISTRIBUTION FUNCTION (CDF) FOR
INDIVIDUAL SECTORS AND PROBABILITY OF OBSERVING THE GROWTH RATE WITHIN A
RANGE
The analysis of the oil and non-oil sectors in Chapters 2 and 3 raises questions about the
growth prospects of Ecuador’s economy under various scenarios of interaction between
the sectors. This annex explores these prospects.
The quarterly projections and simulations were carried out for the period 2008–13. Final
results are consolidated for each year. This analysis uses quarterly data for sector GDP
from 1993 to the third quarter 2008. All the sectors were grouped into seven large
categories: oil, industrial manufactures, primary products, public sector, construction,
production-related services (transportation, finance, and commerce), and other services
(education, health, professional, and domestic). The simulation uses a procedure
developed in Richardson and Condra (1978) and in Richardson, Klose and Grey (2000)
that maintains the contemporaneous correlation among the variables in the simulated
output.
The procedure consists in estimating the expected value of a variable—in this case sector
GDP—using an appropriate econometric technique. We use autoregressive integrated
moving-average (ARIMA) models for each sector, focused on finding the best model for
prediction purposes (minimizing the mean square errors (MSE) of the predictions).
Unfortunately, there are too few observations to divide the sample and carry out sample
tests. The residuals for each sector’s GDP are then estimated, and we calculate the
contemporaneous correlations matrix of these residuals.
The next step uses factorization of the correlation matrix to translate the
contemporaneous correlation to uniform standard deviate variables, one for each sector in
each period we forecast. This ensures that contemporaneous correlation is maintained in
the forecasts. The correlated uniform standard deviates are used to generate exogenous
shocks from the distribution of the residuals (we use an empirical distribution for the
residuals). The forecasts are done using the ARIMA models estimated for each sector
plus the shock previously generated. For each simulated period, real GDP is
approximated as the sum of each sector’s GDP. The analysis focuses on the simulated
annual growth rates of real GDP and the sectors and their simulated distributions.
In this appendix, we present the results of a probabilistic simulation analysis of four
scenarios and their effects on sector and overall growth rates:
Scenario 1: Current conditions. This base scenario reflects historic growth trends for
each sector, adjusted to reflect the global economic crisis in 2009 with a recovery in
2010 back to the historic trend. Quarterly growth, measured in percentage points, is
slowed throughout 2009 to simulate the impact of the economic crisis.
Scenario 2: Rise of oil prices and higher fiscal revenue. This scenario reflects a
positive external shock in oil prices from June 2010 to March 2011, similar in nature
to the price increases experienced in 2007–08. After the shock, the economy is
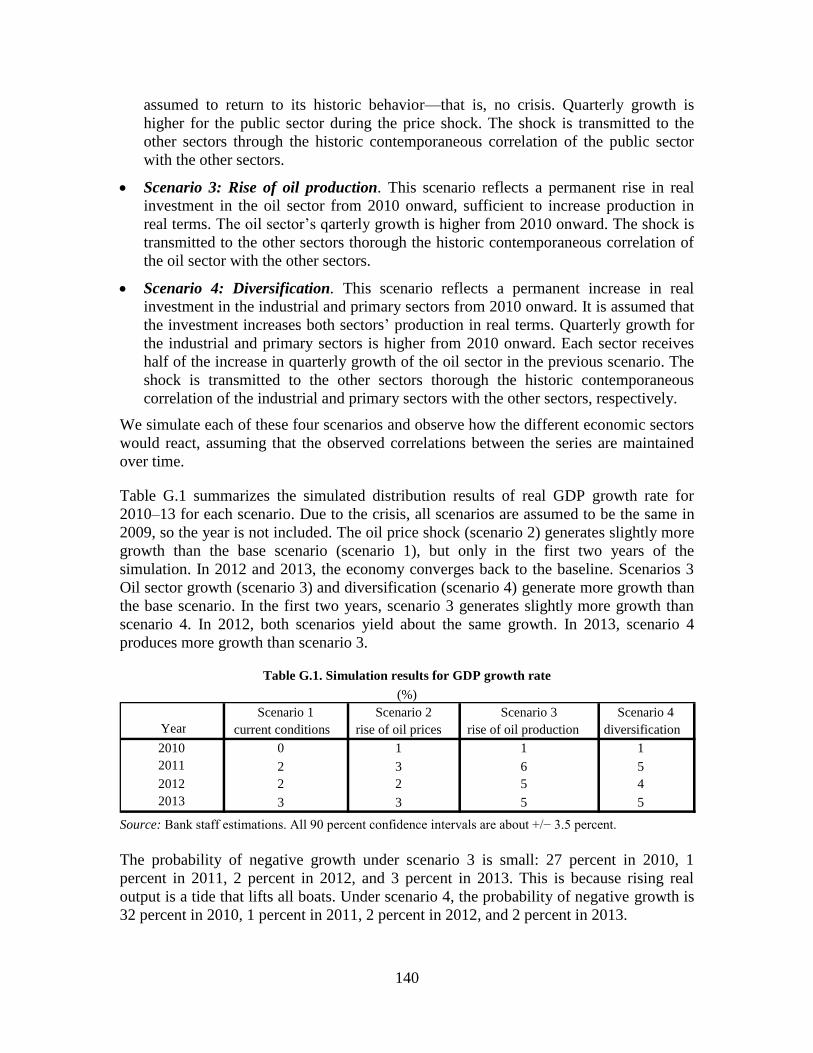
140
assumed to return to its historic behavior—that is, no crisis. Quarterly growth is
higher for the public sector during the price shock. The shock is transmitted to the
other sectors through the historic contemporaneous correlation of the public sector
with the other sectors.
Scenario 3: Rise of oil production. This scenario reflects a permanent rise in real
investment in the oil sector from 2010 onward, sufficient to increase production in
real terms. The oil sector’s qarterly growth is higher from 2010 onward. The shock is
transmitted to the other sectors thorough the historic contemporaneous correlation of
the oil sector with the other sectors.
Scenario 4: Diversification. This scenario reflects a permanent increase in real
investment in the industrial and primary sectors from 2010 onward. It is assumed that
the investment increases both sectors’ production in real terms. Quarterly growth for
the industrial and primary sectors is higher from 2010 onward. Each sector receives
half of the increase in quarterly growth of the oil sector in the previous scenario. The
shock is transmitted to the other sectors thorough the historic contemporaneous
correlation of the industrial and primary sectors with the other sectors, respectively.
We simulate each of these four scenarios and observe how the different economic sectors
would react, assuming that the observed correlations between the series are maintained
over time.
Table G.1 summarizes the simulated distribution results of real GDP growth rate for
2010–13 for each scenario. Due to the crisis, all scenarios are assumed to be the same in
2009, so the year is not included. The oil price shock (scenario 2) generates slightly more
growth than the base scenario (scenario 1), but only in the first two years of the
simulation. In 2012 and 2013, the economy converges back to the baseline. Scenarios 3
Oil sector growth (scenario 3) and diversification (scenario 4) generate more growth than
the base scenario. In the first two years, scenario 3 generates slightly more growth than
scenario 4. In 2012, both scenarios yield about the same growth. In 2013, scenario 4
produces more growth than scenario 3.
Table G.1. Simulation results for GDP growth rate
(%)
Source: Bank staff estimations. All 90 percent confidence intervals are about +/− 3.5 percent.
The probability of negative growth under scenario 3 is small: 27 percent in 2010, 1
percent in 2011, 2 percent in 2012, and 3 percent in 2013. This is because rising real
output is a tide that lifts all boats. Under scenario 4, the probability of negative growth is
32 percent in 2010, 1 percent in 2011, 2 percent in 2012, and 2 percent in 2013.
Scenario 1 Scenario 2 Scenario 3 Scenario 4 Year current conditions rise of oil prices rise of oil production diversification
2010 0 1 1 1 2011 2 3 6 5 2012 2 2 5 4 2013 3 3 5 5

141
A similar effect occurs for the probability of observing a growth rate higher than 5
percent. Under scenario 3, this probability is 5 percent in 2010, 63 percent in 2011, 42
percent in 2012, and 45 percent in 2013. Under scenario 4, the probability of higher
growth is 4 percent in 2010, 54 percent in 2011, 40 percent in 2012, and 56 percent in
2013. This indicates that real growth in the oil sector has a quick positive effect on the
economy, although this effect diminishes as time passes. Nevertheless, real growth in the
industrial and primary sector yields more growth in the economy as time passes. This
implies that intersectoral linkages between the industrial and primary sectors and the rest
of the economy are more developed than those between the oil sector and the rest of the
economy.
The following summarizes our results:
The most favorable scenario for the oil sector entails increased investment that raises
production.
For both the industrial sector and the non-oil primary sector, the diversification
scenario is clearly the best.
The public sector grows the most in the scenario with a positive oil-price shock. The
current situation scenario and the diversification scenario do not affect the size of the
public sector, and it fares worst in the scenario in which oil production rises.
The service sector display the highest growth rates under the rising oil-production
scenario.
Finally, construction only improves under rising oil-production scenario; the other
three scenarios have no effect on construction.
The results for services and industrial sectors can be interpreted as a sign of partial Dutch
disease because higher growth in the oil sector implies higher growth in the service sector
and no effect in the industrial sector.
The results for the service sector and construction confirm these sectors’ closer proximity
to the oil sector, as discussed in Chapter 2.
One way of interpreting these results is to compare two scenarios. In one, Ecuador makes
an effort to boost oil production through, for example, better governance and new
investments, addressing some of the weaknesses discussed in Chapter 2. In another, is the
country makes a conscious effort to diversify the economy by boosting both the industrial
and primary sectors. The results indicate that both scenarios have similar long-term
results—but the first is slightly better for growth in the short run and slightly worse in the
long run. I
The following charts show the probability of observing a lower or equal growth rate than
a selected value. In 2013, for example, the probability of observing a growth rate less
than or equal to 5 percent is 40 percent under scenario 4 (green line) and approximately
80 percent under scenarios 1 and 2 (black and red lines). The farther to the right the

142
distribution, the better the scenario is in terms of generating higher growth at any
probability level.
Figure G.1. CDF of growth rate of real GDP, 2010
The CDF graphs give the probability (vertical axis) of
observing a growth rate (horizontal axis) smaller or
equal than a given value. For example the probability of
observing in 2010 a growth rate smaller or equal to 0
percent in scenarios 1 and 2 is close to 50 percent, while
in scenarios 3 and 4 this probability is close to 30%.
Figure G.2. CDF of growth rate of real GDP, 2011
Figure G.3. CDF of growth rate of real GDP, 2012
0%
10%
20%
30%
40%
50%
60%
70%
80%
90%
100%
-10% -5% 0% 5% 10% 15%
GDP* 2010: 1 GDP* 2010: 2 GDP* 2010: 3 GDP* 2010: 4
0%
10%
20%
30%
40%
50%
60%
70%
80%
90%
100%
-10% -5% 0% 5% 10% 15% 20%
GDP* 2011: 1 GDP* 2011: 2 GDP* 2011: 3 GDP* 2011: 4
0%
10%
20%
30%
40%
50%
60%
70%
80%
90%
100%
-5% 0% 5% 10% 15%
GDP* 2012: 1 GDP* 2012: 2 GDP* 2012: 3 GDP* 2012: 4

143
Figure G.4. CDF of growth rate of real GDP, 2013
Figure G.5. Probability of observing growth rate of real GDP within a certain range, 2010
Figure G.6. Probability of observing growth rate of real GDP within a certain range, 2011
Figure G.7. Probability of observing growth rate of real GDP within a certain range, 2012
0%
10%
20%
30%
40%
50%
60%
70%
80%
90%
100%
-10% -5% 0% 5% 10% 15%
GDP* 2013: 1 GDP* 2013: 2 GDP* 2013: 3 GDP* 2013: 4
0%
10%
20%
30%
40%
50%
60%
70%
80%
90%
100%
GDP* 2010: 1 GDP* 2010: 2 GDP* 2010: 3 GDP* 2010: 4
< 0% 0-1% 1-2% 2-3% 3-4% 4-5% >5%
0%
10%
20%
30%
40%
50%
60%
70%
80%
90%
100%
GDP* 2011: 1 GDP* 2011: 2 GDP* 2011: 3 GDP* 2011: 4
< 0% 0-1% 1-2% 2-3% 3-4% 4-5% >5%
0%
10%
20%
30%
40%
50%
60%
70%
80%
90%
100%
GDP* 2012: 1 GDP* 2012: 2 GDP* 2012: 3 GDP* 2012: 4
< 0% 0-1% 1-2% 2-3% 3-4% 4-5% >5%

144
Figure G.8. Probability of observing growth rate of real GDP within a certain range, 2013
Figure G.9. CDF of growth rate of oil GDP, 2010
Figure G.10. CDF of growth rate of oil GDP, 2011
Figure G.11. CDF of growth rate of oil GDP, 2012
0%
10%
20%
30%
40%
50%
60%
70%
80%
90%
100%
GDP* 2013: 1 GDP* 2013: 2 GDP* 2013: 3 GDP* 2013: 4
< 0% 0-1% 1-2% 2-3% 3-4% 4-5% >5%
0%
10%
20%
30%
40%
50%
60%
70%
80%
90%
100%
-40% -20% 0% 20% 40% 60%
Oil 2010: 1 Oil 2010: 2 Oil 2010: 3 Oil 2010: 4
0%
10%
20%
30%
40%
50%
60%
70%
80%
90%
100%
-40% -20% 0% 20% 40% 60% 80%
Oil 2011: 1 Oil 2011: 2 Oil 2011: 3 Oil 2011: 4
0%
10%
20%
30%
40%
50%
60%
70%
80%
90%
100%
-40% -20% 0% 20% 40% 60% 80%
Oil 2012: 1 Oil 2012: 2 Oil 2012: 3 Oil 2012: 4

145
Figure G.12. CDF of growth rate of oil GDP, 2013
Figure G.13. Probability of observing real growth rate of oil GDP within a certain range, 2010
Figure G.14. Probability of observing real growth rate of oil GDP within a certain range, 2011
Figure G.15. Probability of observing real growth rate of oil GDP within a certain range, 2012
0%
10%
20%
30%
40%
50%
60%
70%
80%
90%
100%
-30% -20% -10% 0% 10% 20% 30% 40% 50%
Oil 2013: 1 Oil 2013: 2 Oil 2013: 3 Oil 2013: 4
0%
10%
20%
30%
40%
50%
60%
70%
80%
90%
100%
Oil 2010: 1 Oil 2010: 2 Oil 2010: 3 Oil 2010: 4
< 0% 0-1% 1-2% 2-3% 3-4% 4-5% >5%
0%
10%
20%
30%
40%
50%
60%
70%
80%
90%
100%
Oil 2011: 1 Oil 2011: 2 Oil 2011: 3 Oil 2011: 4
< 0% 0-1% 1-2% 2-3% 3-4% 4-5% >5%
0%
10%
20%
30%
40%
50%
60%
70%
80%
90%
100%
Oil 2012: 1 Oil 2012: 2 Oil 2012: 3 Oil 2012: 4
< 0% 0-1% 1-2% 2-3% 3-4% 4-5% >5%

146
Figure G.16. Probability of observing real growth rate of oil GDP within a certain range, 2013
Figure G.17. CDF of growth rate of industrial sector GDP, 2010
Figure G.18. CDF of growth rate of industrial sector GDP, 2011
Figure G.19. CDF of growth rate of industrial sector GDP, 2012
0%
10%
20%
30%
40%
50%
60%
70%
80%
90%
100%
Oil 2013: 1 Oil 2013: 2 Oil 2013: 3 Oil 2013: 4
< 0% 0-1% 1-2% 2-3% 3-4% 4-5% >5%
0%
10%
20%
30%
40%
50%
60%
70%
80%
90%
100%
-15% -10% -5% 0% 5% 10% 15%
Industrial 2010: 1 Industrial 2010: 2
Industrial 2010: 3 Industrial 2010: 4
0%
10%
20%
30%
40%
50%
60%
70%
80%
90%
100%
-20% -10% 0% 10% 20% 30%
Industrial 2011: 1 Industrial 2011: 2
Industrial 2011: 3 Industrial 2011: 4
0%
10%
20%
30%
40%
50%
60%
70%
80%
90%
100%
-20% -10% 0% 10% 20% 30%
Industrial 2012: 1 Industrial 2012: 2
Industrial 2012: 3 Industrial 2012: 4

147
Figure G.20. CDF of growth rate of industrial sector GDP, 2013
Figure G.21. Probability of observing real growth rate of industrial sector GDP within a certain
range, 2010
Figure G.22. Probability of observing real growth rate of industrial sector GDP within a certain
range, 2011
Figure G.23. Probability of observing real growth rate of industrial sector GDP within a certain
range, 2012
0%
10%
20%
30%
40%
50%
60%
70%
80%
90%
100%
-20% -10% 0% 10% 20% 30%
Industrial 2013: 1 Industrial 2013: 2
Industrial 2013: 3 Industrial 2013: 4
0%
10%
20%
30%
40%
50%
60%
70%
80%
90%
100%
Industrial 2010: 1 Industrial 2010: 2 Industrial 2010: 3 Industrial 2010: 4
< 0% 0-1% 1-2% 2-3% 3-4% 4-5% >5%
0%
10%
20%
30%
40%
50%
60%
70%
80%
90%
100%
Industrial 2011: 1 Industrial 2011: 2 Industrial 2011: 3 Industrial 2011: 4
< 0% 0-1% 1-2% 2-3% 3-4% 4-5% >5%
0%
10%
20%
30%
40%
50%
60%
70%
80%
90%
100%
Industrial 2012: 1 Industrial 2012: 2 Industrial 2012: 3 Industrial 2012: 4
< 0% 0-1% 1-2% 2-3% 3-4% 4-5% >5%

148
Figure G.24. Probability of observing real growth rate of industrial sector GDP within a certain
range, 2013
Figure G.25. CDF of growth rate of primary sector GDP, 2010
Figure G.26. CDF of growth rate of primary sector GDP, 2011
Figure G.27. CDF of growth rate of primary sector GDP, 2012
0%
10%
20%
30%
40%
50%
60%
70%
80%
90%
100%
Industrial 2013: 1 Industrial 2013: 2 Industrial 2013: 3 Industrial 2013: 4
< 0% 0-1% 1-2% 2-3% 3-4% 4-5% >5%
0%
10%
20%
30%
40%
50%
60%
70%
80%
90%
100%
-5% 0% 5% 10% 15% 20%
Primary 2010: 1 Primary 2010: 2 Primary 2010: 3 Primary 2010: 4
0%
10%
20%
30%
40%
50%
60%
70%
80%
90%
100%
-10% -5% 0% 5% 10% 15% 20% 25%
Primary 2011: 1 Primary 2011: 2 Primary 2011: 3 Primary 2011: 4
0%
10%
20%
30%
40%
50%
60%
70%
80%
90%
100%
-10% -5% 0% 5% 10% 15%
Primary 2012: 1 Primary 2012: 2 Primary 2012: 3 Primary 2012: 4

149
Figure G.28. CDF of growth rate of primary sector GDP, 2013
Figure G.29. Probability of observing growth rate of real primary sector within a certain range, 2010
Figure G.30. Probability of observing growth rate of real primary sector within a certain range, 2011
Figure G.31. Probability of observing growth rate of real primary sector within a certain range, 2012
0%
10%
20%
30%
40%
50%
60%
70%
80%
90%
100%
-5% 0% 5% 10% 15%
Primary 2013: 1 Primary 2013: 2 Primary 2013: 3 Primary 2013: 4
0%
10%
20%
30%
40%
50%
60%
70%
80%
90%
100%
Primary 2010: 1 Primary 2010: 2 Primary 2010: 3 Primary 2010: 4
< 0% 0-1% 1-2% 2-3% 3-4% 4-5% >5%
0%
10%
20%
30%
40%
50%
60%
70%
80%
90%
100%
Primary 2011: 1 Primary 2011: 2 Primary 2011: 3 Primary 2011: 4
< 0% 0-1% 1-2% 2-3% 3-4% 4-5% >5%
0%
10%
20%
30%
40%
50%
60%
70%
80%
90%
100%
Primary 2012: 1 Primary 2012: 2 Primary 2012: 3 Primary 2012: 4
< 0% 0-1% 1-2% 2-3% 3-4% 4-5% >5%

150
Figure G.32. Probability of observing growth rate of real primary sector within a certain range, 2013
Figure G.33. CDF of growth rate of public sector GDP, 2010
Figure G.34. CDF of growth rate of public sector GDP, 2011
Figure G.35. CDF of growth rate of public sector GDP, 2012
0%
10%
20%
30%
40%
50%
60%
70%
80%
90%
100%
Primary 2013: 1 Primary 2013: 2 Primary 2013: 3 Primary 2013: 4
< 0% 0-1% 1-2% 2-3% 3-4% 4-5% >5%
0%
10%
20%
30%
40%
50%
60%
70%
80%
90%
100%
-15% -10% -5% 0% 5% 10% 15%
Public 2010: 1 Public 2010: 2 Public 2010: 3 Public 2010: 4
0%
10%
20%
30%
40%
50%
60%
70%
80%
90%
100%
-20% -15% -10% -5% 0% 5% 10% 15% 20%
Public 2011: 1 Public 2011: 2 Public 2011: 3 Public 2011: 4
0%
10%
20%
30%
40%
50%
60%
70%
80%
90%
100%
-20% -15% -10% -5% 0% 5% 10% 15%
Public 2012: 1 Public 2012: 2 Public 2012: 3 Public 2012: 4
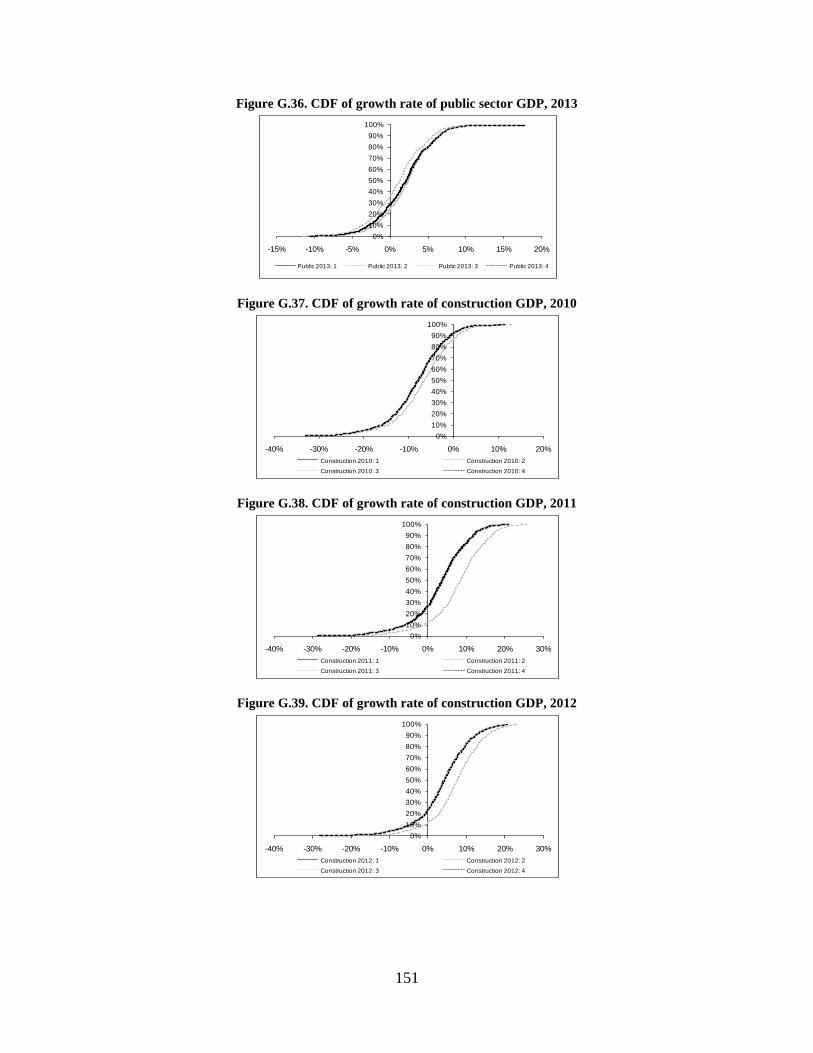
151
Figure G.36. CDF of growth rate of public sector GDP, 2013
Figure G.37. CDF of growth rate of construction GDP, 2010
Figure G.38. CDF of growth rate of construction GDP, 2011
Figure G.39. CDF of growth rate of construction GDP, 2012
0%
10%
20%
30%
40%
50%
60%
70%
80%
90%
100%
-15% -10% -5% 0% 5% 10% 15% 20%
Public 2013: 1 Public 2013: 2 Public 2013: 3 Public 2013: 4
0%
10%
20%
30%
40%
50%
60%
70%
80%
90%
100%
-40% -30% -20% -10% 0% 10% 20%
Construction 2010: 1 Construction 2010: 2
Construction 2010: 3 Construction 2010: 4
0%
10%
20%
30%
40%
50%
60%
70%
80%
90%
100%
-40% -30% -20% -10% 0% 10% 20% 30%
Construction 2011: 1 Construction 2011: 2
Construction 2011: 3 Construction 2011: 4
0%
10%
20%
30%
40%
50%
60%
70%
80%
90%
100%
-40% -30% -20% -10% 0% 10% 20% 30%
Construction 2012: 1 Construction 2012: 2
Construction 2012: 3 Construction 2012: 4

152
Figure G.40. CDF of growth rate of construction GDP, 2013
Figure G.41. CDF of growth rate of production-related services GDP, 2010
Figure G.42. CDF of growth rate of production-related services GDP, 2011
Figure G.43. CDF of growth rate of production-related services GDP, 2012
0%
10%
20%
30%
40%
50%
60%
70%
80%
90%
100%
-40% -30% -20% -10% 0% 10% 20% 30%
Construction 2013: 1 Construction 2013: 2
Construction 2013: 3 Construction 2013: 4
0%
10%
20%
30%
40%
50%
60%
70%
80%
90%
100%
-15% -10% -5% 0% 5% 10% 15%
Prod. Services 2010: 1 Prod. Services 2010: 2
Prod. Services 2010: 3 Prod. Services 2010: 4
0%
10%
20%
30%
40%
50%
60%
70%
80%
90%
100%
-10% -5% 0% 5% 10% 15% 20%
Prod. Services 2011: 1 Prod. Services 2011: 2
Prod. Services 2011: 3 Prod. Services 2011: 4
0%
10%
20%
30%
40%
50%
60%
70%
80%
90%
100%
-15% -10% -5% 0% 5% 10% 15% 20%
Prod. Services 2012: 1 Prod. Services 2012: 2
Prod. Services 2012: 3 Prod. Services 2012: 4

153
Figure G.44. CDF of growth rate of production-related services GDP, 2013
Figure G.45. CDF of growth rate of other services GDP, 2010
Figure G.46. CDF of growth rate of other services GDP, 2011
Figure G.47. CDF of growth rate of other services GDP, 2012
0%
10%
20%
30%
40%
50%
60%
70%
80%
90%
100%
-15% -10% -5% 0% 5% 10% 15% 20%
Prod. Services 2013: 1 Prod. Services 2013: 2
Prod. Services 2013: 3 Prod. Services 2013: 4
0%
10%
20%
30%
40%
50%
60%
70%
80%
90%
100%
-10% -5% 0% 5% 10%
Other services 2010: 1 Other services 2010: 2
Other services 2010: 3 Other services 2010: 4
0%
10%
20%
30%
40%
50%
60%
70%
80%
90%
100%
-10% -5% 0% 5% 10% 15% 20%
Other services 2011: 1 Other services 2011: 2
Other services 2011: 3 Other services 2011: 4
0%
10%
20%
30%
40%
50%
60%
70%
80%
90%
100%
-10% -5% 0% 5% 10% 15%
Other services 2012: 1 Other services 2012: 2
Other services 2012: 3 Other services 2012: 4

154
Figure G.48. CDF of growth rate of other services GDP, 2013
0%
10%
20%
30%
40%
50%
60%
70%
80%
90%
100%
-5% 0% 5% 10% 15%
Other services 2013: 1 Other services 2013: 2
Other services 2013: 3 Other services 2013: 4