ecosystems: what are they and how do they work? chapter 3 sections 1-4
TRANSCRIPT

Ecosystems: What Are Ecosystems: What Are They and How Do They They and How Do They
Work?Work?
Chapter 3Chapter 3
Sections 1-4Sections 1-4
Key ConceptsKey Concepts
What is ecology?What is ecology?
Major components of ecosystemsMajor components of ecosystems
Energy flow and matter cyclesEnergy flow and matter cycles
What are soils and how do they form?What are soils and how do they form?
Ecosystem studiesEcosystem studies

Importance of InsectsImportance of Insects
Ecological ServicesEcological Services
PollinationPollination
Pest controlPest control
Important roles in Important roles in biological communitybiological community
Fig. 3-1, p. 35

Nature of EcologyNature of Ecology What is ecology?What is ecology?
Study of connections in natureStudy of connections in nature
OrganismsOrganisms
CellsCells
SpeciesSpecies
Microbes rule!Microbes rule!Benefits Include:Benefits Include:Decomposition, nutrient cycling, foods, water Decomposition, nutrient cycling, foods, water purification, digestion, antibioticspurification, digestion, antibiotics
Fig. 3-2, p. 37

Nature of EcologyNature of Ecology
Fig. 3-2, p. 37
Insects751,000
Protists57,700
Plants248,400
Prokaryotes4,800
Fungi69,000
Other animals281,000
Known species
1,412,000
Species Total?Estimated 3.6 - 100
million
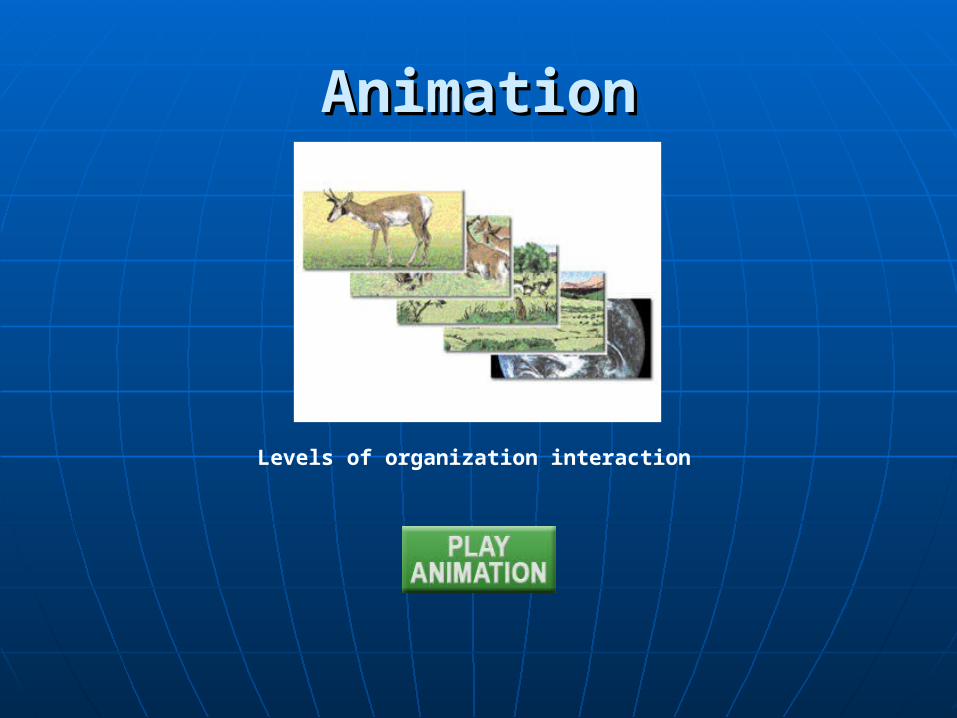
Levels of organization interaction
AnimationAnimation

Fig. 2-3, p.23
Levels of Levels of Organization Organization
of Matterof Matter
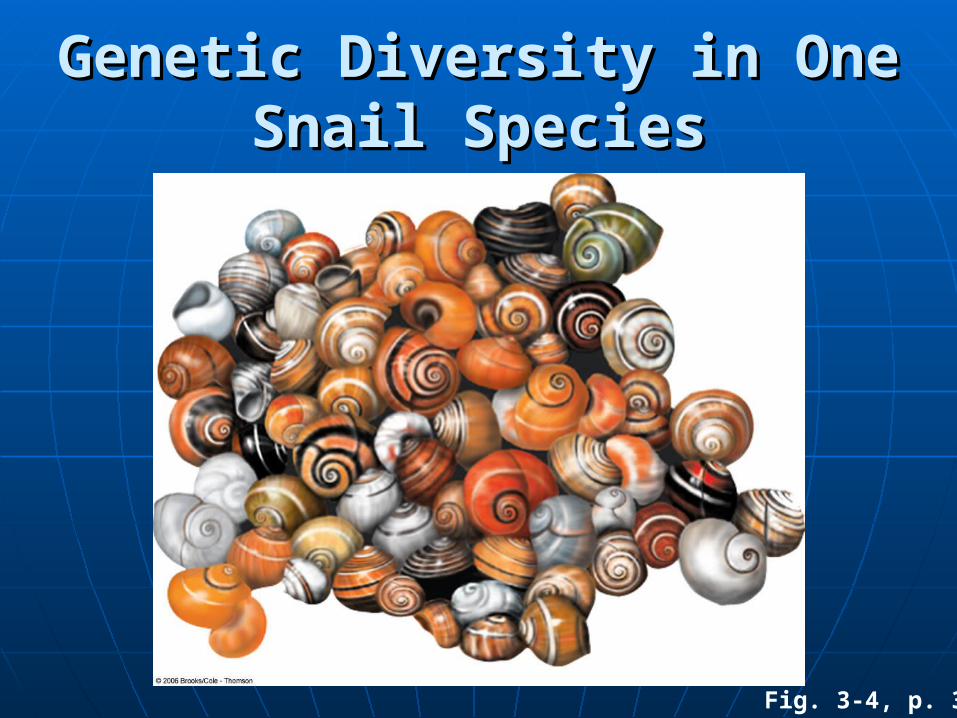
Genetic Diversity in One Snail Genetic Diversity in One Snail SpeciesSpecies
Fig. 3-4, p. 38
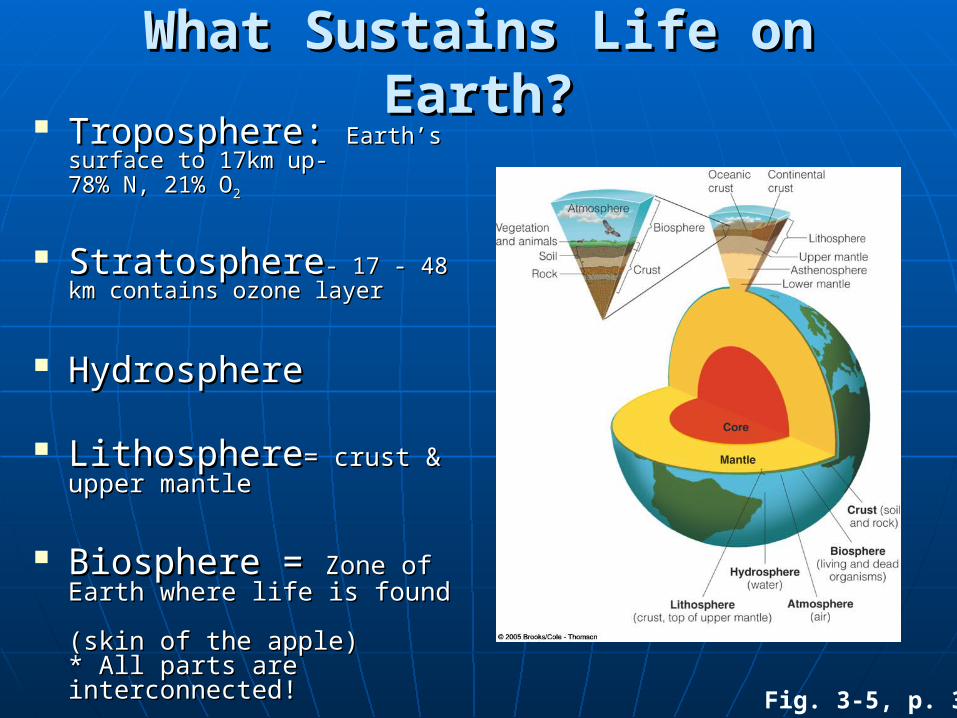
What Sustains Life on Earth?What Sustains Life on Earth? Troposphere: Troposphere: Earth’s Earth’s
surface to 17km up-surface to 17km up-78% N, 21% O78% N, 21% O22
StratosphereStratosphere- 17 - 48 km - 17 - 48 km contains ozone layercontains ozone layer
HydrosphereHydrosphere
LithosphereLithosphere= crust & upper = crust & upper mantlemantle
Biosphere = Biosphere = Zone of Earth Zone of Earth where life is found where life is found (skin of the apple)(skin of the apple)* All parts are interconnected!* All parts are interconnected!
Fig. 3-5, p. 38

Fig. 3-5, p. 38
Atmosphere
Biosphere
CrustLower mantle
AsthenosphereUpper mantle
Continentalcrust
Oceaniccrust
LithosphereVegetationand animals
Soil
Rock
Crust (soiland rock)
Atmosphere(air)
Biosphere(living and dead
organisms)
Lithosphere(crust, top of upper mantle)
Hydrosphere(water)
Core
Mantle
What Sustains Life on Earth?What Sustains Life on Earth?

Earth’s Life-Support SystemsEarth’s Life-Support Systems(3 interconnected factors)(3 interconnected factors)
One way flow of high-One way flow of high-quality energyquality energy
Cycling of matterCycling of matter
GravityGravity- holds atmosphere, - holds atmosphere, enables movement of enables movement of chemicals thru various chemicals thru various spheresspheres
Fig. 3-6, p. 39“Energy flows, nutrients cycle.”
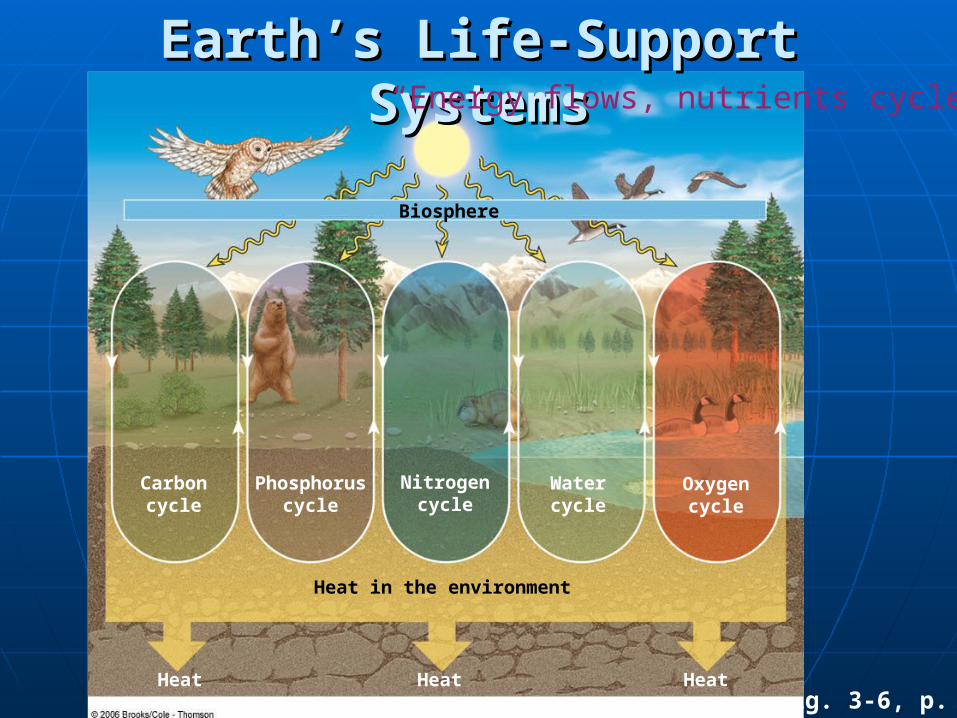
Fig. 3-6, p. 39
Biosphere
Carboncycle
Phosphoruscycle
Nitrogencycle
Watercycle
Oxygencycle
Heat in the environment
HeatHeatHeat
Earth’s Life-Support SystemsEarth’s Life-Support Systems“Energy flows, nutrients cycle.”

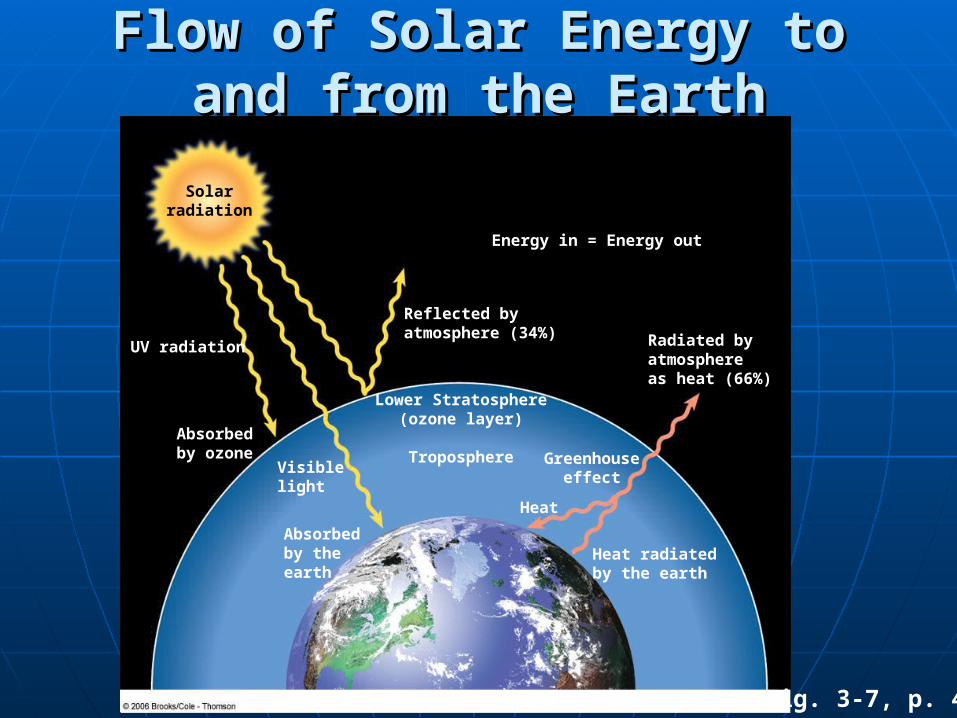
Flow of Solar Energy to and from Flow of Solar Energy to and from the Earththe Earth
Greenhouse gasesGreenhouse gaseswater vapor, COwater vapor, CO22 NO, CH NO, CH44 , O , O33
Greenhouse effect- Greenhouse effect- Heat trapped in the Heat trapped in the troposphere to warm planettroposphere to warm planet
without natural without natural greenhouse effect life greenhouse effect life would not be possible. would not be possible.
Fig. 3-7, p. 40
Heat radiatedby the earth
Solarradiation
Absorbedby ozone
UV radiation
Visiblelight
Absorbedby theearth
Reflected byatmosphere (34%)
Energy in = Energy out
Radiated byatmosphereas heat (66%)
Lower Stratosphere(ozone layer)
Troposphere Greenhouseeffect
Heat
Flow of Solar Energy to and from Flow of Solar Energy to and from the Earththe Earth
Fig. 3-7, p. 40
Sun to Earth animation
AnimationAnimation
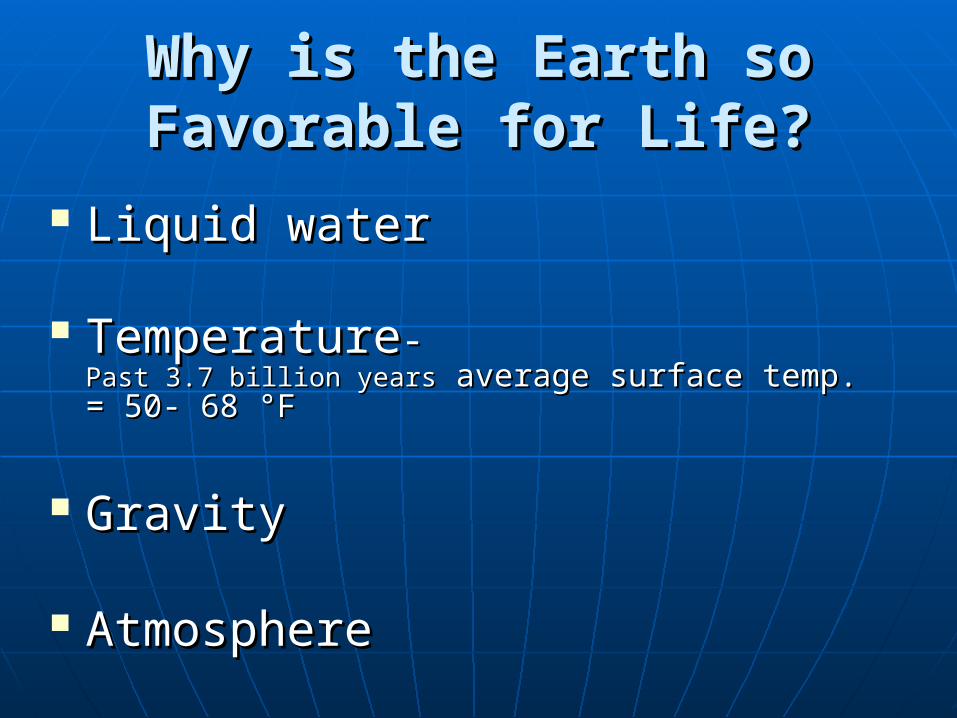
Why is the Earth so Favorable Why is the Earth so Favorable for Life?for Life?
Liquid waterLiquid water
TemperatureTemperature- - Past 3.7 billion yearsPast 3.7 billion years average surface temp. = 50- 68 °F average surface temp. = 50- 68 °F
GravityGravity
AtmosphereAtmosphere

Fig. 3-8, p. 41
Coniferous forest Desert Coniferous forest Prairie grassland Deciduous forest
100–125 cm (40–50 in.)75–100 cm (30–40 in.)50–75 cm (20–30 in.)25–50 cm (10–20 in.)below 25 cm (0–10 in.)
Average annual precipitation
4,600 m (15,000 ft.)3,000 m (10,000 ft.)1,500 m (5,000 ft.)
Coastal mountainranges
Sierra NevadaMountains
Great AmericanDesert
RockyMountains
GreatPlains
MississippiRiver Valley
AppalachianMountains
Coastal chaparraland scrub
Major BiomesMajor Biomes

Sun
Producers (rooted plants)
Producers (phytoplankton)
Primary consumers (zooplankton)
Secondary consumers (fish)
Dissolvedchemicals
Tertiary consumers
(turtles)
Sediment
Decomposers (bacteria and fungi)
Fig. 3-9, p. 42
Major Components of Freshwater EcosystemsMajor Components of Freshwater Ecosystems

Sun
Producer
PrecipitationFalling leaves
and twigs
Producers
Primary consumer(rabbit)
Secondary consumer(fox)
Carbon dioxide (CO2)
Oxygen (O2)
Water
Soil decomposers
Soluble mineral nutrients
Fig. 3-10, p. 42
Major Components of a Field Major Components of a Field EcosystemEcosystem

Matter recycling and energy flow animation
AnimationAnimation
ABC’s of EcologyABC’s of Ecology(The study of how organisms interact with one another (The study of how organisms interact with one another
& their non-living environment)& their non-living environment)
•A= Abiotic (Non-living)
•B= Biotic (Living)
•C= Cultural (Human Interactions)
Factors Limiting Population GrowthFactors Limiting Population Growth
Limiting factor principleLimiting factor principle-- Too much or too little of any abiotic factor can limit or prevent growth of Too much or too little of any abiotic factor can limit or prevent growth of population.population.
Limiting factors:Limiting factors:
Excess water or water shortages for terrestrial organismsExcess water or water shortages for terrestrial organisms
Excess or lack of soil nutrientsExcess or lack of soil nutrients
Dissolved oxygen for aquatic organismsDissolved oxygen for aquatic organisms
Salinity for aquatic organismsSalinity for aquatic organisms
Lower limitof tolerance
Upper limitof tolerance
TemperatureLow High
Abundance of organismsFew
organismsFew
organismsNo
organismsNo
organisms
Zone ofintoleranceZone of
physiological stress
Zone ofintolerance Zone of
physiological stress
Optimum range
Po
pu
lati
on
Siz
e
Fig. 3-11, p. 43
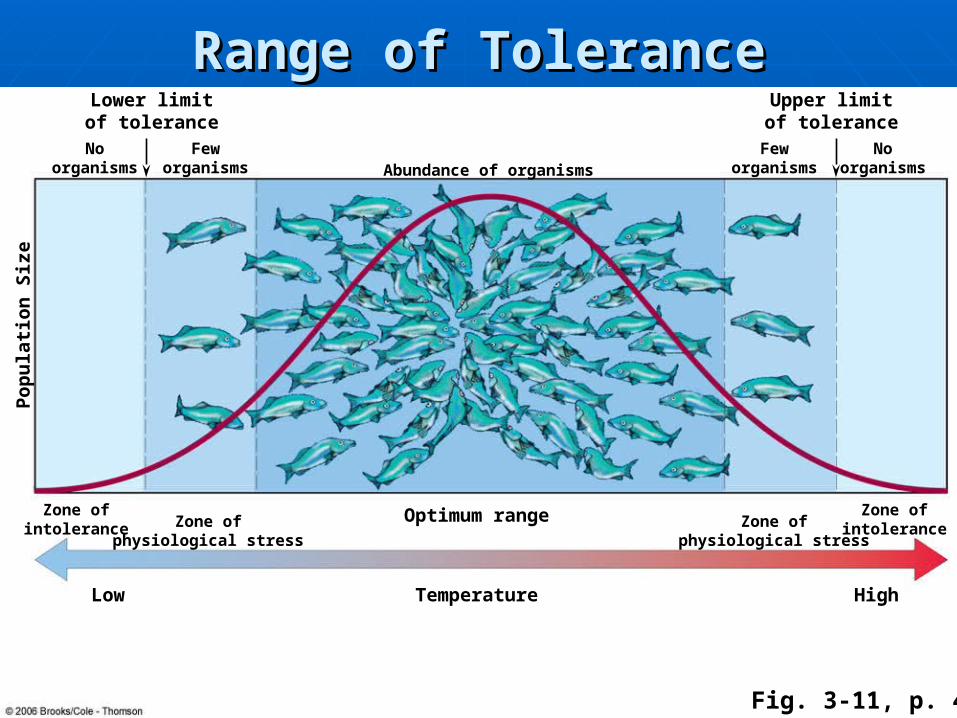
Range of ToleranceRange of Tolerance
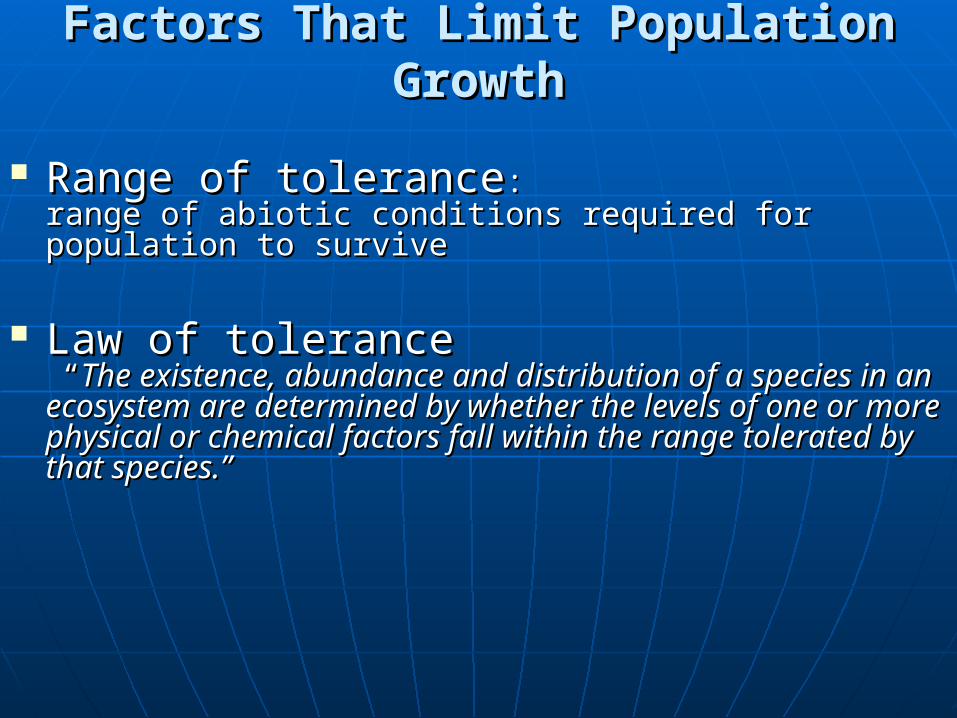
Factors That Limit Population GrowthFactors That Limit Population Growth
Range of toleranceRange of tolerance::range of abiotic conditions required for population to surviverange of abiotic conditions required for population to survive
Law of tolerance Law of tolerance ““The existence, abundance and distribution of a species in an The existence, abundance and distribution of a species in an ecosystem are determined by whether the levels of one or more ecosystem are determined by whether the levels of one or more physical or chemical factors fall within the range tolerated by physical or chemical factors fall within the range tolerated by that species.”that species.”

Consumers: Feeding and Consumers: Feeding and RespirationRespiration
Decomposers Decomposers (Fungi & Bacteria) - specialized consumers that (Fungi & Bacteria) - specialized consumers that breakdown detritus (dead stuff) into inorganic nutrients that can be reused breakdown detritus (dead stuff) into inorganic nutrients that can be reused by producersby producers
OmnivoresOmnivores
Detritivores- Detritivores- Decomposers & detritus feedersDecomposers & detritus feeders
Aerobic respirationAerobic respirationglucose + oxygen = carbon dioxide + water + ENERGYglucose + oxygen = carbon dioxide + water + ENERGY
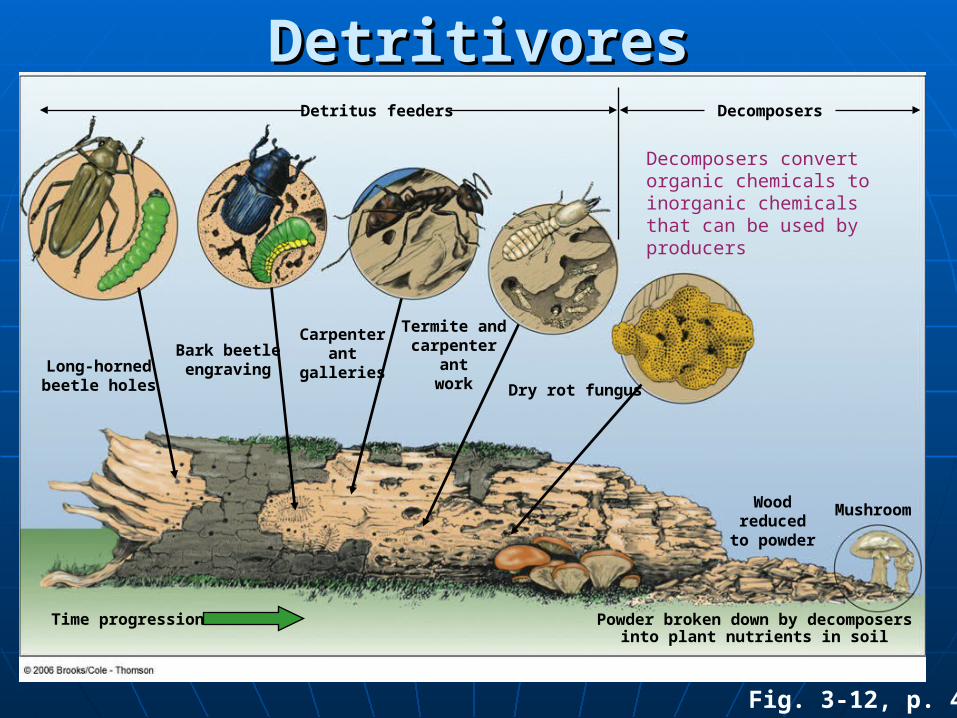
MushroomWoodreduced
to powder
Long-hornedbeetle holes
Bark beetleengraving
Carpenterant
galleries
Termite andcarpenter
antwork Dry rot fungus
Detritus feeders Decomposers
Time progression Powder broken down by decomposersinto plant nutrients in soil
Fig. 3-12, p. 44
DetritivoresDetritivores
Decomposers convert organic chemicals to inorganic chemicals that can be used by producers

Fig. 3-13, p. 45
Decomposersbacteria, fungi)
Solarenergy
HeatHeat
Heat Heat
Heat
Abiotic chemicals(carbon dioxide,
oxygen, nitrogen,minerals)
Consumers(herbivores,carnivores)
Producers(plants)
Main Structural Components of Main Structural Components of an Ecosysteman Ecosystem

Linked processes animation
AnimationAnimation

The role of organisms in an ecosystem
AnimationAnimation

Fig. 3-14, p. 45
BiodiversityBiodiversity(4 Components)(4 Components)

Fig. 3-15, p. 46
Examples of BiodiversityExamples of Biodiversity
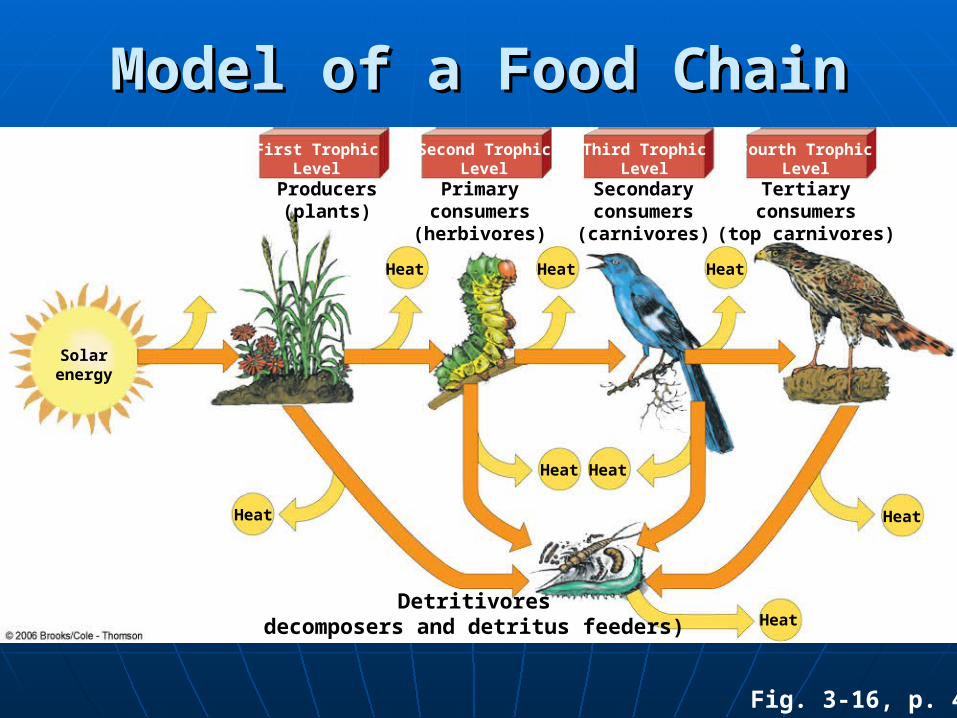
Fig. 3-16, p. 47
First TrophicLevel
Second TrophicLevel
Third TrophicLevel
Fourth TrophicLevel
Producers(plants)
Primaryconsumers(herbivores)
Secondaryconsumers(carnivores)
Tertiaryconsumers
(top carnivores)
Detritivoresdecomposers and detritus feeders)
Solarenergy
Heat
Heat Heat Heat
HeatHeat
Heat
Heat
Model of a Food ChainModel of a Food Chain

Humans
Blue whale Sperm whale
Crabeater seal
Killer whale Elephantseal
Leopardseal
Petrel
Fish Squid
Carnivorous plankton
Krill
Phytoplankton
Herbivorouszooplankton
Emperorpenguin
Fig. 3-17, p. 48
Food Web in the AntarcticFood Web in the Antarctic
Adéliepenguins

Energy Flow in an EcosystemEnergy Flow in an Ecosystem
Ecological efficiencyEcological efficiency= = % of usable energy transferred as biomass from one trophic % of usable energy transferred as biomass from one trophic level to the next (2% - 40%)level to the next (2% - 40%)
10% Rule10% Rule--assumes assumes 10% 10% ecological efficiency ecological efficiency
Ecological PyramidsEcological Pyramids- 3 Types- 3 Types1. Pyramid of Numbers1. Pyramid of Numbers2. Pyramid of Biomass2. Pyramid of Biomass3. Pyramid of Energy Flow3. Pyramid of Energy Flow
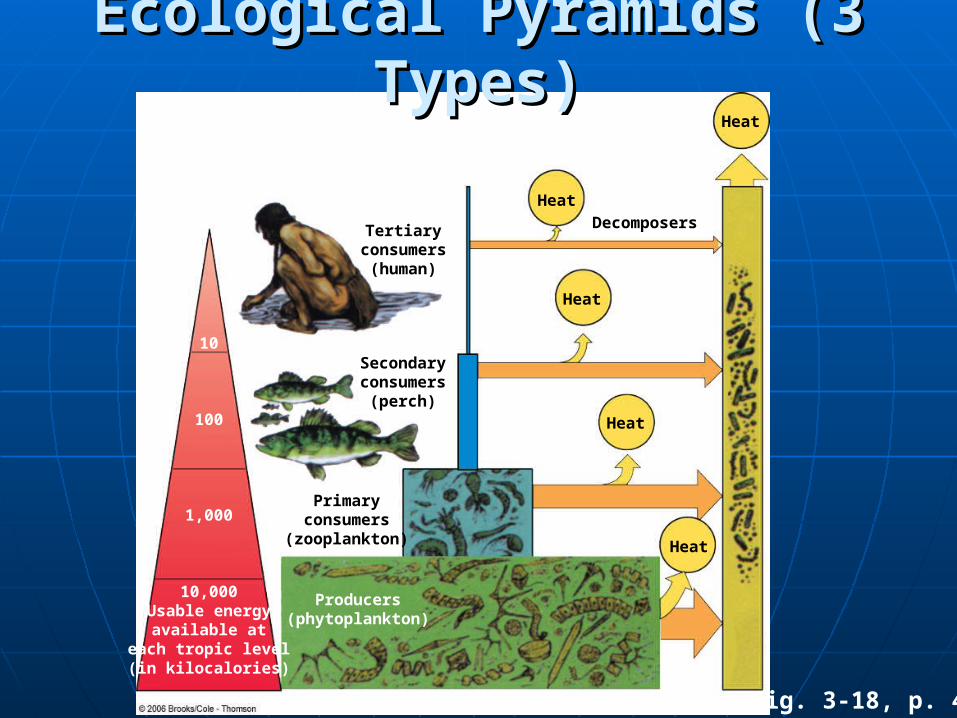
Fig. 3-18, p. 49
Secondaryconsumers
(perch)
10
100
1,000
10,000Usable energy
available ateach tropic level(in kilocalories)
Heat
Heat
Heat
Heat
Heat
Producers(phytoplankton)
Tertiaryconsumers
(human)
Primaryconsumers
(zooplankton)
Ecological Pyramids (3 Types)Ecological Pyramids (3 Types)
Decomposers

Biomass ProductivityBiomass Productivity
Gross primary productivity (GPP)Gross primary productivity (GPP)rate at which producers in an ecosystem convert sun into foodrate at which producers in an ecosystem convert sun into food
Net primary productivity (NPP)= Net primary productivity (NPP)= GPP - Respiration GPP - Respiration
NPP and populationsNPP and populationsNPP limits the number of consumers that can live on earthNPP limits the number of consumers that can live on earth

Fig. 3-19, p. 49
Energy lost andunavailable toconsumers
Respiration
Growth and reproduction
Sun
Photosynthesis
Gross primaryproduction
Net primaryproduction(energyavailable toconsumers)
Differences between GPP and NPPDifferences between GPP and NPP

Fig. 3-20, p. 50
Swamps and marshes
Tropical rain forest
Temperate forest
Northern coniferous forest
(taiga)
Savanna
Agricultural land
Woodland and shrubland
Temperate grassland
Tundra (arctic and alpine)
Desert scrub
Extreme desert
Aquatic EcosystemsEstuaries
Lakes and streams
Continental shelf
Open ocean
Terrestrial Ecosystems
800 1,600 2,400 3,200 4,000 4,800 5,600 6,400 7,200 8,000 8,800 9,600
Average net primary productivity (kcal/m2/yr)
Net Primary Productivity in Major Net Primary Productivity in Major Life Zones and EcosystemsLife Zones and Ecosystems