economy-wide and industry-level impact of information
TRANSCRIPT

Economy-Wide and Industry-Level Impact ofInformation Technology
U.S. Department of CommerceEconomics and Statistics Administration
Office of Policy DevelopmentOffice of Business and Industrial Analysis
APRIL 1997
ESA/OPD 97-3

Economy-Wide and Industry-Level Impact of Information Technology
PREFACE
ESAÕs analytic mission is to explain changes in the structure of U.S. industries and firmsthat affect the nationÕs overall economic performance. This study is one of a series ofstudies prepared by our Office of Business and Industrial Analysis to evaluate the role ofinformation technology (IT) in improving productivity. This study was prepared byGurmukh Gill, Kan Young, Dennis Pastore, Jess Dumagan, and Isaac Turk.
The authors estimated separate production functions for 58 industries, coveringpractically the entire private economy, over the period 1983-93, treating IT capital andlabor as distinct inputs from non-IT capital and labor. Although the findings varyconsiderably across industries, they generally support the view that IT capital and laborexert a positive influence on productivity. Also, the production function for the aggregateeconomy was estimated from pooled data and results were all consistent with a prioriexpectations, confirming the positive impacts of IT capital and labor on the economy overand above those of non-IT capital and labor.
In ongoing research, the production function approach is being augmented and refined byassembling time series data going back to 1970 and forward to 1995 and by analyzingindustry data, where possible, at the 3- or 4-digit Standard Industrial Classification (SIC)levels.
Everett M. EhrlichUnder Secretaryfor Economic Affairs

Economy-Wide and Industry-Level Impact of Information Technology
ABSTRACT
Efforts by economists to measure the contribution to output growth of investment ininformation technology (IT) equipment have proven inconclusive and studies of theproductivity of IT workers are relatively scarce. In the present study, we attempt to fillthis gap in our understanding of the impact of IT capital and labor in the productionprocess. We use industry data to extend the previous studies in three ways: (i) by usingmore recent data (1983 to 1993), (ii) by covering manufacturing and non-manufacturingindustries, including services, and (iii) by treating IT workers and non-IT workers as twodistinct categories of labor.
We adopt a log-linear production function approach, usually used in conjunction withcompany data, but apply the model to industries. We first estimate the model for theaggregate economy by pooling eleven cross-sections for 58 industries after establishingthat elasticities are invariant over 1983 to 1993. We find that all the economy-wideelasticities are positive and lie between zero and one, consistent with a prioriexpectations. Also, the sum of the elasticities is about 0.9, implying decreasing returns toscale. In the time-series analysis, the results focus on each of the 58 industriesseparately. For two-thirds of these industries, the estimated elasticities are non-negativewith respect to IT equipment; for ten of them, marginal returns to IT equipment arestatistically significant and quite high, with nine exhibiting annual rates of return in excessof 100 percent. Not surprisingly, average returns to IT investment for the entireeconomy and most of the major industry sectors are not only lower, but also moreplausible, a consequence of averaging the diverse results from component industries. Weobtain similar results in the case of IT labor. Two-thirds of all industries show non-negative elasticities, with ten showing statistically significant positive coefficients. In fiveof these industries, both the IT capital and the IT labor coefficients are positive andsignificant. Though the marginal products derived from the estimated coefficients seeminexplicably high, especially for IT workers, they suggest that the returns to IT labor arequite large in some industries. Marginal products estimated for the entire economy andfor major industrial sectors, such as manufacturing and non-manufacturing, however, fallwithin plausible ranges.

Economy-Wide and Industry-Level Impact of Information Technology
Economy-Wide and Industry-Level Impact of Information Technology
TABLE OF CONTENTS
I. INTRODUCTION............................................................................................................1
II. THE MODEL ..................................................................................................................2
III. DATA ........................................................................................................................4
Sources and Definitions .........................................................................................4
Trends ........................................................................................................................5
IV. REGRESSION RESULTS..........................................................................................8
Cross-Section Results............................................................................................8
Results for Industry Groups and Individual Industries......................................9
Are IT Capital and Labor Really Different from Other Capital and Labor? .13
Time Trend and Lagged Response.................................................................. 13
Analysis of Synergies ........................................................................................... 14
V. SUMMARY AND CONCLUSIONS........................................................................... 15
VI. REFERENCES ......................................................................................................... 17

Economy-Wide and Industry-Level Impact of Information Technology
LIST OF TABLES
TABLE 1: ESTIMATED ECONOMY-WIDE ELASTICITIES AND AVERAGEAND MARGINAL PRODUCTS ...................................................................8
TABLE 2: ESTIMATED OUTPUT ELASTICITIES WITH RESPECT TO ITEQUIPMENT.............................................................................................. 10
TABLE 3: ESTIMATED OUTPUT ELASTICITIES WITH RESPECT TO ITWORKERS................................................................................................. 12
TABLE A-1: CAPITAL EQUIPMENT SHARES AND LABOR SHARES BYSUMMARY AND DETAILED INDUSTRIES ...................................... 19
TABLE A-2: CAPITAL AND LABOR INTENSITY........................................................ 20
TABLE A-3: SUMMARY OF REGRESSION RESULTS FOR DETAILEDAND AGGREGATE INDUSTRIES...................................................... 21

Economy-Wideand Industry-Level Impact of
Information Technology

Economy-Wide and Industry-Level Impact of Information Technology

Economy-Wide and Industry-Level Impact of Information Technology Page 1
I. INTRODUCTION
Despite many studies in recent years, economists have been unable to demonstrateconclusively that the massive influx of information technology (IT) into the workplace ishaving a measurable positive impact on output growth. Some analysts suggest, in fact,that the opposite may well be true.1 The apparent failure of researchers to reach aconsensus on the matter, however, belies the speed with which information technology istransforming the American workplace. Business managers, workers, and governmentpolicy makers all stand to gain from a better understanding of how and under whatconditions investment in IT and initiatives to boost IT skills of workers actually pay off.
We seek to answer the following question: have the absorption of IT-intensive equipmentand techniques into the production process and the increase in the number of workerswho generate or use information products served to increase output at the aggregate andthe industry levels? As a first step, we examine productivityÑdefined as the rate ofreturn, or marginal productÑof both IT capital and IT workers at the economy and theindustry levels. Our analysis indicates that, despite considerable diversity amongindustries, IT capital and labor make positive contributions to production at the industrylevel. Our results provide solid support of positive contributions from IT capital andlabor for the private economy as a whole. Our findings also suggest that further researchthat takes into account the price structure of inputs will corroborate our strong sense,based on the results so far, that IT is helping forge a more productive American economy.
Most previous studies of IT productivity focus on IT capital alone,2 and the results aremixed. Aside from a 1993 paper by Lichtenberg, published research on the productivityof IT related workers is scarce. Most of the studies tend to rely on company data,usually from large manufacturing firms. One notable exception is an analysis by Berndtand Morrison (1995) based on industry data. The authors examine the relationshipbetween the rate of return on capital and the share of IT equipment in the capital stock atthe two-digit SIC level for manufacturing industries from 1968 through 1986. This studyand an earlier investigation by the same authors (1991) into cost reductions associatedwith IT investment may well be the only attempts to analyze systematically rates ofreturn on IT investment across industries.
1 Attewell (1994) and Landauer (1995).2 Examples are: Roach (1987 & 1989); Berndt, Morrison, and Rosenblum (1992); Brynjolfsson (1987); Brynjolfssonand Hitt (1994); and Berndt and Morrison (1995).

Page 2 Economy-Wide and Industry-Level Impact of Information Technology
The current study extends the work of Berndt and Morrison and that of Lichtenberg inseveral directions:
• First, we examine data for all industries in the private sector of the economy,including services industries;
• Second, we estimate returns to capital and labor, distinguishing at the industrylevel between IT and non-IT equipment and IT and non-IT workers;
• Third, we use more recent (1983-1993) Bureau of Economic Analysis (BEA)and Bureau of Labor Statistics (BLS) data.
We also estimate the economy-wide contribution of IT capital and IT labor by poolingdata across eleven annual cross-sections.
In section II, we present the theoretical basis of our analytical approach. Section IIIprovides a description of the data. In Section IV, we discuss the results using our modelat the aggregate and the individual industry levels, supplementing the analysis withinsights from modified versions of the basic model: first, to estimate the effect of timeand, second, to assess the possibility of a time-distributed lagged response. We alsocompare our findings with the results from similar research. In the conclusion, weevaluate our findings and recommend directions for further research.
II. THE MODEL
We use the common log-linear production function to test the relationship between thelevel of output and the levels of various inputs, including IT and non IT-related capitaland labor. 3 This technique has significant practical advantages. First, data on quantitiesof inputs and outputs (in constant dollar terms) are more readily available and lesscontroversial than the input price estimates needed to construct a meaningful costfunction. Second, by expressing our model in log-linear form, the coefficients of theexplanatory variables are also the elasticities with respect to output. We can then usethese elasticities to determine the marginal products.
3 Lichtenberg, along with many others, uses the same technique in his own analysis of the returns to IT capital andlabor. Morrison and Berndt (1991) and Lau and Tokutso (1992), adopt a cost function approach. Although our dataset more closely resembles the one used by Berndt and Morrison, our methodology is more in line with LichtenbergÕs.

Economy-Wide and Industry-Level Impact of Information Technology Page 3
Our model is based on LichtenbergÕs methodology. He tests the hypothesis that themarginal products (the additional output the firm can expect if it employs one additionalunit of a specific input) of IT capital are larger than those of non-IT capital and that themarginal products of IT labor are larger than those of non-IT labor. First, he evaluatesstatistically whether the marginal products (or gross benefit) of IT capital and IT labor arepositive.4 If this proves to be the case, he estimates the marginal products of the IT andnon-IT capital and labor variables. If the ratio of the marginal product of the IT input toits non-IT counterpart is larger than the ratio of their prices (rental value in the case ofcapital), the contribution to the firmÕs output of an additional unit of the IT input exceedsthat of its non-IT counterpart.5 Lacking data on input prices, we focus on determiningwhether the marginal products of the IT inputs and their net marginal returns are positiveand significant. To do this, we first estimate the output elasticity of each input. Next,we calculate the associated average product. The marginal product of the input is thenobtained by multiplying the elasticity by its average product.
For inter-industry comparisons of net benefit from a particular type of input, we need toassume only that its cost is similar across all industries. For example, in the case of netbenefits, or rates of return, on investment in IT equipment, this condition requires thatthe costs of IT equipment across industries are relatively uniform, which is reasonable.Similarly, for inter-industry comparisons of the net benefits of hiring an additional ITworker, we make the assumption that wage rates within the same occupational categoryof labor are uniform across industries.
As the starting point for our analysis, we estimate a standard Cobb-Douglas productionfunction in log-linear form, similar to the one used by Lichtenberg. The general form ofthis function is:
lnY = α + β0 lnK0 + β1 lnK1 + γ0 lnL0 + γ1 lnL1
where Y represents value added of a specific industry in a single year; K0 stands for ITcapital stock; and K1 stands for non-IT capital stock, with non-IT capital further brokendown into non-IT equipment and total structures for purposes of estimation; L0 is ITlabor; and L1 non-IT labor.6 We estimate essentially the same model for a number ofalternative data sets: simple time series of individual industries over the eleven years,cross-sections involving all industries in a single year, and pooled time series and cross-sections of selected industry groupings over eleven years.
4 Since the rental prices of capital and wages are positive, a firm would hire additional quantities of capital or laboronly if it expects that the net impact on output will be positive. After all, the net return to the firm from any input is thedifference between its marginal product and marginal cost.5 Cost minimization requires that the two ratios be equal; otherwise, a firm could further reduce costs by reallocatinginputs.6 We can also generalize this equation along the lines of the Ò translogÓ specification by adding interaction (i.e., cross-product) terms.

Page 4 Economy-Wide and Industry-Level Impact of Information Technology
We first estimate the economy-wide production function using the entire data set, that is,pooling all of the 638 observations.7 We then concentrate on estimating the productionfunction for each of the 58 (approximately two-digit SIC level) industries using timeseries data and ordinary least squares (OLS) technique. Because, at this stage of ourwork, we must rely on observations covering only 11 years, we are able to explore only afew of the options theoretically possible. These include adding to the equation,alternately, a linear trend variable and a lagged version of the dependent variable and,separately, introducing interaction terms to test for associations between the various laborand capital variables.8 The results from these and various other specifications9 of themodel provide useful analytical insights that enrich our understanding and interpretationof results.
III. DATA
Sources and Definitions
We assembled annual time-series data from 1983-1993 for 58 separate industries coveringthe full spectrum of the U.S. private economy. Industry estimates of value added anddata on fixed reproducible capital stock, both expressed in constant 1987 dollars atapproximately the two-digit SIC level, come from the National Income and WealthDivision of the Bureau of Economic Analysis (BEA). The industry level split betweeninformation and non-information occupations was based on employment data by industryand occupation published by the Office of Employment Projections of the Bureau ofLabor Statistics (BLS) for 277 occupational categories of wage and salary workers. Thedata from each of these sources reflect activity at the establishment level.
The definitions we use in this study for both IT capital and IT labor are still tentative. ITcapital consists of the four types of equipment collectively referred to in BEApublications as Òinformation processing and related equipmentÓ: (1) office, computing,and accounting machinery; (2) communication equipment; (3) scientific and engineering
7 Statistical tests show that the coefficients are time invariant.8 These are (1) the product of the logs of IT capital and IT labor and (2) the product of the logs of non-IT capital andnon-IT labor.9 In estimating the production function for each of the 58 industries, we also do the same for each of the major sectors(such as agriculture, forestry, and fisheries; mining; manufacturing; and so on), which represent simple aggregations ofcorresponding industry-level data. Further, we examine the estimates obtained by pooling the data while imposingrestrictions on the values of various parameters. We also test whether it makes sense from a statistical point of view todistinguish between IT and non-IT components of the capital and labor variables in setting up the productionfunction.

Economy-Wide and Industry-Level Impact of Information Technology Page 5
instruments; and (4) photocopy and related equipment.10 For employment data, we steera middle ground between BaumolÕs broad definition of information workers11 andexamples of much narrower specifications discussed in Miles (1990).12 Under ourdefinition, IT occupations represent about a quarter of all private wage and salaryworkers.
We consider almost all of the jobs in the three occupational classes (1) executive,administrative, and managerial; (2) professional specialty; and (3) technicians and relatedsupport to be IT jobs. Together, they account for about 93 percent of all IT jobs. Thisimplies that when we evaluate the importance of IT workers we are talking primarilyabout well to highly educated white-collar workers and, to a much lesser degree, aboutskilled technicians.13
Trends
From 1983 through 1993, real Gross Domestic Product (GDP) grew at an average annualrate of 2.8 percent. The total net capital stock, which includes both equipment andstructures, increased at a 2.3 percent annual rate, with the value of equipment stocksrising more rapidly than the value of new structures: 2.7 percent compared with 1.9percent per year.
In contrast to the record of rather moderate growth at the aggregate level, real net stocksof IT equipment more than doubled during the period, rising from $339 billion in 1983 to$748 billion in 1993. This corresponds to an annual growth rate of 8.2 percent. Evenmore impressive are the additions to the stock of office, computing and accountingmachinery. This category alone accounted for $207 billion, or more than 50 percent ofthe increase in working IT capital over the eleven year period. The 21 percent annualgrowth this represents far exceeds the 5.6 percent increase recorded for stocks ofcommunications equipment and the 5.7 percent rise for scientific and engineeringequipment. The fourth IT asset, photocopy and related equipment, evidenced theweakest growth performance; at 2.1 percent per year, it was lower than the aggregate ratefor all classes of equipment.
The share of equipment in total net capital stock, which includes both structures andequipment, increased moderately, rising from 45.4 percent in 1983 to 47.4 percent in1993. In contrast, IT stock as a share of equipment stock alone jumped nearly 13percentage points to account for almost 32 percent of the total net stock of equipment by
10 Berndt and Morrison (1995) refer to these, alternately, as Ò high techÓ capital and IT equipment.11 BaumolÕs Ò knowledge workersÓ generally include individuals who process data or make use of information. Theseaccounted for more than 52 percent of all workers in 1980. See Baumol, Blackman, and Wolff, Productivity andAmerican Leadership: The Long View, Cambridge, 1989, p. 148.12 Miles et al (1990), Mapping and Measuring the Information Economy, Cambridge, England.13 Even though virtually all technicians qualify as IT workers according to our definition, they represent less thanfour percent of the wage and salary workforce, in 1993.

Page 6 Economy-Wide and Industry-Level Impact of Information Technology
1993. Within the IT group, office, computing, and accounting equipment increased inshare from 11 percent in 1983 to 33 percent in 1993, while communications equipment,still the largest of the four components at the end of the period, dropped 14 percentagepoints to below 50 percent. Scientific and engineering instruments, with 13 percent, andphotocopy and related equipment, with 6 percent, account for the remaining 18 percent in1993 in both cases, a decline from 1983.
Employment of wage and salary workers in IT related occupations grew at an averageannual rate of 2.6 percent between 1983 and 1993. This surpasses the 1.8 percent peryear rate for workers in other occupations and the 2.0 percent average for all privatesector jobs. The class of IT workers increased by about one-third from 21.8 million in1983 to 28.1 million in 1993. Still, the IT share of the wage and salary workforceremained virtually unchanged.
The industry level data in Table A-1 in the appendix show that the equipment share oftotal capital stock remained essentially unchanged over the eleven years, rising on theaverage from 49.9 percent in 1983 to 50.3 percent in 1993. Gains and losses in specificindustries, however, were quite large, explaining, in part at least, the diversity in estimatedcoefficients we observe later in this paper.
The period saw substantial increases in the shares of IT equipment in total equipmentstock in almost all industries. The shares were highest in the communications andfinancial service sectors. IT equipment, for example, accounted for more than 85 percentof total equipment in the telephone and telegraph industry in both 1983 and 1993; whilein the insurance agents, brokers, and services industry, the IT proportion jumped from 66percent in 1983 to more than 84 percent in 1993.
Table A-1 also shows shares of IT workers in total employment by industry. Onaverage, IT occupations account for just under 25 percent of all wage and salary workersin both years. Manufacturing industries are among those which experienced a sizableupward shift in the proportion of IT workers compared with that of non-IT workers.
Table A-2 in the appendix provides information on capital and labor intensities byindustry in 1983 and 1993. IT capital intensities, measured as the ratio of IT-equipmentstock to output (value added), increased between 1983 and 1993 for most industries. In1993, the IT-equipment intensity was highest for industries in the communicationssector, especially the telephone and telegraph industry. IT labor intensities, on the otherhand, remained relatively stable on average. IT labor intensity declined for mostindustries, in contrast to the growing IT equipment intensity. In both 1983 and 1993, ITlabor intensities were highest in educational services, health services, hotels and otherlodging places, other services, and business services.

Economy-Wide and Industry-Level Impact of Information Technology Page 7
IV. REGRESSION RESULTS
The production function specified as equation (1) is estimated with our 1983-93 data for58 industries in two ways. First, we estimated 11 cross-section regressions for each yearand then combined them into one pooled regression after establishing the fact that thecoefficients were time invariant over 1983-1993.14 This aggregate production functionreflects the overall performance of the entire U.S. private economy over the period.Second, to evaluate the impact of IT at the industry level, we estimated 58 time seriesregressions, each representing the production function of one industry. We discuss thecross-section results first, then examine the results of time series analysis for individualindustries.
Economy Wide Results
The results of separate cross-section analyses for all eleven years are approximately thesame.15 When the data for all eleven years are pooled together, the estimated elasticitiesof output with respect to all inputs, including IT capital and labor as well as non-ITcapital and labor, are statistically significant, with the values ranging from 0.03 to 0.36(Table 1). We expect the values of these coefficients to be positive but less than one,because these values are elasticities which are the ratios of marginal products to averageproducts. These ratios are expected to be less than one (i.e., marginal product less thanaverage product), because if marginal product were larger than average product the firmwould not be maximizing profits. Also, the sum of these elasticities, approximately 0.9,is less than 1, implying decreasing returns to scale. Thus, the elasticities estimated areconsistent with a priori expectations from the economy-wide production function.
Using the estimated output elasticities, we calculate the marginal products of the variousinputs for the private sector as a whole. First, we compute the average product of eachinput; i.e., the ratio of the total product of all industries to the total quantity of each inputused by all industries. We then multiply the average product by its estimated elasticityto derive the economy-wide marginal product since elasticity with respect to an input isthe ratio of its marginal product to its average product. The results are presented in Table
14 We estimated four variations of the pooled cross-section model. The first model had year dummy variables and yeardummy interaction terms; the second and third had one or the other; and the fourth had neither. The F-tests showedthat we could not reject either separately or jointly the hypotheses that the coefficients of the year dummy variablesand of the year dummy interaction terms were zero. Based on this result we excluded time variables in estimating aneconomy-wide cross-section production function.15 A recent study by R.B. Cohen (Ò The Impact of Information Technology,Ó Business Economics, Vol. XXX, No. 4,October, 1995) also uses simple cross-section analyses to examine the relationship between the growth ofproductivity and the share of IT capital in total capital, and finds positive correlations between these two variables forthe two periods studied.
Page 8 Economy-Wide and Industry-Level Impact of Information Technology
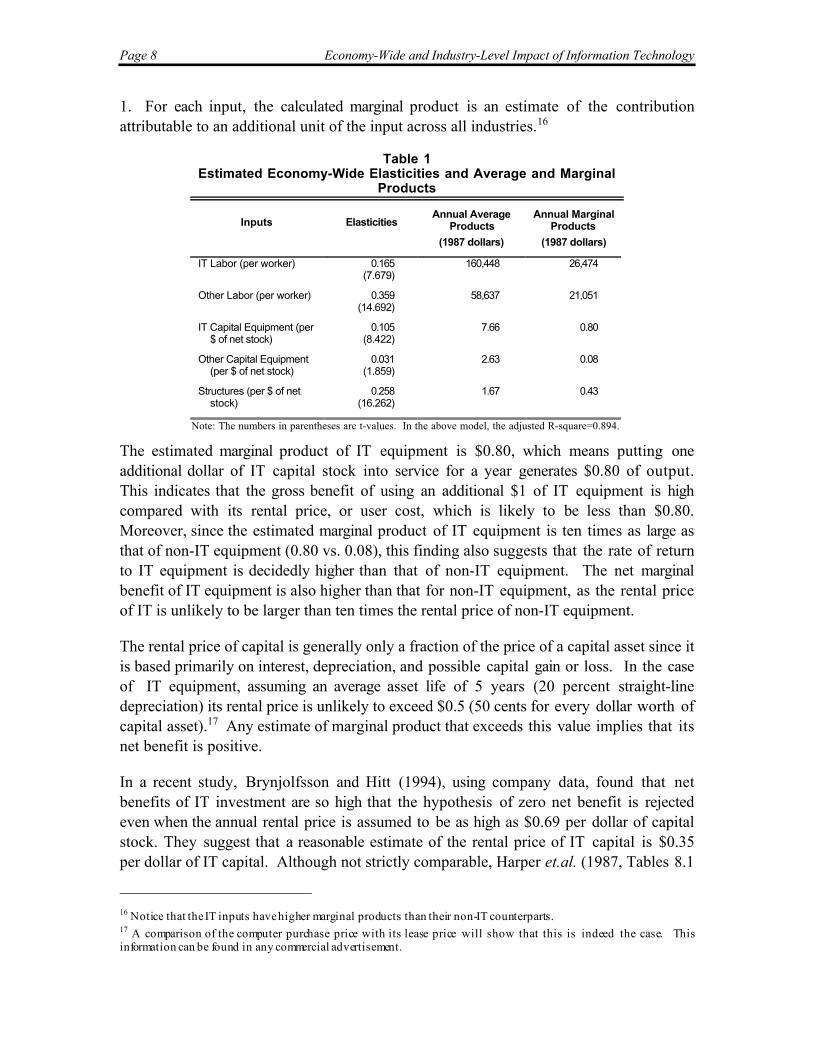
1. For each input, the calculated marginal product is an estimate of the contributionattributable to an additional unit of the input across all industries.16
Table 1Estimated Economy-Wide Elasticities and Average and Marginal
Products
Inputs ElasticitiesAnnual Average
Products
(1987 dollars)
Annual MarginalProducts
(1987 dollars)
IT Labor (per worker) 0.165(7.679)
160,448 26,474
Other Labor (per worker) 0.359(14.692)
58,637 21,051
IT Capital Equipment (per$ of net stock)
0.105(8.422)
7.66 0.80
Other Capital Equipment(per $ of net stock)
0.031(1.859)
2.63 0.08
Structures (per $ of netstock)
0.258(16.262)
1.67 0.43
Note: The numbers in parentheses are t-values. In the above model, the adjusted R-square=0.894.
The estimated marginal product of IT equipment is $0.80, which means putting oneadditional dollar of IT capital stock into service for a year generates $0.80 of output.This indicates that the gross benefit of using an additional $1 of IT equipment is highcompared with its rental price, or user cost, which is likely to be less than $0.80.Moreover, since the estimated marginal product of IT equipment is ten times as large asthat of non-IT equipment (0.80 vs. 0.08), this finding also suggests that the rate of returnto IT equipment is decidedly higher than that of non-IT equipment. The net marginalbenefit of IT equipment is also higher than that for non-IT equipment, as the rental priceof IT is unlikely to be larger than ten times the rental price of non-IT equipment.
The rental price of capital is generally only a fraction of the price of a capital asset since itis based primarily on interest, depreciation, and possible capital gain or loss. In the caseof IT equipment, assuming an average asset life of 5 years (20 percent straight-linedepreciation) its rental price is unlikely to exceed $0.5 (50 cents for every dollar worth ofcapital asset).17 Any estimate of marginal product that exceeds this value implies that itsnet benefit is positive.
In a recent study, Brynjolfsson and Hitt (1994), using company data, found that netbenefits of IT investment are so high that the hypothesis of zero net benefit is rejectedeven when the annual rental price is assumed to be as high as $0.69 per dollar of capitalstock. They suggest that a reasonable estimate of the rental price of IT capital is $0.35per dollar of IT capital. Although not strictly comparable, Harper et.al. (1987, Tables 8.1
16 Notice that the IT inputs have higher marginal products than their non-IT counterparts.17 A comparison of the computer purchase price with its lease price will show that this is indeed the case. Thisinformation can be found in any commercial advertisement.

Economy-Wide and Industry-Level Impact of Information Technology Page 9
and 8.2.), using alternative methods for estimating rental prices of capital, found rentalprices of metalworking machinery for the miscellaneous manufacturing industries to bebetween $0.20 to $0.60 for various years between 1971 and 1981.
The table also shows that the estimated marginal product of IT workers is about $26,500(in 1987 dollars), considerably higher than the corresponding estimate of approximately$21,000 for non-IT workers. The results appear plausible, but do not necessarily implythat hiring IT workers is more profitable than hiring non-IT workers, since their wagesand other form of compensation are quite different. The results, however, suggest thatthe services of an IT worker, on average, are more valuable than those of a non-IT worker.
Results for Industry Groups and Individual Industries
The simple cross-section pooled model is a reasonable average representation of theeconomy-wide production function. This formulation of the model, however, does nottake into account industry by industry differences. We can determine the significance ofthese industry differences by examining the possible effects of industry dummy variablesand industry dummy interaction terms. In contrast to the tests on time dummies, whichare insignificant, the tests on industry dummies show that statistically significantdifferences exist among the 58 industry regression coefficients. Consequently, estimatesof an overall pooled cross-sectional model (presented in Table 1) which ignoresdifferences among industries are not applicable to any individual industries. The industrydifferences noted above, however, imply that there is significant variation acrossindustries around the economy-wide average.
The emphasis in this section is on estimating marginal products of IT capital and IT laborfor individual industries. We first discuss the empirical results of 58 industry regressionsbased on the basic specification equation. Later we discuss the rationale for separating ITcapital and IT labor from other types of capital and labor. Finally, we review the insightsgained from the four alternative specifications, addressing the issues related to time trend,lagged response, and associations between IT equipment and labor inputs.
Basic Specification: Marginal Product of IT Capital
As shown in appendix Table A-3, statistical fits for almost all 58 individual industryregressions are very good. With the exceptions of only seven industries,18 the regressionshave high explanatory power based on the F-tests (at the 10 percent level of significance).Approximately one-third of the regressions have adjusted R-squares larger than 0.90.19
18 These are the petroleum and coal products; insurance carriers; personal services; oil and gas extraction; auto repair,services, and parking; educational services; and primary metal industries.
19In general, there are very few serious problems of positive serial correlations with these regressions. Only a fewregressions have Durbin-Watson (DW) statistics smaller than 2.00. For example, tobacco manufactures has the DWstatistics of 1.40 and transportation services, 1.72.

Page 10 Economy-Wide and Industry-Level Impact of Information Technology
We begin by focusing on the elasticity of output with respect to IT capital. Although notall 58 estimated coefficients are significantly different from zero, two-thirds of theindustries have the expected positive sign. Among these, the coefficients for the 10industries in Table 2 are significantly different from zero (at the 10 percent level ofsignificance). For these 10 industries, we have statistical evidence supporting theconclusion that increases in IT equipment led to significant increases in output.
Table 2Estimated Output Elasticities With Respect to IT Equipment
Sic Code Industry Description Elasticity t-Statistic
62 Security and commodity brokers* 3.33 2.14
07,08,09 Agriculture services, forestries, and fisheries* 2.01 2.77
36,38 Electronic and other electric equipment and instruments* 1.40 2.57
46 Pipelines, except natural gas 0.85 3.07
35 Industrial machinery and equipment* 0.79 11.29
41 Local and inter-urban passenger transportation 0.64 3.04
371 Motor vehicles and equipment 0.41 3.66
25 Furniture and fixtures* 0.39 5.90
34 Fabricated metal products 0.37 4.22
67 Holding and other investment offices 0.34 3.47
* Industries that have significant elasticities for both IT Equipment and IT Labor
Although three of these elasticity estimates appear quite large, none of these isstatistically significantly different from 1 the expected upper limit. The values of theremaining seven estimated coefficients fall between zero and one, consistent with a prioriexpectation. The estimated marginal products, calculated at the mean level of output-to-IT equipment ratios for 1983-1993, for the 10 industries in Table 2, span a wide range,from $1.52 (holding and other investment offices) to $118.17 (pipelines, except naturalgas). Even though these estimates are subject to considerable uncertainty, they provideevidence that investment in IT equipment in these industries has a very high gross benefit.For any reasonable rental price of IT equipment, the net benefits of IT investment arelikely to be positive (i.e., benefit exceeds cost) in these industries and the IT rates ofreturn are likely to be high.
Although gross benefits represented by the estimated marginal products for the 10industries in Table 2 appear implausibly high in some cases, the corresponding net benefitstill need not be statistically different from zero because of large standard errors.Statistical tests, however, show that all 10 industries have an estimated net benefit greaterthan and statistically significantly different from $0.5, the assumed rental cost per dollarof IT equipment.20 Five of these industries are in the durable goods manufacturing sector
20 Under competitive conditions, excessive returns can occur only temporarily or in industries with significant entrybarriers, arising from various causes, such as regulations and economies of scale. Whether these industries share thischaracteristic or some other peculiar attribute (e.g., extraordinary dynamism and innovativeness), remains to beexamined.

Economy-Wide and Industry-Level Impact of Information Technology Page 11
with relatively high IT equipment to total equipment ratios. However, the industrieswith apparent high returns to IT equipment also include local and interurban passengertransportation in the transportation sector and security and commodity brokers in thefinance, insurance, and real estate sector, and are thus not limited to manufacturing.21
In summary, all of the 10 industries that have statistically significant marginal products ofIT equipment have marginal products large enough to cover marginal costs. The estimatedmarginal products of IT equipment for most of the 10 industries also exceed the estimatedmarginal products of investing in non-IT equipment. Thus, marginal products of ITequipment, at least for these industries, compare favorably with those of other types ofcapital.22 But the evidence does not allow us to draw the same conclusion for otherindustries.
Basic Specification: Marginal Product of IT Labor
Our second goal is to estimate marginal benefits or rates of return to IT employment. Onthis aspect of our investigation, we found virtually no study in the recent literature thataddresses the issue from an individual industry perspective. The estimated coefficientsassociated with the logarithmic value of IT labor range from zero and one for 30industries. The estimated elasticities of IT workers are statistically significant andpositive for 10 industries, as listed in Table 3. Even though some of their elasticitiesappear to be quite large, none of them is statistically significantly different from 1 theexpected upper limit. Though the derived marginal products for some of these industriesare implausibly high, they have very large variances and therefore should not beinterpreted literally. Nonetheless, the results suggest that the return for hiring anadditional IT worker in some industries may indeed be very high. By comparison,elasticities for the aggregate economy or major industrial sectors, such as manufacturingand non-manufacturing, are all within plausible ranges.23
When we compare the industries in Table 3 with those in Table 2, we find that thosemarked by an asterisk appear in both. For industries marked with an asterisk in tables 2and 3, we find strong evidence that increases in both IT equipment and IT workerscontributed significantly to their output growth. With the exception of furniture andfixtures, output of these industries grew at rates exceeding 4.5 percent annually over the
21 Among the 10 industries identified above, five are in the manufacturing sector, and a number of them, such asmachinery and fabricated metals were also found to have a marginal benefit/cost ratio (similar to TobinÕs Ò qÓ used incapital asset analysis) of greater than one for 1986 in a study of the manufacturing sector by Morrison and Berndt(1991, Table 2).22 The apparently substantial inter-industry differences in marginal products for the same type of capital, however,seem to suggest that inter-industry mobility of capital is small or that substantial differences in risk premiums existamong industries.23 Estimated marginal products of IT capital (per dollar of net capital stock), based on the pooled-cross-sectionestimates of elasticities, are 0.46 for manufacturing and 0.70 for the non-manufacturing sector. The correspondingestimated marginal products of labor (per IT worker) for the manufacturing sector is $49,052 and for the non-manufacturing sector is $19,651.

Page 12 Economy-Wide and Industry-Level Impact of Information Technology
period. Their rates of growth of IT equipment are also high, ranging from 7.4 percent to16.9 percent; but those of IT workers range from slightly negative to six percent,suggesting that each IT worker in these industries had progressively more IT capital towork with over the period.
Table 3Estimated Output Elasticities With Respect to IT Workers
Sic Code Industry Description Elasticity t-Statistic
481,482,489 Telephone and telegraph 1.94 2.78
07,08,09 Agriculture services, forestries, and fisheries* 1.70 2.30
24 Lumber and wood products 1.57 2.05
62 Security and commodity brokers* 1.41 2.15
35 Industrial machinery and equipment* 0.93 4.08
36,38 Electronic and other electric equipment and instruments* 0.91 3.01
25 Furniture and fixtures* 0.79 2.12
64 Insurance agents, brokers, and services 0.34 2.90
76 Miscellaneous repair services 0.28 2.68
60,61 Depository and nondepository institutions 0.27 5.56
* Industries that have significant elasticities for both IT Equipment and IT Labor
Comparison with Earlier Results
Studies of IT productivity based on the production function approach have relied mostlyon data at the company level. Loveman (1994), using 1978-84 data from a sample of 60divisions (Òbusiness unitsÓ) of U.S. and Western European manufacturing companies,found that gross marginal benefits of increasing IT were not significantly different fromzero. In contrast, Brynjolfsson and Hitt (1993, 1994) and Lichtenberg (1993), using1988-92 data for Fortune 500 manufacturing and service companies, found that the grossmarginal return to IT was over 60 percent. They further suggested that net marginalreturns to IT were likely to be positive, based on various assumptions of depreciationrates. Hitt and Brynjolfsson (1995), found that the marginal return to IT (both capitaland labor combined) was approximately 95 percent.
Morrison and Berndt (1991), using BEA data at the industry level for 20 manufacturingindustries for 1968-86, found that net marginal benefits of IT were negative, suggesting anover-investment in IT. In their subsequent study, Berndt and Morrison (1995) foundthat rates of return to IT were not significantly related to the proportion of IT in capital.The estimated effects of IT share on rates of return in a log-linear specification werenegative in thirteen industries and positive in seven industries. Among these, only four ofthe estimated coefficients were statistically significant: three negative and one positive. Incontrast, our findings on rates of return to IT are non-negative in two-thirds of the 58industries and positive and significant for 10 industries. Any anomalies or apparentcontradictions between their findings and our own may derive primarily from variations in

Economy-Wide and Industry-Level Impact of Information Technology Page 13
methodology and data, including differences in the selection of time periods and in themeasurement of output.24
We have only limited evidence on complementarity or substitutability between IT capitaland either of the two classes of labor.25 But our results are consistent with Baily andChakrabartiÕs (1988) speculation that IT capital and IT labor have low substitutability.This implies that production tends to become increasingly IT labor intensive as the priceof IT capital declines over time, suggesting the two are complements.
Are IT Capital and Labor Really Different from Other Capitaland Labor?
An important feature of our basic specification is the treatment of IT equipment asdistinct from non-IT equipment and IT workers as distinct from non-IT workers.Although this is logical, it is still useful to examine whether there is some statisticalevidence to confirm the merits of this approach. One statistical test to answer thisquestion is to replace IT equipment stock, non-IT equipment stock, IT workers, and non-IT workers in our basic specification with total equipment, total employment, share of ITequipment in total equipment, and share of IT workers in total employment. If theseregression results show that the coefficients of the shares of IT-equipment and/orworkers are statistically significant, we would conclude that it is desirable to treat ITequipment and/or IT workers as distinct from non-IT capital or labor. Statistical testsgenerally indicate that splitting IT-equipment or IT-workers from non-IT capital or non-IT workers is desirable.26
Time Trend and Lagged Response
In addition to the basic specification of the model, we modify the equation on page 3 totest for the influence of time, adding a time trend variable in one case and a laggeddependent variable in the other.
Results of regressions with an additional trend variable show only eight industries have astatistically significant trend, indicating that time trend is not a significant variable formost industries.27
24 Our study uses value added while Morrison and Berndt used gross output.25 See our discussion of the results from alternative specifications involving interaction terms: one to represent theinteraction between IT capital and IT labor and another, the interaction between IT capital and non-IT labor.26 Tests show that one or the other of the estimated coefficients of the two share variables are statistically significantand positive for a total of 11 industries. Eight of these industries are among those that are found to have high marginalproducts or rates of return to IT capital or IT labor. These results indicate that the split between IT equipment or laborand non-IT equipment or labor is warranted, particularly for those industries where we find evidence of positive ITimpacts.27 Evidence gained from estimations using year dummies, rather than a linear trend variable, and cross-sectionalanalysis confirms that we can largely ignore time as an explanatory variable.

Page 14 Economy-Wide and Industry-Level Impact of Information Technology
We estimate another set of regressions using a modification of the equation on page 3 thatincludes the lagged dependent variable as an additional explanatory variable. Thisformulation considers rigidity in adjustment (the Òpartial adjustment hypothesis,Ó i.e., thepossible difference between short-run and long-run equilibrium). We estimate theÒadjustment coefficientÓ (the fraction of adjustment completed within the current period)by subtracting the estimated coefficient of the lagged dependent variable from one. Thevalue must range between zero and one. The value of zero for the estimated coefficient ofthe lagged dependent variable (i.e., that the adjustment coefficient is one) implies that theadjustment process is completed within the current time period.
Our regression results show that more than a third (22 out of 58 industries) of theestimated coefficients associated with the lagged dependent variable have the expectedpositive sign with a value of less than one. However, a large majority of them are notstatistically significant, suggesting a true value of zero. Consequently, we conclude thatadjustments, are made within one time period and our basic specification is statisticallysupported.28
Analysis of Synergies
Finally, we examine the interactions between IT equipment stock and the two categoriesof workers by computing two additional sets of regressions that incorporate into theequation the product of logarithmic values of IT equipment and IT workers, and theproduct of logarithmic values of IT equipment and non-IT workers. These two sets ofregressions help determine whether the elasticity of output with respect to IT equipment,and thus its marginal product, tend to increase with the hiring of an additional IT or non-IT worker (and also whether the marginal product of either of the two categories ofworkers increases as the level of IT equipment increases). A significant positivecoefficient for the interaction between IT equipment and IT worker suggests that they arecomplements; a significant negative sign, suggests that they are substitutes.
The estimated coefficients of the term representing the interaction between IT equipmentand IT workers are generally not statistically significant.29Similarly, very few of thecoefficients of the interaction variable between IT equipment and non-IT worker are
28 The estimated coefficient of the lagged dependent variable is statistically significant for only three industries:tobacco manufactures, other services, and electric services. Further, under this formulation, the estimated short-runelasticity of IT equipment is positive, though not statistically significant, for tobacco manufactuers and electricservices, as we would expect, but negative in the case of other services. The estimated coefficients of IT workers in thefirst two cases are negative, which seems improbable, though statistically significant in the case of tobaccomanufactuers.29 They are positive and statistically significant only for two industries (motor vehicles and equipment; othertransportation industries) and negative and statistically significant for six (transportation services; telephone andtelegraph; chemicals and allied products; trucking and warehousing; tobacco manufactures; and gas services).

Economy-Wide and Industry-Level Impact of Information Technology Page 15
significant. Among all regressions, we find that only nine of the estimated coefficients ofthe interaction term are negative and statistically significant.30
Overall, we find that the interaction term between IT equipment and IT worker or non-ITworker in general is not statistically significant. Thus, we accept the basic modelspecification.
V. SUMMARY AND CONCLUSIONS
Evidence from previous studies on the contribution of increases in IT equipment tooutput growth is inconclusive, and studies of the productivity of IT workers are verylimited. Using industry-level data for 58 industries for 1983-93, we estimate benefits ofincreases in IT equipment and IT workers, and compare them with the estimated returnsto non-IT capital and labor. The study is unique in covering not only manufacturing butalso non-manufacturing goods and services industries; in fact, the entire private economy.
We estimate the model for the aggregate economy by pooling eleven cross-sections for 58industries after establishing that elasticities are invariant from 1983-1993. We find that allthe economy-wide elasticities are positive and lie between zero and one, consistent with apriori expectations. Also, the sum of the elasticities is less than one, implying decreasingreturns to scale.
We find that gross marginal benefits, measured as marginal products of IT equipment varygreatly among industries. From our 58 industry regressions, we find that 10 industrieshave estimated elasticities that are positive and statistically different from zero. All 10industries show positive net marginal returns to IT equipment, and 9 of them may haveannual rates of return in excess of 100 percent. They are: (1) pipelines (except naturalgas); (2) security and commodity brokers; (3) furniture and fixtures; (4) agricultural services,forestry, and fisheries; (5) fabricated metal products; (6) motor vehicles and equipment; (7)electronic and other electric equipment and instruments; (8) industrial machinery andequipment; (9) local and inter-urban transit. We have found similar evidence on the benefitsof hiring additional IT workers.
We find little evidence to establish whether IT equipment and IT workers arecomplements or substitutes but in a few industries we do see an indication that ITequipment and non-IT workers are substitutes. 30 They are: (1) telephone and telegraph; (2) miscellaneous manufacturing industries; (3) trucking and warehousing;(4) gas services; (5) transportation services; (6) personal services; (7) primary metal industries; (8) petroleum and coalproducts; and (9) chemicals and allied products.
Page 16 Economy-Wide and Industry-Level Impact of Information Technology
Further Research
We have been able to identify industries that appear to have relatively high marginalproducts or rates of return on IT capital and IT workers. It remains unclear, however,why certain industries at this level of aggregation should have such high returns to ITcapital. Case studies of selected industries would no doubt shed more light on thismatter. Additionally, we should carefully examine whether combining IT capital and ITlabor into one input, as Brynjolfsson and Hitt (1994) have done, represents a reasonableand appropriate alternative.
Most important is to assess the feasibility of extending our current data forward to 1994or 1995 and backward to at least 1977, possibly even 1968 and to examine whetherreliable data for four-digit level industries and additional explanatory variables such aspurchased material and services can be assembled. More disaggregated (say, 4 digit SIClevel) data are likely to reveal more clearly the relationship between IT equipment andlabor on the one hand and output on the other, as the true relationships are likely to bemasked at the two-digit level by compensating differences across 4 digit industries.Moreover, if the quality and quantity of available data improve, we can apply moresophisticated econometric modeling techniques and investigate alternative approaches,including the cost function approach. This, for example, would make it possible todetermine the relative contribution to additional output of various inputs within industriesand thus provide valuable clues into whether IT investments and IT workers are makingAmerican companies more productive than they might otherwise have been.
We would also like to see how our results might change if we use gross output instead ofvalue added as the measure of industry product, as in Berndt and Morrison (1991, 1995).
Economy-Wide and Industry-Level Impact of Information Technology Page 17
VI. REFERENCES
Attewell, P. (1994), ÒInformation Technology and the Productivity Paradox,Ó in Organizational Linkages: Understanding the Productivity Paradox, ed. Douglas Harris, Washington, DC: National Academy Press, pp. 13-60.
Baily, M. and A. Charabarti (1988), Innovation and Productivity Crisis, Washington, DC: Brookings Institution.
Baumol, Blackman, and Wolff (1989), Productivity and American Leadership: The LongView, Cambridge, p. 148.
Berndt, E., C. Morrison, and L. Rosenblum (1992), ÒHigh-Tech Capital Formation andLabor Composition in U.S. Manufacturing Industries: An Exploratory Analysis,Ó
NBER Working Paper No. 4010, March.
Berndt, E. and C. Morrison (1995), ÒHigh-Tech Capital Formation and Economic Performance in U.S. Manufacturing Industries: An Exploratory Analysis,Ó Journal of Econometrics, 65, 9-43.
Brynjolfsson, E. (1993), ÒThe Productivity Paradox of Information Technology,Ó Communications of the ACM, Vol. 36, No. 12, 66-77.
Brynjolfsson, E. and L. Hitt (1994), ÒInformation Technology as a Factor of Production: The Role of Differences Among Firms,Ó MIT Sloan School Working Paper 3715, August.
Cohen, Robert B. (1995), ÒThe Economic Impact of Information Technology,Ó Business Economics, Vol. XXX, No. 4, October, 1995.
Harper, M. J., E. R. Berndt, and D. O. Wood, (1989), ÒRates of Return and Capital Aggregation Using Alternative Rental Prices,Ó in D. W. Jorgenson and R. Landau (eds.), Technology and Capital Formation, MIT Press, pp. 331-72.
Hitt, L. and E. Brynjolfsson (1995), ÒCreating Value and Destroying Profits? Three Measures of Information TechnologyÕs Contributions,Ó MIT Sloan School Working Paper, May.

Page 18 Economy-Wide and Industry-Level Impact of Information Technology
Lau, L. and I. Tokutso (1992), ÒThe Impact of Computer Technology on the Aggregate Productivity of the United States: An Indirect Approach,Ó Unpublished
paper, Department of Economics, Stanford University, August.
Landauer, T. (1995), The Trouble With Computers: Usefulness, Usability, and Productivity, Cambridge and London: MIT Press.
Lichtenberg, F. R. (1993), ÒThe Output Contributions of Computer Equipment and Personnel: A Firm-Level Analysis,Ó NBER Working Paper No. 4540, November.
Loveman, G. W. (1994), ÒAn Assessment of the Productivity Impact of Information Technologies,Ó in, Allen T.J. and M. S. Scott Morton (ed.), Information Technology and the Corporation of the 1990s: Research Studies, Oxford University Press.
Miles et al (1990), Mapping and Measuring the Information Economy, Cambridge, England.
Morrison, J. C. and E. R. Berndt (1991), ÒAssessing the Productivity of Information Technology Equipment in U.S. Manufacturing Industries,Ó NBER Working Paper No.
3583, January.
Roach, S. (1987), ÒAmericaÕs Technology Dilemma: A Profile of the Information Economy,Ó Special Economic Study, Morgan Stanley.
Roach, S. (1991), ÒServices Under Siege: The Restructuring Imperative,Ó Harvard Business Review, Sept.-Oct., 82-92.

Economy-Wide and Industry-Level Impact of Information Technology Page 19
APPENDICIES
Table A- 1Capital Equipment Shares and Labor Shares by Summary and Detailed Industries
(PercentSIC Code Industry Description Equipment Share of Total
Net Capital StockIT Equipment Share of Total Net
Capital Stock of EquipmentIT Workers Share of Total
Workers
1983 1993 1983 1993 1983 1993
01,02,07-09 Agriculture, forestry, and fisheries 49.3 44.8 1.2 7.7 5.40 5.7001,02 Farms 46.9 38.3 0.1 0.2 5.40 5.7007,08,09 Agricultrural services, forestries, and fisheries 74.5 73.1 8.8 24.6 5.40 5.7010-14 Mining 32.3 27.3 8.1 15.7 24.56 25.3710 Metal Mining 26.4 21.9 4.1 15.4 19.94 18.4212 Coal Mining 45.5 31.3 6.8 17.5 12.03 10.9413 Oil and gas extraction 30.1 25.4 9.6 18.1 31.40 34.7214 Nonmetallic minerals, except fuels 47.7 46.9 0.2 0.5 11.01 11.9715,16,17 Construction 60.9 60.1 4.7 12.7 12.27 13.7020-39 Manufacturing 59.0 56.9 8.6 19.4 18.40 19.9024,25,32-39 Durable goods 60.8 58.3 7.2 19.2 20.83 22.5324 Lumber and wood products 50.5 42.0 6.2 18.9 6.94 8.4825 Furniture and fixtures 36.5 35.7 3.9 17.1 7.38 8.8232 Stone, clay, and glass products 60.6 56.1 6.1 25.6 11.64 11.4433 Primary metal industries 70.7 70.8 5.5 9.3 12.62 13.4534 Fabricated metal products 65.2 63.2 2.1 6.7 13.29 13.8935 Industrial machinery and equipment 58.1 60.7 7.5 23.9 25.31 26.8736,38 Electronic and other electric equipment and instruments 54.7 54.9 18.2 33.1 28.51 32.31371 Motor vehicles and equipment 72.1 66.0 2.1 9.8 15.64 18.4237 except 371 Other transportation equipment 48.0 43.4 6.8 15.9 35.65 38.2639 Miscellaneous manufacturing industries 45.2 45.7 2.1 12.2 12.82 13.6420-23,26-31 Nondurable goods 57.0 55.3 10.3 19.5 15.03 16.5020 Food and kindred products 54.5 52.9 7.5 15.0 9.12 9.4921 Tobacco manufactures 42.8 43.1 10.8 15.8 11.89 19.8322 Textile mill products 61.2 56.2 4.3 14.8 6.86 6.7623 Apparel and other textile products 44.5 33.7 1.9 3.5 5.00 5.5826 Paper and allied products 74.3 73.2 1.6 6.6 13.06 14.0727 Printing and publishing 50.6 49.6 4.3 22.8 22.32 23.1028 Chemicals and allied products 62.0 55.7 21.2 32.8 33.29 37.1129 Petroleum and coal products 40.3 45.3 11.2 19.6 38.93 42.4330 Rubber and miscellaneous plastics products 58.1 56.0 3.0 10.6 11.49 11.0931 Leather and leather products 43.2 36.9 3.8 14.4 6.38 7.2140-42,44-47,48,49 Transportation and public utilities 43.5 41.8 32.7 39.1 23.26 22.2540-42,44-47 Transportation 58.0 53.7 4.6 19.8 11.09 12.5640 Railroad transportation 31.6 25.9 4.9 25.7 9.23 9.4341 Local and interurban passenger transportation 78.0 85.0 22.4 39.7 13.94 18.8542 Trucking and warehousing 76.3 73.7 2.7 5.1 6.70 7.5544 Water transportation 94.4 80.9 1.5 13.9 9.88 9.0545 Transportation by air 89.7 81.9 8.2 30.6 21.35 20.1346 Pipelines, except natural gas 2.1 1.2 4.5 22.9 39.23 43.8047 Transportation services 95.2 89.1 0.9 6.3 12.46 15.7448 Communications 56.1 51.2 84.2 80.2 37.89 37.05481,482,489 Telephone and telegraph 56.7 48.3 87.9 86.3 37.89 37.05483,484 Radio and television 50.8 64.2 47.7 60.2 37.89 37.0549 Electric, gas, and sanitary services 28.0 32.3 8.2 18.4 39.15 38.67491,pt493 Electric services 31.0 34.6 7.2 14.2 41.42 42.40492,pt493 Gas services 17.6 20.0 14.1 26.9 41.42 42.40494,495,496,497 Sanitary services 16.4 36.5 19.9 46.8 15.99 20.6750,51 Wholesale trade 51.9 63.5 31.2 53.8 17.46 18.4352-59 Retail trade 39.6 47.7 23.6 44.2 9.92 8.5860-67 Finance, insurance, and real estate 29.5 37.8 25.1 36.7 27.72 30.8560,61 Depository and nondepository institutions 62.2 68.0 7.0 23.8 30.21 32.4462 Security and commodity brokers 33.9 41.0 67.8 78.3 24.10 29.2063 Insurance carriers 34.5 48.8 33.6 62.8 32.13 35.0864 Insurance agents, brokers, and services 31.9 53.8 65.9 84.2 24.62 26.5165 Real estate 19.1 22.5 40.4 43.4 16.57 22.6467 Holding and other investment offices 29.6 37.1 61.9 77.6 46.92 48.0470-79,80-87,89 Services 57.0 62.4 17.2 28.8 46.23 45.1470 Hotels and other lodging places 15.4 13.6 14.8 29.7 41.46 41.5972 Personal services 45.3 54.5 20.1 35.8 11.40 12.3573 Business services 84.5 85.7 9.1 17.0 30.20 28.3775 Auto repair, services, and parking 90.5 90.5 9.2 18.6 5.03 8.2176 Miscellaneous repair services 70.2 66.7 3.2 20.6 10.49 14.0978 Motion pictures 42.4 60.4 65.9 72.5 26.30 26.7779 Amusement and recreation services 46.5 34.7 24.4 33.1 19.92 24.8580 Health services* 44.3 44.7 51.2 52.5 51.15 52.2581 Legal services 43.5 66.3 30.1 54.2 49.60 50.6982 Educational services* 26.5 17.7 19.9 50.6 63.56 63.1883,84,86,87,89 Other services 34.0 53.4 26.4 53.6 40.42 39.17
Notes: Net Capital Stock = Gross Capital Stocks - Accumulated Depreciation (straight-line method); share calculations based on constant (1987) dollars:IT Equipment = Office, computing, and accounting machinery + Communications equipment + Instruments + Photocopy and related equipment.IT Workers = Electrical and electronics engineers + Computer engineers, scientists, and systems analysts + Broadcast technicians + Computer programmers + Computer operators
and peripheral equipment operators + Typists and word processing equipment repairers.* Employment numbers for this industry include government workers.
Sources: Bureau of Economic Analysis and Bureau of Labor Statistics.

Page 20 Economy-Wide and Industry-Level Impact of Information Technology
Table A- 2Capital and Labor Intensity
(Based on 1987 dollars)
Capital/Output Ratio Employees per Million $ of OutputSIC Code Industry Description Capital Intensity IT Capital
IntensityLabor Intensity IT Labor
Intensity1983 1993 1983 1993 1983 1993 1983 1993
01,02,07-09 Agriculture, forestry, and fisheries 3.31 1.64 0.02 0.06 23.46 16.43 1.27 0.9401,02 Farms 3.85 1.92 0.00 0.00 21.60 14.02 1.17 0.8007,08,09 Agricultrural services, forestries, and fisheries 1.32 0.99 0.09 0.18 30.07 21.78 1.62 1.2410-14 Mining 3.71 1.88 0.10 0.08 13.35 6.43 3.28 1.6310 Metal Mining 8.36 1.73 0.09 0.06 20.89 5.88 4.17 1.0812 Coal Mining 2.74 1.31 0.09 0.07 18.97 6.49 2.28 0.7113 Oil and gas extraction 3.79 2.07 0.11 0.09 11.30 5.62 3.55 1.9514 Nonmetallic minerals, except fuels 2.46 1.72 0.00 0.00 19.30 13.85 2.12 1.6615,16,17 Construction 0.33 0.25 0.01 0.02 23.44 22.50 2.88 3.0820-39 Manufacturing 1.25 1.12 0.06 0.12 25.12 18.34 4.62 3.6524,25,32-39 Durable goods 1.23 0.98 0.05 0.11 26.60 17.53 5.54 3.9524 Lumber and wood products 0.94 0.79 0.03 0.06 29.80 29.68 2.07 2.5225 Furniture and fixtures 0.64 0.62 0.01 0.04 36.42 29.66 2.69 2.6232 Stone, clay, and glass products 1.42 1.10 0.05 0.16 24.58 20.41 2.86 2.3433 Primary metal industries 3.09 2.00 0.12 0.13 25.76 16.86 3.25 2.2734 Fabricated metal products 1.11 0.87 0.02 0.04 27.04 20.58 3.59 2.8635 Industrial machinery and equipment 1.33 0.85 0.06 0.12 30.72 15.15 7.78 4.0736,38 Electronic & other elec. Equip. & instruments 0.97 0.94 0.10 0.17 27.86 15.67 7.94 5.06371 Motor vehicles and equipment 1.12 1.06 0.02 0.07 15.97 14.70 2.50 2.7137 except 371 Other transportation equipment 0.85 1.04 0.03 0.07 23.37 17.30 8.33 6.6239 Miscellaneous manufacturing industries 0.87 0.50 0.01 0.03 36.30 19.34 4.65 2.6420-23,26-31 Nondurable goods 1.27 1.32 0.07 0.14 23.31 19.51 3.50 3.2220 Food and kindred products 1.13 1.25 0.05 0.10 22.32 19.58 2.04 1.8621 Tobacco manufactures 0.42 0.89 0.02 0.06 4.33 6.15 0.52 1.2222 Textile mill products 1.31 0.96 0.03 0.08 40.97 28.59 2.81 1.9323 Apparel and other textile products 0.44 0.33 0.00 0.00 57.02 38.62 2.85 2.1626 Paper and allied products 1.65 1.62 0.02 0.08 19.01 14.75 2.48 2.0827 Printing and publishing 0.53 0.86 0.01 0.10 23.65 26.34 5.28 6.0928 Chemicals and allied products 1.74 1.80 0.23 0.33 15.31 12.24 5.10 4.5429 Petroleum and coal products 3.00 2.42 0.14 0.22 9.01 6.29 3.51 2.6730 Rubber and miscellaneous plastics products 1.27 0.98 0.02 0.06 34.88 23.88 4.01 2.6531 Leather and leather products 0.51 0.39 0.01 0.02 48.79 27.57 3.11 1.9940-42,44-47,48,49 Transportation and public utilities 3.01 2.24 0.43 0.37 14.10 11.06 3.28 2.4640-42,44-47 Transportation 2.25 1.25 0.06 0.13 21.59 18.14 2.39 2.2840 Railroad transportation 6.53 3.32 0.10 0.22 21.73 8.90 2.01 0.8441 Local and interurban passenger transportation 0.63 0.48 0.11 0.16 34.69 38.59 4.84 7.2742 Trucking and warehousing 1.05 0.46 0.02 0.02 23.41 20.62 1.57 1.5644 Water transportation 3.48 2.42 0.05 0.27 22.24 21.93 2.20 1.9945 Transportation by air 1.76 1.12 0.13 0.28 17.85 15.34 3.81 3.0946 Pipelines, except natural gas 3.55 3.21 0.00 0.01 3.19 3.28 1.25 1.4447 Transportation services 1.69 1.10 0.02 0.06 22.90 21.58 2.85 3.4048 Communications 2.58 1.96 1.22 0.80 12.30 7.88 4.66 2.92481,482,489 Telephone and telegraph 2.79 2.05 1.39 0.85 11.28 7.30 4.27 2.71483,484 Radio and television 1.58 1.62 0.38 0.63 17.46 9.89 6.62 3.6649 Electric, gas, and sanitary services 4.22 3.69 0.10 0.22 7.59 5.78 2.97 2.24491,pt493 Electric services 6.23 4.31 0.14 0.21 9.34 5.40 3.87 2.29492,pt493 Gas services 1.87 2.19 0.05 0.12 4.61 4.63 1.91 1.96494,495,496,497 Sanitary services 2.86 3.98 0.09 0.68 16.09 13.61 2.57 2.8150,51 Wholesale trade 0.66 0.69 0.11 0.23 23.57 17.14 4.12 3.1652-59 Retail trade 0.63 0.75 0.06 0.16 42.69 38.58 4.24 3.3160-67 Finance, insurance, and real estate 1.03 1.35 0.08 0.19 7.51 7.22 2.08 2.2360,61 Depository and nondepository institutions 1.20 2.35 0.05 0.38 16.66 17.35 5.03 5.6362 Security and commodity brokers 0.20 0.11 0.05 0.04 12.64 6.90 3.05 2.0163 Insurance carriers 0.52 1.61 0.06 0.49 23.23 21.63 7.46 7.5964 Insurance agents, brokers, and services 0.12 0.10 0.02 0.05 19.49 20.79 4.80 5.5165 Real estate 1.13 1.29 0.09 0.13 2.10 2.19 0.35 0.5067 Holding and other investment offices 0.94 0.82 0.17 0.24 11.46 11.43 5.38 5.4970-79,80-87,89 Services 0.49 0.53 0.05 0.09 39.61 42.89 18.31 19.3670 Hotels and other lodging places 1.54 1.29 0.04 0.05 33.86 34.67 14.04 14.4272 Personal services 0.46 0.67 0.04 0.13 31.72 36.22 3.62 4.4773 Business services 0.44 0.42 0.03 0.06 28.26 29.39 8.54 8.3475 Auto repair, services, and parking 1.79 2.36 0.15 0.40 15.35 21.52 0.77 1.7776 Miscellaneous repair services 0.53 0.65 0.01 0.09 17.52 16.37 1.84 2.3178 Motion pictures 0.63 0.86 0.17 0.38 25.74 23.70 6.77 6.3579 Amusement and recreation services 0.80 0.50 0.09 0.06 31.26 32.37 6.23 8.0580 Health services* 0.22 0.31 0.05 0.07 33.04 40.27 16.90 21.0481 Legal services 0.15 0.24 0.02 0.09 12.75 16.57 6.32 8.4082 Educational services* 0.08 0.11 0.00 0.01 283.12 341.06 179.95 215.4783,84,86,87,89 Other services 0.34 0.24 0.03 0.07 33.85 32.95 13.68 12.91
Notes: Capital Intensity = Net Capital equipment and Structures/OutputIT Capital Intensity = Net IT Capital Equipment/OutputLabor Intensity = Number of Employees/OutputIT Labor Intensity = Number of IT Employees/Output* Employment numbers for this industry include government workers.
Source: Office of Business and Industrial Analysis calculations based on BEA and BLS data
Table A- 3Summary of Regression Results for Detailed and Aggregate Industries
IT Other IT Other Adj-RSQ
SIC Code Industry Description Intercept Workers Workers Equipment Equipment Structures DW
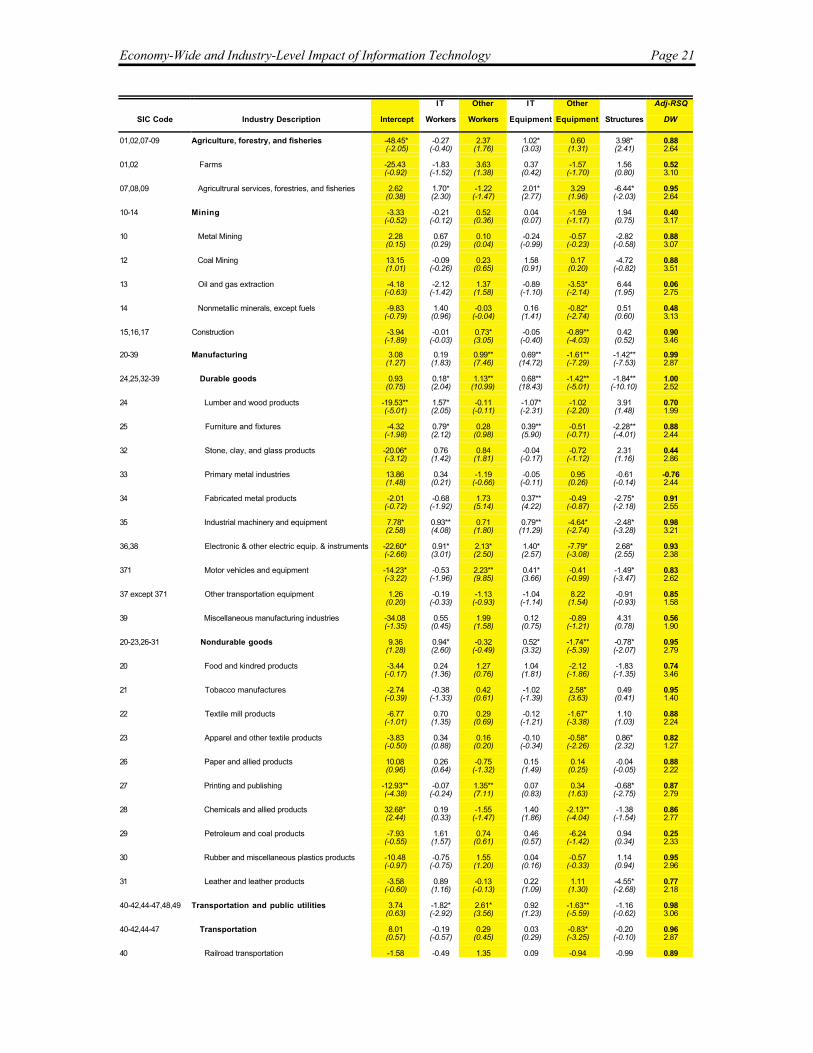
Economy-Wide and Industry-Level Impact of Information Technology Page 21
IT Other IT Other Adj-RSQ
SIC Code Industry Description Intercept Workers Workers Equipment Equipment Structures DW
01,02,07-09 Agriculture, forestry, and fisheries -48.45* -0.27 2.37 1.02* 0.60 3.98* 0.88(-2.05) (-0.40) (1.76) (3.03) (1.31) (2.41) 2.64
01,02 Farms -25.43 -1.83 3.63 0.37 -1.57 1.56 0.52(-0.92) (-1.52) (1.38) (0.42) (-1.70) (0.80) 3.10
07,08,09 Agricultrural services, forestries, and fisheries 2.62 1.70* -1.22 2.01* 3.29 -6.44* 0.95(0.38) (2.30) (-1.47) (2.77) (1.96) (-2.03) 2.64
10-14 Mining -3.33 -0.21 0.52 0.04 -1.59 1.94 0.40(-0.52) (-0.12) (0.36) (0.07) (-1.17) (0.75) 3.17
10 Metal Mining 2.28 0.67 0.10 -0.24 -0.57 -2.82 0.88(0.15) (0.29) (0.04) (-0.99) (-0.23) (-0.58) 3.07
12 Coal Mining 13.15 -0.09 0.23 1.58 0.17 -4.72 0.88(1.01) (-0.26) (0.65) (0.91) (0.20) (-0.82) 3.51
13 Oil and gas extraction -4.18 -2.12 1.37 -0.89 -3.53* 6.44 0.06(-0.63) (-1.42) (1.58) (-1.10) (-2.14) (1.95) 2.75
14 Nonmetallic minerals, except fuels -9.83 1.40 -0.03 0.16 -0.82* 0.51 0.48(-0.79) (0.96) (-0.04) (1.41) (-2.74) (0.60) 3.13
15,16,17 Construction -3.94 -0.01 0.73* -0.05 -0.89** 0.42 0.90(-1.89) (-0.03) (3.05) (-0.40) (-4.03) (0.52) 3.46
20-39 Manufacturing 3.08 0.19 0.99** 0.69** -1.61** -1.42** 0.99(1.27) (1.83) (7.46) (14.72) (-7.29) (-7.53) 2.87
24,25,32-39 Durable goods 0.93 0.18* 1.13** 0.68** -1.42** -1.84** 1.00(0.75) (2.04) (10.99) (18.43) (-5.01) (-10.10) 2.52
24 Lumber and wood products -19.53** 1.57* -0.11 -1.07* -1.02 3.91 0.70(-5.01) (2.05) (-0.11) (-2.31) (-2.20) (1.48) 1.99
25 Furniture and fixtures -4.32 0.79* 0.28 0.39** -0.51 -2.28** 0.88(-1.98) (2.12) (0.98) (5.90) (-0.71) (-4.01) 2.44
32 Stone, clay, and glass products -20.06* 0.76 0.84 -0.04 -0.72 2.31 0.44(-3.12) (1.42) (1.81) (-0.17) (-1.12) (1.16) 2.86
33 Primary metal industries 13.86 0.34 -1.19 -0.05 0.95 -0.61 -0.76(1.48) (0.21) (-0.66) (-0.11) (0.26) (-0.14) 2.44
34 Fabricated metal products -2.01 -0.68 1.73 0.37** -0.49 -2.75* 0.91(-0.72) (-1.92) (5.14) (4.22) (-0.87) (-2.18) 2.55
35 Industrial machinery and equipment 7.78* 0.93** 0.71 0.79** -4.64* -2.48* 0.98(2.58) (4.08) (1.80) (11.29) (-2.74) (-3.28) 3.21
36,38 Electronic & other electric equip. & instruments -22.60* 0.91* 2.13* 1.40* -7.79* 2.68* 0.93(-2.66) (3.01) (2.50) (2.57) (-3.08) (2.55) 2.38
371 Motor vehicles and equipment -14.23* -0.53 2.23** 0.41* -0.41 -1.49* 0.83(-3.22) (-1.96) (9.85) (3.66) (-0.99) (-3.47) 2.62
37 except 371 Other transportation equipment 1.26 -0.19 -1.13 -1.04 8.22 -0.91 0.85(0.20) (-0.33) (-0.93) (-1.14) (1.54) (-0.93) 1.58
39 Miscellaneous manufacturing industries -34.08 0.55 1.99 0.12 -0.89 4.31 0.56(-1.35) (0.45) (1.58) (0.75) (-1.21) (0.78) 1.90
20-23,26-31 Nondurable goods 9.36 0.94* -0.32 0.52* -1.74** -0.78* 0.95(1.28) (2.60) (-0.49) (3.32) (-5.39) (-2.07) 2.79
20 Food and kindred products -3.44 0.24 1.27 1.04 -2.12 -1.83 0.74(-0.17) (1.36) (0.76) (1.81) (-1.86) (-1.35) 3.46
21 Tobacco manufactures -2.74 -0.38 0.42 -1.02 2.58* 0.49 0.95(-0.39) (-1.33) (0.61) (-1.39) (3.63) (0.41) 1.40
22 Textile mill products -6.77 0.70 0.29 -0.12 -1.67* 1.10 0.88(-1.01) (1.35) (0.69) (-1.21) (-3.38) (1.03) 2.24
23 Apparel and other textile products -3.83 0.34 0.16 -0.10 -0.58* 0.86* 0.82(-0.50) (0.88) (0.20) (-0.34) (-2.26) (2.32) 1.27
26 Paper and allied products 10.08 0.26 -0.75 0.15 0.14 -0.04 0.88(0.96) (0.64) (-1.32) (1.49) (0.25) (-0.05) 2.22
27 Printing and publishing -12.93** -0.07 1.35** 0.07 0.34 -0.68* 0.87(-4.38) (-0.24) (7.11) (0.83) (1.63) (-2.75) 2.79
28 Chemicals and allied products 32.68* 0.19 -1.55 1.40 -2.13** -1.38 0.86(2.44) (0.33) (-1.47) (1.86) (-4.04) (-1.54) 2.77
29 Petroleum and coal products -7.93 1.61 0.74 0.46 -6.24 0.94 0.25(-0.55) (1.57) (0.61) (0.57) (-1.42) (0.34) 2.33
30 Rubber and miscellaneous plastics products -10.48 -0.75 1.55 0.04 -0.57 1.14 0.95(-0.97) (-0.75) (1.20) (0.16) (-0.33) (0.94) 2.96
31 Leather and leather products -3.58 0.89 -0.13 0.22 1.11 -4.55* 0.77(-0.60) (1.16) (-0.13) (1.09) (1.30) (-2.68) 2.18
40-42,44-47,48,49 Transportation and public utilities 3.74 -1.82* 2.61* 0.92 -1.63** -1.16 0.98(0.63) (-2.92) (3.56) (1.23) (-5.59) (-0.62) 3.06
40-42,44-47 Transportation 8.01 -0.19 0.29 0.03 -0.83* -0.20 0.96(0.57) (-0.57) (0.45) (0.29) (-3.25) (-0.10) 2.87
40 Railroad transportation -1.58 -0.49 1.35 0.09 -0.94 -0.99 0.89

Page 22 Economy-Wide and Industry-Level Impact of Information Technology
IT Other IT Other Adj-RSQ
SIC Code Industry Description Intercept Workers Workers Equipment Equipment Structures DW
(-0.20) (-1.65) (1.76) (0.59) (-1.51) (-0.76) 2.76
41 Local and interurban passenger transportation -5.46 -0.05 0.79 0.64* -1.53* 1.65 0.73(-0.43) (-0.26) (0.72) (3.04) (-3.47) (1.88) 2.80
42 Trucking and warehousing 11.48 0.07 -0.35 0.25 -0.29 -0.88 0.95(1.61) (0.43) (-0.72) 0.87) (-0.49) (-0.75) 1.96
44 Water transportation -9.62 0.06 0.73* 0.17 0.73 0.35 0.81(-3.06) (0.39) (3.04) (1.67) (1.83) (0.98) 2.85
45 Transportation by air -9.95 0.89 -0.49 -0.29 1.92* 1.71** 0.94(-1.18) (1.33) (-0.97) (-1.48) (2.26) (4.86) 3.01
46 Pipelines, except natural gas 23.66* 0.44 0.77 0.85* 2.95** -8.85* 0.58(2.36) (1.01) (1.24) (3.07) (4.06) (-3.66) 3.06
47 Transportation services -2.39 -0.03 0.67 0.09 -1.09 -0.05 0.96(-0.43) (-0.24) (1.30) (1.61) (-1.81) (-0.36) 1.72
48 Communications 10.15 2.09* -2.19* -2.58* -0.61 2.38** 0.97(1.02) (2.07) (-2.26) (-2.31) (-1.93) (4.69) 2.77
481,482,489 Telephone and telegraph 24.71** 1.94* -2.07* -3.05** 0.21 -0.70 0.98(5.10) (2.78) (-3.04) (-5.58) (1.02) (-1.76) 3.32
483,484 Radio and television 36.59* -3.52 0.93 0.85 2.10 -3.76 0.85(2.56) (-0.63) (0.17) (-0.60) (0.68) (-1.56) 2.21
49 Electric, gas, and sanitary services -12.52 -1.69 1.71 -0.02 -0.80 3.43 0.88(-0.65) (-1.36) (0.94) (-0.03) (-0.91) (0.92) 2.81
491,pt493 Electric services 17.84 -0.92 -0.80 0.43 -0.19 1.42 0.90(0.85) (-0.25) (-0.23) (0.62) (-0.08) (0.27) 1.51
492,pt493 Gas services -3.58 -0.77 0.55 -0.27 -0.16 2.40* 0.44(-0.23) (-0.27) (0.16) (-0.99) (-0.19) (2.23) 1.81
494,495,496,497 Sanitary services 17.45 -0.54** -1.50 -0.74* 1.82* 1.69* 0.99(1.38) (-4.49) (-1.15) (-2.62) (2.34) (2.81) 2.49
50,51 Wholesale trade 1.04 -0.31 0.28 0.15 0.88 0.11 0.94(0.09) (-0.78) (0.28) -0.80 (1.10) (0.32) 2.54
52-59 Retail trade -17.01 0.19 1.31* 0.07 0.21 -0.48 0.92(-1.91) (1.25) (2.34) (0.19) (0.26) (-0.94) 2.82
60-67 Finance, insurance, and real estate 19.68** -0.03 -0.70** 0.35** 0.54* -0.99* 0.98(5.73) (-0.33) (-4.12) (4.09) (2.36) (-2.98) 2.96
60,61 Depository and nondepository institutions -8.68** 0.27** 0.65** -0.07* 0.22* -0.06 0.99(-10.98) (5.56) (14.64) (-3.23) (3.85) (-1.21) 3.49
62 Security and commodity brokers 15.52 1.41* -1.95 3.33* -1.42 -4.52 0.88(0.67) (2.15) (-1.09) (2.14) (-1.65) (-1.72) 3.26
63 Insurance carriers 50.37* 0.03 -3.66 -0.54 1.38 0.41 0.24(2.05) (0.02) (-1.52) (-0.79) (0.88) (0.80) 2.83
64 Insurance agents, brokers, and services -4.65 0.34* 0.22 0.12 -0.64 0.63 0.86(-0.68) (2.90) (0.64) (0.50) (-0.60) (0.43) 3.03
65 Real estate 9.72 0.01 -0.35 0.61 -0.13 -0.11 0.89(0.90) (0.05) (-0.45) (1.45) (-0.23) (-0.18) 2.33
67 Holding and other investment offices -0.05 0.01 0.03 0.34* -0.74* 0.98* 0.99(-0.03) (0.02) (0.04) (3.47) (-3.69) (2.23) 2.96
70-79,80-87,89 Services 4.10 -1.65** 1.80** 0.29* -0.92* 0.66* 0.99
(1.63) (-4.59) (5.21) (3.33) (-3.20) (2.10) 2.90
70 Hotels and other lodging places -1.19 0.11 0.41 0.28 -0.09 -0.58 0.96(-0.25) (0.16) (0.88) (1.56) (-0.73) (-0.77) 3.04
72 Personal services -2.65 0.22 0.28 0.18 -1.00 0.58 0.15(-0.31) (0.94) (0.39) (0.42) (-1.05) (0.40) 2.26
73 Business services -8.37* 0.44 0.59 0.11 -0.53 0.15 0.98(-2.08) (0.74) (1.72) (0.66) (-0.79) (0.34) 3.08
75 Auto repair, services, and parking -11.58 0.11 1.12* -0.13 0.30 -0.93 0.05(-1.28) (1.32) (2.36) (-0.85) (0.17) (-0.58) 2.02
76 Miscellaneous repair services -4.44 0.28* 0.31 -0.02 0.06 0.41 0.89(-1.39) (2.68) (1.20) (-0.12) (0.15) (0.39) 2.70
78 Motion pictures -11.78 0.11 1.15 0.70 -0.44 -1.20 0.89(-1.83) (0.12) (0.80) (0.17) (-0.05) (-0.20) 2.50
79 Amusement and recreation services -6.06 0.07 0.65 0.38 -0.18 -0.08 0.96(-1.32) (0.39) (1.75) (1.30) (-0.53) (-0.19) 1.72
80 Health services*** -26.42 -0.64 3.07* 0.28 0.78 -2.23* 0.71(-1.52) (-0.55) (2.14) (0.28) (1.09) (-2.21) 2.56
81 Legal services -15.81** -0.07 1.42* -0.32* -0.25 1.86** 0.97(-4.08) (-0.11) (2.63) (-2.96) (-1.49) (4.38) 2.97
82 Educational services*** -43.17 1.13 1.95 0.10 -1.51 -1.75 -0.09(-0.94) (0.38) (1.28) (0.50) (-1.66) (-1.70) 2.30
83,84,86,87,89 Other services -11.71 2.34 -0.46 -0.11 -1.43 -2.32 0.94

Economy-Wide and Industry-Level Impact of Information Technology Page 23
IT Other IT Other Adj-RSQ
SIC Code Industry Description Intercept Workers Workers Equipment Equipment Structures DW
(-1.26) (1.81) (-0.33) (-0.26) (-0.96) (-1.58) 1.8
Notes: * Significant at the 10 percent level.**Significant at the 1 percent level.***Employment numbers for this industry include government workers.
Source: Office of Business and Industrial Analysis.