economy-wide impact of electricity shortage - a cge analysis
DESCRIPTION
Ethiopian Development Research Institute (EDRI) and International Food Policy Research Institute (IFPRI), Seventh International Conference on Ethiopian Economy, June 24, 2010TRANSCRIPT

Economy-wide Impact of Electricity in Ethiopia: Shortage and Future Prospects Reflections based on CGE
Ermias Engeda (ESSP), Eyasu Tsehaye (EDRI), Sineshaw Tameru(ESSP).
International Conference on Ethiopian Economy

Background
• Ethiopia recently endured power cuts due to: 1.unprecedented demand rise;
2.the delay in the completion of hydropower generating projects.
• Blackouts had to be scheduled throughout the country.

Figure 1: Power generation capacity of the new plants and projects (in MW)
• In 2009/10 total generating capacity has raised by 1180 MW.
• There are twelve power generation plants remaining to be completed in five to
ten years with 10,542MW potential.


Figure4: Total monthly expected output from all plants and diesel generators (in GWH)
• EEPCO was expecting to produce some 5272 GWH. That is 2811GWH from the old dams, 1929 GWH from the newly inaugurated dams, and 532 GWH from government owned and rented diesel generators.
• During Hamle and Nehase total electricity output was the lowest because of shortage of rainfall during the Belg season.
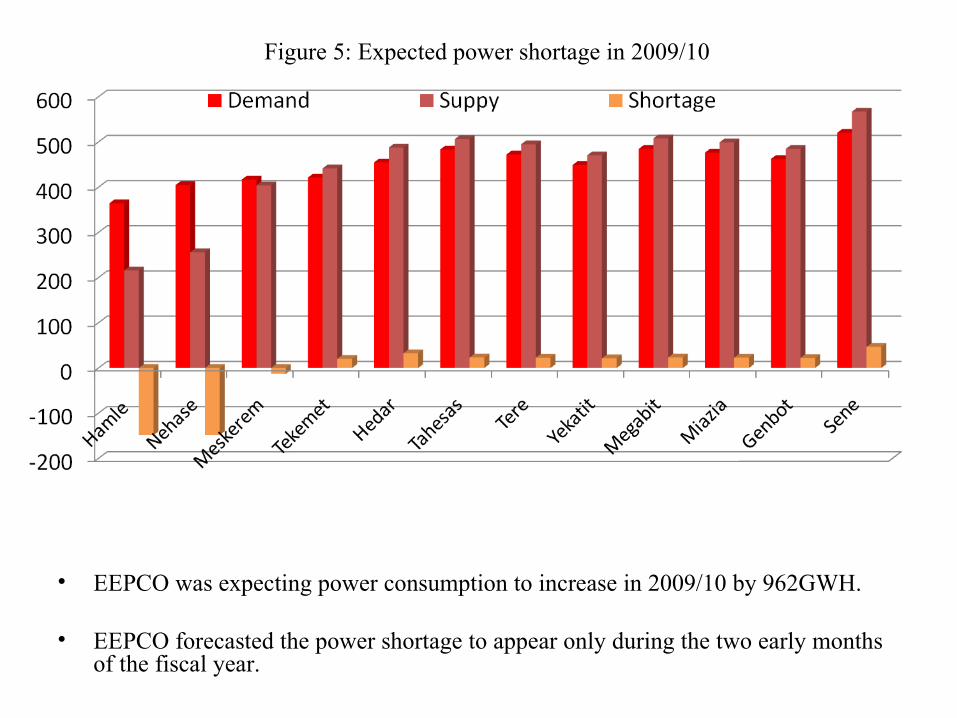
Figure 5: Expected power shortage in 2009/10
• EEPCO was expecting power consumption to increase in 2009/10 by 962GWH.
• EEPCO forecasted the power shortage to appear only during the two early months of the fiscal year.

• But the reality was not good as expected, because
The completion of all dams delay
On January 13 the newly graduated Gilgel Gibe II has
collapsed after very short time in use. Gilge gibe II was
expected to produce the largest electricity output
(1134.87 GWH) in 2009/10.
• Ethiopia falls short of power by that amount until January
13 until May 11, the graduation of Tana Beles.

At the peak of the shortage: Some industries were completely cut off; Some were allowed to work limited hours ; Some industries that are believed to be ‘key’ (export oriented sectors) were
given special privilege in power use.
The policy problem is to find ways of reducing electricity use that impose least cost on the economy in terms of foregone output.
Objective• Quantitatively assess the economic impact of electricity cuts on the
Ethiopian economy.
• Investigate the potential economic impact of differently distributed rationing options aimed at reducing electricity usage.
• Assess the potential impact of the investment on new power generation plants in the next five years.

Electricity Usage in Ethiopia
• Electricity use in Ethiopia can broadly be classified by: 1. Residential – private households, 2. Commercial - service business 3. Industrial.
• Industries are the number one users of electricity in Ethiopia followed by households.
• Electricity usage in the past five years has been steadily increasing in all users.
• Electricity usage by households has increased more than other sectors in the past two years.

• Based on the SAM of Ethiopia (2006): – Agriculture, fetching water & real estate do not use or use very little electricity as
intermediate input.
• All the other sectors use electricity with different levels of intensity in relation to their outputs
Activity
Electricity use (000
birr)
Electricity productivity
Output/Input Activity
Electricity use (000
birr)
Electricity productivity
Output/Input
Grain mill prod. 13,272.4 49.4 Electrical eq. manf. 55.1 1981.4Other food manf. 37,075.9 72.3 Textile manuf. 37043.7 36.5Beverage manuf 17,648.1 103.8 Leather manuf. 11315.9 94.5Sugar manuf. 5,383.2 214.9 Wearing apparel 1425.2 248.2Tobacco manuf. 769.2 280.7 Vehicle manuf 1202.3 342.0Paper prod. Manf. 12,694.9 55.0 Wood manuf. 1926.7 55.9Mineral prod. manf 58,749.0 19.9 Other manuf. 3691.2 425.6Basic metal manf. 12,916.0 154.4 Mining & Quarrying 37876.4 19.3Chemicals manuf. 26,228.7 61.1 Construction 7270.0 2922.2Mach. & Eqi. Manf. 94.7 236.5

The economy-wide impacts of electricity shortage
• Power shortage since 2006/07.– The intensity was severe in late 2008/09 and early 2009/10.
• 1st task: Estimate the quantity of the electricity shortage in a specific period.
• Shortage estimated for 2009/10 based on the actual rationing schedule.
• The rationing schedules for different electricity users at different periods of 2009/10 were aggregated based on users’ electricity consumption.
• Accordingly the average electricity shortage for 2009/10 was estimated at 13%.

Effect of electricity shortage on productivity/output
Direct impact– Loss in production time;– Damages in production due to power interruptions;– Increased cost in input.
Indirect impact– Impact through inter-sectoral linkages
• The impact of electricity shortage on a firm depends on: The significance of electricity input in production process:
share of electricity input from the firm’s output; The firm’s ability to substitute or reduce peak hour electricity use
(substitutability factor); Duration of interruption (intensity of shortage).

IL =
Where IL = Impact level Intel = Value of electricity as an intermediate input Output = Value of Output α = substitutability factor
The percentage decline in output (productivity loss) for an activity is estimated as:
PL = ES * IL
Where PL = Percentage decline in output (productivity loss) ES = Electricity Shortage IL = Impact level

Alternative Rationing Scenarios
1. Rationing that favors export sectors & disfavors selected sectors (GOVRAT)• Rationing similar to the way EEPCO distributed the power shading.
Textile & leather manufacturing exempted; 37.5% power shading in the mining & quarrying sector (crushers…); 31.8% power shading in basic metal manufacturing ; 19.3 % power shading in mineral products and chemical manufacturing
(cement…); 11.2 % power shading in all the remaining activities.
2. Uniform Rationing (UNIRAT)
Ration all economic sectors equally without any favor /disfavor.
Equivalent to 12.9% decline in electricity use in all sectors.

3. Rationing that favors export sectors (EXPRAT)
• Allowing textile and leather industries to get full electricity supply and making all other sectors equally take the extra burden.
• This is equivalent to 13.5% decline in electricity use in all sectors (except textile and leather ).
4. Rationing that favors export sectors and activities of high electricity productivity (PRODRAT).
• Fully exempting textile & leather sectors in from power shading;
• In addition, exempting activities whose output per unit of electricity input is relatively high.
• 15.6 % power shading in activities whose output per unit of electricity input is relatively low. including mining &quarrying, flour manufacturing, chemicals, wood
manufacturing, etc
• Uniform (12.9 % ) power shading in the remaining activities.
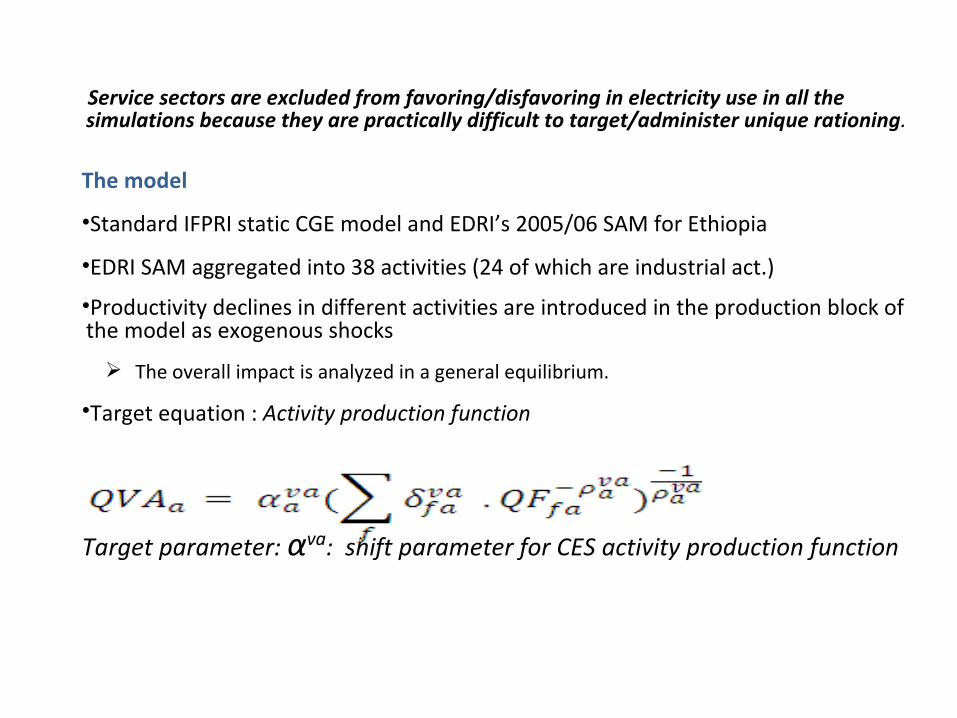
Service sectors are excluded from favoring/disfavoring in electricity use in all the simulations because they are practically difficult to target/administer unique rationing.
The model
•Standard IFPRI static CGE model and EDRI’s 2005/06 SAM for Ethiopia
•EDRI SAM aggregated into 38 activities (24 of which are industrial act.)
•Productivity declines in different activities are introduced in the production block of the model as exogenous shocks
The overall impact is analyzed in a general equilibrium.
•Target equation : Activity production function
Target parameter: αva: shift parameter for CES activity production function

Simulation ResultsEconomy wide impact of electricity shortage
• The estimated impact of the 12.9% power shortage during 2009/10 is around 1.5 percent of GDP.
• Manufacturing and agriculture are the most and least affected sectors respectively.
Real GDP (Bill. Birr) BASEElectricity Shortage % Change
Agriculture 58.79 58.47 -0.5%Industry 14.04 13.33 -5.1%
Manufacturing 5.76 5.29 -8.2%Services 49.39 48.60 -1.6%Total 122.22 120.40 -1.5%

Simulation ResultResults under different rationing scenarios (% Changes)
– Compared to other alternatives, the measure taken by EEPCO (GOVRAT) brought about a significant output loss which is greater than the gains from the export sectors.
• Favoring export sectors (EXPRAT) reduces the GDP loss. Textile and leather industries have positive spill over effects on the overall
economy.
•Favoring the export sector and activities with high electricity productivity (PRODRAT) would have further reduced the negative impact of the electricity shortage in the economy.
BASE GOVRAT UNIRAT EXPRAT PRODRATReal GDP 122.2 -1.52 -1.50 -1.49 -1.46EXPORTS 16.8 -3.18 -3.59 -3.57 -3.42IMPORTS -47.0 -1.13 -1.28 -1.27 -1.22

The effect of Electricity Investment
• The planned investment in electricity generation through 2015 is expected to bring about 7.5 % rise in GDP.
• Investment period=9 years ―> 0.83% average annual growth in GDP.
• Agricultural output decline slightly as a result of an appreciation of the real exchange rate and a decline in agricultural exports. A sizable change in output structure
GDP by sector BASE
Electricity Export (Investment on
Electricity) % ChangeAgriculture 58.79 57.19 -2.7Industry 14.04 24.65 75.6
Electricity 1.12 10.88 871.6Manufacturing 5.76 5.62 -2.4
Services 49.39 49.60 0.4Total 122.22 131.44 7.5
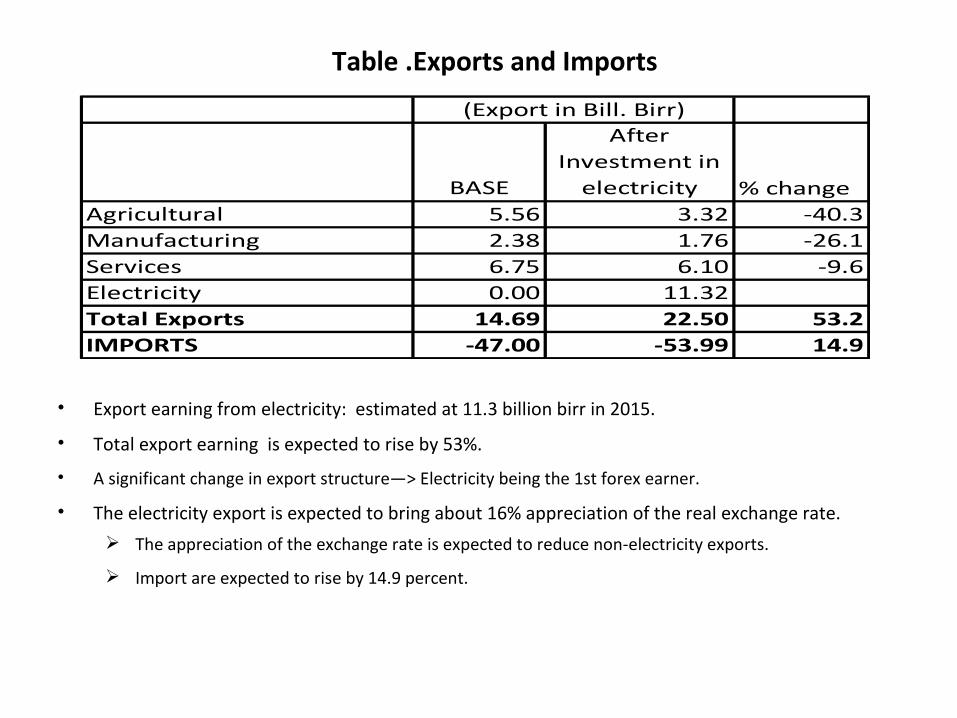
Table .Exports and Imports
• Export earning from electricity: estimated at 11.3 billion birr in 2015.
• Total export earning is expected to rise by 53%.
• A significant change in export structure―> Electricity being the 1st forex earner.
• The electricity export is expected to bring about 16% appreciation of the real exchange rate.
The appreciation of the exchange rate is expected to reduce non-electricity exports.
Import are expected to rise by 14.9 percent.
BASE
After Investment in
electricity % changeAgricultural 5.56 3.32 -40.3Manufacturing 2.38 1.76 -26.1Services 6.75 6.10 -9.6Electricity 0.00 11.32Total Exports 14.69 22.50 53.2IMPORTS -47.00 -53.99 14.9
(Export in Bill. Birr)

Summary & Conclusions• The electricity shortage in 2009/10 has brought a
significant adverse effect on the economy (1.52% loss of real GDP).
• The decision by EEPCO to exempt the export sector from power shading had a positive impact in terms of overall output.
• The overall rationing strategy however was not the most optimum:
It did not take into account electricity productivity in different sectors.
• The investment in electricity would bring a significant change in output structure (agriculture – industry) and a considerable shift in export pattern.