economic review - seafood new zealand
TRANSCRIPT

Economic review of the seafood industry
edition 2 October 2012
Welcome to the second edition of Seafood
New Zealand’s economic review. The review
provides readers with a quarterly update of what’s
happening in the seafood industry balanced with
some general information about the economy.
We hope you find the content useful, interesting
and informative. We welcome your feedback and
suggestions, please email: [email protected]
domestically, the economy continues to recover slowly from the 2008/09 recession. While GdP growth, unemployment and inflation results have been disappointing, there have been some positive developments in the past three months. export commodity prices appear to have stabilised, reflecting to some extent severe drought in the uS and its impact on international grain prices. Recent GdP growth has been stronger than estimated and retail spending data have picked up.
However, challenges for the economic outlook are still evident. Most obviously, the trading partner outlook remains weak. Many euro-area1 economies are in recession and Chinese growth continues to slow. domestically, the high New Zealand dollar continues to undermine export earnings and encourage substitution toward imported goods and services.
THe OuTLOOk FOR key exPORT MARkeTSeconomic growth in New Zealand’s trading partners has slowed over the past year. With the exception of Australia, GdP growth in the majority of trading partner economies is currently below average rates.
euro-area: while developments over the past three months have been interpreted by markets as relatively positive, it is by no means clear that the risk of significant economic deterioration has been eliminated. The Reserve Bank continues to expect euro-area activity to contract over the coming year.
uS: growth in the uS continues to be modest. However, its near-term outlook is subject to considerable uncertainty and downside risk, related to the substantial fiscal tightening that is currently legislated to occur at the start of next year.
China: economic data continue to soften, with GdP growth falling further. Steel and iron ore prices have hit two- and three-year lows respectively, and the Shanghai Composite Index fell to a three-year low as investors questioned the outlook for the Chinese economy.
exCHANGe RATeSThe overall improvement in domestic market sentiment has put upward pressure on the New Zealand dollar. On a trade weighted index (TWI) basis, the New Zealand dollar has appreciated by about two percent – ranging from three percent against the uS dollar and euro to a modest depreciation against the Australian dollar.
This combined with poor global growth figures, makes it a difficult export environment.
GLOBAL TRAde – SeAFOOd BuCkS THe TReNdThe overall slow-down in the world economy is clearly impacting on trade. In particular, the consequences of lower growth rates in the Chinese economy and reduced activity in the processing sector are slowing China’s demand for a number of imports, including fish. This has resulted in lower prices for some species.
While the World Trade Organization cut its forecast for world trade growth from 3.7% to 2.5% in 2012 and from 5.6% to 4.5% in 2013, global fish trade is still expected to end higher this year than in 2011 (although our estimates have been adjusted downwards). Currently (as at September), the estimate for world exports is uSd130 billion, up 3% from 2011.
Sources: Reserve Bank of New Zealand, Monetary Policy Statement September 2012. Globefish Issue 09/2012.
1. The euro-area is defined as the area comprising those european union Member States in which the euro has been adopted as the single currency.
THe eCONOMy
IN THIS edITION• economic conditions continue to look grim globally.
• However, the value of seafood exports continues to
grow. exports in the first half of 2012 were worth six
percent more than the same time last year.
• Seafood volumes are down slightly on the same
time last year.
• China continues to be our leading export partner but
export sales to other Asian countries are growing faster.
NZd/uSd exchange rate – last 12 months0.85
0.83
0.81
0.79
0.77
0.75
0.73
10/1
0/1
1
09
/11/
11
09
/12/
11
08
/01/
12
07/
02/
12
08
/03/
12
07/
04
/12
07/
05/
12
06
/06
/12
06
/07/
12
05/
08
/12
04
/09
/12
04
/10
/12

exPORT TONNeSTotal seafood exports for the first half of 2012 totalled NZ$782m with more than 152,000 tonnes exported.
Finfish species accounted for 108,000 tonnes of exports with a value of NZ$458m. Shellfish was the next largest exporter of more than 40,000 tonnes exported with a value of NZ$200m.
exPORT NZ$FOB* All figures in this section are based on export data provided by Statistics New Zealand and analysed by the Seafood New Zealand for the first six months of 2012 (H1). Please note that the data for April, May and June 2012 are provisional.
Compared with the first half of 2011, export tonnes dropped by just under five percent. despite the drop in volume, export value was up slightly – from NZ$774m to NZ$782m. This represents an increase in value per tonne of six percent.
The value of rock lobster grew by 12 percent and finfish by six percent.
export value (H1 2012) = NZ$782 million export volume (H1 2012) = 152,764 tonnes
Source: export data, Statistics New Zealand, Seafood New Zealand.
* FOB = Free on board. The value of export goods, including raw material, processing, packaging, storage and transportation up to the point prior to loading on board ship.
SHeLLFISH
ROCk LOBSTeR
OTHeR CRuSTACeANS
NZ$
FIGURES QUOTED ARE IN
FINFISH
$200m
$20m
$104m
$458m
SHeLLFISH
OTHeR CRuSTACeA
ROCk LOBSTeR FINFISH
TONNeS
FIGURES QUOTED ARE IN
1,150
1,133
108,660
41,822
exPORT STATISTICS
exPORT NZ$ FOB*
$m
SHeLL FISH
FINFISH ROCk LOBSTeR
OTHeR CRuSTACeANS
351
30
184
859
357
31
229
876
396
27
211
892
458
10420
200
300
600
900
1200
1500
1800
348
180
807
21
2008 2009 2010 2011 H1 2012
$1,356 $1,424 $1,493 $1,526 $782
exPORT TONNeS
297 287 300 302 153
00
0’s
350
300
250
200
150
100
50
0
SHeLL FISH
FINFISH ROCk LOBSTeR
OTHeR CRuSTACeANS
2008 2009 2010 2011 H1 2012
83
210
13
76
208
1
2
78
230
23
69
227
13
109
42
11

exPORTS By SPeCIeSIn line with the first quarter’s report, sales for mussels have dropped slightly, while rock lobster has grown.
Tuna and jack mackerel both grew strongly compared with the same period last year, both up 22 percent.
Barracouta overtook snapper and ling to now be the 8th highest export earner.
TOP 10 exPORT VALueS (NZ$) H1 2011 H1 2012 % Change
Mussels 119m 108m -9
Rock lobster 93m 103m 11
Hoki 78m 81m 4
Tuna 49m 60m 22
Jack mackerel 27m 33m 22
Squid 82m 61m -26
Salmon 26m 24m -8
Barracouta 16m 19m 19
Snapper 18m 18m - -
Ling 17m 16m -6
exPORTS OF MAIN COMMOdITIeSexports of fish, crustaceans and molluscs totalled $706m for the first six months of 2012, a small increase of one percent compared with the same period in 2011. In comparison, total exports of all commodity types fell by just under six percent.
The seafood industry also contributed NZ$76m in processed products such as capsules, powders, fish cakes and fingers.
NZ exPORTS OF MAIN COMMOdITIeS (NZ$) H1 2011 H1 2012 % Change
Milk powder, butter & cheese 6,313m 6,045m -4
Meat & edible offal 3,511m 3,104m -12
Logs, wood &wood articles 1,661m 1,526m -8
Mechanical machinery & equipment 827m 887m 7
Crude oil 1,123m 884m -21
Fruit 938m 930m -1
Fish, crustaceans and molluscs 699m 706m 1
exPORTS By COuNTRyThere remains a distinct top five export countries: Australia, China, Hong kong, Japan and the uS. There was a small decrease in exports to China while the most noticeable growth was in exports to other Asian countries: Hong kong (up 61%), South korea (28%), Japan (up 19%) and Thailand (up 14%).
Expanding our horizons: Not only have exports grown in the past decade, but the number of countries we export to has also grown significantly – particularly between 2001 and 2006. In 2001, we exported to 78 countries, in 2006, 106 countries and in 2011, 110 countries.
TOP 10 exPORT VALueS (NZ$) H1 2011 H1 2012 % Change
1 China 151m 138m -9
2 Australia 141m 137m -3
3 Hong kong 51m 82m 61
4 Japan 69m 82m 19
5 united States 94m 79m -16
6 Republic of korea 25m 32m 28
7 Spain 31m 19m -39
8 Thailand 14m 16m 14
9 Mauritius 8m 15m 88
10 France 16m 14m -13
Source: Overseas merchandise trade, June 2012, Statistics NZ.Source: export data, Statistics NZ.
export volume (H1 2012) = 152,764 tonnes
exports to top 5 countries – H1 2012
Jan Feb Mar Apr May Jun
NZ
$m
150
100
50
125
75
25
0
AustraliaChina Hong kong uSAJapan
1
2
5
3
47
6
9
8
10

INTeRNATIONAL STATISTICS SPOTLIGHT ON CHINA
FAO RePORTS ON WORLd FISHeRIeS ANd AQuACuLTuRe• In July this year, the FAO released its 2012 edition of The
State of World Fisheries and Aquaculture. The full report can be downloaded at www.fao.org/fishery/en
key facts from the report include:
Capture fisheries and aquaculture supplied the world with about 148 million tonnes of fish in 2010, of which 128 million tonnes of fish was utilised as food for humans
Preliminary data for 2011 indicate increased production of 154 million tonnes, of which 131 million was destined for food
Today, fish provides more than 4.3 billion people with about 15 percent of their intake of animal protein.
• The FAO did recognise that “good progress is being made” in reducing exploitation rates and restoring overexploited fish stocks and marine ecosystems through effective management actions in some areas, specifically:
In the uS, 67 percent of all stocks are now being sustainably harvested and only 17 percent are over exploited
In New Zealand, 69 percent of stocks are above management targets, reflecting mandatory rebuilding plans for all fisheries still below target thresholds
Australia reports overfishing for only 12 percent of stocks
The Newfoundland-Labrador Shelf, the Northeast united States Shelf, the Southern Australia Shelf, and California Current ecosystems have shown substantial declines in fishing pressure such that they are now at or below the modelled exploitation rate.
• Growth in the world’s second-largest economy has tumbled to its lowest level since the 2008 global financial crisis due to weak export demand and Chinese government efforts to cool overheating and inflation. Commodity imports into China declined ten percent by volume over a year earlier, the worst result since 2009.
• In 2011, China became New Zealand’s leading seafood export partner, with sales of NZ$300m. This equates to 20 percent of all New Zealand seafood exports going directly to China.
• Seafood exports to China in 2012 are down slightly for the first six months of the year – down nine percent compared with the same time in 2011. This may be a reflection of tougher economic conditions in the country becoming more evident.
• Two thirds of exports to China are for rock lobster, hoki and squid. The remaining third of exports comprises 57 other species or fish types (eg. Fish meal).
TRAde ISSueS AFFeCTING SeAFOOd exPORTS TO eu• In the most recent export statistics, we have seen exports
to the european union drop significantly from NZ$114m in the first half of 2011 to only NZ$79m in the first half of 2012 – a drop of 31 percent.
• While most of the drop can be attributed to the state of the european economy at present, the decline can also be attributed to technical difficulties providing Catch Certificates for seafood caught on foreign chartered fishing vessels, which has stopped some exports getting into european union countries.
Source: Infofish trade news, 1 August 2012, FAO, export Statistics.
export species to China – 2011
ROCk LOBSTeR
HOkISOuTHeRN
BLue WHITING
BARRACOuTA
JACk MACkeReL
OTHeR
$122m
$44m
SQuId
$35m$21m
$11m
$56m
$11m
NZ$
FIGURES QUOTED ARE IN
• China has been responsible for most of the increase in world per capita fish consumption, owing to the substantial increase in its fish production, particularly from aquaculture. China’s share in fish production grew from seven percent in 1961 to 35 percent in 2010.
Source: FAO, exports Statistics.
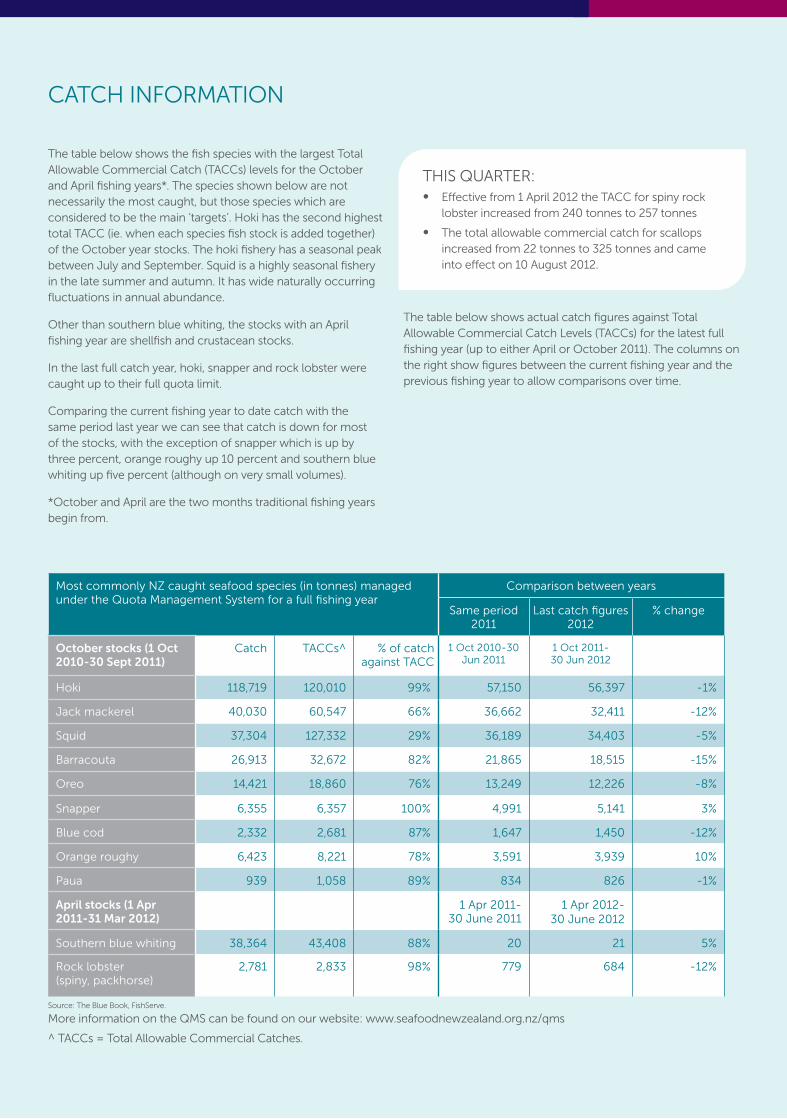
CATCH INFORMATION
The table below shows the fish species with the largest Total Allowable Commercial Catch (TACCs) levels for the October and April fishing years*. The species shown below are not necessarily the most caught, but those species which are considered to be the main ‘targets’. Hoki has the second highest total TACC (ie. when each species fish stock is added together) of the October year stocks. The hoki fishery has a seasonal peak between July and September. Squid is a highly seasonal fishery in the late summer and autumn. It has wide naturally occurring fluctuations in annual abundance.
Other than southern blue whiting, the stocks with an April fishing year are shellfish and crustacean stocks.
In the last full catch year, hoki, snapper and rock lobster were caught up to their full quota limit.
Comparing the current fishing year to date catch with the same period last year we can see that catch is down for most of the stocks, with the exception of snapper which is up by three percent, orange roughy up 10 percent and southern blue whiting up five percent (although on very small volumes).
*October and April are the two months traditional fishing years begin from.
More information on the QMS can be found on our website: www.seafoodnewzealand.org.nz/qms
^ TACCs = Total Allowable Commercial Catches.
THIS QuARTeR:• effective from 1 April 2012 the TACC for spiny rock
lobster increased from 240 tonnes to 257 tonnes
• The total allowable commercial catch for scallops increased from 22 tonnes to 325 tonnes and came into effect on 10 August 2012.
The table below shows actual catch figures against Total Allowable Commercial Catch Levels (TACCs) for the latest full fishing year (up to either April or October 2011). The columns on the right show figures between the current fishing year and the previous fishing year to allow comparisons over time.
Most commonly NZ caught seafood species (in tonnes) managed under the Quota Management System for a full fishing year
Comparison between years
Same period 2011
Last catch figures 2012
% change
October stocks (1 Oct 2010-30 Sept 2011)
Catch TACCs^ % of catch against TACC
1 Oct 2010-30 Jun 2011
1 Oct 2011- 30 Jun 2012
Hoki 118,719 120,010 99% 57,150 56,397 -1%
Jack mackerel 40,030 60,547 66% 36,662 32,411 -12%
Squid 37,304 127,332 29% 36,189 34,403 -5%
Barracouta 26,913 32,672 82% 21,865 18,515 -15%
Oreo 14,421 18,860 76% 13,249 12,226 -8%
Snapper 6,355 6,357 100% 4,991 5,141 3%
Blue cod 2,332 2,681 87% 1,647 1,450 -12%
Orange roughy 6,423 8,221 78% 3,591 3,939 10%
Paua 939 1,058 89% 834 826 -1%
April stocks (1 Apr 2011-31 Mar 2012)
1 Apr 2011-30 June 2011
1 Apr 2012- 30 June 2012
Southern blue whiting 38,364 43,408 88% 20 21 5%
Rock lobster (spiny, packhorse)
2,781 2,833 98% 779 684 -12%
Source: The Blue Book, FishServe.

The cornerstone of New Zealand’s fisheries management is the quota management system (QMS) which was introduced in 1986. under the QMS an annual catch entitlement is set for each fish stock. By controlling the amount of fish that can be taken from each stock, the QMS is the foundation for ensuring the sustainability of New Zealand fisheries.
More than 90 percent of New Zealand’s exclusive economic Zone (eeZ) has never been bottom trawled and 30 percent of the eeZ is completely closed to bottom trawling – one of the largest bottom trawl closures within an eeZ in the world.
ensuring that impacts on the marine environment caused by fishing activity are kept within acceptable levels is a priority for the New Zealand seafood industry and the Ministry for Primary Industries (MPI). Regulations and industry agreements reduce the impact of fishing on protected species such as the New Zealand sea lion, fur seals and seabirds. Restrictions are designed to protect Hector’s and Maui’s dolphins, the world’s smallest dolphins.
Source: MPI, Seafood New Zealand.
THe SeAFOOd INduSTRy – AN OVeRVIeW
NeW ZeALANd’S exCLuSIVe eCONOMIC ZONe
4.4 million km2
AREA - Exclusive Economic Zone (EEZ) and territorial sea
631,787 tonnes Total allowable commercial catch (as at December 2011)
600,000 tonnesTotal seafood harvest (including aquaculture)
25,000 FTEsEstimated direct and indirect employment
1,412Number of registered fishing vessels
NZ$1.53 billionExports
636Number of stocks in the QMS
408,704 tonnesTotal landed catch (as at December 2011)
15,134kmLength – New Zealand coastline