economic profile for isu extension region 1 · overview of recent trends population employment 90%...
TRANSCRIPT
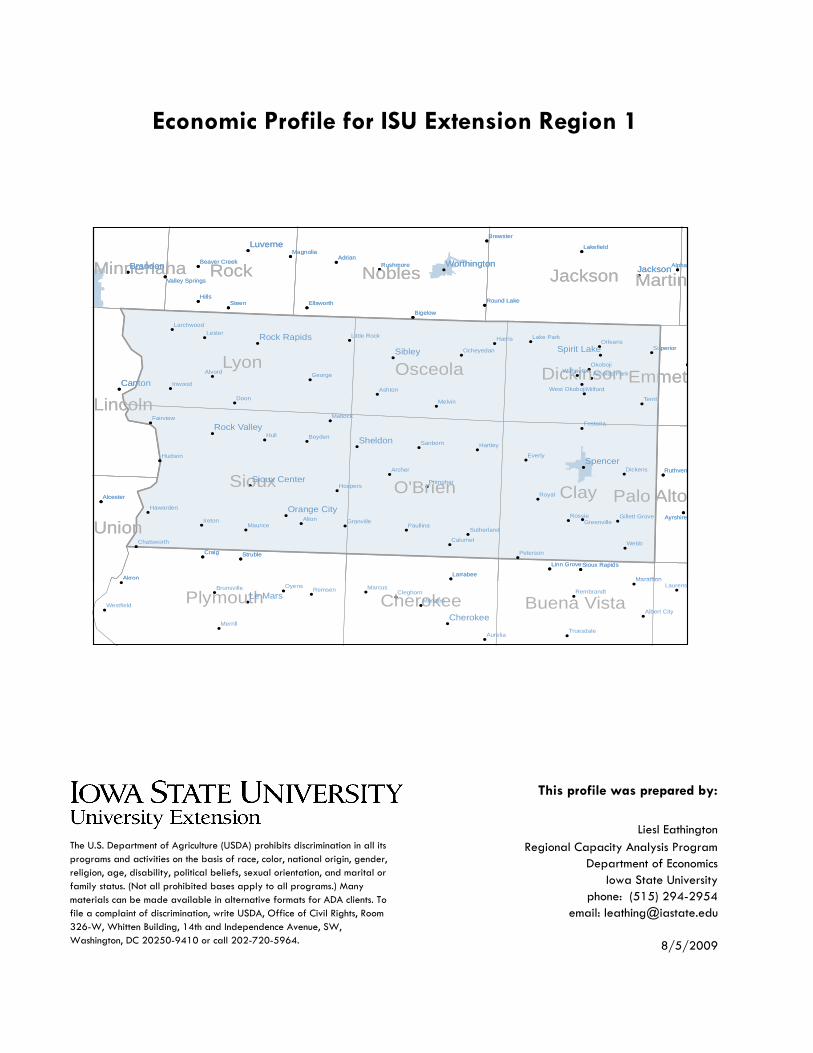
Economic Profile for ISU Extension Region 1
!!
!
!
!
!
!
!
!
!
!
!
!
!
!
!
!
!
!
!
!
!
!
!
!
!
!
!
!
!
!
!
!
!
!
!
!!
!
!
!
!!
!!
!
!
!
!
!
!
!
!!
!
!
!
!
!
!
!
!
!
!
!
!
!
!!
!
!
!
!
!
!
!
!
!
!
!
!
! !
Sioux Clay
Lyon
O'Brien
Nobles JacksonRock
Osceola Dickinson
Lincoln
Union
Minnehaha
Palo Alto
Emmet
Martin
Webb
Hull
Doon
Alpha
Royal
Craig
Steen
Alton
Hills
Akron
Terril
Rossie
Melvin
Harris
Everly
Ireton
George
Boyden
Ashton
Archer
Alvord
Hudson
Lester
Inwood
Adrian
Ruthven
Orleans
Okoboji
Milford
Hartley
Dickens
Calumet
Struble
Bigelow
Sanborn
Maurice
Matlock
Hospers
Brewster
Ayrshire
Wahpeton
Superior
Peterson
Fostoria
MarathonLarrabee
Primghar
Paullina
Fairview
Alcester
Hawarden
Rushmore
MagnoliaLakefield
Ocheyedan
Lake Park
Ellsworth
Granville
Larchwood
Round Lake
SutherlandGreenville
Linn Grove
Chatsworth
Little Rock
West Okoboji
Sioux Rapids
Arnolds Park
Beaver Creek
Gillett Grove
Valley Springs
Sibley
Canton
Jackson
Spencer
Sheldon
Brandon
Luverne
Worthington
Spirit Lake
Rock Valley
Rock Rapids
Orange City
Sioux Center
This profile was prepared by:
The U.S. Department of Agriculture (USDA) prohibits discrimination in all its programs and activities on the basis of race, color, national origin, gender, religion, age, disability, political beliefs, sexual orientation, and marital or family status. (Not all prohibited bases apply to all programs.) Many materials can be made available in alternative formats for ADA clients. To file a complaint of discrimination, write USDA, Office of Civil Rights, Room 326-W, Whitten Building, 14th and Independence Avenue, SW, Washington, DC 20250-9410 or call 202-720-5964.
Liesl EathingtonRegional Capacity Analysis Program
Department of EconomicsIowa State University
phone: (515) 294-2954email: [email protected]
8/5/2009
!!
!
!
!
!
!
!
!
!
!
!
!
!
!
!
!
!
!
!
!
!
!
!
!
!
!
!
!
!
!
!
!
!
!
!
!
!
!!
!
!
!
!!
!
!
!
!
!
!
!
!!
!
!
!
!
!
!
!
!
!
!
!
!
!
!
!!
!
!
!
!
!
!
!
!
!
!
!
!
!
!!
!
!
!
!
!
!
!
!
!
!
!
!
!
! !
Sioux Clay
Lyon
O'Brien
Nobles
Plymouth
JacksonRock
Osceola Dickinson
Cherokee Buena Vista
Lincoln
Union
Minnehaha
Palo Alto
Emmet
Martin
Webb
Hull
Doon
Alpha
Royal
Oyens
Craig
Steen
Alton
Hills
Akron
Terril
Rossie
Melvin
Harris
Everly
Remsen Marcus
Ireton
George
Boyden
Ashton
Archer
Alvord
Hudson
Lester
Inwood
Adrian
Laurens
Ruthven
Orleans
Okoboji
Milford
Hartley
Dickens
Calumet
Aurelia
Struble
Merrill
Meriden
Bigelow
Sanborn
Maurice
Matlock
Hospers
Brewster
Ayrshire
Wahpeton
Superior
Peterson
Fostoria
MarathonLarrabee
Cleghorn
Primghar
Paullina
Fairview
Alcester
Hawarden
Rushmore
MagnoliaLakefield
Ocheyedan
Lake Park
Truesdale
Rembrandt
Ellsworth
Granville
Larchwood
Westfield
Round Lake
SutherlandGreenville
Linn Grove
Brunsville
Chatsworth
Albert City
Little Rock
West Okoboji
Sioux Rapids
Arnolds Park
Beaver Creek
Gillett Grove
Valley Springs
Sibley
Canton
Jackson
Spencer
Le Mars
Sheldon
Brandon
Luverne
Cherokee
Worthington
Spirit Lake
Rock Valley
Rock Rapids
Orange City
Sioux Center
Urbanization Level
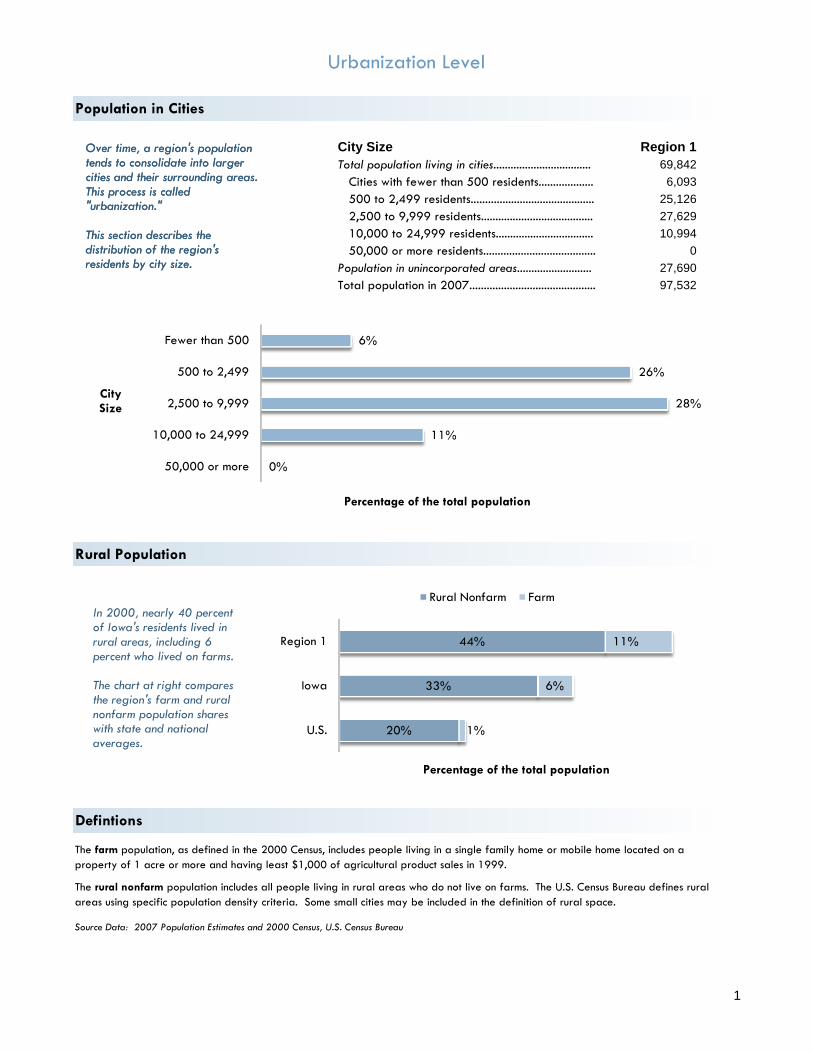
City Size Region 1Total population living in cities.................................. 69,842
Cities with fewer than 500 residents................... 6,093500 to 2,499 residents........................................... 25,1262,500 to 9,999 residents....................................... 27,62910,000 to 24,999 residents.................................. 10,99450,000 or more residents....................................... 0
Population in unincorporated areas.......................... 27,690Total population in 2007............................................ 97,532
Population in Cities
Rural Population
Rural Nonfarm Farm
6%
26%
28%
11%
0%
Fewer than 500
500 to 2,499
2,500 to 9,999
10,000 to 24,999
50,000 or more
CitySize
Percentage of the total population
Over time, a region's populationtends to consolidate into larger cities and their surrounding areas. This process is called "urbanization."
This section describes the distribution of the region's residents by city size.
Source Data: 2007 Population Estimates and 2000 Census, U.S. Census Bureau
The farm population, as defined in the 2000 Census, includes people living in a single family home or mobile home located on a property of 1 acre or more and having least $1,000 of agricultural product sales in 1999.
The rural nonfarm population includes all people living in rural areas who do not live on farms. The U.S. Census Bureau defines rural areas using specific population density criteria. Some small cities may be included in the definition of rural space.
Defintions
In 2000, nearly 40 percent of Iowa's residents lived in rural areas, including 6 percent who lived on farms.
The chart at right compares the region's farm and rural nonfarm population shares with state and national averages.
44%
33%
20%
11%
6%
1%
Region 1
Iowa
U.S.
Percentage of the total population
Rural Nonfarm Farm
6%
26%
28%
11%
0%
Fewer than 500
500 to 2,499
2,500 to 9,999
10,000 to 24,999
50,000 or more
CitySize
Percentage of the total population
Over time, a region's populationtends to consolidate into larger cities and their surrounding areas. This process is called "urbanization."
This section describes the distribution of the region's residents by city size.
1
Overview of Recent Trends
Population
Employment
90%
95%
100%
105%
110%
115%
120%
125%
%of
1990population
Region 1
Iowa
U.S.
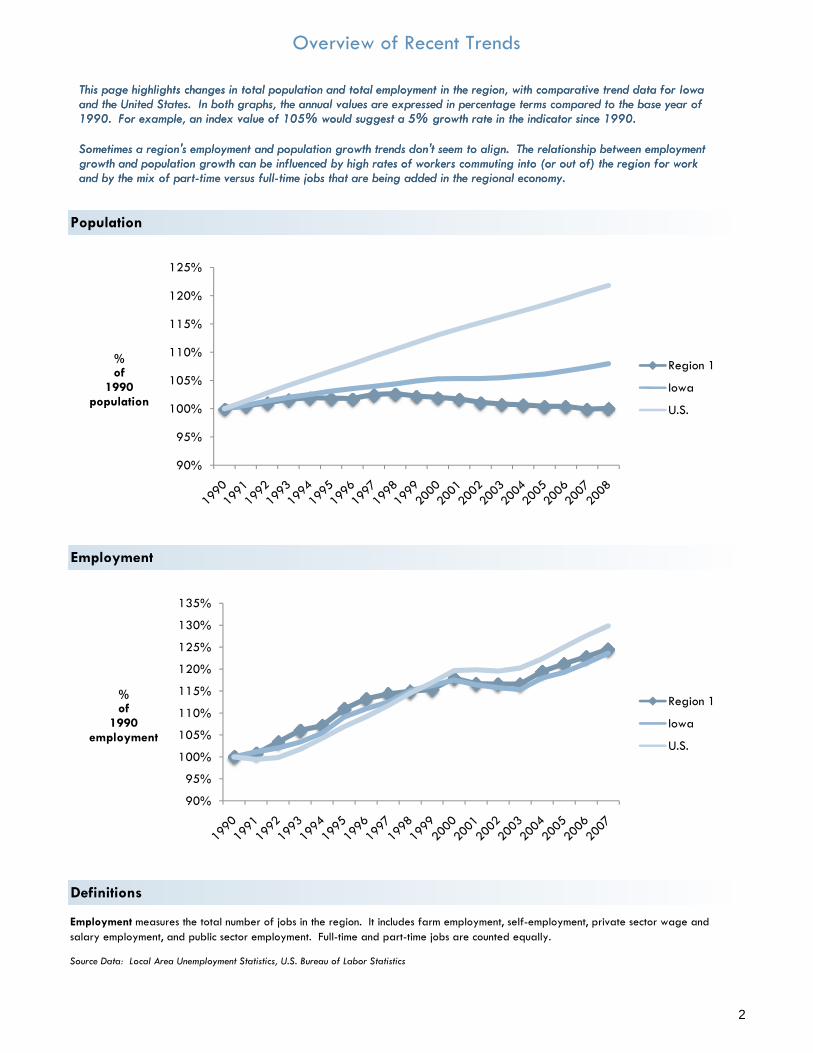
This page highlights changes in total population and total employment in the region, with comparative trend data for Iowa and the United States. In both graphs, the annual values are expressed in percentage terms compared to the base year of 1990. For example, an index value of 105% would suggest a 5% growth rate in the indicator since 1990.
Sometimes a region's employment and population growth trends don't seem to align. The relationship between employment growth and population growth can be influenced by high rates of workers commuting into (or out of) the region for work and by the mix of part-time versus full-time jobs that are being added in the regional economy.
Source Data: Local Area Unemployment Statistics, U.S. Bureau of Labor Statistics
Employment measures the total number of jobs in the region. It includes farm employment, self-employment, private sector wage and salary employment, and public sector employment. Full-time and part-time jobs are counted equally.
Definitions
p y
90%
95%
100%
105%
110%
115%
120%
125%
%of
1990population
Region 1
Iowa
U.S.
This page highlights changes in total population and total employment in the region, with comparative trend data for Iowa and the United States. In both graphs, the annual values are expressed in percentage terms compared to the base year of 1990. For example, an index value of 105% would suggest a 5% growth rate in the indicator since 1990.
Sometimes a region's employment and population growth trends don't seem to align. The relationship between employment growth and population growth can be influenced by high rates of workers commuting into (or out of) the region for work and by the mix of part-time versus full-time jobs that are being added in the regional economy.
90%
95%
100%
105%
110%
115%
120%
125%
130%
135%
%of
1990employment
Region 1
Iowa
U.S.
2

Regional Industrial Summary, 2007
Region 1Total employment in number of jobs.......................................................... 1 70,338
Labor income in $billions....................................................................... 2.35 Other value added in $ billions........................................................... 1.67
Total value added (gross regional product) in $ billions................... 2 4.02 Value of purchased commodities and services in $ billions............... 3 6.00
Total industrial output (sales) in $ billions.................................................. 4 10.02
Key Measures of Industrial Activity
85,327 73,513 66,348
33,368 38,399 50,138
23,775 21,735
27,912
$perjob
Other Value Added
Labor Income
Purchased commodities and services
Standardizing these measures on a per-job basis lets us compare industrial activity levels across different regions. The figure below illustrates the major components of industrial output in average values per job in the region, the state, and the nation.
The size of the region's economy can bemeasured in terms of its jobs, industrial output, or the value added components of industrial output.
Defintions
1) Total employment measures the number of full-time and part-time jobs in the region. All jobs are counted equally, so people who hold more than one job are counted twice. This measure does not include the jobs of residents who commute to a workplace outside of the region. It does include the jobs of non-residents who commute into the region for work.
4) Total industrial output is the dollar value of sales by all firms and industries in the region. Total output is equivalent to the dollar value of commodity and service inputs purchased by firms in the region, plus the value added by these firms during the production process.
3) Purchased commodities and services include the value of all production inputs that are purchased from local suppliers or imported from outside the region.
2) Value added is also referred to as "gross regional product." Value added represents the contribution of the region's labor and capital to production. This is the preferred measure of industrial activity. Total value added has two components: labor income, which includes employee compensation plus proprietors' income; and other value added, which consists of other property income and indirect business taxes paid to governments.
Source Data: IMPLAN Regional Input-Output Models compiled at Iowa State University
85,327 73,513 66,348
33,368 38,399 50,138
23,775 21,735
27,912
Region 1 Iowa U.S.
$perjob
Other Value Added
Labor Income
Purchased commodities and services
Standardizing these measures on a per-job basis lets us compare industrial activity levels across different regions. The figure below illustrates the major components of industrial output in average values per job in the region, the state, and the nation.
The size of the region's economy can bemeasured in terms of its jobs, industrial output, or the value added components of industrial output.
3

Regional Industrial Summary, continued
State of United
Gross Regional Product by Industry
Agriculture and Related
19%Construction
4%
Manufacturing25%
Trade13%
Transportation and Related
6%
F.I.R.E.5%
Professional Services3%
Education and Health Services
5%
Other Services11%
Public Administration9%
This section describes the percentage of the
gross regional product, or total
value added, that is contributed by each
of the region's major industrial sectors.
Region 1 Iowa States
Percentage of Gross Regional Product (Total Value Added)..................... 100.0 100.0 100.0 Agriculture, Forestry, Fishing, Hunting, and Mining.................................. 18.9 6.6 3.1 Construction...................................................................................................... 4.3 4.9 5.0 Manufacturing................................................................................................. 24.5 19.0 11.4 Wholesale and Retail Trade........................................................................ 12.7 12.6 12.0 Transportation, Information, Warehousing, and Utilities........................ 6.3 9.5 10.1 Finance, Insurance, and Real Estate (F.I.R.E.)............................................. 4.7 10.9 14.8 Professional, Scientific, and Technical Services........................................ 3.1 3.5 7.3 Education, Health Care, and Social Assistance........................................ 5.5 7.4 7.7 Other Services................................................................................................. 11.3 14.0 16.3 Public Administration...................................................................................... 8.7 11.5 12.2
Gross regional product is a term that is analogous to "value added." Value added represents the contribution of the region's labor and capital inputs to total industrial production. This is the preferred measure of regional industrial activity.
Source Data: IMPLAN Regional Input-Output Models compiled at Iowa State University
Defintions
4

Nonfarm Jobs and Firms
number %All Private, Nonfarm Businesses.................................................................. 11,389 100.0
Non-employer firms.................................................................................. 1 7,678 67.4Employer establishments.......................................................................... 2 3,711 32.6
Fewer than 10 workers........................................................................ 2,814 24.710 to 49 workers................................................................................... 768 6.750 to 500 workers................................................................................ 122 1.1500 or more workers............................................................................ 7 0.1
number % number %All Private, Nonfarm Businesses.................................................................. 11,389 100.0 62,891 100.0
Agriculture Support, Forestry, Fishing, Hunting, and Mining............. 243 2.1 8,287 13.2Construction................................................................................................. 1,674 14.7 4,101 6.5Manufacturing............................................................................................ 333 2.9 11,823 18.8Wholesale and Retail Trade................................................................... 2,006 17.6 11,195 17.8Transportation, Information, Warehousing, and Utilities................... 930 8.2 3,872 6.2Finance, Insurance, and Real Estate (F.I.R.E.)........................................ 1,390 12.2 3,387 5.4Professional, Scientific, and Technical Services................................... 764 6.7 1,853 2.9Education, Health Care, and Social Assistance................................... 1,108 9.7 7,066 11.2Other Services............................................................................................ 2,941 25.8 11,307 18.0
Distribution of Firms and Jobs in Region 1
By Employment Size
Region 1 Average Earnings Per Job By Major Sector
By Sector Jobs (3)Firms
Firms
5
Source Data: County Business Patterns and Nonemployer Statistics, U.S. Census Bureau; IMPLAN Regional Input-Output Models compiled at Iowa State University
3) Jobs measures the number of positions, not employed persons. Full-time and part-time jobs are counted equally.2) Employer establishments are the physical locations of businesses with wage and salary workers on payroll.1) Non-employer firms are sole proprietors and partnerships with no paid employees other than the principals.
Defintions
4) Earnings include wages and salaries, all employer-paid benefits and payroll taxes, and self-employment income.
21,253
35,050
59,201
27,665
38,634
29,440
43,730
26,836
17,100
Agriculture Support and Related
Construction
Manufacturing
Trade
Transportation and Related
F.I.R.E.
Professional Services
Education and Health Services
Other Services
$Earningsper job
(4)
5
Farms
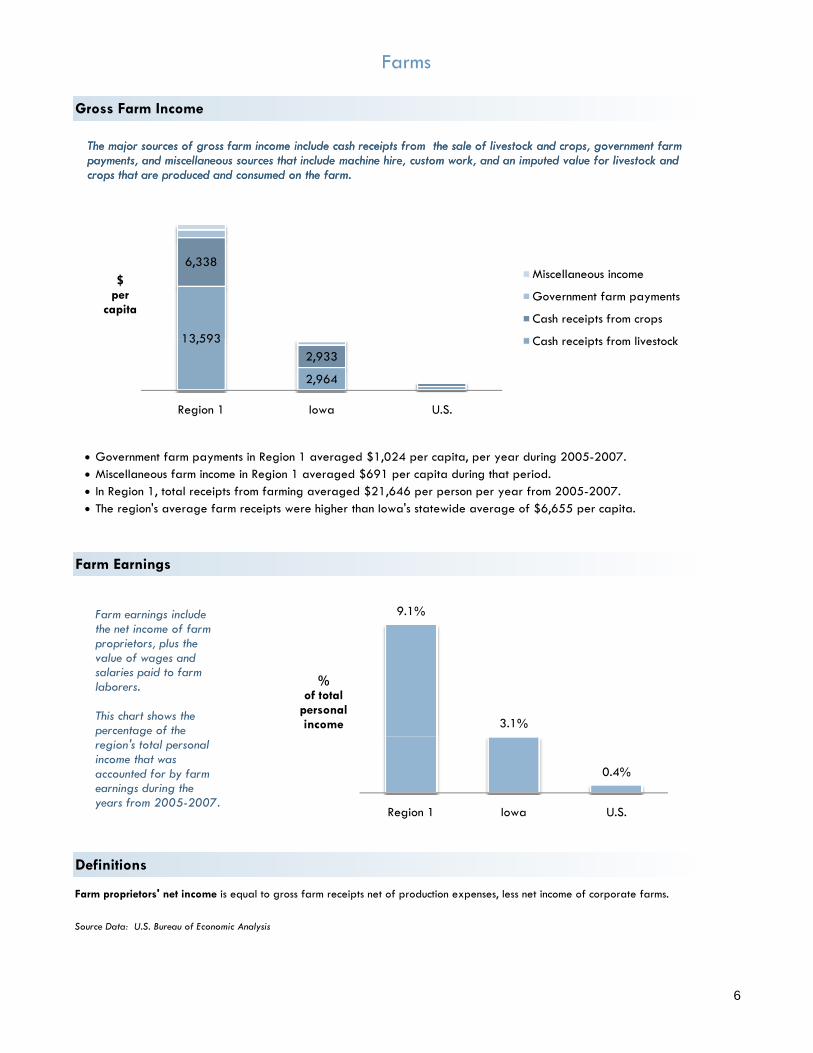
• Government farm payments in Region 1 averaged $1,024 per capita, per year during 2005-2007.• Miscellaneous farm income in Region 1 averaged $691 per capita during that period.• In Region 1, total receipts from farming averaged $21,646 per person per year from 2005-2007.• The region's average farm receipts were higher than Iowa's statewide average of $6,655 per capita.
Gross Farm Income
Farm Earnings
13,593
2,964
6,338
2,933
Region 1 Iowa U.S.
$per
capita
Miscellaneous income
Government farm payments
Cash receipts from crops
Cash receipts from livestock
The major sources of gross farm income include cash receipts from the sale of livestock and crops, government farm payments, and miscellaneous sources that include machine hire, custom work, and an imputed value for livestock and crops that are produced and consumed on the farm.
Source Data: U.S. Bureau of Economic Analysis
Farm proprietors' net income is equal to gross farm receipts net of production expenses, less net income of corporate farms.
Definitions
13,593
2,964
6,338
2,933
Region 1 Iowa U.S.
$per
capita
Miscellaneous income
Government farm payments
Cash receipts from crops
Cash receipts from livestock
The major sources of gross farm income include cash receipts from the sale of livestock and crops, government farm payments, and miscellaneous sources that include machine hire, custom work, and an imputed value for livestock and crops that are produced and consumed on the farm.
9.1%
3.1%
0.4%
Region 1 Iowa U.S.
%of total
personalincome
Farm earnings include the net income of farm proprietors, plus the value of wages and salaries paid to farm laborers.
This chart shows the percentage of the region's total personal income that was accounted for by farm earnings during the years from 2005-2007.
6
Farms, continued
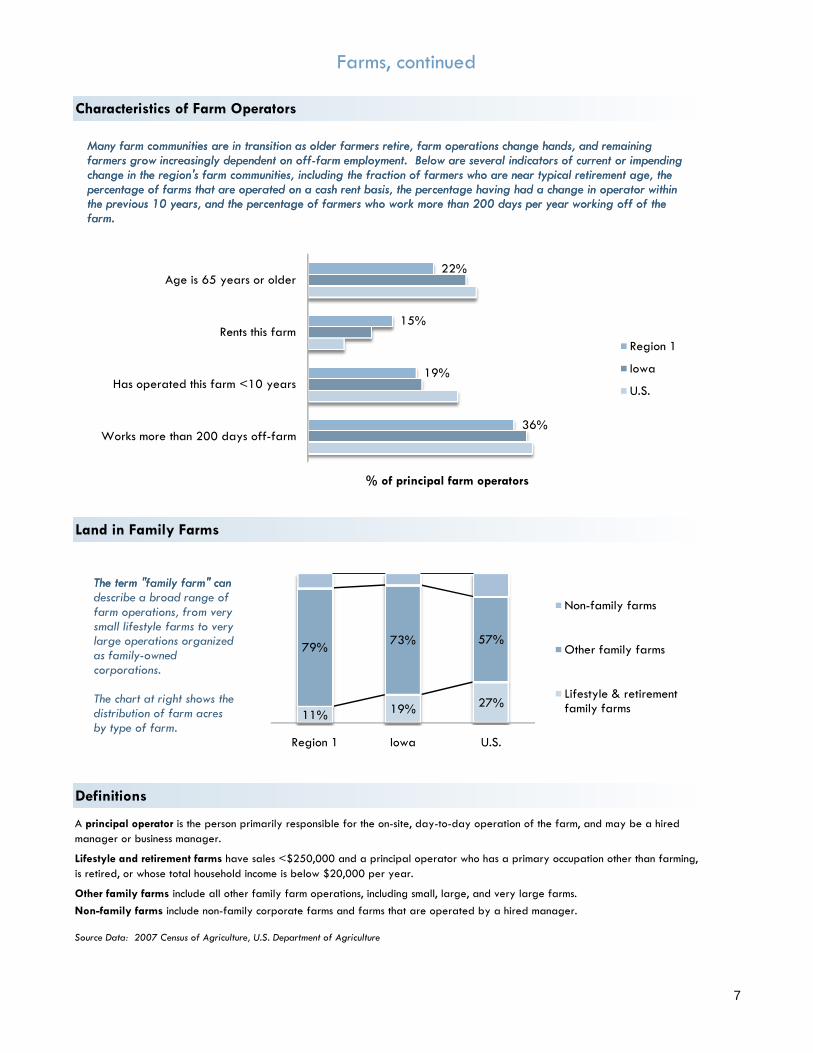
Characteristics of Farm Operators
Land in Family Farms
36%
19%
15%
22%
Works more than 200 days off-farm
Has operated this farm <10 years
Rents this farm
Age is 65 years or older
% of principal farm operators
Region 1
Iowa
U.S.
Many farm communities are in transition as older farmers retire, farm operations change hands, and remaining farmers grow increasingly dependent on off-farm employment. Below are several indicators of current or impending change in the region's farm communities, including the fraction of farmers who are near typical retirement age, the percentage of farms that are operated on a cash rent basis, the percentage having had a change in operator within the previous 10 years, and the percentage of farmers who work more than 200 days per year working off of the farm.
The term "family farm" can d ib b d f
Source Data: 2007 Census of Agriculture, U.S. Department of Agriculture
Definitions
A principal operator is the person primarily responsible for the on-site, day-to-day operation of the farm, and may be a hired manager or business manager.
Lifestyle and retirement farms have sales <$250,000 and a principal operator who has a primary occupation other than farming, is retired, or whose total household income is below $20,000 per year.
Other family farms include all other family farm operations, including small, large, and very large farms.Non-family farms include non-family corporate farms and farms that are operated by a hired manager.
36%
19%
15%
22%
Works more than 200 days off-farm
Has operated this farm <10 years
Rents this farm
Age is 65 years or older
% of principal farm operators
Region 1
Iowa
U.S.
Many farm communities are in transition as older farmers retire, farm operations change hands, and remaining farmers grow increasingly dependent on off-farm employment. Below are several indicators of current or impending change in the region's farm communities, including the fraction of farmers who are near typical retirement age, the percentage of farms that are operated on a cash rent basis, the percentage having had a change in operator within the previous 10 years, and the percentage of farmers who work more than 200 days per year working off of the farm.
The term "family farm" can describe a broad range of farm operations, from very small lifestyle farms to very large operations organized as family-owned corporations.
The chart at right shows the distribution of farm acres by type of farm.
11% 19% 27%
79% 73% 57%
Region 1 Iowa U.S.
Non-family farms
Other family farms
Lifestyle & retirement family farms
7
Labor Force
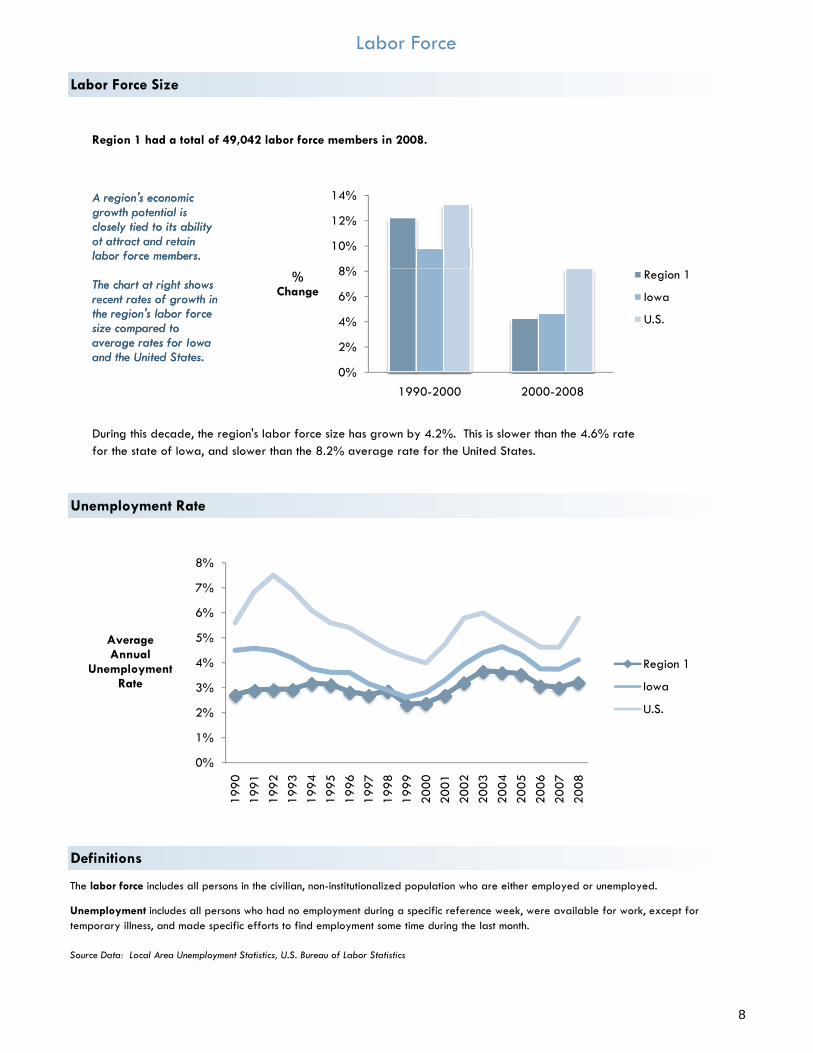
Labor Force Size
Region 1 had a total of 49,042 labor force members in 2008.
During this decade, the region's labor force size has grown by 4.2%. This is slower than the 4.6% rate for the state of Iowa, and slower than the 8.2% average rate for the United States.
Unemployment Rate
8%
0%
2%
4%
6%
8%
10%
12%
14%
1990-2000 2000-2008
%Change
Region 1
Iowa
U.S.
A region's economic growth potential is closely tied to its ability ot attract and retain labor force members.
The chart at right shows recent rates of growth in the region's labor force size compared to average rates for Iowa and the United States.
Source Data: Local Area Unemployment Statistics, U.S. Bureau of Labor Statistics
Definitions
The labor force includes all persons in the civilian, non-institutionalized population who are either employed or unemployed.
Unemployment includes all persons who had no employment during a specific reference week, were available for work, except for temporary illness, and made specific efforts to find employment some time during the last month.
0%
1%
2%
3%
4%
5%
6%
7%
8%
1990
1991
1992
1993
1994
1995
1996
1997
1998
1999
2000
2001
2002
2003
2004
2005
2006
2007
2008
AverageAnnual
UnemploymentRate
Region 1
Iowa
U.S.
0%
2%
4%
6%
8%
10%
12%
14%
1990-2000 2000-2008
%Change
Region 1
Iowa
U.S.
A region's economic growth potential is closely tied to its ability ot attract and retain labor force members.
The chart at right shows recent rates of growth in the region's labor force size compared to average rates for Iowa and the United States.
8
Labor Force, continued
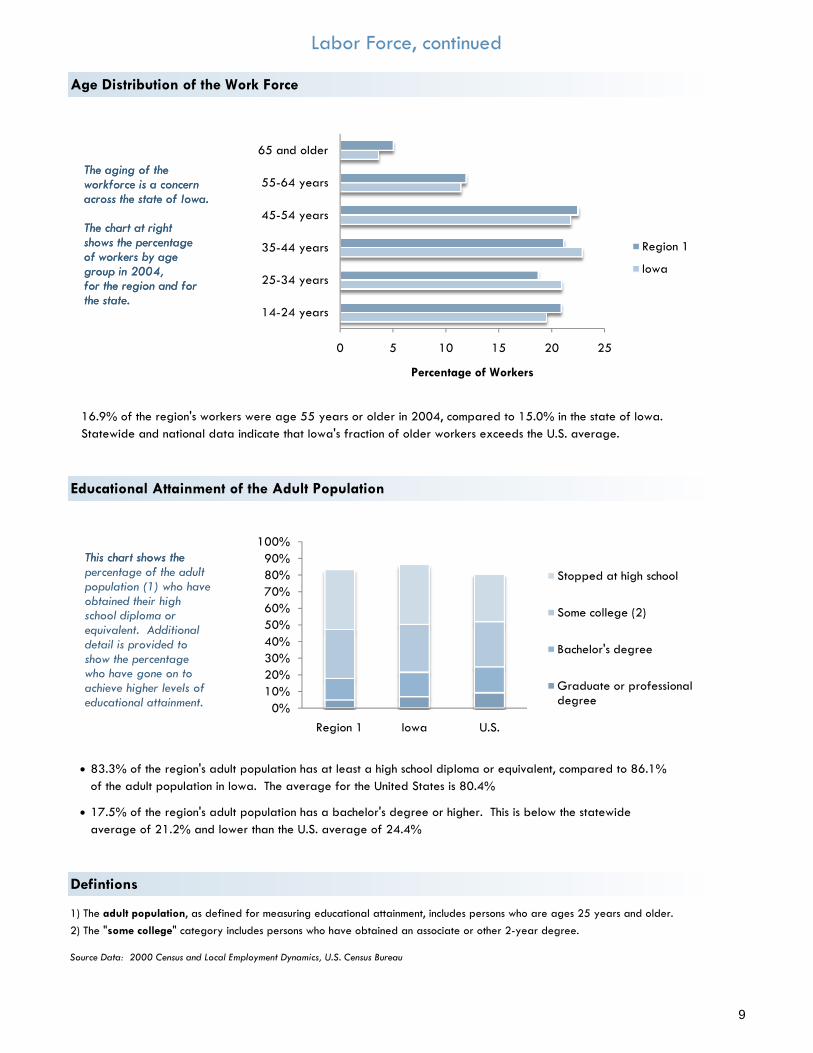
Statewide and national data indicate that Iowa's fraction of older workers exceeds the U.S. average.16.9% of the region's workers were age 55 years or older in 2004, compared to 15.0% in the state of Iowa.
Age Distribution of the Work Force
Educational Attainment of the Adult Population
0 5 10 15 20 25
14-24 years
25-34 years
35-44 years
45-54 years
55-64 years
65 and older
Percentage of Workers
Region 1
Iowa
90%100%
This chart shows the t f th d lt
The aging of the workforce is a concernacross the state of Iowa.
The chart at rightshows the percentageof workers by age group in 2004,for the region and for the state.
• 83.3% of the region's adult population has at least a high school diploma or equivalent, compared to 86.1%of the adult population in Iowa. The average for the United States is 80.4%
• 17.5% of the region's adult population has a bachelor's degree or higher. This is below the statewideaverage of 21.2% and lower than the U.S. average of 24.4%
Source Data: 2000 Census and Local Employment Dynamics, U.S. Census Bureau
1) The adult population, as defined for measuring educational attainment, includes persons who are ages 25 years and older.2) The "some college" category includes persons who have obtained an associate or other 2-year degree.
Defintions
0 5 10 15 20 25
14-24 years
25-34 years
35-44 years
45-54 years
55-64 years
65 and older
Percentage of Workers
Region 1
Iowa
0%10%20%30%40%50%60%70%80%90%
100%
Region 1 Iowa U.S.
Stopped at high school
Some college (2)
Bachelor's degree
Graduate or professional degree
This chart shows the percentage of the adult population (1) who have obtained their high school diploma or equivalent. Additional detail is provided to show the percentage who have gone on to achieve higher levels of educational attainment.
The aging of the workforce is a concernacross the state of Iowa.
The chart at rightshows the percentageof workers by age group in 2004,for the region and for the state.
9
Personal Income
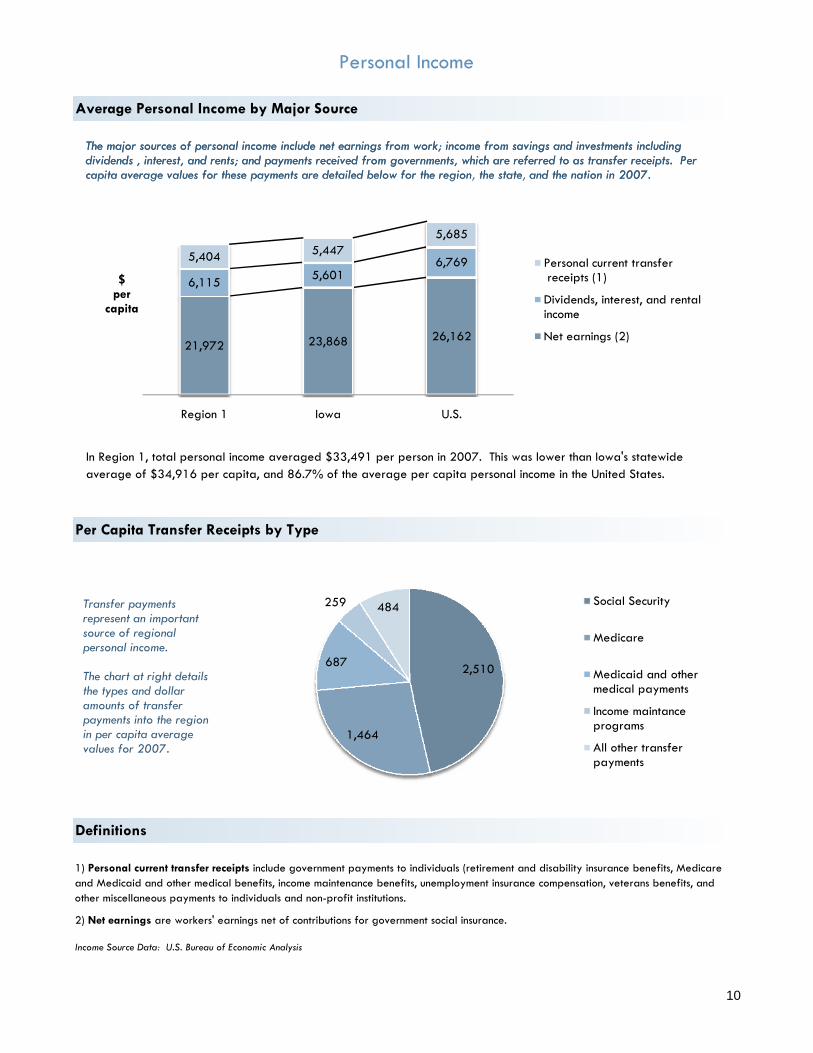
In Region 1, total personal income averaged $33,491 per person in 2007. This was lower than Iowa's statewideaverage of $34,916 per capita, and 86.7% of the average per capita personal income in the United States.
Average Personal Income by Major Source
Per Capita Transfer Receipts by Type
21,972 23,868 26,162
6,115 5,6016,7695,404 5,4475,685
Region 1 Iowa U.S.
$per
capita
Personal current transferreceipts (1)
Dividends, interest, and rental income
Net earnings (2)
The major sources of personal income include net earnings from work; income from savings and investments including dividends , interest, and rents; and payments received from governments, which are referred to as transfer receipts. Per capita average values for these payments are detailed below for the region, the state, and the nation in 2007.
2) Net earnings are workers' earnings net of contributions for government social insurance.
Income Source Data: U.S. Bureau of Economic Analysis
Definitions
1) Personal current transfer receipts include government payments to individuals (retirement and disability insurance benefits, Medicare and Medicaid and other medical benefits, income maintenance benefits, unemployment insurance compensation, veterans benefits, and other miscellaneous payments to individuals and non-profit institutions.
21,972 23,868 26,162
6,115 5,6016,7695,404 5,4475,685
Region 1 Iowa U.S.
$per
capita
Personal current transferreceipts (1)
Dividends, interest, and rental income
Net earnings (2)
Transfer payments represent an important source of regional personal income.
The chart at right details the types and dollar amounts of transfer payments into the region in per capita average values for 2007.
The major sources of personal income include net earnings from work; income from savings and investments including dividends , interest, and rents; and payments received from governments, which are referred to as transfer receipts. Per capita average values for these payments are detailed below for the region, the state, and the nation in 2007.
2,510
1,464
687
259 484 Social Security
Medicare
Medicaid and other medical payments
Income maintance programs
All other transfer payments
10

Poverty
Poverty Status
More recent (2007) poverty estimates for Region 1 show an overall poverty rate between 6.2% and 9.6%The region's estimated range is lower than the 10.7% to 11.3% estimated range for the state of Iowa.
Government Assistance
02468
101214161820
All persons Under 5 5 to 17 65 or older
%in
poverty(2000)
Age
Region 1 Iowa U.S.The chart at right shows poverty rates for the region, state and nation in 2000. The poverty rate measures the percentage of the population in poverty status.
Detail is provided for all persons, for very young children, for school-aged children, and for the elderly.
The government provides financial assistance to individuals and families through a variety of income maintenance
The U.S. Census Bureau determines poverty status based on family size and income level. If a family’s total annual income is below the threshold level appropriate for that family size, every member of the family is considered poor.
State of UnitedRegion 1 Iowa States
Income maintenance payments per capita.............................. $259 $388 $563Supplemental Security Income (SSI) benefits.................... 1 44 78 140Temporary Assistance to Needy Families (TANF)........... 18 36 62Food Stamps............................................................................ 42 91 103Other income maintenance benefits................................... 2 154 183 258
Poverty Source Data: SF3 Table PCT50 from the 2000 Census and 2007 Small Area Income and Poverty Estimates, U.S. Census Bureau
Income Data: U.S. Bureau of Economic Analysis
Definitions
2) Other income maintenance payments include earned income tax credits, energy assistance, foster care and adoption assistance, the value of WIC vouchers, and general state and local assistance to low-income individuals and families.
1) SSI benefits are received by the aged, the blind, and the disabled from both the Federal and state governments.
02468
101214161820
All persons Under 5 5 to 17 65 or older
%in
poverty(2000)
Age
Region 1 Iowa U.S.The chart at right shows poverty rates for the region, state and nation in 2000. The poverty rate measures the percentage of the population in poverty status.
Detail is provided for all persons, for very young children, for school-aged children, and for the elderly.
The government provides financial assistance to individuals and families through a variety of income maintenance programs. The dollar value of payments for key programs are detailed below as per capita averages for 2007.
The U.S. Census Bureau determines poverty status based on family size and income level. If a family’s total annual income is below the threshold level appropriate for that family size, every member of the family is considered poor.
11
Racial and Ethnic Diversity
Under 20 20 to 44 45 to 64 65 yearsAll ages years years years or older
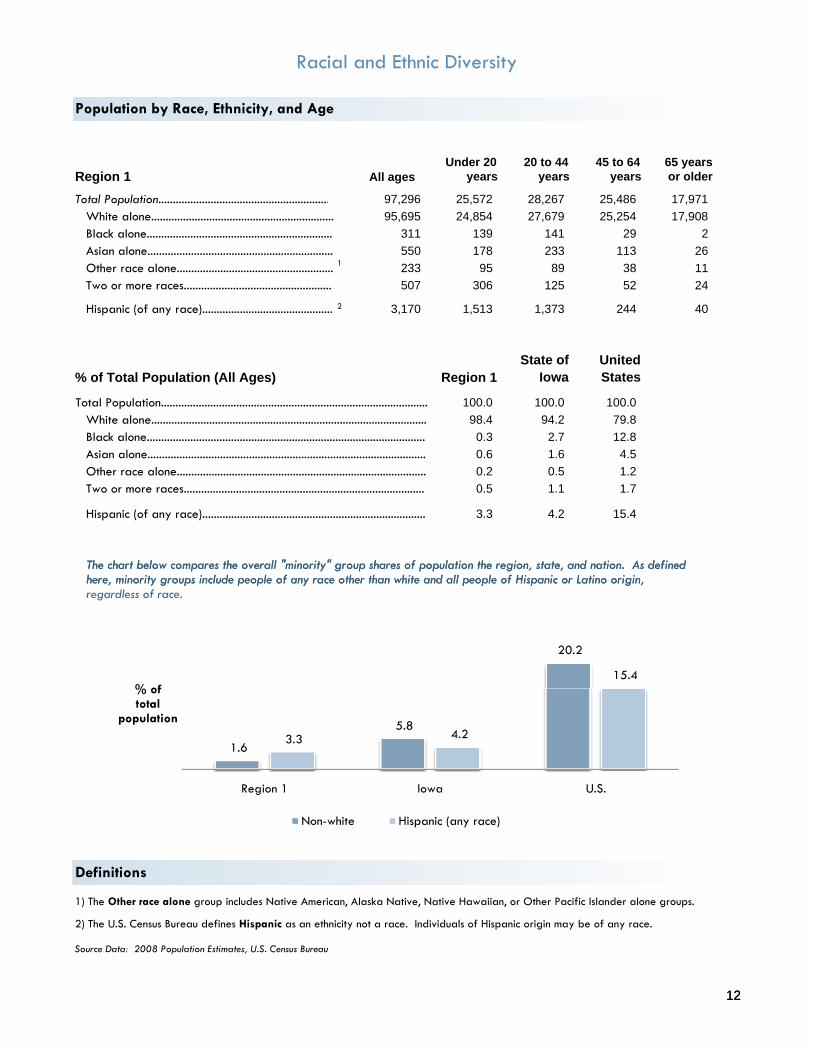
Total Population........................................................... 97,296 25,572 28,267 25,486 17,971 White alone............................................................... 95,695 24,854 27,679 25,254 17,908 Black alone................................................................ 311 139 141 29 2 Asian alone................................................................ 550 178 233 113 26 Other race alone...................................................... 1 233 95 89 38 11 Two or more races................................................... 507 306 125 52 24
Hispanic (of any race)............................................. 2 3,170 1,513 1,373 244 40
State of United% of Total Population (All Ages) Iowa States
100.0 100.0 100.0 98.4 94.2 79.8
0.3 2.7 12.8 0.6 1.6 4.5 0.2 0.5 1.2 0.5 1.1 1.7
3.3 4.2 15.4
Total Population............................................................................................White alone...............................................................................................Black alone................................................................................................Asian alone................................................................................................Other race alone......................................................................................Two or more races...................................................................................
Region 1
Region 1
Population by Race, Ethnicity, and Age
Hispanic (of any race).............................................................................
The chart below compares the overall "minority" group shares of population the region, state, and nation. As defined here, minority groups include people of any race other than white and all people of Hispanic or Latino origin,
dl f
12
Source Data: 2008 Population Estimates, U.S. Census Bureau
1) The Other race alone group includes Native American, Alaska Native, Native Hawaiian, or Other Pacific Islander alone groups.
Definitions
2) The U.S. Census Bureau defines Hispanic as an ethnicity not a race. Individuals of Hispanic origin may be of any race.
1.6
5.8
20.2
3.3 4.2
15.4
Region 1 Iowa U.S.
% oftotal
population
Non-white Hispanic (any race)
The chart below compares the overall "minority" group shares of population the region, state, and nation. As defined here, minority groups include people of any race other than white and all people of Hispanic or Latino origin, regardless of race.
12
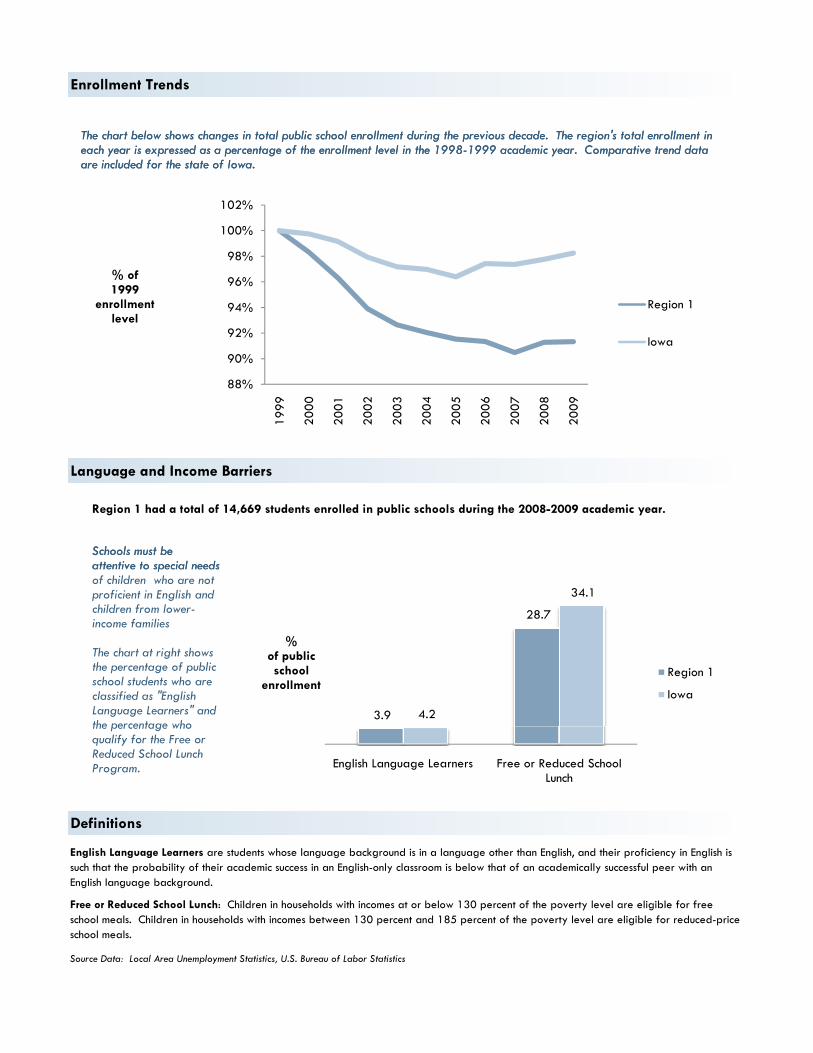
Enrollment Trends
Region 1 had a total of 14,669 students enrolled in public schools during the 2008-2009 academic year.
Language and Income Barriers
88%
90%
92%
94%
96%
98%
100%
102%
1999
2000
2001
2002
2003
2004
2005
2006
2007
2008
2009
% of 1999
enrollmentlevel
Region 1
Iowa
Schools must be attentive to special needs
The chart below shows changes in total public school enrollment during the previous decade. The region's total enrollment in each year is expressed as a percentage of the enrollment level in the 1998-1999 academic year. Comparative trend data are included for the state of Iowa.
Source Data: Local Area Unemployment Statistics, U.S. Bureau of Labor Statistics
Definitions
English Language Learners are students whose language background is in a language other than English, and their proficiency in English is such that the probability of their academic success in an English-only classroom is below that of an academically successful peer with an English language background.
Free or Reduced School Lunch: Children in households with incomes at or below 130 percent of the poverty level are eligible for free school meals. Children in households with incomes between 130 percent and 185 percent of the poverty level are eligible for reduced-price school meals.
88%
90%
92%
94%
96%
98%
100%
102%
1999
2000
2001
2002
2003
2004
2005
2006
2007
2008
2009
% of 1999
enrollmentlevel
Region 1
Iowa
3.9
28.7
4.2
34.1
English Language Learners Free or Reduced School Lunch
%of publicschool
enrollmentRegion 1
Iowa
Schools must be attentive to special needs of children who are not proficient in English and children from lower-income families
The chart at right shows the percentage of public school students who are classified as "English Language Learners" and the percentage who qualify for the Free or Reduced School Lunch Program.
The chart below shows changes in total public school enrollment during the previous decade. The region's total enrollment in each year is expressed as a percentage of the enrollment level in the 1998-1999 academic year. Comparative trend data are included for the state of Iowa.
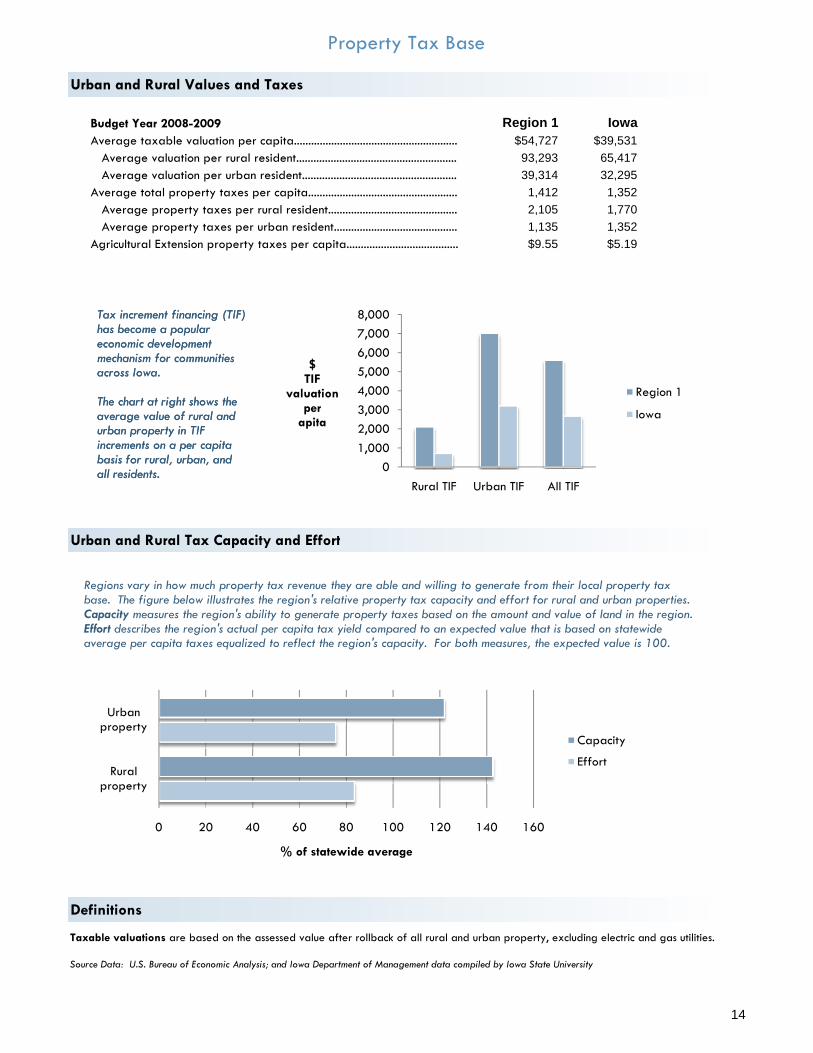
Property Tax Base
Budget Year 2008-2009 Region 1 IowaAverage taxable valuation per capita......................................................... $54,727 $39,531
Average valuation per rural resident........................................................ 93,293 65,417Average valuation per urban resident...................................................... 39,314 32,295
Average total property taxes per capita.................................................... 1,412 1,352Average property taxes per rural resident............................................. 2,105 1,770Average property taxes per urban resident........................................... 1,135 1,352
Agricultural Extension property taxes per capita....................................... $9.55 $5.19
Urban and Rural Values and Taxes
Urban and Rural Tax Capacity and Effort
01,0002,0003,0004,0005,0006,0007,0008,000
Rural TIF Urban TIF All TIF
$TIF
valuationper
apita
Region 1
Iowa
Tax increment financing (TIF) has become a popular economic development mechanism for communities across Iowa.
The chart at right shows the average value of rural and urban property in TIF increments on a per capita basis for rural, urban, and all residents.
Source Data: U.S. Bureau of Economic Analysis; and Iowa Department of Management data compiled by Iowa State University
Taxable valuations are based on the assessed value after rollback of all rural and urban property, excluding electric and gas utilities.
Definitions
0 20 40 60 80 100 120 140 160
Rural property
Urban property
% of statewide average
Capacity
Effort
Regions vary in how much property tax revenue they are able and willing to generate from their local property tax base. The figure below illustrates the region's relative property tax capacity and effort for rural and urban properties. Capacity measures the region's ability to generate property taxes based on the amount and value of land in the region. Effort describes the region's actual per capita tax yield compared to an expected value that is based on statewide average per capita taxes equalized to reflect the region's capacity. For both measures, the expected value is 100.
01,0002,0003,0004,0005,0006,0007,0008,000
Rural TIF Urban TIF All TIF
$TIF
valuationper
apita
Region 1
Iowa
Tax increment financing (TIF) has become a popular economic development mechanism for communities across Iowa.
The chart at right shows the average value of rural and urban property in TIF increments on a per capita basis for rural, urban, and all residents.
14
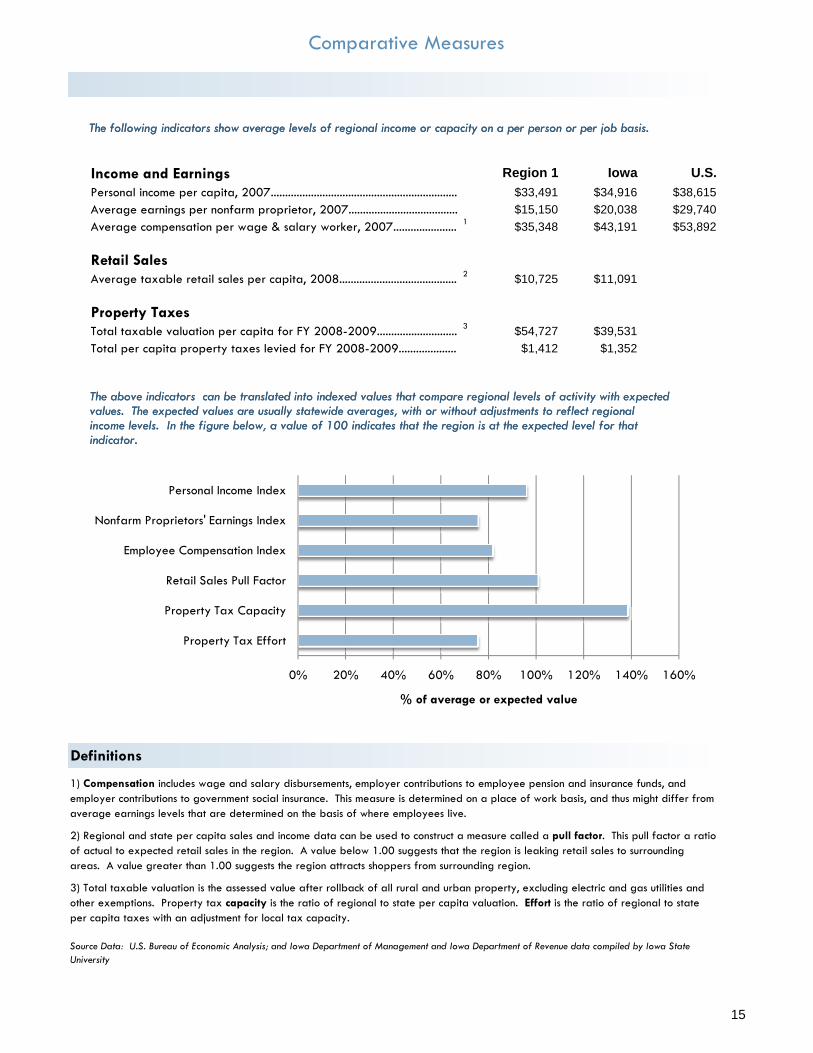
Comparative Measures
Income and Earnings Region 1 Iowa U.S.Personal income per capita, 2007................................................................. $33,491 $34,916 $38,615Average earnings per nonfarm proprietor, 2007...................................... $15,150 $20,038 $29,740Average compensation per wage & salary worker, 2007...................... 1 $35,348 $43,191 $53,892
Retail SalesAverage taxable retail sales per capita, 2008......................................... 2 $10,725 $11,091
Property TaxesTotal taxable valuation per capita for FY 2008-2009............................ 3 $54,727 $39,531Total per capita property taxes levied for FY 2008-2009.................... $1,412 $1,352
The following indicators show average levels of regional income or capacity on a per person or per job basis.
Employee Compensation Index
Nonfarm Proprietors' Earnings Index
Personal Income Index
The above indicators can be translated into indexed values that compare regional levels of activity with expected values. The expected values are usually statewide averages, with or without adjustments to reflect regional income levels. In the figure below, a value of 100 indicates that the region is at the expected level for that indicator.
3) Total taxable valuation is the assessed value after rollback of all rural and urban property, excluding electric and gas utilities and other exemptions. Property tax capacity is the ratio of regional to state per capita valuation. Effort is the ratio of regional to state per capita taxes with an adjustment for local tax capacity.
Source Data: U.S. Bureau of Economic Analysis; and Iowa Department of Management and Iowa Department of Revenue data compiled by Iowa State University
Definitions
1) Compensation includes wage and salary disbursements, employer contributions to employee pension and insurance funds, and employer contributions to government social insurance. This measure is determined on a place of work basis, and thus might differ from average earnings levels that are determined on the basis of where employees live.
2) Regional and state per capita sales and income data can be used to construct a measure called a pull factor. This pull factor a ratio of actual to expected retail sales in the region. A value below 1.00 suggests that the region is leaking retail sales to surrounding areas. A value greater than 1.00 suggests the region attracts shoppers from surrounding region.
The following indicators show average levels of regional income or capacity on a per person or per job basis.
0% 20% 40% 60% 80% 100% 120% 140% 160%
Property Tax Effort
Property Tax Capacity
Retail Sales Pull Factor
Employee Compensation Index
Nonfarm Proprietors' Earnings Index
Personal Income Index
% of average or expected value
The above indicators can be translated into indexed values that compare regional levels of activity with expected values. The expected values are usually statewide averages, with or without adjustments to reflect regional income levels. In the figure below, a value of 100 indicates that the region is at the expected level for that indicator.
15