economic impact of the film industry in new york state ... · in the full report.1 background new...
TRANSCRIPT

1
Economic Impact of the Film Industry in New York State - 2015 & 2016Prepared for: Empire State Development

Economic & Fiscal Impact Analysis of New York State Film Tax Credit Programs | January 2017
Camoin Associates has provided economic development consulting services to municipalities, economic development agencies, and private enterprises since 1999. Through the services offered, Camoin Associates has had the opportunity to serve EDOs and local and state governments from Maine to California; corporations and organizations that include Lowe’s Home Improvement, FedEx, Volvo (Nova Bus), and the New York Islanders; as well as private developers proposing projects in excess of $600 million.
Our reputation for detailed, place-specifi c, and accurate analysis has led to projects in 29 states and garnered
attention from national media outlets including Marketplace (NPR), Forbes Magazine, and The Wall Street Journal. Additionally, our marketing strategies have helped our clients gain both national and local media coverage for their projects in order to build public support and leverage additional funding. We are based in Saratoga Springs, NY, with regional offi ces in Portland, ME; Boston, MA; Richmond, VA; and Brattleboro, VT.
To learn more about our experience and projects in all of our service lines, please visit us online at camoinassociates.com. You can also fi nd us on Twitter (@CamoinAssociate) and on Facebook.
About Camoin
i
Cover photo: HBO/Cinemax’s The Knick: Michael Angarano, Juliet Rylance, Steven Soderbergh, Greg Jacobs. Photo: Mary Cybulski

Economic & Fiscal Impact Analysis of New York State Film Tax Credit Programs | January 2017
01 Executive Summary
04 Introduction
04 Background
05 Literature Review
06 Data Analysis
07 Interview Findings
09 Economic Impact of the Film Industry
20 Fiscal Impact of the Film Industry
24 Attachment A: What is an Economic Impact Analysis?
25 Attachment B: References
27 Attachment C: Additional Research
Table of Contents
ii

Economic & Fiscal Impact Analysis of New York State Film Tax Credit Programs | January 2017iii
EARNINGSTOTAL:
$4,222,769,745
DIRECT
INDIRECT
$2,001,312,675
$2,221,457,070
SPENDINGTOTAL:
$12,586,290,898
DIRECT
INDIRECT
$6,543,232,139
$6,043,058,760
Total Impact on New York State (2015 & 2016)
Source: Empire State Development, EMSI, Camoin Associates
JOBS
70,81234,209
DIRECT
INDIRECT
36,603
TOTAL:
$12,586,290,898$12,586,290,898

Economic & Fiscal Impact Analysis of New York State Film Tax Credit Programs | January 2017 1
Executive SummaryIntroductionEmpire State Development (ESD) administers the New York State Film Tax Credit Program, a program fi rst established in 2004 and designed to increase the fi lm and television production and post-production industry presence in New York State, and to provide an overall positive impact to the State’s economy. The Program provides tax credit incentives to qualifi ed production companies that produce feature fi lms, television series, television pilots and fi lms for television, and/or incur post-production costs associated with these productions to support the growth of the fi lm industry in New York State. As part of the law that extended the program in 2013, ESD is required to have a third party review the impact of the program on a biennial basis to calculate the economic and fi scal impact of the State’s investment. Camoin Associates was hired through a competitive bid process by ESD to complete this review for years 2015 and 2016. What follows is a summary of this analysis with more detail in the full report.1
BackgroundNew York offers tax incentives to encourage the growth of the fi lm industry in the state through two separate programs: the Film Production Credit and the Post-Production Credit. Both of these programs encourage the use of New York State (NYS) facilities and offer substantial tax incentives on industry spending in the state. The incentives available in NYS are not unique, and a majority of states offer some kind of incentive program of various magnitudes. Based on interviews with industry experts, these tax incentive programs have been successful at attracting and retaining the fi lm industry because costs, net of incentives, have become the number one driver of location decisions for fi lm productions.
The fi rst step of the analysis was to conduct substantial research into the fi lm industry and understand how the tax credit program impacts fi lming location decisions. This research included interviews, literature review, data analysis, and reviews of similar reports on the subject. The fi ndings of this research overwhelmingly supported the notion that the tax credit program in NYS has been a driver of economic activity in the fi lm industry including not only the attraction of major fi lm and television productions but also the construction and operation of new sound stages and the improvement of the workforce and talent necessary for a world-class fi lm industry cluster. Furthermore, the research found that without the tax credit program, NYS would lose industry activity to other states that offer incentives since the industry is highly mobile and price sensitive.
FindingsEconomic Impact AnalysisAn economic impact analysis looks at how direct spending resulting from a particular industry or project has multiplier impacts throughout the economy and results in new jobs, earnings, and spending. The direct impact of this project was the production and post-production spending in New York State by credit-eligible projects produced during 2015 and 2016. Table 1 summarizes the combined impact of the Film Production Tax Credit and the Post-Production Tax Credit during years 2015 and 2016.
In total, the Film Production Tax Credit and the Post-Production Tax Credit program generated over $6.5 billion in spending in New York State over the two-year period of 2015 and 2016. The $6,543,232,139 in direct spending resulted in 70,812 total jobs2, $4.2 billion in earnings, and over $12.5 billion in total spending throughout the New York State economy.3 As noted, these impacts cover a two-year period (2015–2016). Therefore, to annualize the impacts, we simply divide by 2 to fi nd that collectively, the credits directly supported over 35,000 jobs each year, $2.1 billion in earnings each year, and almost $6.3 billion in spending per year in NYS.
1 Camoin Associates also completed the 2013/2014 impact analysis. 2 A “job” is equal to one person employed for some amount of time (part-time, full-time, or temporary) during 2015 or 2016. For example, if a person is employed full-time in 2015 and 2016 that would be considered two jobs. Another example is if one person is employed
part-time for four months, then takes two months off and is hired again for four months that would be counted as two jobs. 3 Note that the earnings impact is also captured in the spending impact. As the production companies spend money on labor they are creating additional earnings.

Economic & Fiscal Impact Analysis of New York State Film Tax Credit Programs | January 20172
Additional ImpactsThe New York State fi lm industry tax credit programs have an impact beyond just what is calculated in the above sections. These additional impacts include: (a) support of fi lm industry cluster-specifi c workforce and infrastructure development, and (b) fi lm production induced tourism. These impacts are not accounted for in the above economic impact calculations, but nevertheless have an impact on the fi lm industry and the NYS economy.
Film Industry Cluster Effect – Because of the signifi cant cluster of fi lm-related industries in New York, there exists a virtuous, self-reinforcing cycle where businesses, workers, and infrastructure serve to perpetuate the advantages of producing in New York. For example, as more productions occur in NYS, there are more employment opportunities, the skill levels of the overall workforce are improved, and the industry as a whole benefi ts. As a result of this cluster effect, additional production activity, beyond that which is directly incentivized by the tax credit program, is occurring in NYS. Without the tax credit, this non-incentivized activity could begin to decline over time.
Film Production Induced Tourism – Film-induced tourism can take a number of different forms ranging from tourists extending their stay in a particular place to visit different sites featured in a movie or television show, to distinct visits to a location or country to see where the fi lm was made, to visitors traveling to see where a fi lm or television show is currently being made.
All of this visitation generates revenue and employment that otherwise would not exist without the location’s connection to the fi lm industry.
Fiscal Impact Analysis
The fi lm industry not only impacts the NYS economy in terms of jobs, earnings, and spending but there is also a fi scal impact on both NYS and New York City (NYC) in terms of direct and indirect tax revenue. The analysis used the fi ndings of the economic impact analysis to calculate how this activity results in additional tax revenue for NYS, NYC, and other local jurisdictions. Based on the activity that was associated with the fi lm industry during 2015 and 2016, it is estimated that NYS, NYC, and other local jurisdictions received nearly $1.5 billion in additional tax revenue from the Film Production Tax Credit activity and NYS, NYC, and other local jurisdictions received an additional $54 million from the Post-Production Tax Credit activity.
An essential question of this analysis is: How do the tax revenues that are generated by the fi lm production tax credits compare to the amount of tax credits that are issued in order to incentivize? In other words, what is
Table 1: Production & Post Production Credit - Total Economic Impact on New York State (2015 & 2016)
Direct Indirect Total
Jobs 34,209 36,603 70,812
Earnings $2,001,312,675 $2,221,457,070 $4,222,769,745
Spending $6,543,232,139 $6,043,058,760 $12,586,290,898
Source: Empire State Development, EMSI, Camoin Associates
Table 2: Tax Credits Issued
Production Credits $1,388,161,657
Post-Production Credits $59,753,414
Total $1,447,915,071
Source: Empire State Development
2

Economic & Fiscal Impact Analysis of New York State Film Tax Credit Programs | January 2017 3
the state’s return on investment (ROI) of the tax credit program? For the production and post-production activity during the 2015–2016 period the state offered over $1.4 billion in incentives, to be paid out over several years following the completion of the projects (Table 2).
Table 3 compares the NYS, NYC, and other local jurisdiction tax collections associated with the production credit to the net present value (NPV) of the production credit payout. The NPV is used because the tax collections from the industry spending and employment is occurring during the 2015/2016-time period whereas the tax credits are paid out over a period of several years that will extend beyond 2016. When combining the tax benefi ts that accrue to NYS, NYC, and other New York local governments, the ROI ratio for the production credit is 1.15. In other words, for every $1 NYS pays in incentives, NYC receives about $0.56, other local jurisdictions receive $0.09, and NYS receives $0.51 in tax revenue.
Similarly, for the post-production credit, Table 4 compares the projected tax collections associated with the post-production activity to the projected post-production credit payout. The ROI for the post-production credit is 0.97, meaning that for every $1 of tax credits issued, NYC receives $0.51, other local jurisdictions receive $0.04, and NYS receives $0.42 in tax revenue.
ConclusionDuring the 2015–2016 study period NYS invested a total of $1,355,129,678 (net present value) in incentives through the Production Tax Credit and the Post-Production Tax Credit to be paid out over a period from 2016 to 2020. In exchange, NYS, NYC, and local jurisdictions will directly receive $1,552,161,401 in total tax revenue while supporting over 35,000 jobs per year, $2.1 billion in earnings per year, and nearly $6.3 billion in spending throughout New York State per year.
Table 3: Production Credit -Return on Investment
New York State Tax Collections $659,811,901
New York City Tax Collections $726,796,603
All Other NYS Local Gov’t Tax Collections $111,232,491
Combined Tax Collection $1,497,840,995
NPV of Estimated Production Credit Payout $1,298,902,333
Return on Investment Ratio 1.15Source: Camoin Associates
Table 4: Post-Production Credit -Return on Investment
New York State Tax Collections $23,591,081
New York City Tax Collections $28,674,095
All Other NYS Local Gov’t Tax Collections $2,055,230
Combined Tax Collection $54,320,406
NPV of Estimated Production Credit Payout $56,227,345
Return on Investment Ratio 0.97Source: Camoin Associates
3

Economic & Fiscal Impact Analysis of New York State Film Tax Credit Programs | January 20174
IntroductionEmpire State Development (ESD) administers the New York State Film Tax Credit Program, a program fi rst established in 2004 and designed to increase the fi lm and television production and post-production industry presence in New York State, and to provide an overall positive impact to the State’s economy. The Program provides tax credit incentives to qualifi ed production companies that produce feature fi lms, television series, television pilots and fi lms for television, and/or incur post-production costs associated with these productions to support the growth of the fi lm industry in New York State. As part of the law that extended the program in 2013, ESD is required to have a third party review the impact of the program on a biennial basis to calculate the economic and fi scal impact of the State’s investment. Camoin Associates was hired by ESD to complete this review for years 2015 and 2016.4
In order to complete this analysis Camoin Associates conducted signifi cant research including a review of existing literature on the topic, industry data collection and analysis, and interviews with experts in the fi lm industry in New York State (NYS). This background research proved to be exceedingly helpful to not only understand the industry but also to determine the importance of the tax credit program in the attraction and retention of the fi lm industry in NYS.
The following report provides background on the tax credit programs, calculates and analyzes the economic and fi scal impact of the program in NYS, and fi nally estimates the return on investment (ROI) ratio for the State that compares the annual investment in the credit (amount of credits issued) to the annual income that the state receives (amount of tax revenue generated by the industry).
Film Production CreditThe Film Production Credit is available to offset qualifi ed production costs which generally include below-the-line items. Eligibility for the credit varies based on a number of factors including the budget for the production and the type of fi lm company (i.e. major studio versus independent fi lm company).
Post-Production CreditThe Post-Production Credit (post-production) is available to fi lm production companies that fi lm a substantial portion of a project outside of NYS, but do some or all of their post-production work in the state. Note that productions that qualify under the Film Production Credit can claim their post-production costs under the Film Production Credit.
4 Camoin Associates also completed the 2013/2014 impact analysis.5 The Empire State Film Production Credit was fi rst enacted in 2004 (Chapter 60) and was subsequently amended several times to either increase and extend program funding or to increase the amount of credit for a project (e.g. 10% to 30% of qualifi ed costs). In 2010, the Empire State Post Production Tax Credit was created. Total funding authorized as the fi rst pool of program funds is $1.035 billion for tax years 2004 to 2013. An additional pool of $3.78 billion of funds were authorized for tax years 2010 through 2019 ($420 million/year). The post-production tax credit is fi nanced out of the additional pool ($420 million/year) and the amount of the funds dedicated to post-production projects were increased
from $7 million/year for years 2010-2014 to $25 million/year for years 2015-2019. Finally, beginning in 2015, fi lm companies are eligible for an additional 10% credit for labor costs incurred in certain upstate counties.6 “Below-the-line” expenditures include costs for technical and crew production, use of fi lm production facilities, props, makeup, wardrobe, non-speaking background extras, fi lm processing, camera, sound recording, set construction, lighting, shooting, editing, and meals. They exclude costs such as compensation for the screenwriter, producer, director, principal actors, and expenditures on rights to secure the material on which the script is based and production rights to the screenplay.
Background Overview of the New York State Film Tax Credit ProgramFirst established in 2004, the NYS Film Tax Credit Program5 is designed to encourage and support the fi lm industry in New York State and increase its presence and overall impact on the state economy. The original legislation offered a 10% credit on qualifi ed “below-the-line”6 expenditures. In 2008, the program was extended and expanded to a 30% credit on below-the-line expenditures. The program has been extended a number of times, most recently for the period of 2015–2019. The current regulations for the program make benefi ts eligible for production and post-production costs including a fully refundable credit of 30% (additional benefi ts available to projects in NYS but outside of New

Economic & Fiscal Impact Analysis of New York State Film Tax Credit Programs | January 2017 5
York City7) of qualifi ed production and post-production costs incurred in NYS. New York State has set aside $420 million per year to be allocated towards this credit. The credits received by a fi lm company are paid out over a period of 1 to 3 years following production, depending on production timing and budget.
In order to receive either of the tax credits, fi lm companies must submit documentation throughout the process including an initial application that outlines their projections for qualifi ed spending and a fi nal application once the project is complete. Ultimately the full project is audited to determine the actual credit amount. Administration of the program is handled by Empire State Development.
Other Film Industry Incentive ProgramsNew York State’s incentive program for the fi lm industry is not unique. A 2014 study issued by the National Conference of State Legislatures reported that thirty-nine states and Puerto Rico offer fi lm production incentives.8 The incentives available for the fi lm industry started to take root in the 1990s with Louisiana passing the Motion Picture Investor Tax Credit.9 In the early 2000s only a handful of states offered similar programs but the number of states with fi lm incentives increased dramatically by 2010 as states began to compete in earnest with each other. Incentives to the fi lm industry vary widely from state to state but some of the key differences are that some states offer incentives on above-the-line costs, which NYS does not do, and some offer cash rebates rather than refundable tax credits. Additionally, other countries have signifi cant incentives that draw productions out of the United States to places like Toronto, Vancouver, London, Turkey, Australia and throughout the world. Prior to credits being available in NYS, many fi lms set in New York were primarily shot in foreign locations (Toronto in particular) with the crew coming to New York for a short time to shoot key location shots such as the Empire State Building, Times Square, the New York City skyline, and the Statute of Liberty.
Literature ReviewAs part of the research process, Camoin Associates reviewed dozens of reports and articles on the fi lm industry and the associated incentive programs in New York State and throughout the United States. This research provided us with an in-depth understanding of how and why the tax credit programs came to be and the role that they play in growing the fi lm industry in places outside of the traditional United States “powerhouses” of New York and California.
Previous Reports on the Impact on New York StateTwo previous studies have been completed to analyze the impact of the tax credit program on New York State, including a report prepared in February 2009 by Ernst & Young for the New York State Governors Offi ce of Motion Picture and Television Development and the Motion Picture Association of America (“Ernst & Young Report”) and a subsequent update report completed in December 2012 by HR&A Advisors for the Motion Picture Association of America (“HR&A Report”). Both reports looked at the economic and fi scal impact of the New York State Film Production Tax Credit and compared the fi scal benefi ts to the cost associated with the program (lost tax revenue resulting from the credit).10
The most recent study prepared by HR&A Advisors found that in 2011 the Film Production Tax Credit supported 28,000 jobs (including 12,600 direct jobs and 16,300 indirect jobs), $6.9 billion in sales, and
7 Effective January 1, 2015 an additional 10% credit was added to the Film Production Tax Credit to productions with a total budget greater than $500,000 that are using labor from a set of counties outside of NYC. Since this change, the State has issued the extra credit to one production and there are 14 others that are still in the initial application phase with expected spending of nearly $9,250,000 upstate.
8 National Conference of State Legislatures, 2014)9 Adkisson, 2013

Economic & Fiscal Impact Analysis of New York State Film Tax Credit Programs | January 20176
$4.2 billion in wages per year. Additionally, the Film Production Tax Credit generated $748 million (New York State and New York City taxes) in taxes while distributing $355 million in credits, resulting in a return on investment of 2.23 for the credits. When considering only the tax revenues received by New York State, the return on investment is 1.09, so for every dollar of tax credit issued the report fi nds that $1.09 is generated as tax revenue.
Note that the methodology of the HR&A Report differs
from the Camoin Associates methodology in two primary
ways, both of which have an impact when comparing
the fi ndings of the two reports. First, the HR&A Report
is looking at a one year time frame whereas this report
is focused on a two year time frame. Secondly, the
HR&A Report includes all of the spending of projects
that received the tax credit, plus a percent of all other
spending in the fi lm industry in New York State. In
comparison, this analysis only includes the spending
by productions that received the tax credit and can be
reasonably assumed to have been induced to New York
State as a result of access to the credit program. The
approach of this analysis is more conservative and is
focused on measuring only the activity that occurred as
a direct result of the tax credit program.
Finally, in 2015 a report was released by Empire State Development that was prepared by Camoin Associates measuring the impact of the Film Tax Credit Program during 2013 and 2014. The 2013/2014 analysis followed the same methodology being employed as this 2015/2016 report.
Other ReportsIn addition to the reports that have been written about the fi lm industry in New York State, the research team also reviewed reports on other states, countries, and topics associated with the analysis. The full list of references can be found in Attachment B with summaries in Attachment C.
Major takeaways of the literature review:
• The vast majority of the fi lm industry is highly mobile and able to relocate productions relatively quickly if a better offer is available that would make the project easier to fi nance or allow for a better return. As a result, states have had to remain highly competitive with their incentive programs to attract and retain the fi lm industry.
• Growth of the fi lm industry has additional economic benefi ts outside of the sub-sectors directly related to movie and television production. Reports have shown that fi lm-induced tourism is real and can have positive implications on the overall economy. Additionally, when productions move in they impact many other industries such as lodging, retail, construction, services, and others as the operation hires locally.
• Reports that look at the economic impact of the fi lm industry in a particular geography consider all eligible spending as a result of access to the incentive program.
• Incentive programs, of all types and for all industries, are controversial. The fi lm industry tax credit program is no different and oversight and periodic reviews are necessary to ensure the programs are furthering the intended goals.
In summary, fi lm-related incentive programs are widely available and are a key consideration in fi lm production fi nancing. In this highly mobile industry, incentives appear to have a real effect on location decision-making.
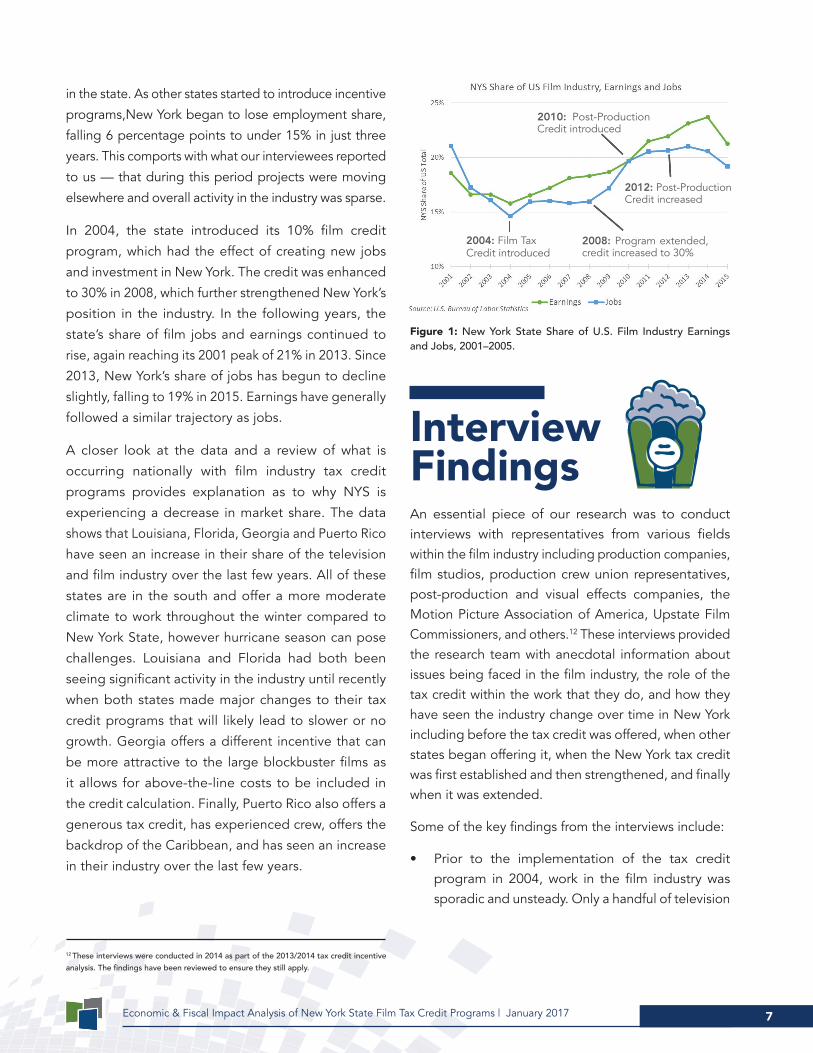
Data Analysis As shown in Figure 1, New York State began to lose fi lm industry11 employment and earnings share beginning around 2001. In that year, 21% of fi lm industry jobs were
10 Note that these studies were not done in connection with Empire State Development. In fact, the requirement for the analysis to be completed on a biennial basis was not added to the legislation until the most recent amendments that extended the program. 11 The fi lm industry is defi ned as the following NAICS codes: 512110 Motion Picture and Video Production, 512120 Motion Picture and Video Distribution, 512191 Teleproduction
and Other Postproduction Services, and 512199 Other Motion Picture and Video Industries. It is important to note, however, that many fi lm jobs are not classifi ed in these specifi c NAICS codes. For example, many in the fi lm industry are counted in the Independent Artists sector or Entertainment Payroll sector and those are not counted here so the impact listed is most likely a conservative estimate.
Economic & Fiscal Impact Analysis of New York State Film Tax Credit Programs | January 2017 7
12 These interviews were conducted in 2014 as part of the 2013/2014 tax credit incentive analysis. The fi ndings have been reviewed to ensure they still apply.
in the state. As other states started to introduce incentive
programs,New York began to lose employment share,
falling 6 percentage points to under 15% in just three
years. This comports with what our interviewees reported
to us — that during this period projects were moving
elsewhere and overall activity in the industry was sparse.
In 2004, the state introduced its 10% fi lm credit
program, which had the effect of creating new jobs
and investment in New York. The credit was enhanced
to 30% in 2008, which further strengthened New York’s
position in the industry. In the following years, the
state’s share of fi lm jobs and earnings continued to
rise, again reaching its 2001 peak of 21% in 2013. Since
2013, New York’s share of jobs has begun to decline
slightly, falling to 19% in 2015. Earnings have generally
followed a similar trajectory as jobs.
A closer look at the data and a review of what is
occurring nationally with fi lm industry tax credit
programs provides explanation as to why NYS is
experiencing a decrease in market share. The data
shows that Louisiana, Florida, Georgia and Puerto Rico
have seen an increase in their share of the television
and fi lm industry over the last few years. All of these
states are in the south and offer a more moderate
climate to work throughout the winter compared to
New York State, however hurricane season can pose
challenges. Louisiana and Florida had both been
seeing signifi cant activity in the industry until recently
when both states made major changes to their tax
credit programs that will likely lead to slower or no
growth. Georgia offers a different incentive that can
be more attractive to the large blockbuster fi lms as
it allows for above-the-line costs to be included in
the credit calculation. Finally, Puerto Rico also offers a
generous tax credit, has experienced crew, offers the
backdrop of the Caribbean, and has seen an increase
in their industry over the last few years.
InterviewFindingsAn essential piece of our research was to conduct interviews with representatives from various fi elds within the fi lm industry including production companies, fi lm studios, production crew union representatives, post-production and visual effects companies, the Motion Picture Association of America, Upstate Film Commissioners, and others.12 These interviews provided the research team with anecdotal information about issues being faced in the fi lm industry, the role of the tax credit within the work that they do, and how they have seen the industry change over time in New York including before the tax credit was offered, when other states began offering it, when the New York tax credit was fi rst established and then strengthened, and fi nally when it was extended.
Some of the key fi ndings from the interviews include:
• Prior to the implementation of the tax credit program in 2004, work in the fi lm industry was sporadic and unsteady. Only a handful of television
2004: Film TaxCredit introduced
2008: Program extended, credit increased to 30%
2010: Post-Production Credit introduced
2012: Post-Production Credit increased
Figure 1: New York State Share of U.S. Film Industry Earnings and Jobs, 2001–2005.

Economic & Fiscal Impact Analysis of New York State Film Tax Credit Programs | January 20178
shows and movies were shot in New York. Many productions were shot elsewhere, primarily Toronto, with one or two weeks’ worth of shooting in New York City to capture key shots of streets, landmarks, and iconic buildings. In addition, prior to the tax credit program, commercials accounted for a larger share of the industry’s work when now it accounts for only a small share of overall work and industry spending in New York.
• Historically, during periods of time when the stability of the tax credit program was uncertain, work in the fi lm industry would fall off as productions moved elsewhere to locations with more stability surrounding the availability of incentives.
• While location decisions in the industry were historically driven by creative factors, more recently cost (and the availability of incentive programs to offset those costs) have been the number one factor considered. This has led to competition between states and countries that offer incentives.
• Comparatively, NYS is an expensive place to do business for the fi lm industry when considering wages, taxes, and other costs. The tax credit brings fi lms and television productions in NYS more in line with other location options and “levels the playing fi eld” somewhat so that productions in NY make fi nancial sense.
• The aspects of the program that require use of qualifi ed production facilities has helped to build up the industry’s infrastructure in a way that has not occurred in other states. This investment in infrastructure has had a lasting impact on the New York State economy through increased property tax revenue and an overall improvement to the industry as one project builds off the next.
• The fi lm industry in Upstate NY is in competition with other neighboring states such as Massachusetts and Connecticut but not typically in competition with New York City. The increased cost of doing work outside of New York City is a factor when considering where to locate a fi lm. The increased
cost of productions in Upstate (and other adjacent states) is a result of the need to provide transportation, overnight accommodations, per diem, and other benefi ts to those working on the productions because most of the production staff are based in NYC. Some Upstate NY locations are better equipped to support the industry with workforce and talent base necessary for smaller independent productions.
• The interviewees indicated that the non-scripted productions (e.g. documentaries, reality shows, and news programs which are not eligible for the NYS tax credit) are not as mobile, have lower budgets, and their location decisions are not as tied to the availability of incentive programs.
• The access of the standalone post-production incentive has had a major impact on the post-production industry in NYS and has allowed it to compete with other states.
• Conversations with ESD offi cials highlighted the many productions that are being shot outside of New York City in places such as Rochester, the Adirondacks, the Capital Region, Long Island, and beyond. The offi cials reported the spending that occurs in the local economy as a result of these types of productions includes spending on local restaurants/catering, lodging, dumpsters, equipment rentals, local contractors, site rentals, police, local labor, and other. Some of the productions that were highlighted include: Teenage Mutant Ninja Turtles (Tupper Lake, NY), Muhammad Ali’s Greatest Fight (Capital Region), The Amazing Spider-Man 2 (Rochester), The Place Beyond the Pines (Schenectady), and others. These types of productions have a major impact on the local economy and can really provide a boost to goods and service providers. For example, The Amazing Spider-Man 2 brought in over $2 million in new spending to the Rochester economy and Teenage Mutant Ninja Turtles brought in over $1 million to Tupper Lake. In Tupper Lake, one deli did the catering daily for the three month shoot of Teenage Mutant Ninja Turtles and with the additional income
Economic & Fiscal Impact Analysis of New York State Film Tax Credit Programs | January 2017 9
ECONOMIC IMPACT OF THE FILM INDUSTRYAvailability of the New York State fi lm industry tax credit programs (both the production and post-production credit) has resulted in the industry spending signifi cant amounts of money throughout the state. Expenditures on labor, equipment, construction, lodging, food, transportation, and many other expenses are the “Direct Impact” of the fi lm industry tax credit program. “Indirect Impacts” occur as the businesses supplying directly to the fi lm industry make purchases from second-tier suppliers, those second-tier suppliers make purchases from third-tier suppliers, and so on, back through the supply chain. Another component of indirect impacts are induced impacts—those impacts that occur as employees, both those in the fi lm industry and those working for fi lm industry suppliers—spend their wages in the economy. Together, direct, indirect, and induced impacts comprise the total economic impact of the fi lm industry on New York State.
MethodologyEmpire State Development provided Camoin Associates with production and post-production spending fi gures for credit-eligible projects scheduled to be produced during 2015 and 2016. These were projects for which tax credit applications had been submitted as of December 2016. A production credit-eligible project
was included in the analysis if its photography start date was in 2015 or 2016. A post-production credit-eligible project was included if its post-production start date was in either of these years.
There are three stages of the application process: submission of the initial application, submission of the fi nal application, and audit of the fi nal application. Because many of the projects included in the analysis have not yet completed production, complete fi nal audited spending data was not yet available. As a result, Camoin Associates relied on the most current data available for each project. For projects in the fi rst stage, we used project spending estimates provided by the applicant, and for projects in the second phase we used actual unaudited data on project spending provided by the applicant. Actual audited data on project spending was used for projects in the third phase of the application process.
was able to upgrade their operation into a fully functioning bar and restaurant. As productions outside of NYC become more common the workforce and infrastructure will continue to build and be even more attractive to productions looking for unique settings and landscapes.
Modeling SoftwareEconomic Modeling Specialists, Intl. (EMSI) designed the input-output model used in this analysis. The EMSI model allows the analyst to input the amount of new direct economic activity (spending, earnings, or jobs) occurring within the study area and uses the direct inputs to estimate the spillover effects that the net new spending, earnings, or jobs have as these new dollars circulate through the study area’s economy. This is captured in the indirect impacts and is commonly referred to as the “multiplier effect.” See Attachment A for more information on economic impact analysis.
Defi nition of a “Job”A “job” is equal to one person employed for some amount of time (part-time, full-time, or temporary) during 2015 or 2016. For example, if a person is employed full-time in 2015 and 2016 that would be considered two jobs. Another example is if one person is employed part-time for four months, then takes two months off and is hired again for four months that would be counted as two jobs.
The information must be calculated in this way as a result of the way the job information is reported by the Quarterly Census of Employment and Wages (QCEW), Bureau of Labor Statistics (BLS), and Bureau of Economic Analysis (BEA). The information is provided by the employers to the government in terms of total jobs, not by total number of total full-time equivalents (FTE).

Economic & Fiscal Impact Analysis of New York State Film Tax Credit Programs | January 201710
Production and post-production spending by credit-eligible projects falls into two categories: qualifi ed and non-qualifi ed costs. Qualifi ed costs refer to production costs to which the tax credit can be applied and include most “below-the-line” expenditures, such as costs for technical and crew production, use of fi lm production facilities, props, makeup, wardrobe, non-speaking background extras, fi lm processing, camera, sound recording, set construction, lighting, shooting, editing, and meals. Non-qualifi ed costs include “above-the-line” expenditures, such as story and script costs and wages for writers, directors, producers, actors, and performers.
While only qualifi ed costs are eligible for the fi lm tax credit, non-qualifi ed costs incurred in New York State were also included in the analysis because the State would not have benefi ted from this non-qualifi ed spending without the tax credit being in place. In other words, the economic benefi ts derived from non-qualifi ed spending are entirely contingent on the qualifi ed spending incentivized by the tax credit program. Therefore, any production and post-production spending occurring in New York State, whether qualifi ed or non-qualifi ed, was included in the analysis.
The following sections detail the economic impacts of the production and post-production tax credits on New York State as a whole, and by region. For the production credit, there are additional benefi ts granted to projects for spending that occurs outside of New York City. We show separate economic impacts for New York City and the rest of New York State. For the post-production credit, the geographic distinctions are different. The state is divided into Downstate and Upstate regions, with Downstate corresponding to the Metropolitan Commuter Transportation District (MCTD)13, and Upstate consisting of the remaining New York State counties.
Production Tax CreditTable 5 shows aggregate spending in New York State in 2015 and 2016 associated with the production credit, as reported in tax credit applications. In total, credit-eligible projects accounted for over $6.3 billion in in-state spending. The vast majority of that amount—91%—occurred in New York City.
Economic Impact of the Production Credit on New York StateThe $6.3 billion in direct spending was inputted into the input-output model to generate the total impacts on the state in terms of jobs, earnings, and spending. Over the two-year period covering 2015 and 2016, Camoin Associates estimates the following impacts associated with the production tax credit (Table 6):
• Approximately 68,400 jobs in New York State, of which about 33,000 were directly related to production activities and 35,000 were a result of indirect economic activity.
• Approximately $4.1 billion in earnings by New York State workers, of which $1.9 billion was directly attributable to production activities and $2.1 billion was a result of indirect activity.14
• Approximately $12.2 billion in spending in the New York State economy, of which about $6.3 billion was direct spending by credit-eligible projects and about $5.8 billion was indirect spending.15
13 Downstate is defi ned as the Metropolitan Commuter Transportation District (MCTD), which consists of the fi ve boroughs of NYC, as well as Dutchess, Nassau, Orange, Putnam, Rockland, Suffolk, and Westchester counties. Upstate consists of the remaining counties in New York State.14 Note that the EMSI model provides the total number of jobs, whether they are part-time, full-time or temporary. This is particularly important to note as it relates to the fi lm industry
in which there are many temporary jobs. While the model estimates average earnings per worker of $58,500, note that this includes the full range of employment from workers who may have worked only a portion of the year to those holding full-time jobs. 15 Note that the earnings impact is also captured in the spending impact. As the production companies spend money on labor they are creating additional earnings.
Table 5: Spending in NYS Associated with Production Credit (2015 & 2016)
NYC Productions $5,741,736,536
NYS Outside NYC Productions $575,623,130
Total $6,317,359,666Source: Empire State Development

Economic & Fiscal Impact Analysis of New York State Film Tax Credit Programs | January 2017 11
Table 6: Production Credit - Impact on New York State (2015 & 2016)
Direct Indirect Total
Jobs 33,028 35,340 68,368
Earnings $1,932,227,332 $2,144,772,338 $4,076,999,670
Spending $6,317,359,666 $5,834,452,283 $12,151,811,949
Source: Empire State Development, EMSI, Camoin Associates
Table 7: Production Credit - Impact of NYC Productions on NYC (2015 & 2016)
Direct Indirect Total
Jobs 26,285 22,342 48,627
Earnings $1,750,094,438 $1,575,084,995 $3,325,179,433
Spending $5,741,736,536 $4,267,468,019 $10,009,204,555
Source: Empire State Development, EMSI, Camoin Associates
Economic Impact of the Production Credit on New York CityA separate model was run to estimate the impact on New York City of NYC productions receiving production credits. Over the two-year period covering 2015 and 2016, Camoin Associates estimates the following impacts on New York City associated with the production tax credit (Table 7):
• Approximately 48,600 jobs in New York City, of which about 26,300 were directly related to production activities and 22,300 were a result of indirect economic activity.
• Approximately $3.33 billion in earnings by New York City workers, of which $1.75 billion was directly attributable to production activities and $1.58 billion was a result of indirect activity.
• Approximately $10.0 billion in spending in the New York City economy, of which about $5.7 billion was direct spending by credit-eligible projects and about $4.3 billion was indirect spending.
Economic Impact of the Production Credit on New York State outside of New York CityA third model was run to estimate the impact of productions outside of New York City receiving the production credit on the rest of New York State outside of New York City. Over the two-year period covering 2015 and 2016, Camoin Associates estimates the following impacts associated with the production tax credit (Table 8):
• Approximately 7,500 jobs in the rest of New York State, of which about 4,900 were directly related to production activities and 2,600 were a result of indirect economic activity.
• Approximately $298 million in earnings, of which $176 million was directly attributable to production activities and $122 million was a result of indirect activity.
• Approximately $897 million in spending, of which about $576 million was direct spending by credit-eligible projects and about $321 million was indirect spending.

Economic & Fiscal Impact Analysis of New York State Film Tax Credit Programs | January 201712
Post-Production Tax CreditTable 9 shows aggregate spending in New York State in 2015 and 2016 associated with the post-production credit, as reported in tax credit applications. In total, credit-eligible projects accounted for close to $226 million in in-state spending. The overwhelming majority of that amount—almost 99%—occurred in Downstate New York.
Economic Impact of the Post-Production Credit on New York StateThe $226 million in direct spending was inputted in to the input-output model to generate the total impacts on the state in terms of jobs, earnings, and spending. Over the two-year period covering 2015 and 2016, Camoin Associates estimates the following impacts associated with the post-production tax credit (Table 10):
• Approximately 2,400 jobs in New York State, of which about 1,200 were directly related to production activities and 1,300 were a result of indirect economic activity.
• Approximately $146 million in earnings by New York State workers, of which $69 million was directly attributable to production activities and $77 million was a result of indirect activity.
• Approximately $434 million in spending in the New York State economy, of which about $226 million was direct spending by credit-eligible projects and about $209 million was indirect spending.
Table 8: Production Credit - Impact of Productions Outside of NYC on NYS Outside of NYC (2015 & 2016)
Direct Indirect Total*
Jobs 4,905 2,599 7,504
Earnings $176,188,672 $121,570,183 $297,758,855
Spending $575,623,130 $321,103,916 $896,727,046
Source: Empire State Development, EMSI, Camoin Associates
Table 9: Spending in NYS Associated with Post-Production Credit (2015 & 2016)
Downstate Activity $223,119,915
Upstate Activity $2,752,558
Total $225,872,473Source: Empire State Development
*Note that the impacts estimated by the individual models for New York City and the rest of
New York State do not sum to the total impacts estimated by the New York State model. This
is because the individual models are not able to take into account the economic exchanges
between the two sub-regions. In other words, the model assessing the impact on NYC is
only measuring the impact of NYC productions on NYC and therefore it does not account
for the impact of NYC productions on other NYS locations, and vice versa. The economic
exchanges between the two sub-regions accounts for the difference of 12,237 jobs in New
York State and associated earnings and spending.
Photo provided by Empire State Development
New York Governor Andrew M. Cuomo announces the completion of Silvercup North, a new fi lm and television production facility in the South Bronx.

Economic & Fiscal Impact Analysis of New York State Film Tax Credit Programs | January 2017 13
Table 10: Post-Production Credit - Impact on New York State (2015 & 2016)
Direct Indirect Total
Jobs 1,181 1,263 2,444
Earnings $69,085,344 $76,684,731 $145,770,075
Spending $225,872,473 $208,606,477 $434,478,950
Source: Empire State Development, EMSI, Camoin Associates
Table 11: Post-Production Credit - Impact of Downstate NY Activity on Downstate NY (2015 & 2016)
Direct Indirect Total
Jobs 1,071 1,125 2,196
Earnings $68,257,876 $74,401,084 $142,658,960
Spending $223,119,915 $201,445,340 $424,565,255
Source: Empire State Development, EMSI, Camoin Associates
Economic Impact of the Post-Production Credit on DownstateA second model was run to estimate the impact of the post-production credit on Downstate New York. Over the two-year period covering 2015 and 2016, Camoin Associates estimates the following impacts on Downstate associated with the post-production tax credit (Table 11):
• Approximately 2,200 jobs in Downstate, of which about 1,100 were directly related to production activities and 1,100 were a result of indirect economic activity.
• Approximately $143 million in earnings by Downstate workers, of which $68 million was directly attributable to production activities and $74 million was a result of indirect activity.
• Approximately $425 million in spending in the Downstate economy, of which about $223 million was direct spending by credit-eligible projects and about $201 million was indirect spending.
Economic Impact of the Post-Production Credit on UpstateA fi nal model was run to estimate the impact of the post-production credit on Upstate New York. Over the two-year period covering 2015 and 2016, Camoin Associates estimates the following impacts on Upstate associated with the post-production tax credit (Table 12):
• Approximately 50 jobs in Upstate New York, of which about 35 were directly related to production activities and 14 were a result of indirect economic activity.
• Approximately $1.4 million in earnings, of which $840,000 was directly attributable to production activities and $563,000 was a result of indirect activity.
• Approximately $4.2 million in spending, of which about $2.8 million was direct spending by credit-eligible projects and about $1.5 million was indirect spending.

Economic & Fiscal Impact Analysis of New York State Film Tax Credit Programs | January 201714
Table 12: Post-Production Credit - Impact of Upstate NY Activity on Upstate NY (2015 & 2016)
Direct Indirect Total*
Jobs 35 14 49
Earnings $840,054 $562,836 $1,402,890
Spending $2,752,558 $1,491,292 $4,243,850
Source: Empire State Development, EMSI, Camoin Associates
Table 13: Production & Post-Production Credit - Total Economic Impact on New York State (2015 & 2016)
Direct Indirect Total
Jobs 34,209 36,603 70,812
Earnings $2,001,312,675 $2,221,457,070 $4,222,769,745
Spending $6,543,232,139 $6,043,058,760 $12,586,290,898
Source: Empire State Development, EMSI, Camoin Associates
Total Economic Impact of the Film Tax Credit Program on New York StateThe table above shows the combined impact of both the production and post-production tax credits on all of New York State. Over the two-year period covering 2015 and 2016, Camoin Associates estimates the following impacts on the State associated with the credits (Table 13):
• Approximately 70,800 jobs in New York State, of which about 34,200 were directly related to production activities and 36,600 were a result of indirect economic activity.
• Approximately $4.2 billion in earnings, of which $2.0 billion was directly attributable to production activities and $2.2 billion was a result of indirect activity.
• Approximately $12.6 billion in spending, of which about $6.5 billion was direct spending by credit-eligible projects and about $6.0 billion was indirect spending.
Additional Economic ActivityThe New York State fi lm industry tax credit programs have an impact beyond just what is calculated in the above sections. These additional impacts include: (a) support of fi lm industry cluster-specifi c workforce and infrastructure development, and (b) fi lm production-induced tourism. These impacts are not accounted for in the above economic impact calculations, but nevertheless have an impact on the fi lm industry and the NYS economy.
Film Industry Workforce and Film Production Infrastructure DevelopmentThe fi lm industry is clearly an important industry cluster for NYS. As with all clusters, there is a virtuous self-reinforcing cycle where groupings of like-minded businesses, workers and infrastructure serve to perpetuate the advantages of doing business in that location.
For example, as more productions occur in NYS, there are more employment opportunities, the skill levels of the overall workforce is improved, and the industry as a whole benefi ts. As new productions come up, they
*Note that the impacts estimated by the individual models for New York City and the rest of
New York State do not sum to the total impacts estimated by the New York State model. This
is because the individual models are not able to take into account the economic exchanges
between the two sub-regions.

Economic & Fiscal Impact Analysis of New York State Film Tax Credit Programs | January 2017 15
have access to the high-quality workforce that has been built through the years.
Since the credit program was introduced, employment in the fi lm industry in NYS is up by 49%, from 32,533 jobs in 2004 to 48,581 jobs in 2015, according to data from the Bureau of Labor Statistics. This is compared to a 9% increase in jobs in the state’s economy overall. Table 14 highlights the top 10 occupations in the industry and how much they have grown since 2004.
Producers and Directors comprise the largest share
of fi lm industry jobs, accounting for about 20%
of jobs, followed by Actors with 10% of jobs, and
Film and Video Editors with 9%. All 10 occupations
experienced at least 30% job growth over this period.
In general, NYS fi lm industry jobs are relatively high-
paying, with over 70% of industry jobs in occupations
with a median hourly wage higher than the economy-
wide median ($24.34).
Teenage Mutant Ninja Turtles: Out of the Shadows shooting in Buffalo in Spring 2015.Photo provided by Empire State Development

Economic & Fiscal Impact Analysis of New York State Film Tax Credit Programs | January 201716
Table 14: Top 10 Occupations in the Film Industry
SOC Description
Employedin Film
Industry (2014)
Employedin Film
Industry (2016)
Change(2004 –2016)
% Change(2004 –2016)
% of Total Jobs
in Film Industry (2016)
Median Hourly
Earnings
Typical EntryLevel Education
27-2012 Producers and Directors 6,854 12,014 5,160 75% 20% $41.11 Bachelor’s Degree
27-2011 Actors 3,702 6,028 2,326 63% 10% $30.56 Some college, no degree
27-4032 Film and Video Editors 3,107 5,307 2,200 71% 9% $30.69 Bachelor’s Degree
27-4011Audio and Video Equipment Technicians
1,393 2,163 770 55% 4% $23.77 Post-secondary non-degree award
43-9061 Offi ce Clerks, General 1,469 2,105 636 43% 4% $14.76
High School Diploma or equivalent
27-4031Camera Operations, Television, Video, and Motion Picture
1,291 1,699 408 32% 3% $25.40 Bachelor’s Degree
53-7062
Laborers and Freight, Stock, and Material Movers, Hand
1,117 1,550 433 39% 3% $12.34No formal educational credential
27-1014 Multimedia Artists and Animators 1,141 1,495 354 31% 3% $21.98 Bachelor’s degree
27-3041 Editors 912 1,335 423 46% 2% $31.93 Bachelor’s degree
43-5061Production, Planning, and Expediting Clerks
746 1,233 487 65% 2% $24.17High School Diploma or equivalent
Source: EMSI
Several workforce training programs have been implemented in response to New York’s burgeoning fi lm industry. For example, in collaboration with the New York City Department of Education and the Tribeca Film Festival, the Offi ce of Media and Entertainment has implemented a curriculum for elementary, middle, and high school students to learn about media arts in the classroom. In 2015 Brooklyn College’s Barry R. Feirstein Graduate School of Cinema will begin offering a cinema graduate program located at Steiner Studios at the Brooklyn Navy Yard. Also at Steiner Studios will be a technology-focused media and design program offered by Carnegie Mellon University. Working with the City of New York, non-profi t Brooklyn Workforce Innovations developed the “Made in NY” program which recruits unemployed New Yorkers for jobs in the
fi lm industry, offering a training program that leads to
certifi cation and job placement.
The requirement of the tax credit program that
productions must use qualifi ed production facilities
has created increased demand and limited vacancy at
soundstages and the need for new infrastructure to be
built. An article by Addie Morefoot called “Stage Might”
reports on the challenges facing productions looking
to fi nd good-quality stage space in the NYC metro
area that provides the desired amenities. As the fi lm
industry has grown in the area the demand for space has
increased and producers have found it more and more
diffi cult to fi nd adequate space in the last few years. The
growth of the production industry (specifi cally television
production) has created a situation where soundstages

Economic & Fiscal Impact Analysis of New York State Film Tax Credit Programs | January 2017 17
are in high demand and property owners are investing millions of dollars in new and renovated stages. The article says “Established studios are furiously expanding throughout the fi ve boroughs, while newcomers are converting industrial spaces in the city and in northern suburbs into stages. Even entrepreneurs farther upstate are angling for a piece of the action”. The article goes on to say the uncertainty of the future of the fi lm tax credit has made developers uneasy and the loss of this credit would result in “ninety percent of the facilities” closing. Some of the new investments to quickly respond to the demand are conversions of old warehousing spaces, however these facilities do not have the amenities of the more established soundstages like Broadway Stages, Steiner Studios, Kaufman Astoria, and Silvercup Studios which have offi ces, dressing rooms, and other support services that are professionally run and managed.
Some of the expansions and developments that have occurred recently to accommodate the growing fi lm production industry include:
• Silvercup Studios opened a $35 million, three-soundstage facility in the South Bronx to be known as Silvercup North.16
• Kaufman Astoria Studios announced that it would be building two new soundstages to bring their total number of stages up to 12.17
• Broadway Stages operates over 20 stages in Brooklyn and Queens and they plan to invest $20 million to renovate the Arthur Kill Correctional Facility on Staten Island.18
• Steiner Studios is adding six stages to their Brooklyn Navy Yard lot and they intend to add another 10 to reach 40 total stages at their facility.19
• Grumman Studios is undergoing a major renovation of their stages in Bethpage, NY.19
• York Stages announced plans to invest $44 million in a 300,000 square foot facility in the Bronx.21
• The Molecule, a creative studio specializing in visual effects, motion graphics, virtual reality, production, and interactive installations, expanded their staff by 20 full-time staff and 30 additional freelancers in 2015. In addition to adding staff they relocated their headquarters in order to have more space and be able to accommodate up to 120 employees.22, 23
• Vice Media, a youth media company and content creation studio, has grown from 400 employees in 2014 to over 700 employees in 2016 and is on track to reaching 925 employees by 2019.24
• Phosphene, a visual effects and design company, moved to Lower Manhattan and has tripled in size. In addition to growing their staff they are also participating in the Post NY Alliance’s Post Production Fellows Program by bringing on interns.25
• The Harbor Picture Company opened Harbor Grand in September 2015 to be the largest theatric mix stage in New York City. This new facility will create or retain 65 jobs in New York that otherwise were considering relocating to Georgia or California.26
These are just a selection of the investments that have been made in the hard infrastructure of the fi lm industry in NYS. While the development of this infrastructure is a great benefi t to productions looking to locate in New York State, information learned from interviews suggests that simply having the infrastructure is not enough to counteract the fi nancial incentive of tax credit programs elsewhere and that the infrastructure must be combined with the NYS tax incentive program.
16 Morefoot, 201617 Morefoot, 201618 Morefoot, 201619 Morefoot, 201620 Governor’s Offi ce of Motion Picture & Television Production, 201521 Governor’s Offi ce of Motion Picture & Television Development, 2015
22 Governor’s Offi ce of Motion Picture & Television Development, 201623 Governor’s Offi ce of Motion Picture & Television Development, 201624 Governor’s Offi ce of Motion Picture & Television Development, 201625 Governor’s Offi ce of Motion Picture & Television Development, 201626 Governor’s Offi ce of Motion Picture & Television Development, 2015

Economic & Fiscal Impact Analysis of New York State Film Tax Credit Programs | January 201718
Table 15: Economic Impact on NYS of Losing 10% of Ineligible Production Activity
Direct Indirect Total
Jobs 8,690 21,254 29,944
Earnings $960,167,366 $1,296,225,945 $2,256,393,311
Spending $4,327,300,293 $3,624,943,758 $7,952,244,051
Source: Empire State Development, EMSI, Camoin Associates
27 As noted above, non-eligible productions exclude non-scripted fi lm production such as documentaries and news broadcasts. 28 A review of the industries that make up the direct jobs generated as a result of the tax credit program fi nd that 8,500 are in the NAICS codes associated with the television and fi lm industry as listed in footnote 10.29 8,690 jobs was used as an input into the model. 8,690 = 51,908 * 84% * 10% * 2, where 51,908 is the total number of NYS fi lm industry jobs, 84% is the share of those
However, there are a host of non-eligible fi lm productions27 that currently occur in NYS that are largely a result of the virtuous cycle of the fi lm industry’s economic cluster in the state. In fact, these non-eligible productions account for a majority of the employment in the fi lm industry cluster in NYS. Therefore, eligible productions that occur in the state due to the tax credit program are serving to maintain the viability of the economic cluster. Said another way, should NYS abandon its incentive programs and thus precipitate a departure of a portion of the cluster, the entire cluster is weakened, including the non-eligible jobs.
Quantifying this effect is extremely problematic and, at best, imprecise. Of the 51,908 New York State fi lm industry jobs in 2016, approximately 8,50028 (about 16%) are directly attributable to the tax credit program, while the remaining 84% are therefore associated with non-eligible productions. To best understand the effect of losing non-eligible production activity on an order-of-magnitude basis, we will simply note that if NYS had shed even 10% of the cluster jobs associated with non-eligible production over the 2015–2016 period, it would have lost a total of 29,944 jobs, nearly $2.3 billion in earnings, and nearly $8 billion in spending (Table 15).29
Lost tax collections by New York State and New York City as a result of losing 10% of credit non-eligible production activity would total $1 billion (Table 16).30
Film Production Induced TourismBoth quantitative and qualitative research suggests that the fi lm industry has a positive impact on tourism, as people want to visit the places they have seen in fi lm and television. Film-induced tourism can take a number of different forms ranging from tourists extending their stay at a destination to visit different sites featured in a movie or television show, to distinct visits to a location or country to see where the fi lm was made, to visitors traveling to see where a fi lm or television show is currently being made. All of this visitation generates revenue and employment that otherwise would not exist without the connection to the fi lm industry.
A study conducted on tourism in Australia, New Zealand, and Kazakhstan after releases of movies that are either set or fi lmed in those locations (Mad Max, The Lord of the Rings, and Borat, respectively) found that there was evidence of an increase in tourism for a period following the release of a successful movie.31 Additional research confi rms the fi nding that television and movies can have a strong infl uence on the tourism industry.32
Table 16: Fiscal Impact of Losing 10% of Ineligible Production Activity
New York State Tax Collections $431,786,246
New York City Tax Collections $577,434,893
Total $1,009,221,139Source: Camoin Associates
jobs associated with credit non-eligible activity, 10% is the hypothetical amount of lost non-eligible activity, and 2 is the number of years in the 2015–2016 period. The source for 2016 job fi gures is EMSI.30 Calculated using the proportion of Gross State Product (or Gross Regional Product) method as detailed in Fiscal Impact of the Film Industry section below. In calculating tax collections for New York City, we assumed that 93.4% of lost activity would be attributable to New York City, as New York City accounts for that amount of total industry sales.

Economic & Fiscal Impact Analysis of New York State Film Tax Credit Programs | January 2017 19
Examples of fi lm induced tourism include:
• Field of Dreams – The movie Field of Dreams starring Kevin Costner and James Earl Jones was fi rst released in 1989 and portrays a story about a baseball fi eld in rural Iowa. Since the movie was released, the site where Universal Studios built the baseball fi eld has remained relatively untouched and attracted hundreds of thousands of tourists. Some changes are being proposed for the site by the new owners that would maintain the original fi eld but would add additional fi elds to host tournaments and other events and bring in even more people.33, 34
• Twilight Trilogy – Before the Twilight trilogy, Forks, Washington’s claim to fame was that it was the rainiest town in the United States. Now the Forks Chamber of Commerce is capitalizing on the intense fan base and success of the fi lm by promoting the town’s role in the fi lm and hosting tours and other special events like Stephenie Meyer Day/Bella’s Birthday weekend, marketed as an annual event with attractions, entertainment, and vendors geared towards celebrating Twilight.35
• The Millennium Effect – The Millennium series, of which The Girl with the Dragon Tattoo is the fi rst fi lm of three, has had a signifi cant impact on Sweden once the book was turned into a mega-hit blockbuster movie. The majority of the fi lm was shot in the capital city regions and exposed over 20 million people worldwide to the landscapes and architecture of Stockholm and Sweden. The success of this movie has impacted tourism with more than 10,000 tourists a year taking the guided tour and another 6,000 copies of the Millennium map being sold.36
• New York State Film Industry Tourism – New York City is home to both one of the largest fi lm industries and tourism industries in the world and these two industries complement each other well
when tourists are able to visit the locations of scenes they are familiar with from television and movies. Tour companies are capitalizing on visitors’ interest in these sites by organizing and promoting various tours to locations made familiar by shows such as Sex and the City, Friends, Seinfeld, and others. Additionally, live shows that fi lm in New York City are also an attraction as people come to see Saturday Night Live, The Tonight Show, The Today Show, and many others fi lmed live.
It is clear that the robust fi lm industry in NY supports the tourism industry in NYC; however, estimating the degree to which fi lm is the driving factor for visitation is outside the scope of this analysis. In an attempt to better understand how the loss of the fi lm industry would impact the tourism industry we can conduct an order-of-magnitude assessment to provide an estimate for how the tax credit programs impact tourism industry employment. According to Empire State Development, there are over 395,020 jobs in New York City that are associated with the tourism industry. If we assume that fi lm-induced tourism accounts for 1%37 of total tourism in New York City, this would support 3,950 tourism jobs. If 15% of the jobs in the fi lm industry are attributable to the tax credit programs (as calculated above), then we can assume that 15% of the 3,950 tourism jobs are also attributable to the tax credit programs. Based on this order-of-magnitude estimate, the tax credit programs account for approximately 545 jobs in the tourism industry in NYC (Table 17).
31 Mitchell & Stewart, 201232 http://www.bu.ac.th/knowledgecenter/epaper/jan_june2009/pdf/Walaiporn.pdf33 Belson, 201134 Doster, 2014
35 Twilight, 201436 Cloudberry Communications , 201137 This is just an estimate to provide an order-of-magnitude analysis. No surveys or other research has been done to qualify this percentage.
Table 17: Estimate of the Impact of Tax Credit Programs on Film Induced Tourism in NYC
Total Tourism Related Jobs in NYC 395,020
Film Induced Tourism Job (1% of total) 3,950
Percent of Film Industry Resulting from Tax Credit Programs 16%
Film Induced Tourism Jobs Resulting from Tax Credit Programs 644
Source: Empire State Development, Camoin Associates

Economic & Fiscal Impact Analysis of New York State Film Tax Credit Programs | January 201720
FISCAL IMPACT OF THE FILM INDUSTRY Beyond the economic impacts previously calculated,
there are also fi scal impacts of the fi lm industry that
result from increased economic activity and accrue
in the form of additional tax revenue. To estimate
tax collections, Camoin Associates calculated the
proportion of fi lm production spending associated with
credit-eligible products relative to New York State’s
Gross State Product in 2015. This percentage was
then applied to New York State’s total tax collections
in 2015 for each tax category to determine the portion of tax collections attributable to the fi lm tax credit program.38 This methodology is based on the assumption that the share of credit-related fi lm industry spending relative to the NYS Gross State Product is approximately equal to the share of NYS tax collections attributable to the tax credit program. In other words, the fi lm industry activity makes up a certain percentage of the state’s total economic activity and therefore the fi lm industry accounts for a similar percentage of the state’s revenue. Table 18 details this calculation.
Camoin Associates estimates total tax collections by New York State in 2015 and 2016 resulting from the Production Tax Credit to be about $660 million, and tax collections resulting from the Post-Production Credit to be about $24 million (Table 19).
38 New York State total tax collections obtained from 2015 Annual Survey of State Government Tax Collections.
Table 18: Project Spending as a Percent of Gross State Product (GSP)
NYS 2015 Gross State Product (GSP) $1,441,003,000,000
Project Spending Percent of GSP
Production Credit $12,151,811,949 0.84%
Post-Production Credit $434,478,950 0.03%
Source: Bureau of Economic Analysis, Empire State Development, Camoin Associates
Table 19: Fiscal Impact on New York State
A B C
2015 NYS Tax CollectionsTax Collections Attributable
to Production Credit (Col. A x 0.84%)
Tax Collections Attributable to Post-
Production Credit (Col. A x 0.03%)
Individual Income Tax $43,713,484,000 $368,630,764 $13,180,117
Corporate Income Tax $5,084,187,000 $42,874,362 $1,532,941
General Sales Tax $13,104,421,000 $110,508,070 $3,951,133
Selective Sales Tax $10,865,420,000 $91,626,833 $3,276,049
License Taxes $1,764,149,000 $14,876,865 $531,911
Other Taxes $3,711,068,000 $31,295,008 $1,118,930
Total $78,242,729,000 $659,811,901 $23,591,081Source: 2015 Annual Survey of State Government Tax Collections, Camoin Associates

Economic & Fiscal Impact Analysis of New York State Film Tax Credit Programs | January 2017 21
Table 21: Estimated Credit Payouts for 2015 and 2016 Projects
2016 2017 2018 2019 2020 NPV of Payout
Production Credit $164,539,672 $378,567,192 $415,664,256 $275,435,103 $100,317,318 $1,298,902,333
Post-Production Credit $7,785,121 $29,806,059 $17,640,614 $1,328,122 $725,414 $56,227,345
Source: Empire State Development
To determine the Return on Investment of the tax credit
program, Camoin Associates compared total New York
State tax collections in 2015 and 2016 attributable to the
credit programs to the total credit amount projected
to be issued for projects initiated during this period.
New York State will issue an estimated $1.45 billion in
production and post-production tax credits to projects
initiated in 2015 and 2016 (Table 20).
Tax credits are paid out according to the following
schedule: for distributions of less than $1 million, the
credit is typically paid out in the year following project
completion. For distributions valued between $1 and
$5 million, the Credit is paid out in equal sums over the
two years following project completion. For distributions
of over $5 million dollars, the credit is paid out in equal
sums over the three years following project completion.
Applying a discount rate of 1.5%39 to the payout schedule
results in a net present value (NPV) of $1,298,902,333
for the production credit and $56,227,345 for the post-
production credit (Table 21).
As shown in Tables 22 and 23, Camoin Associates
estimates the return on investment (ROI) ratio of the
Production Credit for the State of New York to be 0.49.
In other words, for every $1 of tax credits paid out on
an NPV basis, the State receives $0.51 in return in the
form of tax collections. The State’s ROI for the Post-
Production tax credit is $0.42 for every dollar of incentive.
To arrive at the amount of taxes collected by New York City as a result of the fi lm credit program, Camoin Associates used the same methodology that was used for NYS.40 As detailed in Table 24 and Table 25, an estimated $755 million in taxes were collected that can be attributed to the program. Note that we imputed NYC post-production spending under the assumption that the NYC share of NYS post-production spending was similar to its share of production spending (about 91%).41
Camoin Associates also estimated tax collections by local taxing jurisdictions in New York State other than New York City. This includes counties, cities, towns, special districts, and school districts outside of NYC. Over $113 million in tax revenues can be attributed to these jurisdictions (Table 26 and Table 27).42
When combining the tax benefi ts accrued to NYS and local jurisdictions, the ROI ratio for the production
Table 20: Tax Credits Issued
Production Credits $1,388,161,657
Post-Production Credits $59,753,414
Total $1,447,915,071Source: Empire State Development
Table 22: Production Credit - Return on Investment
New York State Tax Collections $659,811,901
NPV of Estimated Production Credit Payout $1,298,902,333
Return on Investment Ratio 0.51Source: Empire State Development, Camoin Associates
Table 23: Post-Production Credit - Return on Investment
New York State Tax Collections $23,591,081
NPV of Estimated Production Credit Payout $56,227,345
Return on Investment Ratio 0.42Source: Empire State Development, Camoin Associates
39 Corresponds to the 5-year treasury yield.40 New York City GRP was obtained from EMSI, and total New York City tax collections were obtained from the New York Independent Budget Offi ce.41 Post-production spending fi gures are not directly available for New York City, as post-
production spending is divided into Upstate and Downstate spending.42 2015 total tax collections by local governments was estimated by adjusting the 2013 value from the US Census of Governments to refl ect the change in NYS tax collections between 2013 and 2015.

Economic & Fiscal Impact Analysis of New York State Film Tax Credit Programs | January 201722
Table 24: Project Spending as a Percent of NYC Gross Regional Product (GRP)
NYC 2015 Gross Regional Product (GRP) $738,446,000,000
Project Spending Percent of GRP
Production Credit $10,009,204,555 1.36%
Post-Production Credit $394,890,238 0.05%
Source: EMSI, Empire State Development, Camoin Associates
Table 26: Project Spending as a Percent of Gross Regional Product (GRP) of NYS Outside of NYC
NYS (balance) 2015 Gross Regional Product (GRP) $702,557,000,000
Project Spending Percent of GRP
Production Credit $2,142,607,394 0.305%
Post-Production Credit $39,558,712 0.006%
Source: EMSI, Empire State Development, Camoin Associates
Table 25: Fiscal Impact on New York City
A B C
FY 15–16 NYS Tax Collections
Tax Collections Attributable to Production Credit
(Col. A x 1.36%)
Tax Collections Attributable to Post-
Production Credit (Col. A x 0.05%)
Real Estate Tax $23,180,583,000 $314,199,274 $12,396,013
Personal Income Tax $11,392,473,000 $154,418,323 $6,092,221
Sales and Use Tax $8,540,154,000 $115,756,803 $4,566,920
Income Taxes, Other $6,947,614,000 $94,170,853 $3,715,295
Other Taxes $3,559,825,000 $48,251,350 $1,903,646
Total $53,620,649,000 $726,796,603 $28,674,095Source: New York Independent Budget Offi ce, Camoin Associates
Table 27: Fiscal Impact on New York State Outside of New York City
A B C
2015 NYS Tax Collections by NYS Local
Governments (except NYC)
Tax Collections Attributable to Production Credit
(Col. A x 0.305%)
Tax Collections Attributable to Post-
Production Credit (Col. A x 0.006%)
All Taxes $36,472,927,957 $111,232,491 $2,055,230
Source: US Census State and Local Government Finances, Camoin Associates

Economic & Fiscal Impact Analysis of New York State Film Tax Credit Programs | January 2017 23
credit is 1.15. In other words, for every $1 NYS pays in incentives, NYC receives about $0.56, other local governments receive $0.09, and NYS receives $0.51 in tax revenue (Table 28).
The ROI for the post-production credit is 0.97, meaning that for every $1 of tax credits issued, NYC receives $0.51, other local jurisdictions receive $0.04, and NYS receives $0.42 in tax revenue (Table 29).
Table 28: Production Credit - Return on Investment
New York State Tax Collections $659,811,901
New York City Tax Collections $726,796,603
All Other NYS Local Gov’t Tax Collections $111,232,491
Combined Tax Collection $1,497,840,995
NPV of Estimated Production Credit Payout $1,298,902,333
Return on Investment Ratio 1.15Source: Camoin Associates
Table 29: Post-Production Credit - Return on Investment
New York State Tax Collections $23,591,081
New York City Tax Collections $28,674,095
All Other NYS Local Gov’t Tax Collections $2,055,230
Combined Tax Collection $54,320,406
NPV of Estimated Production Credit Payout $56,227,345
Return on Investment Ratio 0.97Source: Camoin Associates

Economic & Fiscal Impact Analysis of New York State Film Tax Credit Programs | January 201724
ATTACHMENT A: WHAT IS AN ECONOMIC IMPACT ANALYSIS?The purpose of conducting an economic impact study is to ascertain the total cumulative changes in employment, earnings, and output in a given economy due to some initial “change in fi nal demand”. To understand the meaning of “change in fi nal demand”, consider the installation of a new widget manufacturer in Anytown, USA. The widget manufacturer sells $1 million worth of its widgets per year exclusively to consumers in Canada. Therefore, the annual change in fi nal demand in the United States is $1 million because dollars are fl owing in from outside the United States and are therefore “new” dollars in the economy.
This change in fi nal demand translates into the fi rst round of buying and selling that occurs in an economy. For example, the widget manufacturer must buy its inputs of production (electricity, steel, etc.), must lease or purchase property and pay its workers. This fi rst round is commonly referred to as the “Direct Effects” of the change in fi nal demand and is the basis of additional rounds of buying and selling described below.
To continue this example, the widget manufacturer’s vendors (the supplier of electricity and the supplier of steel) will enjoy additional output (i.e. sales) that will sustain their businesses and cause them to make additional purchases in the economy. The steel producer will need more pig iron and the electric company will purchase additional power from generation entities. In this second round, some of those additional purchases will be made in the US economy and some will “leak out.” What remains will cause a third round (with leakage) and a fourth (and so on) in ever-diminishing rounds of spending. These sets of industry-to-industry purchases are referred to as the “Indirect Effects” of the change in fi nal demand.
Finally, the widget manufacturer has employees who will naturally spend their wages. As with the Indirect Effects, the wages spent will either be for local goods and services or will “leak” out of the economy. The
purchases of local goods and services will then stimulate other local economic activity; such effects are referred to as the “Induced Effects” of the change in fi nal demand.
Therefore, the total economic impact resulting from the new widget manufacturer is the initial $1 million of new money (i.e. Direct Effects) fl owing in the US economy, plus the Indirect Effects and the Induced Effects. The ratio between Direct Effects and Total Effects (the sum of Indirect and Induced Effects) is called the “multiplier” and is often reported as dollar-of-impact per dollar-of-change. Therefore, a multiplier of 2.4 means that for every dollar ($1) of change in fi nal demand, an additional $1.40 of indirect and induced economic activity occurs for a total of $2.40.
Key information for the reader to retain is that this type of analysis requires rigorous and careful consideration of the geography selected (i.e. how the “local economy” is defi ned) and the implications of the geography on the computation of the change in fi nal demand. If this analysis wanted to consider the impact of the widget manufacturer on the entire North American continent, it would have to conclude that the change in fi nal demand is zero and therefore the economic impact is zero. This is because the $1 million of widgets being purchased by Canadians is not causing total North American demand to increase by $1 million. Presumably, those Canadian purchasers will have $1 million less to spend on other items and the effects of additional widget production will be canceled out by a commensurate reduction in the purchases of other goods and services.
Changes in fi nal demand, and therefore Direct Effects, can occur in a number of circumstances. The above example is easiest to understand: the effect of a manufacturer producing locally but selling globally. If, however, 100% of domestic demand for a good is being met by foreign suppliers (say, DVD players being imported into the US from Korea and Japan), locating a manufacturer of DVD players in the US will cause a change in fi nal demand because all of those dollars currently leaving the US economy will instead remain.

Economic & Fiscal Impact Analysis of New York State Film Tax Credit Programs | January 2017 25
A situation can be envisioned whereby a producer is serving both local and foreign demand, and an impact analysis would have to be careful in calculating how many “new” dollars the producer would be causing to occur domestically.
ATTACHMENT B: REFERENCESAdkisson, R. (2013, June). Policy Convergence, State Film-Production Incentives and Employment: A Brief Case Study. Journal of Economic Issues, 445-453.
Belson, K. (2011, October 30). New Dreams for Field. The New York Times. Retrieved from http://www.nytimes.com/2011/10/30/sports/baseball/fi eld-of-dreams-setting-tourist-magnet-in-iowa-is-to-be-sold.html?pagewanted=all&_r=1&
California Film Commission. (2013). Progress Report: Film and Television Film Credit Program & Competition for California’s Entertainment Industry.
California Film Commission. (n.d.). California Film & Television Tax Credit Summary: New Program Summary - AB 1839.
Cloudberry Communications. (2011). The Millennium Effect.
Doster, A. (2014, March 19). Fighting Over the Field of Dreams. The Atlantic. Retrieved from http://www.theatlantic.com/magazine/archive/2014/04/fi eld-of-schemes/358624/
Empire State Development. (n.d.). NYS Loves Film.
Ernst & Young. (2009). Estimated Impacts of the New York State Film Credit.
Ernst & Young. (2012). Evaluating the Effectiveness of State Film Tax Credit Programs.
Governor’s Offi ce of Motion Picture & Television Development. (2015, October 29). Post Production in New York State Continues to Thrive With Opening of “Harbor Grand”. Retrieved November 29, 2016, from NYS Loves Film: http://nyslovesfi lm.tumblr.com/
post/132145625283/post-production-in-new-york-state-continues-to?utm_ source=+NYLOVESFILM++October+2015&utm_ campaign=NYLOVESFILM+Feb+2016+Newsletter&utm_medium=email
Governor’s Offi ce of Motion Picture & Television Development. (2015, July 24). Soundstages Expand as Production Booms Across New York State. Retrieved November 29, 2016, from NYS Loves Film: http://nyslovesfi lm.tumblr.com/post/124925059573/soundstages-expand-as-production-booms-across-new
Governor’s Offi ce of Motion Picture & Television Development. (2016, February 29). New York State Positions Itself as the Capital of New and Digital Media. Retrieved November 29, 2016, from NYS Loves Film: http://nyslovesfi lm.tumblr.com/post/140219791743/new-york-state-positions-itself-as-the-capital-of?utm_source=+NYLOVESFILM+-+Feb+2016&utm_
Governor’s Offi ce of Motion Picture & Television Development. (2016, January 25). Post-Production Spotlight: The Molecule Celebrates its 10th Anniversary with New Hires, Continued Growth. Retrieved November 29, 2016, from NYS Loves Film: http://nyslovesfi lm.tumblr.com/post/138026876133/post-production-spotlight-the-molecule-celebrates?utm_source=NYLOVESFILM+-+January+2016&utm_campaign=NYLOVESFILM+Jan+2016+Newsletter&utm_medium=email
Governor’s Offi ce of Motion Picture & Television Development. (2016, June 28). The Molecule Moves: Leading VFX Company Expands to New Headquarters. Retrieved November 29, 2016, from NYS Loves Film: http://nyslovesfi lm.tumblr.com/post/146616223473/the-molecule-moves-leading-vfx-company-expands-to?utm_source=FILM+NEWSLETTER+-+June+2016& utm_campaign=NYLOVESFILM+June+2016+Newsletter&utm_medium=email
Governor’s Offi ce of Motion Picture & Television Development. (2016, April 28). With Big Plans for Growth, Phosphene Moves to Hanover Square.
Economic & Fiscal Impact Analysis of New York State Film Tax Credit Programs | January 201726
Retrieved November 29, 2016, from NYS Loves Film: http://nyslovesfi lm.tumblr.com/post/143548084138/with-big-plans-for-growth-phosphene-moves-to?utm_source=FILM+NEWSLETTER+-+April+2016&utm_campaign=NYLOVESFILM+APRIL+2016+Newsletter&utm_medium=email
Governor’s Offi ce of Motion Picture & Television Production. (2015, December 21). New York Soundstages Receive Funding Through Regional Economic Development Council Initiatives. Retrieved November 29, 2016, from NYS Loves Film: http://nyslovesfi lm.tumblr.com/post/135656278283/new-york-soundstages-receive-funding-through?utm_source=+NYLOVESFILM+-+December+2015&utm_campaign=NYLOVESFILM+Dec+2015+Newsletter&utm_medium=email
Henchman, J. (2011, June 2). More States Abandon Film Tax Incentives as Programs’ Ineffectiveness Becomes More Apparent. Retrieved from Tax Foundation: http://taxfoundation.org/article/more-states-abandon-fi lm-tax-incentives-programs-ineffectiveness-becomes-more-apparent
HR&A Advisors, Inc. (2015). Economic Impacts of the Louisiana Motion Picture Investor Tax Credit.
HR&A Advisors, Inc. (2012). Economic and Fiscal Impacts of the New York State Film Production Tax Credit.
Kemp, S. (2012, September 17). U.K. Tax Credit Vital to Film Industry Health: Study. Retrieved from The Hollywood Reporter: http://www.hollywoodreporter.com/news/british-tax-credit-fi lm-industry-oxford-economics-370646
Lester, J. (2013). Tax Credits for Foreign Location Shooting of Films: No Net Benefi t for Canada. Canadian Public Policy.
Mitchell, H., & Stewart, M. F. (2012). Movies and holidays: the empirical relationship between movies and tourism. Applied Economics Letters, 1437-1440.
MNP, LLP. (2014). Economic Impacts of the Florida Film and Entertainment Industry Financial Incentive Program: Supplementary Report on Film Induced Tourism.
Morefoot, A. (2016, October 17). Stage Might. Crain’s New York Business, pp. 16-19.
National Conference of State Legislatures. (2014). State Film Production Incentives & Programs.
New York State Department of Labor, Division of Research and Statistics, Bureau of Labor Market Information. (2014). New York’s Motion Picture Industry: A Statewide and Regional Analysis.
NYC & Company. (n.d.). New York City Tourism: A Model for Success. 2013. Retrieved from http://www.nycgo.com/assets/fi les/pdf/New_York_City_Tourism_A_Model_for_Success_NYC_and_Company_2013.pdf
Oxford Economics. (2012). The Economic Impact of the UK Film Industry.
Preston, P. (2013). State Tax Incentives and the Motion Picture Industry. Journal of the Music & Entertainment Industry Educators Association, 181-205.
Robert Handfi eld, P. (2014). A Supply Chain Study of the Economic Impact of the North Carolina Motion Picture and Television Industry.
Salama, M. (2009, Summer). State Film Tax Incentives and the Related Potpourri of Federal Income Tax and Tax Accounting Considerations. Tax Lawyer, p. 1085.
Small, O., & Wheeler, L. (2016). A Description of the Film Tax Credit and Film Industry in Georgia. Fiscal Research Center.
The Boston Consulting Group. (2012). Evaluating NYC Media Sector Development and Setting the Stage for Future Growth.
The Boston Consulting Group. (2015). The Media

Economic & Fiscal Impact Analysis of New York State Film Tax Credit Programs | January 2017 27
43 New York State Department of Labor, Division of Research and Statistics, Bureau of Labor Market Information, 2014)
44 (The Boston Consulting Group, 2015)
and Entertainment Industry in NYC: Trends and Recommendations for the Future.
Thom, M. (2016). Lights, Camera, but No Action? Tax and Economic Development Lessons From State Motion Picture Incentive Programs. American Review of Public Administration, 1-23.
Thom, M., & An, B. (2016). Fade to Black? Exploring Policy Enactment and Termination Through the Rise and Fall of State Tax Incentives for the Motion Picture Industry. American Politics Research, 1-24.
Twilight. (2014). Retrieved from Discover Forks Washington: http://forkswa.com/twilight/
Verrier, R. (2015, October 31). Film tax credits, new media help revive L.A.’s entertainment economy. Los Angeles Times.
Photos provided by Empire State Development.
ATTACHMENT C: ADDITIONAL RESEARCH “New York’s Motion Picture Industry: A Statewide and Regional Analysis”
Published in June 2014, this report was prepared by the New York State Department of Labor and highlights the growth in traditional fi lm industry sub-sectors as well as emerging industries. This report showed that employment in the Motion Picture and Video Industries between 2009 and 2013 (time period when the enhanced credit was made available) grew by nearly 30% in New York State and nearly 44% in New York City when during that same period of time the United States as a whole only saw a 6% increase. This report also summarizes fi ndings of a report completed by the Boston Consulting Group in 2012 that estimated that approximately 130,000 people in New York City work in jobs directly related to fi lm and TV. The BCG report also notes reality shows and TV series that depend on strong city infrastructure and are less mobile than one-time fi lm productions.
In reporting on the impact of the production tax credit program, the study highlights the increase in the number of projects that occurred in NYS. In 2003 only 18 fi lms and 7 television shows were shot in New York State but that number grew to 181 fi lms and 29 TV series by 2013. Showcasing the importance of New York State in the United States fi lm industry, the report states, “in 2014, a record 15 broadcast pilots will be fi lming in New York, more than anywhere else in the country, including Los Angeles.”43
“The Media and Entertainment Industry in NYC: Trends and Recommendations for the Future”
This wide ranging report prepared by The Boston Consulting Group in October 2015 focuses on the impact of the fi lm and television production industry on New York City as well as the thriving independent movie scene. The report provides information and data related to job growth, spending, and other trends in the industry and the resulting economic impact on New York City. The fi ndings suggest that Media and Entertainment is a signifi cant source of revenue and employment for NYC and employs over 290,000 FTEs.
The report states “NYC is one of only three cities in the world with a fi lm community large enough to enable a production to be made without needing any roles to be brought in from outside – cast, above the line or below the line”. The City’s ability to attract productions is a result of a number of factors including: script, cost, preference of key talent, and availability of stages. While there are many benefi ts to working in NYC, the report also offers recommendations on ways to mitigate some of the challenges to shooting and doing post-production work in NYC.44
“Film tax credits, new media help revive L.A.’s entertainment economy”
Published in the Los Angeles Times and written by Richard Verrier in October 2015, the article talks about an upswing in fi lming in the area including a rise in commercial shoots from carmakers and other

Economic & Fiscal Impact Analysis of New York State Film Tax Credit Programs | January 201728
big advertisers and new TV shows from cable and broadcast networks as well as other new media outlets like Amazon, Netfl ix and others. The article cites California’s new fi lm incentives, and shifts in other states, as a signifi cant reason why there has been a revival of L.A.’s entertainment economy. While the incentive in California has been enhanced the state still can not compete with states and countries that offer more generous tax credits for large blockbuster fi lms.45
“Some states yell, ‘Cut!’ on fi lm tax credits”
This article, written by Elaine Povice for the Pew Chartable Trusts, focuses on the changes in fi lm industry tax credits that have occurred throughout the United States in recent years. Some states have been expanding their offerings, like California, while others are terminating their programs like Alaska. The article also states that studios are shopping around when deciding where to locate their productions in order to take advantage of the best credit programs. Production managers state that the tax incentives are one of the fi rst things they consider when deciding where to shoot.
“State Film Production Incentives & Programs”
This document, published in March 2014, provides a brief summary of the growth of fi lm industry incentives in the United States and provides an updated list of the types of incentives offered. This document was helpful in understanding how New York State relates to the other states in terms of incentives being offered.
“Economic Impacts of the Florida Film and Entertainment Industry Financial Incentive Program: Supplementary Report on Film Induced Tourism”
In addition to an analysis of the incentive program, Florida commissioned a report in January 2014 that looked specifi cally at how the fi lm industry impacted the tourism industry in a state with a large existing tourism industry. This report is particularly interesting because, like New York City, Florida has a strong tourism industry even without fi lm-induced visitation. The report
found that between 5% and 19.5% of all visitors to Florida are infl uenced in whole or in part by fi lm and/or television. Based on this range of direct impacts, it is clear that the fi lm and entertainment industry is a signifi cant contributor to the economy. The survey was based on visitors who had been to Florida in the past year and did not include information about the specifi cs of their travel.
This report also conducted a state and local government return on investment calculation to compare the amount of tax credits issued with the tax revenue generated. The analysis found that state and local governments ROI is between 10 and 38, in other words for every $1 of tax credit issued the state and local governments earn between $10 and $38 in tax revenue.46
“Economic Impacts of the Louisiana Motion Picture Investor Tax Credit”
Completed in 2015 by HR&A Advisors, Inc., this report was commissioned by the Louisiana Film and Entertainment Association and the Motion Picture Association of America to study the impact of the Louisiana State Motion Picture Investor Tax Credit. First introduced in 2002 as a way to enhance the state’s competitiveness as a place for motion picture and television production, the state currently provides a 30% base tax credit on qualifi ed production spending and another 5% credit for payroll expenditures to Louisiana residents. The study found that following the enactment of the tax credit program the state’s motion picture and television employment increased by 595% while the employment in the industry in the US only increased by 12.4%. The study also found that 14.5% of domestic, out-of-state, visitors who recently traveled to Louisiana were induced by the motion picture or television industry. 47
45 Verrier, 2015 46 (MNP, LLP, 2014)
47 HR&A Advisors, Inc, 2015

Economic & Fiscal Impact Analysis of New York State Film Tax Credit Programs | January 2017 29
48 Small & Wheeler, 201649 California Film Commission
50 Henchman, 2011 51 Oxford Economics, 2012
“A Description of the Film Tax Credit and Film Industry in Georgia”
Prepared by the Fiscal Research Center in 2016, this policy brief provides a summary of Georgia’s fi lm tax credit program and how it has contributed to the state’s rise in prominence in the fi lm industry. The brief goes on to say that in 2015 Georgia law makers decided to limit their fi lm incentive program while other states, including Michigan and Alaska, have decided to terminate their programs. The article states that the reason that there is hesitation around these types of tax credit programs is that “the lost tax revenues are very well defi ned and visible, while the benefi ts from employment and overall economic growth are much harder to quantify”. The article cites an analysis conducted by the Georgia Department of Economic Development that found that there were hundreds of feature fi lms, commercials, and television productions shot in Georgia resulting in an overall economic impact of $6 billion for the state. 48
“California Film & Television Tax Credit Program: New Program Summary - AB 1839”
This summary sheet provides information about the recently updated fi lm and TV tax credit program for California productions. Key changes include:
• Increase in total program funding from $100 million to $330 million per fi scal year;
• Expansion of program to big-budget feature fi lms, 1-hour TV series and TV pilots;
• Creates tax credit eligibility for fi rst $100 million in qualifi ed spending for studio fi lms and fi rst $10 million in qualifi ed spending for independent fi lms;
• Elimination of the state’s tax credit lottery and is using a “jobs ratio” formula and other ranking criteria;
• Penalty for projects that overstate job creation;
• Multiple allocation periods throughout the year; and,
• Increased benefi t for productions that fi lm outside
the 30-Mil zone and for visual effects and music scoring/recording performed in-state. 49
“More States Abandon Film Tax Incentives as Programs’ Ineffectiveness Becomes More Apparent”
This article written by the Tax Foundation in June 2011 summarizes some of the controversies surrounding incentive programs in the United States and specifi cally whether the incentives for the fi lm industry are effective in their effort to encourage economic growth and raise tax revenue. The article highlights states that have suspended or eliminated their programs, states that have reduced their available incentives, as well as the states that have expanded or strengthened their program. The recommendation of the report is that states require reporting about the amount of incentives provided per Full-Time Equivalent job created and that the effectiveness of the programs be reviewed periodically.50
“The Economic Impact of the UK Film Industry”
This report by Oxford Economics studied the fi lm industry in the United Kingdom, the impact of the fi lm industry, and the role that the Film Tax Relief program (incentive program) plays in sustaining the fi lm industry in the UK. The report estimates that, without the tax relief program, fi lm production in the UK would decrease by 71%. The report also fi nds that the program has a positive return on investment (£1 of incentive generates £12 in GDP), has led to signifi cant investment in studios and other infrastructure, and has generated tourism from overseas.51
“Lights, Camera, but No Action? Tax and Economic Development Lessons from State Motion Picture Incentive Programs”
Published in the American Review of Public Admini-stration, this report by Michael Thom attempts to evaluate the impact of motion picture incentive (MPI) programs on the ability for states to entice fi lm and television productions out of California and New York.

Economic & Fiscal Impact Analysis of New York State Film Tax Credit Programs | January 201730
The report summarizes that there are 30 states that offer tax credit programs (18 offer transferable credits and 12 offer refundable credits) and 32 offer tax waivers including sales tax waivers and/or lodging tax waiver.
The fi ndings of the analysis highlighted that domestic and foreign competition for the motion picture related jobs and spending has created a situation where state governments are spending billions of dollars on MPI programs. The statistical analysis found that states’ efforts to entice entertainment industry jobs out of California and New York had “little to no sustained impact on employment or wage growth and that none of the incentives affected motion picture industry GSP or concentration.” Another fi nding was that transferable credits had small but positive and sustained impacts on employment growth, but no effect on wages whereas refundable credits had no effect on employment but positive yet temporary infl uence on wages.52
“Fade to Black? Exploring Policy Enactment and Termination Through the Rise and Fall of State Tax Incentives for the Motion Picture Industry”
This report was published in the American Politics Research journal in August 2016 and takes a close look at the Motion Picture Incentive programs enacted and some later repealed in 45 states. The analysis fi nds that while enactments were often a reaction to rising unemployment and national trends, many states found it hard to terminate the programs once unemployment started falling due to the infl uence of incentive spending. The report states “tax incentives are durable – most MPIs persist despite skepticism over their effectiveness- but not immortal, and the conditions infl uencing enactment and termination are not consistently mirror images of each other”.53
30
52 Thom, Lights, Camera, but No Action? Tax and Economic Development Lessons From State Motion Picture Incentive Programs, 2016
53 Thom & An, Fade to Black? Exploring Policy Enactment and Termination Through the Rise a Fall of State Tax Incentives for the Motion Picture Industry, 2016

Economic & Fiscal Impact Analysis of New York State Film Tax Credit Programs | January 2017 31
120 West Avenue, Suite 303
Saratoga Springs, NY 12866
518.899.2608
www.camoinassociates.com
@CamoinAssociate
This report was produced in partnership with: