the energy storage industry in new york state: recent growth and projections 2015 update · ·...
TRANSCRIPT

The Energy Storage Industry in New York State: Recent Growth and Projections
2015 Update
Prepared For:
New York State Energy Research and Development Authority (NYSERDA) Albany, NY
Jason Doling Program Manager, Energy Storage
Jennifer Phelps Project Manager, Evaluation
Prepared By:
INDUSTRIAL ECONOMICS, INCORPORATED (IEc)
2067 Massachusetts Avenue Cambridge, Massachusetts 02140
617/354-0074
Cynthia Manson, Project Manager
NYSERDA Contract 32883 October 2016

ii
Table of Contents
Table of Contents .......................................................................................................................................... ii
List of Exhibits ............................................................................................................................................. iii
Executive Summary ...................................................................................................................................... 1
Methodology – Emerging Energy Storage Markets ........................................................................ 2
Methodology – Traditional Energy Storage Markets ...................................................................... 3
High-Level Summary of Findings ................................................................................................... 3
Delayed Market Adoption Scenario ................................................................................................. 5
Introduction ................................................................................................................................................... 8
Methodological Overview .......................................................................................................................... 10
Data Gathering and Validation ...................................................................................................... 10
Key Assumptions and Methodological Changes ........................................................................... 14
Analytic Process and Results ...................................................................................................................... 17
Analytic Process: Emerging Global Markets – Electricity Storage .............................................. 18
Results: Emerging Global Markets – Electricity Storage ............................................................. 19
Analytic Process: Emerging Global Markets – Transportation Storage ....................................... 22
Results: Emerging Global Markets – Transportation Storage ...................................................... 22
New York State Company Sales to Emerging Energy Storage Markets ....................................... 24
New York State Company Employment - Emerging Energy Storage Markets ............................. 26
Aggregate Results: New York State Company Sales and Employment in Emerging Energy Storage Markets ................................................................................................................ 27
Analytic Process: Traditional Energy Storage Markets in New York State ................................. 30
Results: Traditional Energy Storage Markets in New York State ................................................ 32
Aggregate Results: Emerging and Traditional Energy Storage Markets in New York State ....... 33
Delayed Market Adoption Scenario ............................................................................................... 34
Conclusions and Comparisons with the 2012 Market Report ........................................................ 38
Appendix A: Key Sources Cited ................................................................................................................. 41

iii
List of Exhibits
Exhibit 1. New York State Revenues and Employment: Emerging and Traditional Energy Storage Markets, 2015-2030 ................................................................................................................. 5
Exhibit 2. Comparison of New York State Revenues and Employment: Emerging and Traditional Energy Storage Markets, 2015-2030 across Consistent Growth Scenario and Delayed Market Adoption Scenario ....................................................................................................... 6
Exhibit 3. Methodology for Emerging Energy Storage Markets ............................................................ 12
Exhibit 4. Methodology for Traditional Energy Storage Markets .......................................................... 13
Exhibit 5. Sales in Emerging Global Electricity Storage Markets, by Segment and Geographic Scope, 2015-2030 ($millions) ................................................................................................ 21
Exhibit 6. Sales in Emerging Global Transportation Storage Markets, by Segment and Geographic Scope, 2015-2030 ($millions) ................................................................................................ 23
Exhibit 7. Share of Global Electricity Storage Market Sales Accruing to New York State Companies, 2015 - 2030 ............................................................................................................................ 24
Exhibit 8. Share of Global Transportation Storage Market Sales Accruing to New York State Companies, 2015 - 2030 ........................................................................................................ 25
Exhibit 9. Productivity and Revenue per Employee Assumptions, 2015 - 2030 .................................... 26
Exhibit 10. New York State Revenues and Employment: Emerging Energy Storage Markets, 2015-2030 .............................................................................................................................. 27
Exhibit 11. New York State Company Sales – Electricity Storage Market, 2015-2030 (Millions of $) .. 28
Exhibit 12. New York State Company Sales – Transportation Storage Market, 2015-2030 (Millions of $) ........................................................................................................................ 29
Exhibit 13. New York State Employment and Revenues – Traditional Energy Storage Markets, 2015 – 2030 ............................................................................................................................ 32
Exhibit 14. New York State Revenues and Employment: Emerging and Traditional Energy Storage Markets, 2015-2030 ............................................................................................................... 34
Exhibit 15. Comparison of New York State Revenues and Employment: Emerging and Traditional Energy Storage Markets, 2015-2030 across Consistent Growth and Delayed Market Adoption Scenarios ................................................................................................................ 37
Exhibit 16. Comparison of New York State Revenue Growth in Select Emerging Energy Storage Markets, 2015-2030 across Consistent Growth and Delayed Market Adoption Scenarios ... 38

1
Executive Summary
This report updates and expands on a 2012 assessment of the energy storage market in New York State, The Economic Impact of Developing an Energy Storage Industry in New York State, by ECG Consulting Group Inc., prepared for NY-BEST on October 5, 2012 (the 2012 market report). Both this report and the 2012 market report characterize the energy storage market in New York State at present, as well as in the future, by estimating current and out-year employment and revenues in the energy storage industry.
As in 2012, economic, environmental, regulatory, and technological trends continue to drive increasing interest in energy storage technologies at all scales, across applications and around the globe. The market for energy storage encompasses a number of technologies and uses, and is driven by a variety of complex and interconnected factors that are currently in a state of rapid change. As a result, many segments of the energy storage market are expected to undergo rapid growth in the immediate future. Generally, the rate of adoption of new energy storage technologies and the timing of market growth varies significantly by application, geography, and location of use. However, several broad types of emerging technologies have already begun to have a measurable effect on the market.
Among all the technologies included in this report, grid-connected electricity storage has experienced some of the most significant growth and seems poised to continue along this trajectory over the next five years, not only in the United States, but in several key regions around the world. Similarly, recent advances in the transportation sector (in particular, electric vehicles) have increased the potential major changes in the light duty vehicle market. While technical and regulatory arenas continue to evolve, federal policy decisions in development (e.g., the Federal Energy Regulatory Commission’s (FERC’s) recent initiation of a proceeding regarding the applicability of wholesale electricity market rules to energy storage resources), direct policy mandates in places like California (e.g., Assembly Bill 2514, Energy storage systems), and market and tariff changes under New York’s Reforming the Energy Vision (REV) proceeding will act to catalyze market consensus on a number of outstanding issues.
Costs for energy storage technologies have dropped rapidly and are projected to continue to decrease, enhancing the ability of energy storage technologies to compete with alternative solutions including, in some cases, direct generation of energy on an overall cost-effectiveness basis. However, to reach broad market acceptance, many energy storage technologies must still bridge the gap between pilot project status and true commercial viability. In addition, growth in energy storage markets is, and will continue to be for some time, highly dependent on federal and regional regulatory conditions. The energy storage industry has been active in pressing state regulators and legislators to consider energy storage technologies in state and regional policies. Particularly for grid-connected storage technologies, the standardization of communications and control protocols will play an important role in defining the future market.1
Like the 2012 market report, this report defines “market” using two metrics: revenues (sales) and employment. New York State’s energy storage market, in revenue terms, reflects earnings from energy
1 For additional information on these topics, see this report’s companion market assessment of energy storage, NYSERDA Energy Storage and NY BEST Program: Market Characterization and Assessment.
2
storage-related sales made by New York State-based companies into global markets. Employment estimates of market size consider the total employment at facilities in New York State.2
To estimate the size and growth of the energy storage market in New York State, this report examines both emerging, “non-traditional markets” based on new technologies (e.g., energy storage on the grid, batteries tied to home solar systems, batteries for plug-in hybrid electric vehicles) which are currently experiencing, or expected to experience, rapid growth, and relatively stable “traditional markets” that deliver energy storage products based on established technologies (e.g., automotive lead-acid batteries, portable military batteries, etc.).
This report focuses specifically on current and projected estimates of revenues and employment associated with the New York State energy storage market between 2015 and 2030. Additional context for trends affecting New York State’s energy storage industry are available in NYSERDA Energy Storage and NY BEST Program: Market Characterization and Assessment. This report incorporates this information where appropriate.
Methodology – Emerging Energy Storage Markets
Consistent with the method used in the 2012 market report for NY-BEST, this report derives emerging market estimates and opportunities from third-party data on energy storage market segment size and growth. This report combines data from Navigant Research with supplementary data from other sources to estimate global sales and total employment of New York State companies in emerging energy storage market segments.3 This report identifies two broad emerging energy storage market sectors with significant growth potential:
• Electricity storage on the grid, encompassing grid-connected (utility side of the meter) and customer-connected (customer side of the meter) applications, projected to grow globally from approximately $6.2 billion in 2015 to approximately $23 billion in 2020 and then to approximately $78 billion in 2030; and
• The transportation storage (battery) market, driven by projected growth in sales of hybrid electric, plug-in hybrid electric, and battery electric vehicles, projected to grow globally from approximately $10 billion in 2015 to approximately $33 billion in 2020 and then to approximately $49 billion in 2030.
Businesses in New York State currently engage in the manufacture, integration, and sale of products within these market sectors; this report applies a series of factors and assumptions to translate these global emerging energy storage market growth projections to sales and employment at companies within New York State. In other words, this report models the share of U.S. and global emerging energy storage markets attributable to New York State companies, based on the overall projections for those markets. The model applied in this report reflects the assumption that broader market development, combined with continued support from NY-BEST and other sources, will ensure continued development of the emerging
2 To align these markets, this report accounts for revenues earned by New York State operations to the best extent possible. However, in some cases, revenues may reflect operations in markets beyond New York State. 3 See Appendix A for a listing of reports and data used to inform the analyses in this document.

3
battery and energy storage industry in New York State, and projects a continuing increase in the global share of sales attributable to New York State companies over time. This assumption is supported by data from recent years, and consistent with data collected for a broader market characterization and impact evaluation underway for NYSERDA which describes the New York State market for energy storage and examines the effect of the NY-BEST program on the market for energy storage in New York State since 2012.
Methodology – Traditional Energy Storage Markets
Consistent with the method used in the 2012 market report, this report derives traditional energy storage market estimates from 2015 organization-level employment data collected from third-party data vendors and a NY-BEST member survey, and validated through interviews with industry experts and NY-BEST. Substantial contributors to employment and sales in traditional energy storage markets in New York State include companies providing:
• Lightweight, portable lithium ion (Li-ion) batteries for military equipment power applications;
• Materials used in energy storage applications;
• Polymer electrolyte membrane (PEM) fuel cells; and
• Industrial and fork lift trucks.
In addition, New York State features an active research and development (R&D) sector supporting new energy storage technologies which for analysis purposes is included within “traditional energy storage markets.”
This report aggregates organization-level data by market segment and translates them to sales revenues earned by New York State companies operating in traditional energy storage markets using revenue-per-employee benchmarks. Consistent with broader economic trends in both energy storage and other sectors, employment at organizations in traditional energy storage markets is expected to increase at an annual growth rate of approximately 4.1 percent, based on future GDP forecasts from the Congressional Budget Office (CBO); annual revenue increases occur as a result of employment growth and modeled increases in productivity over time.
High-Level Summary of Findings
Across both traditional and non-traditional energy storage markets, employment in New York State in 2015 is estimated at approximately 3,900 employees, and revenues total approximately $910 million. This represents an increase of over 30 percent in employment, and an increase of over 50 percent in revenues since 2012; continued growth is projected to result in approximately 27,000 employees and approximately $9 billion in revenues in New York State by 2030, reflecting cumulative average annual growth rates between 2015 and 2030 of approximately 14 percent and 16 percent for employment and revenues, respectively. These estimates reflect the combined impact of general market growth trends and continued patterns of support from NY-BEST, regulations and policy, and other New York State institutions.
4
Based on individual New York State energy storage company data, New York State companies in traditional energy storage markets currently have global sales of approximately $590 million, and are expected to increase employment from approximately 2,600 in 2015 to approximately 3,100 in 2020, an annual growth rate of approximately 4.1 percent.4 Employment in traditional markets is further expected to increase to approximately 4,700 by 2030.
Based on growth projections for emerging energy storage technologies, this report estimates that New York State companies in emerging energy storage markets currently feature global sales of approximately $320 million; New York State company global sales in these markets are projected to increase to $2.0 billion by 2020 and to $7.2 billion by 2030. Meanwhile, this report estimates employment at these companies at approximately 1,400 in 2015, expected to grow to over 7,200 by 2020 and up to over 22,000 by 2030.5
Exhibit 1 below summarizes employment and revenue estimates in emerging and traditional energy storage markets in New York State for 2015 through 2030. For comparison, it also includes 2012 and projected 2015 estimates from the 2012 market report.
The estimates and projections in Exhibit 1 reflect an array of business-as-usual assumptions for the energy storage market in New York State, now and in the future. These are roughly consistent with the “base case” estimated in the 2012 market report, which assumes that New York State continues to cultivate a strong economic development program focused on the emerging electricity storage and transportation storage sectors, and implements policies and regulations to help develop existing New York State companies and attract substantial entry of new companies to the state.
The 2012 market report also considered an “optimistic case” that anticipated additional economic development actions on the part of NYSERDA and other agencies than were identified at the time.6 To the extent that New York State implements even stronger economic development actions and a broader range of larger measures to attract or develop companies who can become market share leaders in battery and/or energy storage market segments, such as establishing third-party test and demonstration facilities or including energy storage targets within future State energy policies, commensurate with the “optimistic case” from the 2012 market report, the projections estimated in Exhibit 1 may underestimate energy storage revenues and employment in New York State for emerging, non-traditional energy storage markets. However, comparison of the “base case” and “optimistic case” projections from the 2012 market report with current estimates of the energy storage market suggests that projections using the “base case” are more consistent with actual market development between 2012 and 2015. Therefore, this report focuses on the “base case” projections from the 2012 market report, and, where relevant, relies on parameters used to derive those projections.
4 Sales revenues in traditional markets are estimated to grow at an annual rate between five and nine percent, depending on the year. The rate of sales growth varies based on both projected employment and projected productivity gains in a given year. Under the assumption of no productivity growth in traditional energy storage markets, sales would also grow by approximately 4.1 percent annually. 5 These figures refer to the sum of the first two rows in Exhibit 1 for revenues and employment, i.e., non-traditional, emerging energy storage markets. 6 Here and throughout this document, “2012 market report” refers to ECG Consulting Group Inc., The Economic Impact of Developing an Energy Storage Industry in New York State,, prepared for NY-BEST, October 5, 2012.

5
Exhibit 1. New York State Revenues and Employment: Emerging and Traditional Energy Storage Markets, 2015-2030
New York State Revenues and Employment Units 2012*
2015* (proj.) 2015 2020 2025 2030
CAGR 2015- 2020
CAGR 2015- 2030
Rev
enue
s
Electricity Storage Market $M
$598
$175 $150 $1,260 $3,450 $5,370 53.2% 27.0% Transportation Storage Market
$M $132 $167 $749 $1,500 $1,810 35.0% 17.2%
Traditional Markets $M $602 $589 $871 $1,180 $1,520 8.13% 6.53%
Total Revenues $M $598 $908 $906 $2,880 $6,130 $8,710 26.0% 16.3%
Empl
oym
ent
Electricity Storage Market Jobs
2,990
759 650 4,520 11,130 16,500 47.4% 24.1% Transportation Storage Market Jobs 571 724 2,680 4,840 5,580 29.9% 14.6%
Traditional Markets Jobs 3,000 2,560 3,120 3,820 4,680 4.07% 4.11%
Total Employment Jobs 2,990 4,340 3,930 10,300 19,800 26,800 21.3% 13.6%
Figures in table rounded to three significant digits. Figures may not sum due to rounding. $M = Millions of dollars CAGR = Cumulative Annual Growth Rate over the target period, defined as: (Salesy/Salesx)(1/(y-x))-1, where x is the first year of the target range, and y is the last year of the target range. * Estimates from the 2012 market report, including 2015 projections from that report, provided for comparison purposes.
Due to the relatively well-established nature of traditional markets, which include R&D performed in support of emerging or new technologies, this report projects that revenues and employments in these markets will grow at a lower, steadier annual rate compared with the projected gains in emerging energy storage markets in New York State.
Delayed Market Adoption Scenario
The analysis described above uses updated, recent Navigant Research market data, directly mapped to New York State companies, in order to estimate and project sales and employment in emerging energy storage markets for 2015 through 2030.7 This approach inherently assumes that energy storage markets in New York State will grow consistently with broader regional and global trends. Therefore, this analysis is considered a “consistent growth” scenario based on Navigant’s projections. To characterize the uncertainty associated with the consistent growth scenario’s direct mapping of Navigant data to New York State markets, this report also considers a more conservative analysis that assesses the possibility of delayed market adoption of energy storage in New York State, featuring the following deviation from the results presented in Exhibit 1:
• Delay in the growth of electricity storage markets relative to Navigant projections. Based on the idea that New York State’s Reforming the Energy Vision (REV) proceeding will be a major part of the regulatory environment facilitating energy storage, the delayed market adoption scenario delays Navigant Research projections for emerging electricity storage market segments by three years. This estimate assumes tariffs will fully evolve and investors will gain sufficient confidence around 2019 to bolster these specific market segments in New York State.
7 See Appendix A for a listing of reports and data used to inform the analyses in this document.

6
• Reduction in market share garnered by New York State companies. In contrast to the assumptions used in the consistent growth scenario, where market share garnered by New York State companies increases roughly threefold between 2015 and 2030, the delayed market adoption scenario examines the effect of a twofold increase instead.
Additionally, the Navigant data suggest that for some emerging market segments, growth begins to slow at some point between 2020 and 2030, suggesting a degree of market saturation and plateauing of emerging energy storage market revenues occurring in this period. Price declines associated with product maturation and/or competition may also play a role in offsetting revenue growth in these market segments. By delaying the growth featured in the Navigant projections for electricity storage market segments, this potential market maturation/saturation effect is also delayed.
Exhibit 2 illustrates the differences in estimated revenues and employment between 2015 and 2030 for emerging energy storage markets between the consistent growth and delayed market adoption scenarios. Traditional market estimates are unchanged between the two scenarios, but are also presented to facilitate examination of the total energy storage market across the two scenarios.
Exhibit 2. Comparison of New York State Revenues and Employment: Emerging and Traditional Energy Storage Markets, 2015-2030 across Consistent Growth Scenario and Delayed Market Adoption Scenario
New York State Revenues and Employment Units 2015 2020 2025 2030
CAGR 2015- 2020
CAGR 2015- 2030
Rev
enue
s
Emerging Markets – Consistent Growth Scenario $M $317
$2,010 $4,940 $7,190 44.7% 23.1%
Emerging Markets – Delayed Market Adoption Scenario $M $1,140 $2,900 $4,090 29.2% 18.6% Traditional Markets $M $589 $871 $1,180 $1,520 8.13% 6.53%
Total Revenues – Consistent Growth Scenario $M $906
$2,880 $6,130 $8,710 26.0% 16.3% Total Revenues – Delayed Market Adoption Scenario $M $2,010 $4,080 $5,610 17.3% 12.9%
Empl
oym
ent
Emerging Markets – Consistent Growth Scenario Jobs 1,370
7,210 16,000 22,100 39.3% 20.3% Emerging Markets – Delayed Market Adoption Scenario Jobs 4,090 9,370 12,600 24.4% 15.9% Traditional Markets Jobs 2,560 3,120 3,820 4,680 4.07% 4.11%
Total Employment – Consistent Growth Scenario Jobs 3,930
10,300 19,800 26,800 21.3% 13.6%
Total Employment – Delayed Market Adoption Scenario Jobs 7,210 13,200 17,300 12.9% 10.4%
As shown in Exhibit 2, the delayed market adoption scenario represents a substantial slowing of the energy storage market in New York State relative to the consistent growth scenario. Growth drops dramatically in the 2015-2020 period relative to the consistent growth scenario due to the “delay” assumption imposed in the delayed market adoption scenario; however, cumulative annual growth rates over the entire period of analysis (i.e., 2015 through 2030) are relatively similar across the two scenarios due to the “delay” assumption pushing out, but not removing, years featuring strong growth from the delayed market adoption scenario.
The delayed market adoption scenario results in a reduction of over 40 percent in 2030 emerging energy storage market revenues attributable to New York State companies as compared to the consistent growth scenario. Total energy storage market revenues (i.e., inclusive of both emerging and traditional energy

7
storage markets) in the delayed market adoption scenario are approximately 36 percent lower in 2030 than in the consistent growth scenario, with similar reductions estimated in 2030 employment. However, the delayed market adoption scenario still features a healthy cumulative annual revenue growth rate of over 17 percent between 2015 and 2020, and almost 13 percent for the period 2015 through 2030.
8
Introduction
This report updates and expands a 2012 assessment of the energy storage market within New York State, The Economic Impact of Developing an Energy Storage Industry in New York State, by ECG Consulting Group Inc., prepared for NY-BEST on October 5, 2012 (the 2012 market report). Both this report and the 2012 market report characterize the energy storage market in New York State at present (2015 for this report), as well as in the future, by estimating current and out-year employment and revenues in the energy storage industry.
Since the publication of the 2012 market report, in addition to a continued policy focus on renewable energy both within New York State and globally, a few specific factors have emerged that may reshape the energy storage market. Most notable among these are the development of New York State’s Reforming the Energy Vision (REV) proceeding,8 which is coupled with a near-term Clean Energy Standard to source 50 percent of New York State’s electricity generation from renewable sources by 2030 (the “50 by 30” goal).9 The REV proceeding’s emphasis on a realigned electricity market organized to emphasize distributed energy resources (DER), combined with the 50 by 30 Goal, have the capacity to provide significant market incentives for the adoption of storage technologies in New York State. Tesla’s market debut of the mass-produced Powerwall and Powerpack storage devices represents a market signal that mass-produced, economically accessible commodity storage options for both home and grid-scale applications may be moving toward reality. However, REV and the Clean Energy Standard for New York State are still under development, and it is unclear how these efforts will affect New York State companies. Available data suggest that the New York State markets have not started to specifically react to these factors, but overall robust growth projections for North America for certain market segments may reflect a strengthening of demand for energy storage in New York State markets.
Like the 2012 market report, this report defines “market” using two metrics: revenues (sales) and employment. New York State’s energy storage market, in revenue terms, reflects earnings from energy-storage-related sales made by New York State -based companies into global markets. Employment estimates of market size consider the total employment at facilities within New York State.10
This report focuses specifically on current and projected estimates of revenues and employment associated with the New York State energy storage market between 2015 and 2030. Additional context for trends affecting New York State’s energy storage industry are available in two more detailed studies developed concurrently with this study: NYSERDA Energy Storage and NY BEST Program: Market Characterization and Assessment; and NYSERDA Energy Storage and NY-BEST Program: Impact Evaluation. This report incorporates information from these efforts where appropriate.
Currently, a number of companies and other organizations operate within the energy storage industry in New York State. The New York Battery and Energy Storage Technology (NY-BEST™) Consortium was
8 See Reforming the Energy Vision, available online at: https://www.ny.gov/programs/reforming-energy-vision-rev. 9 See The Energy to lead, 2015 New York State Energy Plan, available online at: http://energyplan.ny.gov/. 10 To align these markets, this report accounts for revenues earned by New York State operations to the best extent possible. However, in some cases, revenues may reflect operations in markets beyond New York State.
9
established in 2010 to position New York State as a global leader in the energy storage industry. NY-BEST’s vision is to lead the development and deployment of transformative energy storage solutions to foster sustainable energy use by linking New York State’s world-class industries, companies, and research institutions with global energy markets. To achieve this end, NY-BEST has worked with policy makers to provide information on technologies, market forces, and the policies impacting energy storage applications. NY-BEST has also served as an advocate for the battery and energy storage industry in New York State, helping to promote regulations and policies, NYSERDA’s Energy Storage program, research and development support, and access to the testing and commercialization resources.
NY-BEST’s mission is to catalyze and grow a vibrant, world-class energy storage industry, primarily focused on transportation, grid storage, and power electronics applications. NY-BEST’s primary objectives are to:
• Serve as a center for communication, education, and interaction amongst stakeholders;
• Leverage New York State’s world-class intellectual and manufacturing capabilities and market leadership;
• Support and accelerate the commercialization process from research and development to products and widespread deployment;
• Advocate for policies that promote the energy storage industry.
Energy storage and related technologies supported by NY-BEST include those that store electric energy directly (e.g., batteries, ultracapacitors), components of these technologies, related technologies (e.g., fuel cells), and systems or products that incorporate these technologies throughout the value chain.
This report characterizes the current and projected future state of the energy storage industry in New York State, based on a combination of individual entity data and third-party market- and industry-level data. By assessing the current energy storage market and its projected trajectory, this report aims to describe global energy storage markets, the trends driving development of these markets, and the industry capabilities and resources that currently exist in New York State to serve these markets. This report consists of a high-level economic analysis of the potential growth of these markets within New York State, focusing on New York State company revenues and employment in the energy storage industry.
This report leverages data from an array of sources, including information provided by NY-BEST members, industry experts, and third-party data providers. The market analyses in this report are based on conservative market projections made by reputable market research organizations to determine the most likely projections for the development of the global energy storage markets, and the translation of these projections into estimates of the size of the industry that can be developed in New York State to serve these markets.
As described in additional detail in the following section, where updated data were not available or forthcoming, this report draws on the assumptions used in the 2012 market report. In so doing, this report provides an updated companion piece to the 2012 market report and provides insight into how the energy storage market has developed between 2012 and 2015 relative to the projections within the 2012 market report.

10
Methodological Overview
This report, in general, employs the methodology developed for the 2012 market report conducted for NY-BEST, adapted to reflect changes in data sources and updated market information for New York State. That document combined third-party market data on global and regional emerging energy storage markets with targeted secondary and primary research on New York State companies operating in traditional storage markets to estimate baseline and projected energy storage revenues and employment in New York State.
To update the 2012 market report, this report adopts two different approaches for estimating emerging and traditional energy storage markets, reflecting the key data sources available for each.
The assumptions used to estimate current and projected markets in New York State are based on the best available research and data, and generally in line with conservative market projections made by reputable market research organizations, as well as the 2012 market report. However, as with the 2012 methodology, these data sources and assumptions reflect significant uncertainty about both current and future market dynamics; as new data become available and emerging technology and policy developments evolve, the estimates and projections in this report may differ from the actual size and scope of New York State’s energy storage market over time. This report also considers a “delayed market adoption” scenario that alters some of the assumptions used in this report’s initial analysis, which directly maps third-party market projections to New York State (the “consistent growth scenario”). The delayed market adoption scenario characterizes some of the uncertainty associated with the parameters used throughout this report to develop New York State-specific estimates and forecasts.
The economic model in this report also projects the size and growth of the electricity storage and transportation storage markets between 2015 and 2030, and estimates the share of revenues attributable to New York State companies in these markets. In addition, the model incorporates individual company-level data on employment at companies within the energy storage industry in New York State. These company-level data are used to assess the size of traditional market segments within New York State.
Data Gathering and Validation
This report draws primarily on high-level secondary research to characterize the current and projected future state of the energy storage industry in New York State and uses limited primary research to verify findings and conclusions, a methodology consistent with the initial development of energy storage market estimates in the 2012 market report. The 2012 market report used primarily Pike Research data and projections to estimate emerging energy storage markets and NY-BEST data to estimate traditional energy storage markets.
To update these data, this report uses 2015 estimates and projections from Navigant Research, which acquired Pike Research after the completion of the 2012 market report and updated some, but not all, of the market projections that Pike Research had published. Where segment-specific data from Navigant are not available to update the 2012 Pike Research data, this report uses the earlier Pike Research data as represented in the 2012 market report. For traditional energy storage markets, this report uses updated data gathered from a variety of sources, including a NY-BEST member survey conducted in December

11
2015, company-specific financial and organizational information such as annual reports and public filings, and engagement with NY-BEST staff.
These estimates were reviewed and validated through conversations with industry experts, NY-BEST staff, and the data collected as part of the broader energy storage market characterization in NYSERDA Energy Storage and NY BEST Program: Market Characterization and Assessment.
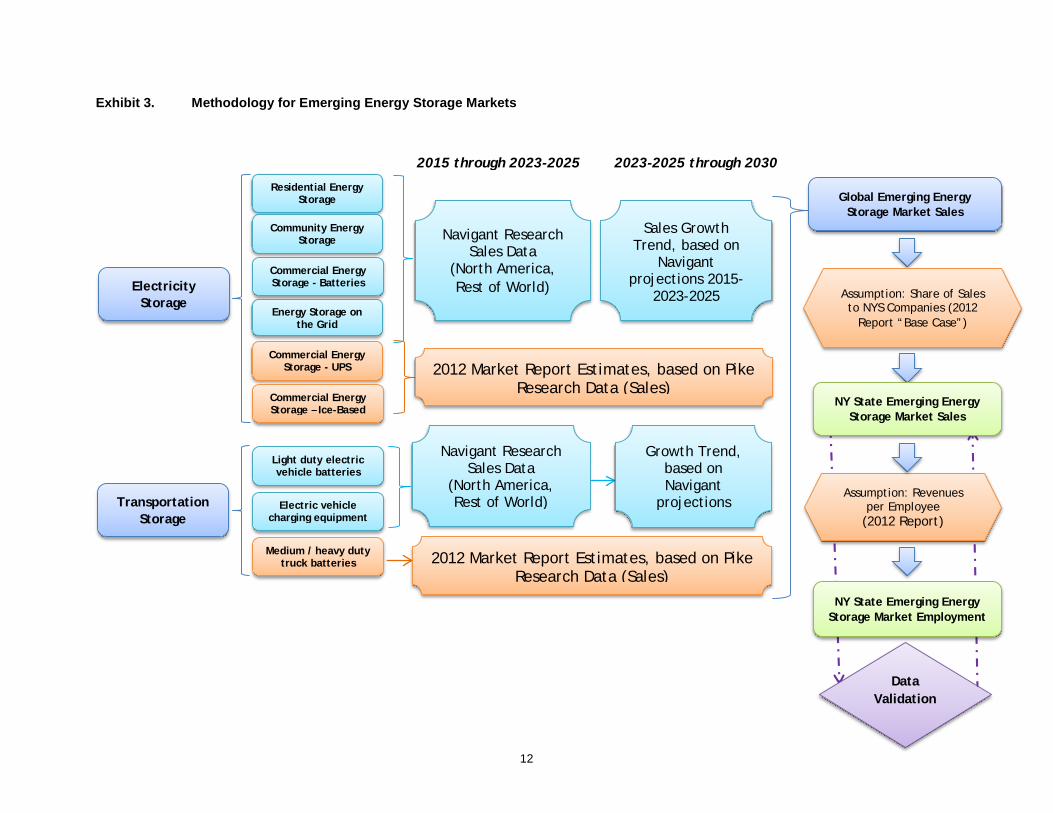
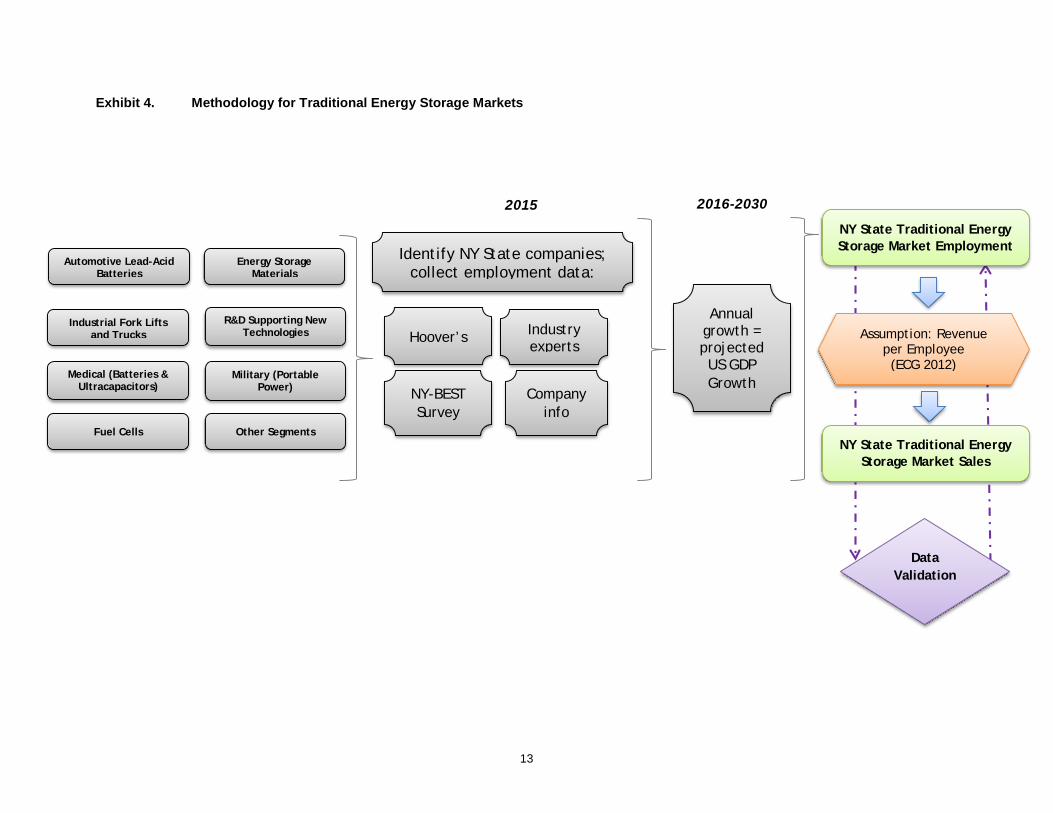
An overview of the methodology used to assess each energy storage industry market segment is provided on the following pages (Exhibit 3 and Exhibit 4). Note that this report applies two different methodologies to estimate New York State company revenues and New York State employment, depending on the market type: for emerging energy storage markets, this report first estimates New York State company sales to global markets, and then derives employment estimates from these sales figures; for traditional energy storage markets, this report first estimates employment at corresponding New York State businesses and organizations, and then derives revenues accruing to New York State entities in these markets from these employment figures. Consultation with industry experts, including NY-BEST, was used to validate these approaches and results for traditional energy storage markets.
12
Exhibit 3. Methodology for Emerging Energy Storage Markets
Electricity Storage
Transportation Storage
Residential Energy Storage
Community Energy Storage
Commercial Energy Storage - Batteries
Energy Storage on the Grid
Light duty electric vehicle batteries
Medium / heavy duty truck batteries
Electric vehicle charging equipment
Commercial Energy Storage - UPS
Commercial Energy Storage – Ice-Based
2015 through 2023-2025
Navigant Research Sales Data
(North America, Rest of World)
Navigant Research Sales Data
(North America, Rest of World)
2012 Market Report Estimates, based on Pike Research Data (Sales)
2012 Market Report Estimates, based on Pike Research Data (Sales)
2023-2025 through 2030
Sales Growth Trend, based on
Navigant projections 2015-
2023-2025
Growth Trend, based on Navigant
projections
Global Emerging Energy Storage Market Sales
Assumption: Share of Sales to NYS Companies (2012
Report “Base Case”)
Assumption: Revenues per Employee
(2012 Report)
NY State Emerging Energy Storage Market Sales
NY State Emerging Energy Storage Market Employment
Data Validation
13
Exhibit 4. Methodology for Traditional Energy Storage Markets
Data Validation
Automotive Lead-Acid Batteries
Industrial Fork Lifts and Trucks
Medical (Batteries & Ultracapacitors)
Fuel Cells
Energy Storage Materials
R&D Supporting New Technologies
Military (Portable Power)
Other Segments
2016-2030
Identify NY State companies; collect employment data:
Hoover’s
NY-BEST Survey
Company info
Industry experts
2015
Annual growth = projected US GDP Growth
NY State Traditional Energy Storage Market Employment
Assumption: Revenue per Employee (ECG 2012)
NY State Traditional Energy Storage Market Sales

14
Key Assumptions and Methodological Changes
While this report generally uses a similar methodology to the one applied in the 2012 market report to estimate the energy storage market in New York State, it imposes a few key methodological changes and alternative assumptions, including:
• Exclusion of the “optimistic case” scenario. The 2012 market report included two sets of future growth projections for the energy storage market in New York State: a “base case” and an “optimistic case,” differentiated through the use of higher expected market share accruing to New York State companies in the “optimistic case.” This report does not use the “optimistic case” scenario from the 2012 market report; comparison of the “base case” and “optimistic case” projections from the 2012 market report with current estimates of the energy storage market suggests that projections using the “base case” may be more defensible and in line with actual market development between 2012 and 2015. Therefore, when using sales factors to estimate the share of global sales accruing to New York State companies in emerging energy storage markets, this report focuses on the “base case” proportional sales factors from the 2012 market report, rather than the “optimistic case” factors.
• Modeled growth rates post-2023-2025. The Pike Research data underpinning the emerging energy storage market estimates in the 2012 market report provided current (2012) estimates by segment, as well as projections for future years up to 2022, depending on market segment. The Navigant Research data used in this report similarly provide current (2015) estimates by segment, as well as projections for future years up to 2023, 2024 or 2025, depending on market segment.
The 2012 market report used a segment-specific methodology to project growth in market segments for those years where Pike Research data were no longer available (i.e., post-2022 for all market segments, and for some earlier years in other market segments as well). For example, for some market segments, the annual growth rate between 2021 and 2022 was applied on a straight-line basis for the remaining years between 2022 and 2030. For other segments, the 2012 market report calculated a cumulative annual growth rate (CAGR) for the period where Pike Research data were available, and this CAGR for all years through 2022, and then a growth rate equal to half the calculated CAGR for the remaining years out to 2030.
In contrast, this report uses the shape of the growth curves estimated by the updated Navigant Research data to drive its post-2023-2025 projections, for which Navigant Research projections are not available. For example, where Navigant Research projections estimate a “kink” in the curve signaling slower growth after a given point in time, this report uses the growth rate projected by the “post-kink” curve rather than a CAGR. Where the Navigant data suggest a growth rate approximating a logarithmic function, this function’s growth rate is extended through 2030. In general, the post-2023-2025 projections used in this report build directly on the latest available projections in the Navigant data, where available, rather than making differential assumptions about growth trends in these years.

15
• Use of a consistent growth factor based on GDP growth projections for traditional storage market growth. The 2012 market report used a set of variable growth factors to project employment growth in traditional storage markets. These factors varied between 2.5 percent and 10 percent in annual growth, depending on the traditional storage market segment. Given the mature nature of these markets, this report models future projected employment within them by assuming an increase at the projected growth in GDP per the latest estimates from the Congressional Budget Office (CBO). As these projections are currently available only through 2026, GDP growth for 2027 through 2030 is assumed to be equivalent to the single-year growth of GDP in 2026, or approximately 4.1 percent. The 2012 market report estimated average annual employment growth in traditional storage markets at approximately 4.5 percent between 2012 and 2030; this is roughly consistent with the growth rates of approximately four percent used in this report.
• Use of productivity growth assumptions for both traditional and emerging energy storage markets. The 2012 market report applied productivity growth assumptions to emerging energy storage markets for the purposes of estimating employment in these markets. The use of productivity growth factors led to a given level of revenues equating to less employment over time, as increased productivity growth meant fewer employees would be required to hit a given revenue threshold. The 2012 market report did not model any productivity growth in traditional storage markets, leaving the revenue-to-employee ratio constant therein. This report applies assumptions regarding productivity growth to both traditional and emerging energy storage markets.
While emerging markets may enjoy greater productivity gains relative to traditional markets (contrary to the modeling convention used in this report), there appears to be sufficient ongoing momentum in traditional energy storage markets to suggest continued productivity gains therein. Specifically, some traditional markets, such as military batteries, may leverage new technologies in the near future. The distinction between emerging and traditional markets for purposes of assessing productivity growth is further complicated by the fact that spillover effects from emerging market developments may impact traditional markets as well. In particular, medical batteries may continue to receive significant development attention over the next decade. Therefore, this report applies the productivity growth assumptions from the 2012 market report to both emerging and traditional energy storage markets.
• Scope of the commercial energy storage market segment. The 2012 market report collected data on three specific segments of commercial energy storage: uninterruptable power supplies (UPS), ice-based thermal storage systems, and energy management systems such as time-of-use (TOU), demand charge management (DCM), electric service reliability, distributed renewable energy time shifts, and distributed renewable capacity firming. These categories were based on available 2012 data from Pike Research.
Updated, available data from Navigant Research, however, represent commercial energy storage sales for “battery-based” applications, which do not include UPS or ice-based

16
systems.11 It is unclear the extent to which the earlier data on energy management systems reflect or overlap with the updated Navigant data on battery-based systems, though the sizes of the two markets appear to be similar. Therefore, this report presents data on the commercial energy storage segments by incorporating estimates from the 2012 market report for UPS and ice-based systems, and Navigant data on battery-based systems.
• Removal of “shifting” projections for emerging energy storage markets. The 2012 market report adjusted (“shifted”) Pike Research data out two years to present a more conservative, slower growth approximation of energy storage market development. That is, where Pike indicated sales of $100 million in 2015, the 2012 report instead modeled the $100 million figure as being reached in 2017 instead. This appears to reflect some concern on the part of the report authors that the Pike data were optimistic. However, a review of the overall energy storage projections between the pre-2013 Pike data and the 2015/2016 Navigant data suggests that no such “shift” was necessary, and that for many market segments the Pike data predicted global market development with reasonable accuracy. Therefore, for segments with no available updated Navigant data, this report does not use the “shifted” data for these segments from the 2012 market report; instead it employs the underlying, non-“shifted” Pike data. Given that updated Navigant market projections are generally less optimistic than the previous Pike projections for many emerging energy storage market segments, this lack of “shifting” does not substantially alter the estimates in this report relative to those in the 2012 market report.
Due to the uncertainty associated with the parameters and assumptions used in the 2012 market report, as well as some of the assumptions required for the methodological changes described above, this report also assesses a “delayed market adoption” scenario that alters key parameters from the approach used to generate the “consistent growth” scenario featured on the following pages. See the penultimate section of this report for additional information.
11 This description was confirmed through email follow-up communication with Navigant Research on February 26, 2016. Specifically, Navigant indicated that its Community, Residential, and Commercial Energy Storage (CRES) report, tables 5.40 through 5.46 “only covers battery technologies” as compared to Table 4.1 from Pike Research’s earlier ESCB-11 report, which “likely includes all technologies.” In confirmation, Navigant noted that their report tracks only the “overall C&I Energy storage market, which does not include Ice-based storage” and that Navigant has “not been actively tracking the market for UPS systems specifically.” Data in this report have also subsequently been updated with newer Navigant Research data contained in its Market Data: Commercial & Industrial Energy Storage report, published in the first quarter of 2016, which similarly addresses the energy storage market in terms of battery-based applications for commercial and industrial buildings.

17
Analytic Process and Results
The market for energy storage is driven by a variety of complex and interconnected factors. The rate of adoption of new energy storage technologies and the timing of market growth varies substantially with application, geography, and location of use. Competitive value propositions, in terms of performance and cost, are critical to achieving high levels of market penetration for a given application. Electricity storage technologies compete with different alternatives, depending on the application. For example, medium-scale electricity storage systems compete with gas turbines and demand response technologies, while light duty vehicle batteries compete with clean diesel, natural gas, and fuel cell systems.
Regulatory policies that may significantly impact market development also vary substantially globally, or within countries. Consequently, competitive economics are highly dependent on location and regulatory policy. Within New York State, future developments in the battery and energy storage market will be influenced by the ongoing REV proceeding and its emphasis on DER, as well as the Clean Energy Standard’s focus on the 50 by 30 Goal.12
Regulation and policy is also important in its ability to alter the value proposition for energy storage, which depends on who pays for the device and who receives the value. Different applications will penetrate different markets at different rates. In New York State, a number of emerging technologies are on the path to commercialization, but it remains to be seen which of these technologies will make it to market and how quickly the market will accept (or reject) them. However, the State’s high demand charges and electricity costs enhance the potential for certain types of energy storage that are already commercially available (i.e., residential and commercial behind-the-meter technologies) to be adopted quickly. Moreover, New York State ranks in the top tier of states for various economic indicators pertaining to clean energy technologies (cleantech) per the New York State Clean Energy Technologies Innovation Metrics 2015 Final Report, including fifth nationwide in battery/energy storage patents.13
The battery and energy storage market is highly complex, with the supply chain comprising market actors from many regions of the world. While some of these actors have a presence in New York State, many of them also have a national or even international presence, and are subject to market forces beyond those found in any one state or region. Therefore, a global perspective is critical to understand overall market demand/growth in this industry. Continuing advances in technology, reductions in cost, and improvements in regulatory policies and incentives will ultimately drive strong market growth, both globally and within New York State.
The remainder of this chapter describes the various segments of the energy storage markets and associated forecasts in turn. As described in the previous section, this report applies differing
12 For additional information on these topics, see this report’s companion market assessment of energy storage, NYSERDA Energy Storage and NY BEST Program: Market Characterization and Assessment. 13 See NYSERDA, New York State Clean Energy Technologies Innovation metrics 2015 Final Report, available online at: https://www.nyserda.ny.gov/-/media/Files/EIBD/15-32-Clean-Energy-Technologies-Innovation-Metrics-Report.pdf. See also additional highlights regarding New York State’s national leadership in clean energy technologies at: http://www.nyserda.ny.gov/Partners-and-Investors/Clean-Energy-Startups/NYS-a-National-Leader-in-Cleantech.

18
methodologies to estimating and projecting the emerging and traditional energy storage markets, due to differences in the available data used to characterize these markets.
Analytic Process: Emerging Global Markets – Electricity Storage
Electricity storage markets consist of applications on the customer and utility sides of the meter.14 In the 2012 market report, the electricity storage segment was divided into the following sub-segments:
• Community energy storage – energy storage systems at the distribution transformer level on the utility side of the meter;
• Residential energy storage – behind the meter energy storage targeted at homeowners;
• Commercial energy storage – uninterruptable power supplies (UPS) – systems used to reduce or mitigate the impacts of electrical service outages and poor power quality;
• Commercial energy storage – ice-based – thermal energy storage predicated around shifting cooling energy expenditures to off-peak hours;
• Commercial energy storage – time of use (TOU) energy cost management, demand charge management (DCM), and similar systems; and
• Energy storage on the grid – applications for energy storage on the utility side of the meter involving shifting energy from one time period to another, such as grid asset optimization.
In the 2012 market report, the source for global market estimates for these segments was Pike Research, which provided projection data for global and North American markets for a time horizon between 2012 and 2022, depending on the market segment.15
For these six sub-segments, third-party global market data and projections from Navigant Research are available for four segments: community energy storage, residential energy storage, commercial energy storage (battery technologies), and energy storage on the grid. Navigant’s updates for these sectors are consistent with prior Pike definitions and do not overlap with each other. The exception is commercial energy storage, where Navigant currently defines the segment as all battery-based energy storage applications for commercial buildings, not including UPS or ice-based storage; this report assumes that
14 Another market segment directly related to emerging electricity storage applications and technologies are energy storage management systems, software suites that enable and enhance energy storage hardware products and components. The outputs of this segment (i.e., software packages) must be bundled together with another application (e.g., commercial energy storage) in order to deliver value. Therefore, this market segment is not considered separately within this document, as the value it generates is entwined with the use of electricity storage applications described in this section. As of the time of composing this report, there do not appear to be any available data that differentiate or separate this market segment from other electricity storage market segments. 15 For some segments, Pike Research provided estimates and projections annually for 2012 through 2022; for others, the projections were available only for 2012 through 2016, or for another span of years within the 2012-2022 range.
19
this segment aligns to the TOU, DCM, and similar systems estimated for commercial energy storage applications for Pike Research. 16
Navigant’s market projections run only through 2023, 2024, or 2025, depending on the market segment. For each of these six sub-segments, for the remaining years through 2030, this report extends the general trend projected by Navigant for growth in that sub-segment through 2030.17
The updated estimates reflect substantial changes in market information and forecasting methodology. Specifically, Navigant’s updated projections are considerably less optimistic regarding community energy storage than Pike’s earlier projections, but project much greater gains over time for residential energy storage than Pike projected in 2012.
For the remaining two sub-segments pertaining to commercial energy storage (UPS and ice-based systems), no updated estimates or market projections from Navigant Research are available. Therefore, for these two sub-segments, this report relies on the estimates and projections included in the 2012 market report.18 Use of the Pike data from the 2012 market report was validated through follow-up with Navigant, who confirmed that no major changes or disruptions occurred in these market segments to suggest that continued use of earlier Pike projections for these segments would be inappropriate. Additionally, relative to other emerging market sectors, these two sectors feature relatively low projected growth, and constitute only approximately 15 percent of projected energy storage sales revenues in New York State by 2030.
Results: Emerging Global Markets – Electricity Storage
Residential and community energy storage are currently relatively small energy storage market segments, but are projected for substantial growth through 2030. Globally, the community energy storage market is projected to increase tenfold between 2015 and 2020, from $84 million in 2015 to $840 million in 2020, while the residential energy storage market is projected by Navigant Research to increase threefold over this period, from $390 million in 2015 to $1.3 billion in 2020. These projections differ significantly from earlier Pike Research projections for the across the North American and “rest of world” regions. Specifically, the Pike Research projections featured $57 million in North American community energy storage sales, and $54 million in community storage sales in the rest of the world in 2015, as compared to $8 million and $74 million, respectively, from the Navigant estimates; follow-up with Navigant Research indicates that prior forecasts of the community energy storage market were overly optimistic (Pike: $110
16 See pages 14-15 for a discussion of how this report defines the scope of the commercial energy storage market segment, in contrast with that of the 2012 market report. 17 In other words, for the six sub-segments where comparable Navigant data are available, this report uses Navigant data for 2015 through 2023, 2024, or 2025, and extends the general trend as seen in the Navigant data (for each sub-segment) for 2024, 2025, or 2026 through 2030. 18 Within the 2012 market report, Pike Research data were “shifted” out two years to present a more conservative, slower growth approximation of energy storage market development. That is, where Pike indicated sales of $100 million in 2015, the 2012 report instead modeled the $100 million figure as being reached in 2017 instead. However, a review of the overall energy storage projections between the pre-2013 Pike data and the 2015/2016 Navigant data suggests that no such “shift” was necessary, and that the Pike data predicted global market development with reasonable accuracy. Therefore, this report does not use the “shifted” data for these segments from the 2012 market report, but rather the underlying, non-“shifted” Pike data.

20
million global sales compared to Navigant: $84 million global sales in 2015).19 Meanwhile, earlier forecasts of the residential energy storage market underestimated the strong, rapidly growing demand for these applications between 2012 and 2015 (Pike: $43 million compared to Navigant: $390 million in 2015).20
In addition, while Navigant’s updated forecasts feature more modest growth for community energy storage applications in the North America region, projections for community energy storage in the rest of the world strongly outpace Pike’s projections for this sub-segment. For example, Pike Research projected 2020 community energy storage sales of $230 million in North America and $210 million in the rest of the world, while Navigant’s updated forecasts feature 2020 sales projections in this sub-segment of $90 million for North America and $750 million for the rest of the world. Therefore, Pike’s prior overestimation in the community energy storage market applies specifically to North America, and based on Navigant’s updated forecasts, Pike’s prior projections may have substantially underestimated the potential for these applications globally.
Commercial energy storage includes an array of possible technologies. UPS applications, already present in must-run buildings such as hospitals and police stations and also ubiquitous in smaller scales for personal or commercial computing, represent a relatively mature market with lower expected growth rates: global estimates of UPS system sales for 2015 are $4.5 billion, growing to $6.3 billion by 2020. Ice-based commercial energy storage systems, which include both rooftop and custom systems, represent a more emerging market segment, with $130 million in global sales in 2015, increasing to $420 million by 2020. Additional commercial energy storage applications may include battery-based systems and energy management applications, such as demand control management (DCM) systems; sales of these systems and applications are estimated globally at $200 million in 2015, and are projected to grow very rapidly to $6.6 billion by 2020. Navigant Research projects the battery-based commercial energy storage segment to plateau in North America at approximately $3.7 billion in annual sales in 2021 and then stabilize at approximately $3.6 billion in annual sales in 2023 and thereafter, suggesting potential saturation of this market after 2020; however, Navigant Research projects that the segment will continue to grow in the rest of the world through 2030.
Energy storage on the grid reflects applications such as renewables integration, transmission and distribution (T&D) support, and voltage level and reactive power (VAR) management. This sub-segment is estimated to be both currently large and poised for further growth, with $920 million in 2015 global sales, growing to $7.5 billion by 2020 and $27 billion by 2030. Follow-up with Navigant research indicated that since 2012, differences in pricing assumptions and deployments have led to revisions to earlier, overly-optimistic forecasts by Pike.
19 Note that the figures within the “2015 (projected)” column of Exhibit 5 reflect the “shift” applied within the 2012 market report that adjusted (i.e., delayed) growth out by two years compared to the Pike Research projections. Therefore, the figures in this column reflect Pike’s 2013 projections, which are correspondingly much lower than the 2015 projections cited in this paragraph. See page 15 and footnote 14 for discussion of the application of this “shift.” 20 Again, these figures reflect non-“shifted” estimates from the Pike Research data, rather than the “shifted” estimates from the 2012 market report, which reflect projected 2013 estimates from Pike Research.

21
Exhibit 5 summarizes estimated and projected market size for each electricity storage sub-segment, by geographic region. In total, the electricity storage market is currently estimated at $6.2 billion in global sales, increasing to $23 billion by 2020 and $78 billion by 2030.21
Exhibit 5. Sales in Emerging Global Electricity Storage Markets, by Segment and Geographic Scope, 2015-2030 ($millions)
Market Segment
Geographic Scope 2012*
2015* (proj.) 2015 2020 2025 2030
CAGRa 2015-2020
CAGRa 2021-2030
CAGRa 2015-2030
Community Energy
Storageb
North America N/A
$9 $8 $90 $178 $190 64.1% 1.4% 24.0% Rest of World $6 $76 $749 $2,580 $4,140 57.8% 13.6% 30.5% Total World $14 $84 $839 $2,750 $4,330 58.4% 12.6% 30.1%
Residential Energy
Storageb
North America N/A
$1 $20 $310 $1,120 $1,850 72.7% 15.0% 35.1% Rest of World $4 $368 $968 $4,380 $20,400 21.3% 35.6% 30.7% Total World $6 $389 $1,280 $5,500 $22,300 26.9% 31.9% 31.0%
Commercial Building Energy
Storage - UPSc
North America $916 $980 $1,120 $1,570 $2,000 $2,370 7.0% 3.9% 5.1% Rest of World $2,750 $2,940 $3,370 $4,720 $5,990 $7,120 7.0% 3.9% 5.1%
Total World $3,660 $3,920 $4,490 $6,290 $7,990 $9,490 7.0% 3.9% 5.1%
Commercial Building Energy
Storage – Ice-basedc
North America $26 $42 $96 $343 $817 $1,580 29.0% 15.4% 20.5% Rest of World $18 $21 $31 $75 $186 $457 19.6% 19.7% 19.7%
Total World $44 $64 $127 $418 $1,000 $2,030 27.0% 16.2% 20.3%
Commercial Building Energy
Storage – Battery-basedb,d
North America $75 $113 $152 $3,560 $3,550 $3,550 87.8% -0.4% 23.4% Rest of World $225 $338 $47 $3,080 $7,300 $9,620 130.6% 6.3% 42.6%
Total World $300 $450 $199 $6,630 $10,800 $13,600 101.5% 4.0% 32.2%
Energy Storage on the Gridb
North America $204 $437 $218 $1,790 $3,570 $4,960 52.4% 8.1% 23.2% Rest of World $1,530 $3,090 $704 $5,670 $14,800 $22,200 51.8% 10.8% 25.9% Total World $1,730 $3,520 $921 $7,460 $18,400 $27,100 51.9% 10.2% 25.3%
Total Electricity Storage
North America $1,220 $1,580 $1,620 $7,660 $11,200 $14,500 36.5% 5.5% 15.7% Rest of World $4,520 $6,400 $4,590 $15,300 $35,200 $63,900 27.1% 12.5% 19.2% Total World $5,740 $7,980 $6,210 $22,900 $46,500 $78,400 29.9% 10.8% 18.4%
Totals may not sum due to rounding. N/A = not available. * Estimates from the 2012 market report, including 2015 projections from that report, provided for comparison purposes. a Cumulative Annual Growth Rate (CAGR) over the target period, defined as: (Salesy/Salesx)(1/(y-x))-1, where x is the first year of the target range, and y is the last year of the target range. b Source: Navigant Research 2015 and 2016 reports for 2015 through 2023 or 2024, depending on the segment. For 2024 or 2025 through 2030, the trends projected by Navigant for each segment were extended out to 2030 in a conservative manner. c Source: ECG Consulting Group Inc., The Economic Impact of Developing an Energy Storage Industry in New York State, prepared for NY-BEST on October 5, 2012. Estimates based on underlying data underpinning the report from Pike Research reports from 2012 and earlier. d See Section III regarding the differences between this segment between the Pike data used in the 2012 market report and the Navigant data used in this report.
21 Data presented by GreenTech Media during a Clean Energy Group webinar in August 2016 supports these findings. Specifically, GreenTech Media indicated that 2015 was a transition year for utilities and electricity storage more broadly, with large increases in installed capacity and market development already occurring in the first quarter of 2016 and expected to continue in the future, consistent with the projections from Navigant Research that show a greater acceleration of growth post-2015.

22
Analytic Process: Emerging Global Markets – Transportation Storage
Transportation storage markets include batteries and associated equipment for light duty cars and trucks, as well as medium and heavy duty vehicles. The emerging sub-segments in the transportation storage market pertain to batteries for electric, hybrid electric, plug-in electric, and battery electric vehicles and trucks, as well as charging equipment for these batteries.22 In the 2012 market report, the electricity storage segment was divided into the following sub-segments:
• Light duty vehicle batteries;
• Electric vehicle charging equipment; and
• Medium duty and heavy duty truck batteries.
Of these three sub-segments, third-party global market data and projections from Navigant Research are available for two sub-segments: light duty vehicle batteries and electric vehicle charging equipment. The analytic approach for these two sub-segments is similar to that for the six electricity storage sub-segments for which Navigant data are available, including extending the general projected growth trend for these segments out to 2030 in years for which Navigant data are not available.
For the remaining sub-segment, medium duty and heavy duty truck batteries, no updated estimates or market projections from Navigant Research are available. Therefore, for this sub-segment, this report relies on the estimates and projections included in the 2012 market report, wherein total sales were calculated through use of separate third-party market data on truck battery capacity (both Li-ion and nickel-metal hydride, or NiMH) and battery pricing. Again, the analytic approach for this sub-segment is similar to that for the two electricity storage sub-segments for which Navigant data were not available, specifically, using the data and projections for this sub-segment from the 2012 market report for the entire 2015-2030 period of analysis.
Results: Emerging Global Markets – Transportation Storage
Light duty vehicle propulsion battery markets are estimated at $7.5 billion in global sales in 2015, growing to $24 billion by 2020 and $32 billion by 2030. Follow-up with Navigant Research indicated that previous Pike Research forecasts were overly optimistic in their near-term projections; however, Navigant’s revised reports feature greater projected future growth than earlier reports. Medium and heavy duty propulsion battery markets are estimated at $1.8 billion in 2015 global sales, growing to $4.4 billion by 2020 and $9.1 billion in 2030.
22 Similarly to the emerging electricity storage market, another market segment directly related to the emerging transportation storage market is energy storage management systems for vehicles (i.e., software suites that enable and enhance vehicular energy storage hardware and components). Because these software packages must be bundled together with energy storage hardware to deliver value (i.e., a vehicle’s energy storage management software is bundled with purchase of the vehicle for the end user), this market segment is not considered separately within this document. As of the time of composing this report, there do not appear to be any available data that differentiate or separate this market segment from other transportation storage market segments for detailed analysis.

23
For electric vehicle charging equipment, global sales are estimated at $1.1 billion in 2015, growing to $4.1 billion by 2020 and $8.3 billion by 2030. Follow-up with Navigant Research indicated that, similar to previous Pike Research forecasts for light duty vehicle battery markets, earlier forecasts for electric vehicle charging equipment were overly optimistic. However, unlike the updated projections for light duty vehicle battery markets, the updated forecasts for electric vehicle charging equipment feature lower growth expectations throughout the next decade.
Exhibit 6, on the following page, summarizes estimated and projected market size for each transportation storage sub-segment, by geographic region. In total, the transportation storage market is currently estimated at $10 billion in global sales, increasing to $33 billion by 2020 and $49 billion by 2030.
Exhibit 6. Sales in Emerging Global Transportation Storage Markets, by Segment and Geographic Scope, 2015-2030 ($millions)
Market Segment
Geographic Scope 2012*
2015* (proj.) 2015 2020 2025 2030
CAGRa
2015-2020
CAGRa
2021-2030
CAGRa 2015-2030
Light Duty Electric Vehicle
Batteriesb
North America $943 $1,620 $2,730 $8,140 $9,630 $10,750 24.4% 2.7% 9.6%
Rest of World $2,890 $4,610 $4,770 $16,000 $18,800 $21,150 27.4% 2.8% 10.4%
Total World $3,290 $6,230 $7,500 $24,100 $28,500 $31,900 26.3% 2.7% 10.1%
Electric Vehicle
Charging Equipmentb
North America $133 $290 $367 $1,220 $1,840 $2,590 27.1% 7.6% 13.9%
Rest of World $686 $1,370 $706 $2,870 $3,960 $5,710 32.4% 7.4% 15.0%
Total World $819 $1,660 $1,070 $4,090 $5,790 $8,300 30.7% 7.4% 14.6%
Medium Duty and Heavy Duty Truck Batteriesc
North America $81 $136 $229 $487 $722 $863 16.3% 5.0% 9.3%
Rest of World $450 $809 $1,620 $3,860 $6,370 $8,260 19.0% 6.9% 11.5%
Total World $531 $945 $1,850 $4,350 $7,090 $9,120 18.7% 6.7% 11.2%
Total Transporta-tion Battery
North America $1,160 $2,050 $3,320 $9,840 $12,200 $14,200 24.2% 3.6% 10.2% Rest of World $4,020 $6,790 $7,100 $22,700 $29,200 $35,100 26.2% 4.3% 11.2% Total World $5,180 $8,840 $10,420 $32,600 $41,400 $49,300 25.6% 4.1% 10.9%
Totals may not sum due to rounding. * Estimates from the 2012 market report, including 2015 projections from that report, provided for comparison purposes. a Cumulative Annual Growth Rate (CAGR) over the target period, defined as: (Salesy/Salesx)(1/(y-x))-1, where x is the first year of the target range, and y is the last year of the target range. b Source: Navigant Research 2015 and 2016 reports for 2015 through 2023 or 2024, depending on the segment. For 2024 or 2025 through 2030, the trends projected by Navigant for each segment were extended out to 2030 in a conservative manner. c Source: ECG Consulting Group Inc., The Economic Impact of Developing an Energy Storage Industry in New York State, prepared for NY-BEST on October 5, 2012. Estimates based on underlying data underpinning the report from Pike Research reports from 2012 and earlier.
The transportation storage market is currently larger than the electricity storage market, and is also projected to grow at a slower rate in the future, especially after 2020. The global electricity storage market is projected to surpass the global transportation storage market in total sales in 2024, and grow to over 1.3 times the size of the global transportation storage market by 2030.

24
New York State Company Sales to Emerging Energy Storage Markets
To derive the share of global sales accruing to companies in New York State, this report employs assumptions from the “base case” of the 2012 market report, as shown in Exhibit 7 and Exhibit 8.23 Specifically, for electricity storage market segments, companies in New York State are assumed to capture five percent of 2015 sales in North America, and 1.5 percent of 2015 sales in the rest of the world (i.e., sales taking place outside of North America). These shares increase steadily to 15 percent and five percent, respectively, by 2025, and remain at these levels through 2030. Per the 2012 market report, these shares are consistent with New York State revenue shares in a broad range of energy industry markets.24 Additionally, these assumptions are consistent with current data on New York State’s manufacturing market: per the National Association of Manufactures (NAM), New York State’s share of total domestic manufacturing output is approximately five percent.25
Exhibit 7. Share of Global Electricity Storage Market Sales Accruing to New York State Companies, 2015 - 2030
Geographic Market 2015 2016 2017 2018 2019 2020 2021 2022 2023 2024 2025-2030
Share of North America sales
5.00% 6.00% 7.00% 8.00% 9.00% 10.00% 11.00% 12.00% 13.00% 14.00% 15.00%
Share of Rest of World sales 1.50% 1.90% 2.30% 2.70% 3.00% 3.25% 3.70% 4.10% 4.50% 4.80% 5.00%
“Rest of World sales” refer to all sales taking place outside of North America, and are not a subset or proportion of North American sales. Source: ECG Consulting Group Inc., The Economic Impact of Developing an Energy Storage Industry in New York State, prepared for NY-BEST on October 5, 2012. Projections reflect “base case” scenario. Note: Figures in this Exhibit presented to the third significant digit to illustrate differential in market shares across years (e.g., 3.25 percent versus 3.70 percent).
Meanwhile, for transportation storage market segments, companies in New York State are assumed to capture a different share of total sales depending on the sub-segment in question. For light duty vehicle batteries, the share of sales accruing to companies in New York State is 1.25 percent of sales in North America and 1.25 percent of sales in the rest of the world. These shares increase to five percent and two percent, respectively, by 2025, and remain at these levels through 2030. For medium and heavy duty truck batteries, the share of sales accruing to New York State companies is five percent of sales in North America and 2.75 percent of sales in the rest of the world. These shares increase to 15 percent and five percent, respectively, by 2025, and remain at these levels through 2030. Again, per the 2012 market
23 This report does not reference the “optimistic case’ of the 2012 market report. Follow-up with Navigant Research indicated that prior projections were overly optimistic and in many cases were revised downward; therefore, this report employs assumptions from only the more conservative ‘base case.” 24 These figures are also consistent with the relative population of New York State, the need for solutions for New York State’s aging grid infrastructure, and the strong financial backing for New York State companies. 25 See National Association of Manufacturers, State Manufacturing Data Table, March 2016, available online at: http://www.nam.org/Data-and-Reports/State-Manufacturing-Data/State-Manufacturing-Data/2015-State-Manufacturing-Data-Table/.

25
report, these shares are consistent with New York State revenue shares in a broad range of energy industry markets.26
For the electric vehicle charging equipment sub-segment, the share of total sales accruing to New York State companies is based on an average of the shares of total sales accruing to New York State companies for light duty and medium/heavy duty batteries, weighted by total sales of each battery type. As sales of light duty batteries are much greater than sales of medium and heavy duty batteries, the share of total sales accruing to New York State companies for electric vehicle charging equipment more closely resembles the share of sales accruing to New York State companies for light duty vehicle batteries.
Exhibit 8. Share of Global Transportation Storage Market Sales Accruing to New York State Companies, 2015 - 2030
Market Segment
Geo-graphic Market 2015 2016 2017 2018 2019 2020 2021 2022 2023 2024
2025-2030
Light Duty Electric Vehicle
Batteries
Share of North America sales
1.25% 1.50% 1.75% 2.00% 2.25% 2.50% 3.00% 3.50% 4.00% 4.50% 5.00%
Share of Rest of World sales
1.25% 1.35% 1.40% 1.45% 1.50% 1.55% 1.60% 1.70% 1.80% 1.90% 2.00%
Electric Vehicle
Charging Equip-ment
Share of North America sales
1.54% 1.79% 2.05% 2.32% 2.61% 2.92% 3.49% 4.08% 4.63% 5.17% 5.70%
to 5.74%
Share of Rest of World sales
1..63% 1.71% 1.76% 1.81% 1.90% 2.03% 2.17% 2.37% 2.54% 2.66% 2.76%
to 2.84%
Medium Duty and
Heavy Duty
Electric Truck
Batteries
Share of North America sales
5.00% 6.00% 7.00% 8.00% 9.00% 10.00% 11.00% 12.00% 13.00% 14.00% 15.00%
Share of Rest of World sales
2.75% 3.00% 3.25% 3.50% 3.75% 4.00% 4.25% 4.50% 4.75% 4.90% 5.00%
“Rest of World sales” refer to all sales taking place outside of North America, and are not a subset or proportion of North American sales. Source: ECG Consulting Group Inc., The Economic Impact of Developing an Energy Storage Industry in New York State, prepared for NY-BEST on October 5, 2012. Projections reflect “base case” scenario. Shares for electric vehicle charging equipment reflect average of shares for light duty and medium/heavy duty batteries, weighted by total sales of each battery type. Because the ratio of projected battery sales varies slightly between 2025 and 2030, so does the projected share of total sales for this segment in across these years. Note: Figures in this Exhibit presented to the third significant digit to illustrate differential in market shares across years (e.g., 3.25 percent versus 3.70 percent).
To calculate New York State company sales in a given market segment in a given year, this report multiplies total sales in that segment (Exhibit 5 and Exhibit 6) by the appropriate shares of sales accruing to New York State companies (Exhibit 7 and Exhibit 8). For example, this report calculates 2015 New
26 Data from the Alliance of Automobile Manufacturers (Auto Alliance) are generally with these estimates. Auto Alliance indicates that New York State had 5.75 percent of domestic automobile sales in 2015, and the larger market actors in the electric vehicle market, such as Tesla and Nissan, do not have a presence in New York State. While some other companies with ongoing electric vehicle efforts, such as Ford, GM, and BMW do have a presence in New York State, their market share is relatively small.
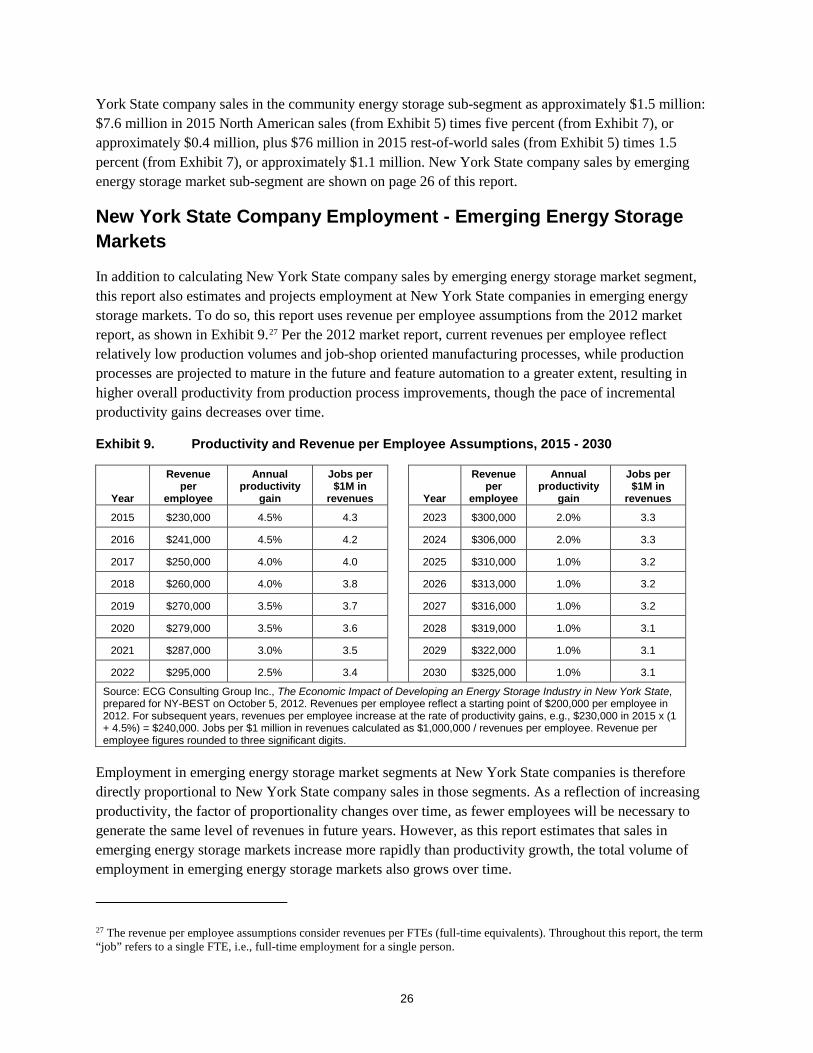
26
York State company sales in the community energy storage sub-segment as approximately $1.5 million: $7.6 million in 2015 North American sales (from Exhibit 5) times five percent (from Exhibit 7), or approximately $0.4 million, plus $76 million in 2015 rest-of-world sales (from Exhibit 5) times 1.5 percent (from Exhibit 7), or approximately $1.1 million. New York State company sales by emerging energy storage market sub-segment are shown on page 26 of this report.
New York State Company Employment - Emerging Energy Storage Markets
In addition to calculating New York State company sales by emerging energy storage market segment, this report also estimates and projects employment at New York State companies in emerging energy storage markets. To do so, this report uses revenue per employee assumptions from the 2012 market report, as shown in Exhibit 9.27 Per the 2012 market report, current revenues per employee reflect relatively low production volumes and job-shop oriented manufacturing processes, while production processes are projected to mature in the future and feature automation to a greater extent, resulting in higher overall productivity from production process improvements, though the pace of incremental productivity gains decreases over time.
Exhibit 9. Productivity and Revenue per Employee Assumptions, 2015 - 2030
Year
Revenue per
employee
Annual productivity
gain
Jobs per $1M in
revenues
Year
Revenue per
employee
Annual productivity
gain
Jobs per $1M in
revenues
2015 $230,000 4.5% 4.3 2023 $300,000 2.0% 3.3
2016 $241,000 4.5% 4.2 2024 $306,000 2.0% 3.3
2017 $250,000 4.0% 4.0 2025 $310,000 1.0% 3.2
2018 $260,000 4.0% 3.8 2026 $313,000 1.0% 3.2
2019 $270,000 3.5% 3.7 2027 $316,000 1.0% 3.2
2020 $279,000 3.5% 3.6 2028 $319,000 1.0% 3.1
2021 $287,000 3.0% 3.5 2029 $322,000 1.0% 3.1
2022 $295,000 2.5% 3.4 2030 $325,000 1.0% 3.1
Source: ECG Consulting Group Inc., The Economic Impact of Developing an Energy Storage Industry in New York State, prepared for NY-BEST on October 5, 2012. Revenues per employee reflect a starting point of $200,000 per employee in 2012. For subsequent years, revenues per employee increase at the rate of productivity gains, e.g., $230,000 in 2015 x (1 + 4.5%) = $240,000. Jobs per $1 million in revenues calculated as $1,000,000 / revenues per employee. Revenue per employee figures rounded to three significant digits.
Employment in emerging energy storage market segments at New York State companies is therefore directly proportional to New York State company sales in those segments. As a reflection of increasing productivity, the factor of proportionality changes over time, as fewer employees will be necessary to generate the same level of revenues in future years. However, as this report estimates that sales in emerging energy storage markets increase more rapidly than productivity growth, the total volume of employment in emerging energy storage markets also grows over time.
27 The revenue per employee assumptions consider revenues per FTEs (full-time equivalents). Throughout this report, the term “job” refers to a single FTE, i.e., full-time employment for a single person.

27
Aggregate Results: New York State Company Sales and Employment in Emerging Energy Storage Markets
Exhibit 10 summarizes New York State company sales and employment across the array of emerging energy storage market segments. These results are similar, but somewhat less aggressive, especially in later years, than those in the 2012 market report. Specifically, the 2012 market report estimated 2015 sales to global emerging energy storage markets at $310 million, compared to $320 million in Exhibit 10. The 2020 and 2025 sales figures are also similar (approximately $2.0 billion and approximately $4.9 billion, respectively) across the two reports. The main deviation occurs after 2025, with the 2012 market assessment projecting $7.7 billion in 2030 sales as compared to $7.2 billion in this report. Therefore, this report’s projections for New York State company sales to emerging energy storage markets are consistent with those in the 2012 market assessment for 2015 through 2025, and somewhat less optimistic between 2025 and 2030.28
On a sub-segment basis, the difference between the current estimates and projections and those in the 2012 assessment, is that updated data from Navigant Research feature less optimistic forecasts for a number of sub-segments, including community energy storage, energy storage on the grid, and light duty vehicle batteries. Comparatively, this report projects slightly higher growth in transportation storage markets than the 2012 assessment, and slightly lower growth in electricity storage markets, especially through 2020.
Exhibit 10. New York State Revenues and Employment: Emerging Energy Storage Markets, 2015-2030
New York State Revenues and Employment (Emerging Markets) Units 2012*
2015* (proj.) 2015 2020 2025 2030
CAGR 2015-2020
CAGR 2015-2030
Rev
enue
s Electricity Storage Market $M $35 $175 $150 $1,260 $3,450 $5,370 53.2% 27.0%
Transportation Storage Market $M $29 $132 $167 $749 $1,500 $1,810 35.0% 17.2%
Total Revenues $M $64 $307 $317 $2,010 $4,940 $7,190 44.7% 23.1%
Empl
oym
ent Electricity Storage Market Jobs 174 759 650 4,520 11,100 16,500 47.4% 24.1%
Transportation Storage Market Jobs 145 571 724 2,680 4,840 5,580 29.9% 14.6%
Total Employment Jobs 319 1,330 1,370 7,210 16,000 22,100 39.3% 20.3% * Estimates from the 2012 market report, including 2015 projections from that report, provided for comparison purposes. Totals may not sum due to rounding.
28 For the 2025 through 2030 period, this report uses the latest projected trends from Navigant Research for each sub-segment. This methodology differs from the methodology used in the 2012 market assessment, which applied a series of declining growth assumptions for this period. For example, for some sub-segments, the 2012 market assessment assumed that post-2022 growth was half of the cumulative annual growth rate projected by Pike Research for the 2017-2021 period. This indicates that Navigant’s updated forecasts feature strong expectations of slowing growth for emerging energy storage technologies by 2030, consistent with standard market saturation and growth slowdown patterns seen for most emerging technologies.

28
New York State company sales to global electricity storage markets exceed $1.2 billion per year by 2020, and increase to approximately $5.4 billion per year by 2030. The largest applications pertain to commercial buildings and energy storage on the grid; growth of the latter is especially pronounced in 2022, as evident in Exhibit 11. Distributionally within electricity storage markets, large proportional gains are forecast for residential energy storage (from four percent of sales in 2015 to 24 percent by 2030), battery-based commercial energy storage (six percent of sales in 2015 to 19 percent by 2030), and especially energy storage on the grid (14 percent of sales in 2015 to 35 percent by 2030).29 These proportional increases come generally at the expense of UPS-based storage in commercial buildings, which is a relatively mature technology that is estimated as capturing 71 percent of electricity storage sales in 2015 and projected to decline to 13 percent of sales by 2030.30
Exhibit 11. New York State Company Sales – Electricity Storage Market, 2015-2030 (Millions of $)
29 The growth trends estimated here, based on Navigant Research data, are roughly consistent with those presented by GreenTech Media in a Clean Power Group webinar in August 2016. GreenTech Media data pertained to the U.S. (rather than New York State) electricity storage market and estimated accelerating revenue growth after 2016-2017, similar to the growth trend shown in Exhibit 11. However, the GreenTech Media data expect a greater contribution to total revenues from energy storage on the grid applications (referred to as “utility” applications) relative to Navigant Research; this may be because the GreenTech Media data do not reflect sales from the array of commercial energy storage applications shown in Exhibit 11. 30 The remaining electricity storage sub-segments, community energy storage and ice-based commercial energy storage, feature relatively small proportional gains. Community energy storage is projected to increase from one percent of New York State company sales to global electricity storage markets to four percent by 2030; ice-based commercial energy storage sales are projected to increase from four percent to five percent over this period. This is consistent with information provided by Navigant Research, suggesting modest or low growth in ice-based storage compared to other electricity storage technologies.
$0
$1,000
$2,000
$3,000
$4,000
$5,000
$6,000
2015 2016 2017 2018 2019 2020 2021 2022 2023 2024 2025 2026 2027 2028 2029 2030
Energy Storage on the Grid
Commercial Energy Storage, Other
Commercial Energy Storage, Ice-Based
Commercial Energy Storage, UPS
Residential Energy Storage
Community Energy Storage

29
New York State company sales to global transportation storage markets approach $750 million per year by 2020, and increase to over $1.8 billion per year by 2030. The largest sub-segment for this market is the light duty vehicle battery market, which constitutes between half and two-thirds of New York State company sales within the transportation storage market, depending on the year, as shown in Exhibit 12.31
Exhibit 12. New York State Company Sales – Transportation Storage Market, 2015-2030 (Millions of $)
Unlike electricity storage sub-segments, the relative share of sales of the transportation storage sub-segments remains consistent between 2015 and 2030. This report forecasts only slight relative gains for electric vehicle charging equipment sales (from ten percent in 2015 to 17 percent by 2030), at the expense of battery sales for both light duty and medium/heavy duty vehicles.
As indicated in, Exhibit 10 total employment at New York State companies engaged in emerging energy storage markets can surpass 7,000 by 2020 and exceed 22,000 by 2030, based on the assumptions, estimates, and projections featured in this report.
31 While New York State currently features an array of companies engaged in emerging vehicle battery technologies, reaching the projected growth totals for this segment as featured in this report may require the creation or entry of additional companies into this segment beyond those that currently exist in the State.
$0
$200
$400
$600
$800
$1,000
$1,200
$1,400
$1,600
$1,800
$2,000
2015 2016 2017 2018 2019 2020 2021 2022 2023 2024 2025 2026 2027 2028 2029 2030
Medium and Heavy Duty Electric Truck Batteries
Electric Vehicle Charging Equipment
Light Duty Electric Vehicle Batteries

30
Analytic Process: Traditional Energy Storage Markets in New York State
“Traditional” energy storage markets are those oriented around existing, well-established, mature energy storage technologies, or those involving engagement in well-established activities in support of emerging energy storage technologies. Existing technologies included in traditional energy storage markets include fuel cells and portable military batteries, while the provision of energy storage materials and R&D services in support of emerging technologies also fall under the traditional energy storage market umbrella.
New York State has key advantages in traditional energy storage markets, including strong universities and R&D capabilities, a highly developed and technical workforce, and in some areas, proximity to the electricity supply chain and low electricity prices. In general, New York State is home to world-class academic institutions, R&D facilities, and global companies.
New York State companies operating in the traditional energy storage industry include:
• Suppliers of components for automotive lead-acid batteries;
• Manufacturers and suppliers of industrial and fork lift trucks;
• Suppliers of implantable medical batteries and ultracapacitors;
• Suppliers of lightweight, portable Li-ion batteries for military equipment power applications;
• Manufacturers and suppliers of fuel cells;
• Manufacturers of controls and other components; and
• Suppliers of battery materials.32
In addition, New York State universities such as Alfred, Cornell, the Rochester Institute of Technology (RIT), Rensselaer Polytechnic Institute (RPI), and the State University of New York (SUNY) system, corporate research laboratories including those operated by General Electric, and national laboratories such as the Department of Energy’s Brookhaven National Lab, all provide a world-class technology base that supports the development of new energy storage technologies and helps to spawn new businesses.
32 One type of energy storage application not listed here is consumer portables, i.e., batteries for use in consumer electronics. Research suggests that the world market for consumer electronic batteries is quite large, but concentrated in Asia. Per Navigant Research, the U.S. accounts for under five percent of advanced battery energy capacity production, and none of the biggest producers of consumer electronics batteries are headquartered in New York State. Very few consumer electronics batteries producers are headquartered anywhere in the U.S., though many have some U.S. presence. For advanced battery producers in the U.S. the primary focus tends to be automotive or stationary storage applications, rather than consumer electronics. This report did not discover any companies or organizations in New York State specifically focused on the consumer electronics market, and this segment is therefore not reflected in the traditional energy storage market in this report.
31
The 2012 market report estimated employment at organizations engaged in traditional energy storage markets in New York State through the collection of organization-level data and consultation with NY-BEST. To update and validate those results, this report also estimates employment in traditional energy storage markets in New York State through an iterative process relying on the following sources in the priority order as listed below:
• A web survey distributed to NY-BEST members in December 2015;
• Hoover’s business data on New York State companies;
• Underlying data for the 2012 market report, which included a list of companies operating in traditional energy storage markets in New York State in 2012, and estimated employment at those companies;
• Information collected as part of the broader market assessment of energy storage, NYSERDA Energy Storage and NY-BEST Program: Market Characterization and Assessment; and
• Follow-up with industry experts to clarify and align output from the other data sources.
In a few cases, available data suggested that certain organizations continued to operate in the traditional energy storage market space, but lacked any available energy storage-related employment data; this occurred mostly with educational institutions and R&D facilities who did not respond to the NY-BEST survey, because additional energy storage-specific employment data are not available for these entities. For these cases, this report calculated the percentage increase between energy storage employment as used in the 2012 market report for these entities and their self-reported energy storage employment from the December 2015 NY-BEST member survey, and applied this percentage increase to the 2012 employment figures from the 2012 market report for the set entities with no available 2015 data. For these entities, the report models a 37 percent increase in employment between 2012 and 2015. Despite the relatively large percentage increase, the overall effect of this adjustment is small, as traditional energy storage market employment within New York State is concentrated in areas separate from R&D.
This approach yields organization-level 2015 employment for traditional energy storage markets in New York State. Based on the validated employment estimates obtained through this approach, this report models future projected employment by assuming an increase at the projected growth in GDP per the latest estimates from the Congressional Budget Office (CBO). As these projections are currently available only through 2026, GDP growth for 2027 through 2030 is assumed to be equivalent to the single-year growth of GDP in 2026, or approximately 4.1 percent.
Generally, reliable revenue data for organizations and businesses in traditional energy storage markets were not available. Due to the paucity of these data and for consistency with the 2012 energy market report, this report uses the revenue-per-employee factors from the 2012 market report, as shown in Exhibit 9, to estimate New York State company sales to traditional energy storage markets. The application of these factors is the inverse of the method applied to estimate employment for emerging energy storage markets: for a given employment figure, the figure is divided by the number of jobs per $1 million in revenues from Exhibit 9 to derive the estimated revenue figure associated with that level of employment.
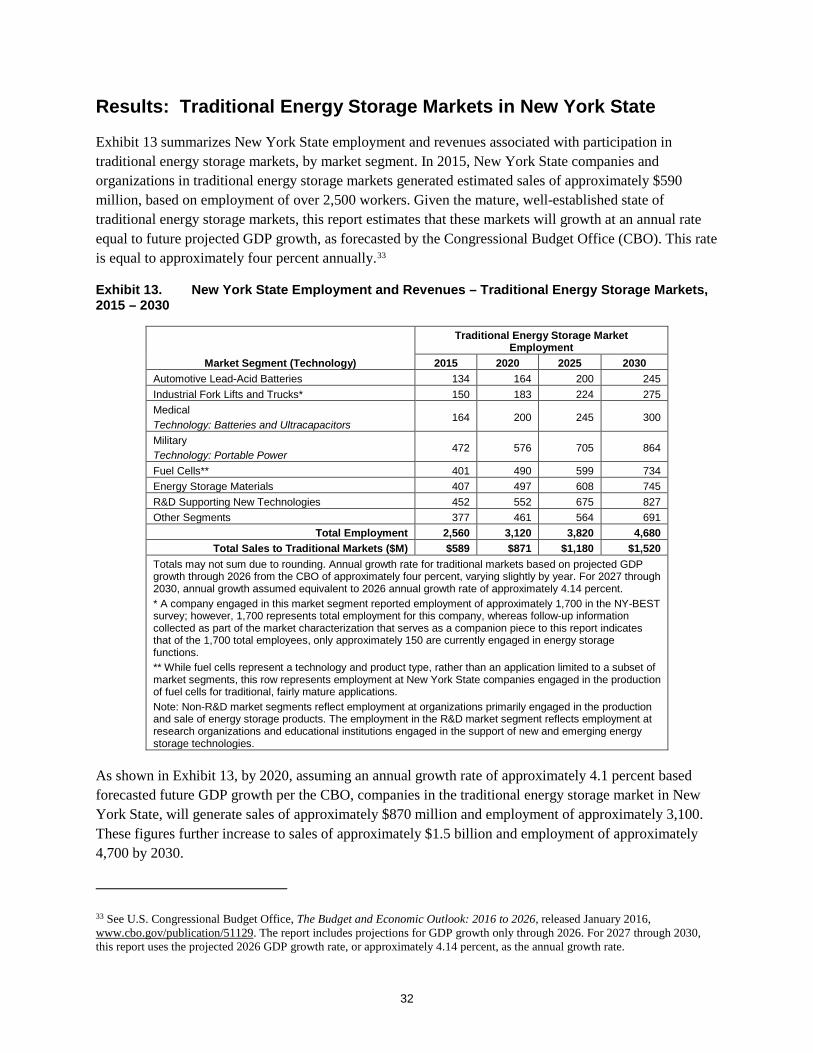
32
Results: Traditional Energy Storage Markets in New York State
Exhibit 13 summarizes New York State employment and revenues associated with participation in traditional energy storage markets, by market segment. In 2015, New York State companies and organizations in traditional energy storage markets generated estimated sales of approximately $590 million, based on employment of over 2,500 workers. Given the mature, well-established state of traditional energy storage markets, this report estimates that these markets will growth at an annual rate equal to future projected GDP growth, as forecasted by the Congressional Budget Office (CBO). This rate is equal to approximately four percent annually.33
Exhibit 13. New York State Employment and Revenues – Traditional Energy Storage Markets, 2015 – 2030
Market Segment (Technology)
Traditional Energy Storage Market Employment
2015 2020 2025 2030 Automotive Lead-Acid Batteries 134 164 200 245 Industrial Fork Lifts and Trucks* 150 183 224 275 Medical Technology: Batteries and Ultracapacitors
164 200 245 300
Military Technology: Portable Power
472 576 705 864
Fuel Cells** 401 490 599 734 Energy Storage Materials 407 497 608 745 R&D Supporting New Technologies 452 552 675 827 Other Segments 377 461 564 691
Total Employment 2,560 3,120 3,820 4,680 Total Sales to Traditional Markets ($M) $589 $871 $1,180 $1,520
Totals may not sum due to rounding. Annual growth rate for traditional markets based on projected GDP growth through 2026 from the CBO of approximately four percent, varying slightly by year. For 2027 through 2030, annual growth assumed equivalent to 2026 annual growth rate of approximately 4.14 percent. * A company engaged in this market segment reported employment of approximately 1,700 in the NY-BEST survey; however, 1,700 represents total employment for this company, whereas follow-up information collected as part of the market characterization that serves as a companion piece to this report indicates that of the 1,700 total employees, only approximately 150 are currently engaged in energy storage functions. ** While fuel cells represent a technology and product type, rather than an application limited to a subset of market segments, this row represents employment at New York State companies engaged in the production of fuel cells for traditional, fairly mature applications. Note: Non-R&D market segments reflect employment at organizations primarily engaged in the production and sale of energy storage products. The employment in the R&D market segment reflects employment at research organizations and educational institutions engaged in the support of new and emerging energy storage technologies.
As shown in Exhibit 13, by 2020, assuming an annual growth rate of approximately 4.1 percent based forecasted future GDP growth per the CBO, companies in the traditional energy storage market in New York State, will generate sales of approximately $870 million and employment of approximately 3,100. These figures further increase to sales of approximately $1.5 billion and employment of approximately 4,700 by 2030.
33 See U.S. Congressional Budget Office, The Budget and Economic Outlook: 2016 to 2026, released January 2016, www.cbo.gov/publication/51129. The report includes projections for GDP growth only through 2026. For 2027 through 2030, this report uses the projected 2026 GDP growth rate, or approximately 4.14 percent, as the annual growth rate.
33
Compared with the 2012 market report, this report estimates somewhat lower employment (a relative reduction of 15 to 20 percent, depending on the year) in traditional energy storage markets from 2015 through 2030. Company- and organization-level data collected for this report indicated that some entities in the traditional energy storage market space have left the market or have reduced employment relative to the 2012 data collected in support of the earlier market assessment.34 The trends vary by market segment: for example, this report estimates lower employment associated with medical battery production, but higher employment when compared to the 2012 market assessment associated with suppliers of battery materials. The relative reduction in employment compared to the 2012 market report is largely driven by reduced employment estimates associated with manufacturers of medical batteries, military batteries, and fuel cells, validated by NY-BEST staff.
For internal consistency, this report uses the revenue per employment figures used to derive New York State employment in emerging energy storage markets to derive revenues in traditional energy storage markets based on the employment figures estimated in Exhibit 13. Given revenue per employee estimates of $230,000 in 2015, increasing to $325,000 by 2030 (see Exhibit 9), the modeled relationship of traditional storage market employment to revenues in millions of dollars is approximately a factor of 0.23 to 0.32.35 In comparison, the 2012 market report translated traditional energy storage employment to revenues using a constant (unchanging with time) factor of 0.2.36 Therefore, this report estimates somewhat higher revenues in traditional markets post-2015.37,38
Aggregate Results: Emerging and Traditional Energy Storage Markets in New York State
Exhibit 14 summarizes results for emerging and traditional energy storage market revenues and employment for companies in New York State. In aggregate, energy storage revenues are estimated at over $900 million in 2015, with approximately 65 percent of these attributable to traditional markets. By 2020, however, aggregate energy storage revenues are projected to grow to over $2.6 billion, with less than one third attributable to traditional energy storage markets. By 2030, traditional energy storage
34 In this case, “organization-level” refers to employment data for non-business entities, such as universities and research centers, rather than corporate, organizational-level employment. 35 $230,000 in revenues per employee corresponds to approximately 4.3 jobs per one million in revenues, calculated as $1,000,000 / $230,000. Therefore, to translate employment figures to revenue figures, the appropriate formula is [employment] x [$1 million / 4.3 jobs], or effectively multiplying employment by approximately 0.23 to yield sales revenue in millions. Per Exhibit 10, the corresponding 2030 figure is $325,000 in revenues per employee, which corresponds to approximately 3.1 jobs per one million in revenues. The corresponding factor is approximately 0.32 ($1 million / 3.1 jobs). 36 This effectively assumes roughly 5.0 jobs per one million in revenues, consistent with the 2012 market report. However, the 2012 market report did not carry increases in productivity forward through time for traditional markets, whereas this report applies these productivity changes for both traditional and emerging energy storage markets to derive revenue and employment estimates, where necessary. 37 This change in methodology corresponds to approximately a 28 percent increase in projected revenues relative to the 2012 market report by 2030, even after accounting for decreased employment estimates upon which the revenue estimates are based. 38 While emerging markets may enjoy greater productivity gains relative to traditional markets (contrary to the modeling convention used in this report), there appears to be sufficient ongoing momentum in traditional energy storage markets to suggest continued productivity gains therein. Specifically, some traditional markets, such as military batteries, may leverage new technologies in the near future. The distinction between emerging and traditional markets for purposes of assessing productivity growth is further complicated by the fact that spillover effects from emerging market developments may impact traditional markets as well. In particular, medical batteries may continue to receive significant development attention over the next decade.

34
markets are projected to represent less than 20 percent of approximately $8.0 billion in total energy storage revenues in New York State. Consistent with these projections, energy storage employment in New York State is projected to increase from approximately 3,900 in 2015 to over 9,600 by 2020 and over 24,000 by 2030.
Exhibit 14. New York State Revenues and Employment: Emerging and Traditional Energy Storage Markets, 2015-2030
New York State Revenues and Employment Units 2012*
2015* (proj.) 2015 2020 2025 2030
CAGR 2015- 2020
CAGR 2015- 2030
Rev
enue
s
Electricity Storage Market $M
$598
$175 $150 $1,260 $3,450 $5,370 53.2% 27.0% Transportation Storage Market
$M $132 $167 $749 $1,490 $1,810 35.0% 17.2%
Traditional Markets $M $602 $589 $871 $1,180 $1,520 8.1% 6.5%
Total Revenues $M $598 $908 $906 $2,880 $6,130 $8,710 26.0% 16.3%
Empl
oym
ent
Electricity Storage Market Jobs
2,990
759 650 4,520 11,130 16,500 47.4% 24.1% Transportation Storage Market Jobs 571 724 2,680 4,840 5,580 29.9% 14.6%
Traditional Markets Jobs 3,010 2,560 3,120 3,820 4,680 4.1% 4.1%
Total Employment Jobs 2,990 4,340 3,930 10,300 19,800 26,800 21.3% 13.6%
$M = Millions of dollars * Estimates from the 2012 market report, including 2015 projections from that report, provided for comparison purposes.
Delayed Market Adoption Scenario
The scenario described in detail above applies an array of assumptions and parameters based on the best available research in data in line with conservative market projections made by reputable market research organizations for the North American and global markets, and with the 2012 market report. The growth in this scenario reflects an underlying assumption that New York State emerging energy storage markets will develop consistently with broader regional and global trends, and therefore, this report refers to its set of parameters and findings as the “consistent growth” scenario. However, substantial uncertainty exists about current and future energy storage market dynamics in North America and more specifically, in New York State. Emerging technologies, policy developments, and economic events in New York State and other parts of the U.S. may affect the development of the New York State energy storage market in ways not captured by broader forecasts and assumptions.
To characterize some of the uncertainty associated with the assumptions used in the consistent growth scenario, this section considers a delayed market adoption scenario that considers the combined effects of changes to certain parameters used to generate revenue and employment estimates for the New York State energy storage market. In the course of crafting this report’s consistent growth scenario and discussing its findings with NYSERDA and NY-BEST staff, three key considerations arose:
• Market saturation. Close examination of the most recent Navigant Research data indicate that for many emerging energy storage market segments, growth is expected to slow down, especially after 2020. This slowdown suggests possible maturation and/or saturation of currently-emerging
35
energy storage market technologies or products.39 To the extent that these markets will continue to grow rapidly through the late 2020s (in New York State or more broadly), use of the Navigant data may need to be adjusted to reflect this consideration.
• Aggression of “early” growth. The most recent Navigant Research data also project very rapid growth in many emerging energy storage market segments occurring between 2015 and 2018, especially in the commercial energy storage and energy storage on the grid market segments. New York State’s REV proceeding will likely play a major role in the regulatory environment facilitating the energy storage market within the State; to the extent that the REV process and its considerations continue to evolve through 2018, strong growth may be delayed until after some potential regulatory flux is resolved.
• Growth of the market share captured by New York State companies. For consistency with the 2012 market report, the consistent growth scenario uses the same assumptions, which feature threefold gains in market share captured by New York State companies across many emerging energy storage market segments (see Exhibit 7 and page 24 for additional information). To the extent that New York State companies are unable to make inroads of this magnitude into North American or global market share, forecasts of New York State’s energy storage market growth may need to be adjusted downward.
To address these considerations, this section considers a delayed market adoption scenario that applies the following two alterations to the methodology used to develop the consistent growth scenario described in the previous sections of this report:
#1. Delay in the growth of electricity storage markets relative to Navigant Research projections.
This assumes that the full effect of new tariffs and regulations under the REV proceeding sufficiently evolves, and investors gain sufficient confidence around 2019, rather than earlier. Due to this, electricity storage markets (the subset of emerging energy storage separate from transportation storage) in New York State may not gain traction and begin to grow rapidly until after flux and uncertainty associated with REV are allayed.
To reflect this, the delayed market adoption scenario “shifts out” Navigant Research projections for the four electricity storage market segments in New York State with available, updated Navigant Research data (community energy storage, residential energy storage, commercial energy storage – battery-based, and energy storage on the grid) by three years. In other words, 2016 estimates forecasted by Navigant for each of these market segments are modeled as occurring in 2019, 2017 estimates are modeled as occurring in 2020, and so on.
39 Price decreases from technology maturation or increased competition may also offset revenues in this period.

36
For the years between 2015 and 2019, the delayed market adoption scenario applies a straight-line interpolation of market size between the 2015 and 2016 values estimated by Navigant Research.40
#2. 50% Reduction in market share gained by New York State companies.
To characterize the uncertainty associated with gains in market share attributable to New York State companies, the delayed market adoption scenario revises downward the assumptions used in the consistent growth scenario about the market share gained by these companies over time. Specifically, the delayed market adoption scenario multiplies the difference in the overall market share gain as described in Exhibit 7 and page 24 in a given year by 50 percent.
For example, as shown in Exhibit 7, New York State company market share for electricity storage sub-segments (excluding commercial energy storage – UPS) in 2025 through 2030 is 15 percent of total North American revenues, and five percent of total “rest of world” revenues; these estimates build on recent market share growth trends since 2012 and increase from New York State’s 2015 market share of five percent of North American revenues (this is roughly equivalent to the New York State share of U.S. manufacturing output)and five percent of total “rest of world” revenues. To account for the possibility that New York state will not gain market share as rapidly, the delayed market adoption scenario calculates the difference between the 2015 market share factor (five percent for North American revenues and 1.5 percent for “rest of world” revenues) and this factor (10 percent and 3.5 percent, respectively) and then halves this difference (i.e., five percent and 1.75 percent, respectively) and adds it to the 2015 factor to estimate the new factor. In sum, whereas the consistent growth scenario applies market share factors of 10 percent and 3.5 percent to North American and “rest of world” revenues, respectively, for 2025-2030 for these market segments, the delayed market adoption scenario applies market share factors of 10 percent (five percent in 2015 plus five percent) and 3.25 percent (1.5 percent in 2015 plus 1.75 percent), instead.
The overall effect is to transform threefold increases in market share in the consistent growth scenario (i.e., from five percent of North American market share to 15 percent) between 2015 and 2030 to twofold increases (i.e., from five percent to 10 percent). Where the consistent growth scenario featured a market share increase less than threefold over this period, the delayed market adoption scenario similarly scales down the market share increase over time.
These two alterations directly address the second (aggression of “early” growth) and third (growth of market share captured by New York State companies) considerations emphasized by NYSERDA and NY-BEST staff. In addition, the remaining consideration (market saturation) is indirectly addressed by the first alteration: by delaying the growth in the electricity storage market segments until 2019 and later, the growth continues through the late 2020s, rather than showing signs of potential market saturation as in the unadjusted Navigant data.
Exhibit 15 illustrates the differences in estimated revenues and employment between 2015 and 2030 for emerging energy storage markets between the consistent growth and delayed market adoption scenarios.
40 For example, Navigant Research estimates approximately $8 million in 2015 community energy storage revenues in North America, growing to approximately $12 million by 2016. The delayed market adoption scenario pushes the $12 million estimate to 2019, and estimates 2016, 2017, and 2018 North American community energy storage revenues as approximately $9 million, $10 million, and $11 million respectively.

37
Traditional market estimates are unchanged between the two scenarios, but are also presented to facilitate examination of the total energy storage market across the two scenarios.
As shown in Exhibit 15, the delayed market adoption scenario represents a substantially slower-growing energy storage industry in New York State relative to the industry predicted in the consistent growth scenario. Specifically, growth drops dramatically in the 2015-2020 period relative to the consistent growth scenario due to the “delay” assumption imposed in the delayed market adoption scenario. However, cumulative annual growth rates over the entire period of analysis (i.e., 2015 through 2030) are relatively similar across the two scenarios due to the “delay” assumption pushing back, but not removing, years featuring strong growth from the delayed market adoption scenario.
The overall effect of the delayed market adoption scenario is to reduce estimated 2030 emerging energy storage market revenues attributable to New York State companies by over 40 percent, and reduce total energy storage market revenues attributable to New York State companies by approximately 36 percent relative to the consistent growth scenario, with a similar reduction in estimated 2030 employment in these market segments. Compared to the consistent growth scenario, which estimated total New York State energy storage market revenues of $8.7 billion and employment of 27,000 by 2030, the delayed market adoption scenario estimates total revenues of $5.6 billion and employment of 17,000 instead. These figures reflect a potential course of energy storage market development within New York State where growth is delayed and constrained by internal (REV) and external (greater market development in other world regions, capturing market share) factors relative to the consistent growth scenario.
Exhibit 15. Comparison of New York State Revenues and Employment: Emerging and Traditional Energy Storage Markets, 2015-2030 across Consistent Growth and Delayed Market Adoption Scenarios
New York State Revenues and Employment Units 2015 2020 2025 2030
CAGR 2015- 2020
CAGR 2015- 2030
Rev
enue
s
Emerging Markets – Consistent Growth Scenario $M $317
$2,010 $4,940 $7,190 44.7% 23.1%
Emerging Markets – Delayed Market Adoption Scenario $M $1,140 $2,900 $4,090 29.2% 18.6% Traditional Markets $M $589 $871 $1,180 $1,520 8.1% 6.5%
Total Revenues – Consistent Growth Scenario $M $906
$2,880 $6,130 $8,710 26.0% 16.3% Total Revenues – Delayed Market Adoption Scenario $M $2,010 $4,080 $5,610 17.3% 12.9%
Empl
oym
ent
Emerging Markets – Consistent Growth Scenario Jobs 1,370
7,210 16,000 22,100 39.3% 20.3% Emerging Markets – Delayed Market Adoption Scenario Jobs 4,090 9,370 12,600 24.4% 15.9% Traditional Markets Jobs 2,560 3,120 3,820 4,680 4.1% 4.1%
Total Employment – Consistent Growth Scenario Jobs 3,930
10,300 19,800 26,800 21.3% 13.6%
Total Employment – Delayed Market Adoption Scenario Jobs 7,210 13,200 17,300 12.9% 10.4%
Exhibit 16 illustrates overall growth in emerging energy storage markets in New York State between the consistent growth scenario and the delayed market adoption scenario. Specifically, solid lines reflect the values within the consistent growth scenario for the four electricity storage market sub-segments with available Navigant Research data that were shifted out in the delayed market adoption scenario, while dashed lines reflect these values within the delayed market adoption scenario. As evident from Exhibit 15, large market size over time between the delayed market adoption scenario and the consistent growth

38
scenario occur due to adjustments made to Navigant Research data in the grid energy storage and residential energy storage market segments.41
Exhibit 16. Comparison of New York State Revenue Growth in Select Emerging Energy Storage Markets, 2015-2030 across Consistent Growth and Delayed Market Adoption Scenarios
Conclusions and Comparisons with the 2012 Market Report
This report provides an overview of the current and projected markets for energy storage in New York State, and updates NYSERDA’s 2012 market report. As shown in
Exhibit 14, the consistent growth scenario featured in this report includes 2015 estimates, and future projections, of energy storage sales accruing to companies in New York State similar to those estimated in the 2012 market report. Specifically:
41 Of the two alterations made for the delayed market adoption scenario, the “delay” alteration affects only the four electricity storage segments shown in Exhibit 15, while the reduction to New York State company market share affects all emerging energy storage market segments. Therefore, the distance between the solid black and dashed black lines in Exhibit 15 is more than the linear combination of the differences between the solid and dashed colored lines in Exhibit 15, as it also reflects the impacts of the reduction in New York State company market share for the other market segments not shown in Exhibit 15.
$0
$1,000
$2,000
$3,000
$4,000
$5,000
$6,000
$7,000
$8,000
2015 2016 2017 2018 2019 2020 2021 2022 2023 2024 2025 2026 2027 2028 2029 2030
Community Energy Storage Residential Energy Storage
Commercial Energy Storage Energy Storage on the Grid
Total Emerging Energy Storage Markets

39
• 2015 sales estimates are very similar: $906 million across emerging and traditional markets in this report, compared to the 2012 market report projection of $908 million.
• 2020 sales projected are slightly higher in this report: $2.9 billion compared to $2.5 billion as projected in the 2012 market report. This difference is driven by higher estimated revenues in traditional markets and greater projected growth in transportation storage markets, offset by lower projected growth in electricity storage markets.
• 2025 sales projected in this report are also slightly higher: $6.1 billion compared to $5.7 billion as projected in the 2012 market report. This difference is driven by higher estimated revenues in traditional markets and, due to differences in the projected growth trends relative to the data used in the 2012 market report, higher estimated revenues in electricity storage markets, offset by lower projected growth between 2020 and 2025 in transportation storage markets.
• 2030 sales projected in this report are slightly lower: $8.7 billion compared to $8.8 billion as projected in the 2012 market report. This difference is driven by slowdowns in projected growth in Navigant Research data for both electricity storage and transportation storage markets as compared to the 2012 market report’s estimates of growth trends for these markets through 2030, and offset by higher estimated revenues in traditional markets relative to the 2012 market report.
Generally, New York State employment in energy storage markets as estimated and projected in the consistent growth scenario is slightly lower than the projections in the 2012 market report – this difference is driven largely by lower estimates of 2015 employment in traditional energy storage markets in this report as compared to the 2012 market report.
Overall, however, the findings of the consistent growth scenario generally validate the overall projections in the 2012 market report. Despite slightly higher revenue projections in and around 2020 and 2025, by the end of the period of analysis (i.e., 2030), the market research used by this report suggests growth slowdown, potentially due to market saturation, in emerging energy storage markets to a greater extent than projected by the 2012 market report. However, we note that due to the compounding effects of uncertainty in growth rates in later years, there is exponentially more uncertainty in projected 2030 estimates as compared to near-term estimates (i.e., 2016 to 2020).
Despite the similarity of the overall projections of the energy storage market, updated Navigant Research projections for emerging energy storage markets suggest a strong degree of variability in projections across sub-segments between this report and the 2012 market report. Specifically, based on Navigant’s updated projections, this report projects considerably less growth in a few sub-segments, including energy storage on the grid, light duty vehicle batteries, and electric vehicle charging equipment, while projecting much stronger growth for residential energy storage. Per Navigant, there has been much stronger demand for residential energy storage than estimated in 2012, and Navigant’s estimates have been adjusted accordingly. The strong current forecast for residential energy storage does not result in this report’s projections exceeding those made in the 2012 market report, but does result in similar overall estimates despite Navigant’s downward revision of projections in multiple other emerging energy storage sub-segments.

40
A key source of uncertainty for future growth in energy storage markets in New York State will be the effects of REV. As a source of comparison, energy storage market growth in California appears to be tied to a regulatory mandate (AB2514) of 1.3 gigawatts (GW) of energy storage by 2022, which constitutes a specific goal and benchmark. Currently, REV does not feature any similar storage targets; as indicated in the market characterization and assessment report that serves as a companion to this report. In particular, there is uncertainty as to the mechanisms by which both utilities and customers can benefit from increased use of energy storage technologies. This uncertainty may have a dampening effect on the energy storage market within New York State, both presently and in terms of future outlook.
To examine potential uncertainty, this report also features a delayed market adoption scenario that examines potential effects on growth of the energy storage market within New York State as a result of two methodological alterations to the consistent growth scenario: 1) a delay in the growth experienced by emerging electricity storage markets within New York State until 2019 and later years; and, 2) a 50 percent reduction in market share growth for New York State companies relative to the consistent growth scenario following 2015.
The delayed market adoption scenario, as detailed in Exhibit 15, features a decline of roughly 40 percent in New York State energy storage market employment and revenues, relative to the consistent growth scenario. Therefore, the methodological changes that inform this scenario suggest that internal or external constraints on the growth of New York State’s energy storage market may have substantial effects on the market’s development through 2030.

41
Appendix A: Key Sources Cited Navigant Research Data
Navigant Research, Advanced Energy Storage for Automotive Applications (AESA-15), published 3Q 2015, Tables 5.11 through 5.13.
Navigant Research, Community, Residential, and Commercial Energy Storage (CRES-14), published 4Q 2014, Tables 5.40 through 5.46.
Navigant Research, Electric Vehicle Charging Services (EVCE-15), published 1Q 2015, Table 6.20.
Navigant Research, Energy Storage for the Grid and Ancillary Services (ESGAS-16), published 2Q 2016, Table 5.8.
Navigant Research, Energy Storage for the Grid and Ancillary Services (ESGAS-14), published 3Q 2014, Table 5.10.
Navigant Research, Market Data; Commercial & Industrial Energy Storage (MD-CI-16), published 1Q 2016, Table 4.3.
Navigant Research, Residential Energy Storage (MF-RES-16), published 2Q 2016, Table 3.8.
2012 Market Report and Associated Data
ECG Consulting Group, Inc., The Economic Impact of Developing an Energy Storage Industry in New York State, prepared for NY-BEST, October 5, 2012. Available online at: https://www.ny-best.org/sites/default/files/type-page/4254/attachments/2012%2010%2005%20NY%20BEST%20Final%20Report%20(2).pdf.
ECG Consulting Group, Inc., “ECG’s NY-BEST Model.xlsx,” received from personal communication with Gordon E. Olson at ECG Consulting Group, Inc., March 22, 2016. Data file contains Pike Research estimates used in this document.
Other Data Sources
U.S. Congressional Budget Office, The Budget and Economic Outlook: 2016 to 2026, released January 2016, available online at: www.cbo.gov/publication/51129.