economic impact 11
TRANSCRIPT

8/2/2019 Economic Impact 11
http://slidepdf.com/reader/full/economic-impact-11 1/24
ECONOMIC IMPACT OFFRANCHISED BUSINESSESECONOMIC IMPACT OFFRANCHISED BUSINESSES V O L U M E 3

8/2/2019 Economic Impact 11
http://slidepdf.com/reader/full/economic-impact-11 2/24
8/2/2019 Economic Impact 11
http://slidepdf.com/reader/full/economic-impact-11 3/24
www.franchise.org ECONOMICIMPACTOFFRANCHISEDBUSINESSES,VOL.3
TABLE OF CONTENT
LETTERFROMIFAPRESIDENT&CEO
PREFACE&ACKNOWLEDGEMENTS
NATIONALSUMMARY
CHARTS
DirectEconomicOutputAsaPercent OfPrivateSectorEconomy
DirectEmploymentAsaPercentOf PrivateSectorEconomy
DirectContributionsOfFranchised BusinessestotheU.S.Economy
TotalContributionsOfFranchised BusinessestotheU.S.Economy
Total EconomicOutputAs aPercentOf PrivateSectorEconomy
TotalEmploymentAsaPercentOf PrivateSectorEconomy
JobsByEconomicSector
Di rectImpactOfFranchisedBusinesses– Jobs
Di rectImpactOfFranchisedBus inesses– Establishments
Di rectImpactOfFranchisedBusinesses– Output
INDUSTRIES
CHARTS
OutputByLineOfBusiness
PayrollByLineOfBusiness
EstablishmentsByLineOfBusiness
Di rectImpactOfFranchisedBus inesses ByLineOfBusiness
STATESUMMARY
CHARTS
EmploymentBecauseOfFranchisingAs aPercentOfStatePrivateNonfarmJobs
OutputBecauseOfFranchisingAs aPercentOfStatePrivateNonfarmOutput
DirectandTotal Contr ibutionsOfFranchised BusinessesByState
CONGRESSIONALDISTRICTS
ABOUTTHEDATA
ABOUTFRANCHISING
INDUSTRYCATEGORIES
2
3
4
4
4
4
5
5
5
6
7
7
7
8
8
8
9
10
12
12
13
14
16
17
18
19
<< Viewthefull Economic
Impact of Franchised Business, Vol. III Report
8/2/2019 Economic Impact 11
http://slidepdf.com/reader/full/economic-impact-11 4/24
2 ECONOMICIMPACTOFFRANCHISEDBUSINESSES,VOL.3 www.buildingopportunity.co
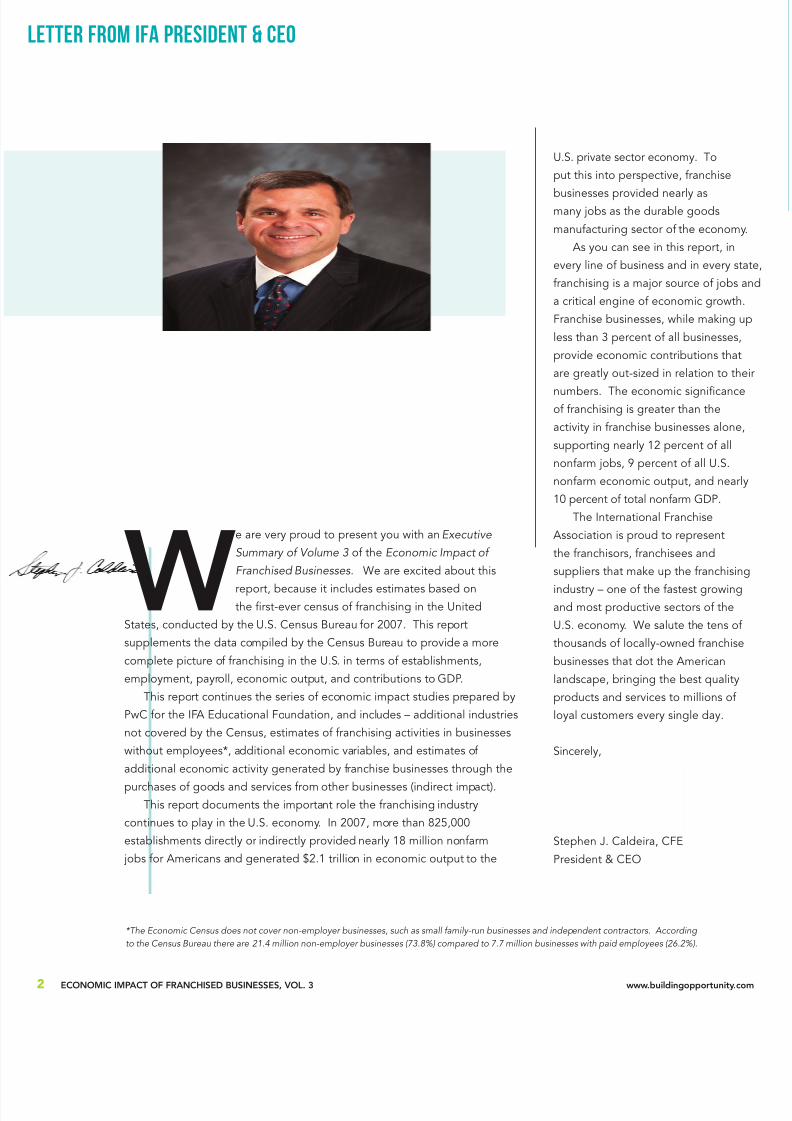
LETTER FROM IFA PRESIDENT & CEO
WeareveryproudtopresentyouwithanExecutive
Summary of Volume 3oftheEconomic Impact of
Franchised Businesses.Weareexcitedaboutthis
report,becauseitincludesestimatesbasedontherst-evercensusoffranchisingintheUnited
States,conductedbytheU.S.CensusBureaufor2007.Thisreport
supplementsthedatacompiledbytheCensusBureautoprovideamore
completepictureoffranchisingintheU.S.intermsofestablishments,
employment,payroll,economicoutput,andcontributionstoGDP.
Thisreportcontinuestheseriesofeconomicimpactstudiespreparedby
PwCfortheIFAEducationalFoundation,andincludes–additionalindustries
notcoveredbytheCensus,estimatesoffranchisingactivitiesinbusinesses
withoutemployees*,additionaleconomicvariables,andestimatesof
additionaleconomicactivitygeneratedbyfranchisebusinessesthroughthe
purchasesofgoodsandservicesfromotherbusinesses(indirectimpact).Thisreportdocumentstheimportantrolethefranchisingindustry
continuestoplayintheU.S.economy.In2007,morethan825,000
establishmentsdirectlyorindirectlyprovidednearly18millionnonfarm
jobsforAmericansandgenerated$2.1trillionineconomicoutputtothe
U.S.privatesectoreconomy.To
putthisintoperspective,franchise
businessesprovidednearlyasmanyjobsasthedurablegoods
manufacturingsectoroftheeconom
Asyoucanseeinthisreport,in
everylineofbusinessandineveryst
franchisingisamajorsourceofjobs
acriticalengineofeconomicgrowth
Franchisebusinesses,whilemakingu
lessthan3percentofallbusinesses,
provideeconomiccontributionsthat
aregreatlyout-sizedinrelationtoth
numbers.Theeconomicsignicancoffranchisingisgreaterthanthe
activityinfranchisebusinessesalone
supportingnearly12percentofall
nonfarmjobs,9percentofallU.S.
nonfarmeconomicoutput,andnear
10percentoftotalnonfarmGDP.
TheInternationalFranchise
Associationisproudtorepresent
thefranchisors,franchiseesand
suppliersthatmakeupthefranchisin
industry–oneofthefastestgrowingandmostproductivesectorsofthe
U.S.economy.Wesalutethetensof
thousandsoflocally-ownedfranchise
businessesthatdottheAmerican
landscape,bringingthebestquality
productsandservicestomillionsof
loyalcustomerseverysingleday.
Sincerely,
StephenJ.Caldeira,CFE
President&CEO
*The Economic Census does not cover non-employer businesses, such as small family-run businesses and independent contractors. According
to the Census Bureau there are 21.4 million non-employer businesses (73.8%) compared to 7.7 million businesses with paid employees (26.2%).
8/2/2019 Economic Impact 11
http://slidepdf.com/reader/full/economic-impact-11 5/24
www.franchise.org ECONOMICIMPACTOFFRANCHISEDBUSINESSES,VOL.3
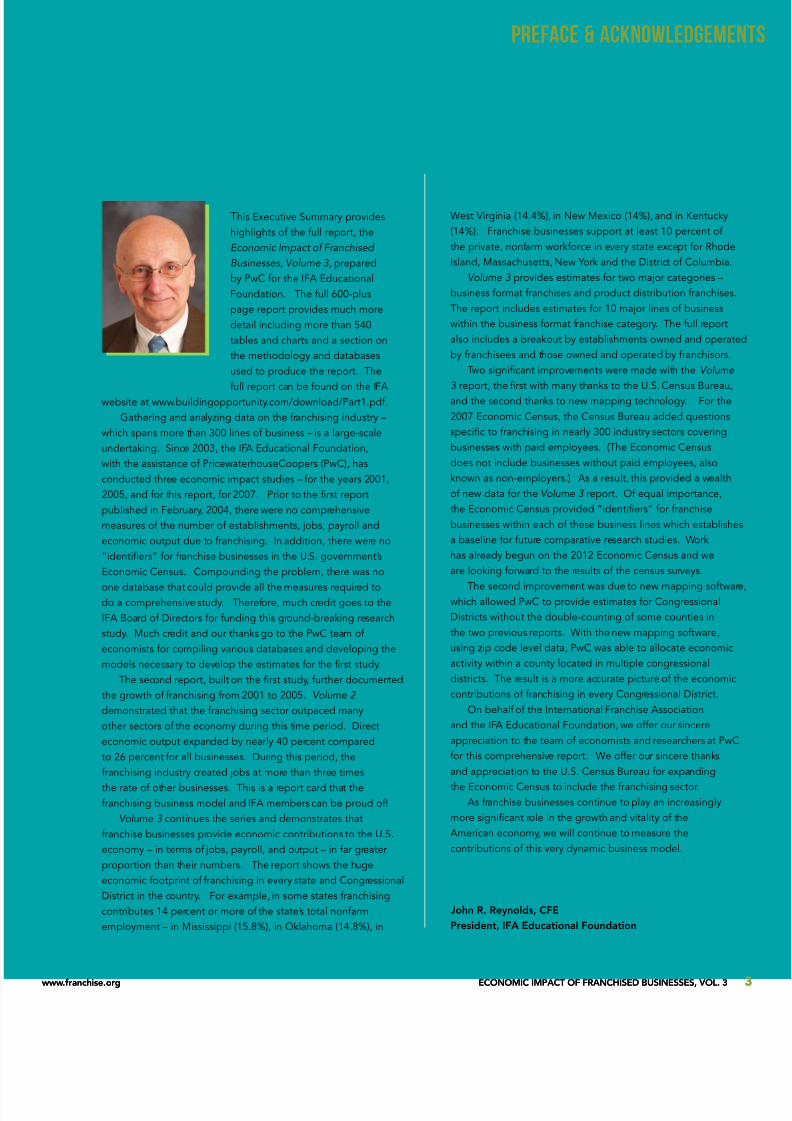
PREFACE & ACKNOWLEDGEMEN
ThisExecutiveSummaryprovides
highlightsofthefullreport,the
Economic Impact of Franchised
Businesses, Volume 3,prepared
byPwCfortheIFAEducational
Foundation.Thefull600-plus
pagereportprovidesmuchmore
detailincludingmorethan540
tablesandchartsandasectionon
themethodologyanddatabases
usedtoproducethereport.The
fullreportcanbefoundontheIFA
websiteatwww.buildingopportunity.com/download/Part1.pdf.
Gatheringandanalyzingdataonthefranchisingindustry–
whichspansmorethan300linesofbusiness–isalarge-scale
undertaking.Since2003,theIFAEducationalFoundation,
withtheassistanceofPricewaterhouseCoopers(PwC),has
conductedthreeeconomicimpactstudies–fortheyears2001,
2005,andforthisreport,for2007.Priortotherstreport
publishedinFebruary,2004,therewerenocomprehensive
measuresofthenumberofestablishments,jobs,payrolland
economicoutputduetofranchising.Inaddition,therewereno
“identiers”forfranchisebusinessesintheU.S.government’s
EconomicCensus.Compoundingtheproblem,therewasno
onedatabasethatcouldprovideallthemeasuresrequiredtodoacomprehensivestudy.Therefore,muchcreditgoestothe
IFABoardofDirectorsforfundingthisground-breakingresearch
study.MuchcreditandourthanksgotothePwCteamof
economistsforcompilingvariousdatabasesanddevelopingthe
modelsnecessarytodeveloptheestimatesfortherststudy.
Thesecondreport,builtontherststudy,furtherdocumented
thegrowthoffranchisingfrom2001to2005.Volume 2
demonstratedthatthefranchisingsectoroutpacedmany
othersectorsoftheeconomyduringthistimeperiod.Direct
economicoutputexpandedbynearly40percentcompared
to26percentforallbusinesses.Duringthisperiod,the
franchisingindustrycreatedjobsatmorethanthreetimes
therateofotherbusinesses.ThisisareportcardthatthefranchisingbusinessmodelandIFAmemberscanbeproudof!
Volume 3continuestheseriesanddemonstratesthat
franchisebusinessesprovideeconomiccontributionstotheU.S.
economy–intermsofjobs,payroll,andoutput–infargreater
proportionthantheirnumbers.Thereportshowsthehuge
economicfootprintoffranchisingineverystateandCongressional
Districtinthecountry.Forexample,insomestatesfranchising
contributes14percentormoreofthestate’stotalnonfarm
employment–inMississippi(15.8%),inOklahoma(14.8%),in
WestVirginia(14.4%),inNewMexico(14%),andinKentucky
(14%).Franchisebusinessessupportatleast10percentof
theprivate,nonfarmworkforceineverystateexceptforRhode
Island,Massachusetts,NewYorkandtheDistrictofColumbia.
Volume 3providesestimatesfortwomajorcategories–
businessformatfranchisesandproductdistributionfranchises.
Thereportincludesestimatesfor10majorlinesofbusiness
withinthebusinessformatfranchisecategory.Thefullreport
alsoincludesabreakoutbyestablishmentsownedandoperate
byfranchiseesandthoseownedandoperatedbyfranchisors.
TwosignicantimprovementsweremadewiththeVolume
3report,therstwithmanythankstotheU.S.CensusBureau,
andthesecondthankstonewmappingtechnology.Forthe
2007EconomicCensus,theCensusBureauaddedquestions
specictofranchisinginnearly300industrysectorscovering
businesseswithpaidemployees.(TheEconomicCensus
doesnotincludebusinesseswithoutpaidemployees,also
knownasnon-employers.)Asaresult,thisprovidedawealth
ofnewdatafortheVolume 3report.Ofequalimportance,
theEconomicCensusprovided“identiers”forfranchise
businesseswithineachofthesebusinesslineswhichestablishes
abaselineforfuturecomparativeresearchstudies.Work
hasalreadybegunonthe2012EconomicCensusandwe
arelookingforwardtotheresultsofthecensussurveys.
ThesecondimprovementwasduetonewmappingsoftwarewhichallowedPwCtoprovideestimatesforCongressional
Districtswithoutthedouble-countingofsomecountiesin
thetwopreviousreports.Withthenewmappingsoftware,
usingzipcodeleveldata,PwCwasabletoallocateeconomic
activitywithinacountylocatedinmultiplecongressional
districts.Theresultisamoreaccuratepictureoftheeconomic
contributionsoffranchisingineveryCongressionalDistrict.
OnbehalfoftheInternationalFranchiseAssociation
andtheIFAEducationalFoundation,weofferoursincere
appreciationtotheteamofeconomistsandresearchersatPwC
forthiscomprehensivereport.Weofferoursincerethanks
andappreciationtotheU.S.CensusBureauforexpanding
theEconomicCensustoincludethefranchisingsector.Asfranchisebusinessescontinuetoplayanincreasingly
moresignicantroleinthegrowthandvitalityofthe
Americaneconomy,wewillcontinuetomeasurethe
contributionsofthisverydynamicbusinessmodel.
JohnR.Reynolds,CFE
President,IFAEducationalFoundation
www.franchise.org ECONOMICIMPACTOFFRANCHISEDBUSINESSES,VOL.3
8/2/2019 Economic Impact 11
http://slidepdf.com/reader/full/economic-impact-11 6/24
4 ECONOMICIMPACTOFFRANCHISEDBUSINESSES,VOL.3 www.buildingopportunity.co
NATIONAL SUMMARY
PERCENT OF PRIVATE SECTOR ECONOMY // DIRECT
ECONOMIC OUTPUT
PERCENT OF PRIVATE SECTOR ECONOMY // DIRECT
EMPLOYMENT
PERCENT OF PRIVATE SECTOR ECONOMY // DIRECT
EMPLOYMENT
DIRECT CONTRIBUTIONS OF FRANCHISEDBUSINESSES TO THE U.S. ECONOMY // 2007
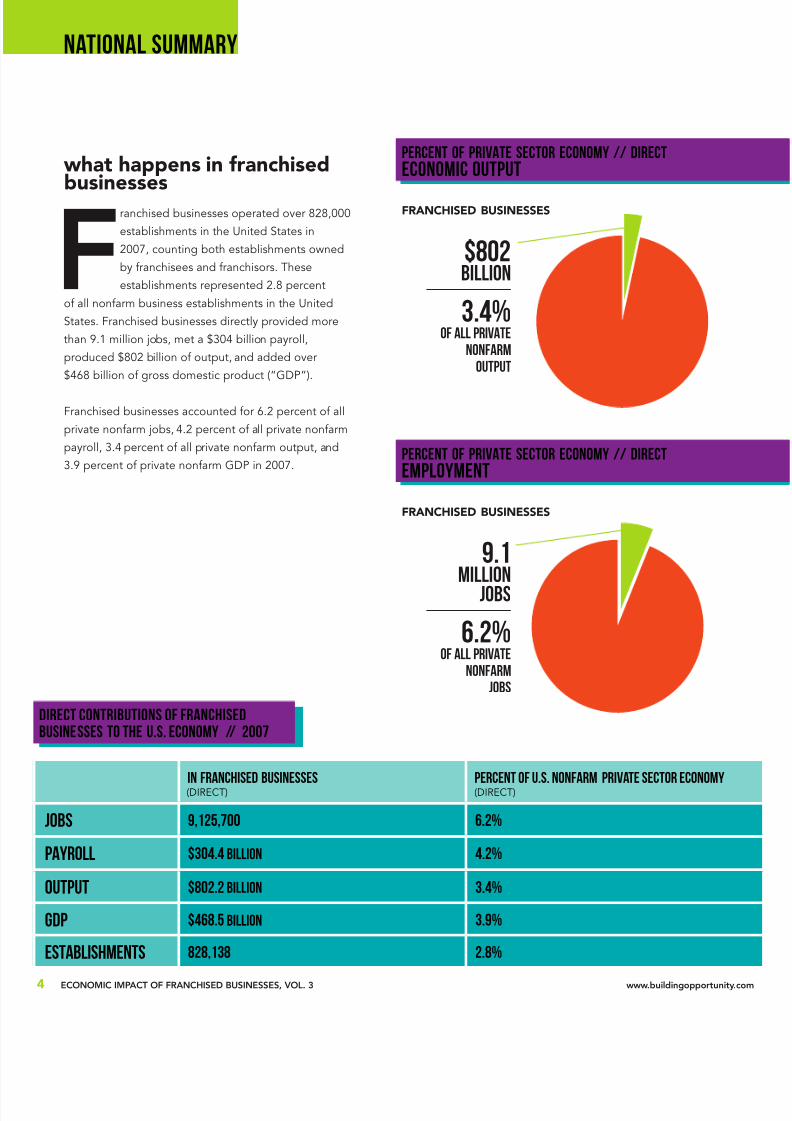
Franchisedbusinessesoperatedover828,000
establishmentsintheUnitedStatesin
2007,countingbothestablishmentsowned
byfranchiseesandfranchisors.These
establishmentsrepresented2.8percent
ofallnonfarmbusinessestablishmentsintheUnited
States.Franchisedbusinessesdirectlyprovidedmore
than9.1millionjobs,meta$304billionpayroll,
produced$802billionofoutput,andaddedover
$468billionofgrossdomesticproduct(“GDP”).
Franchisedbusinessesaccountedfor6.2percentofall
privatenonfarmjobs,4.2percentofallprivatenonfarm
payroll,3.4percentofallprivatenonfarmoutput,and
3.9percentofprivatenonfarmGDPin2007.
FRANCHISED BUSINESSES
what happens in franchisedbusinesses
FRANCHISED BUSINESSES
$802billion
3.4%of ALL PRIVATE
NONFARM
output
9.1million
JOBS
6.2%of ALL PRIVATE
NONFARM
JOBS
In Franchised Businesses(DIRECT)
PERCENT OF U.S. NONFARM PRIVATE SECTOR ECONOMY(DIRECT)
JOBS 9,125,700 6.2%
PAYROLL $304.4 BILLION 4.2%
OUTPUT $802.2 billion 3.4%
GDP $468.5 BILLION 3.9%
ESTABLISHMENTS 828,138 2.8%
8/2/2019 Economic Impact 11
http://slidepdf.com/reader/full/economic-impact-11 7/24
www.franchise.org ECONOMICIMPACTOFFRANCHISEDBUSINESSES,VOL.3
ENT OF PRIVATE SECTOR ECONOMY // DIRECT
PLOYMENT
TOTAL CONTRIBUTIONS OF FRANCHISEDBUSINESSES TO THE U.S. ECONOMY // 2007
BECAUSE OF Franchised Businesses(TOTAL)
PERCENT OF U.S. NONFARM PRIVATE SECTOR ECONOMY(TOTAL)
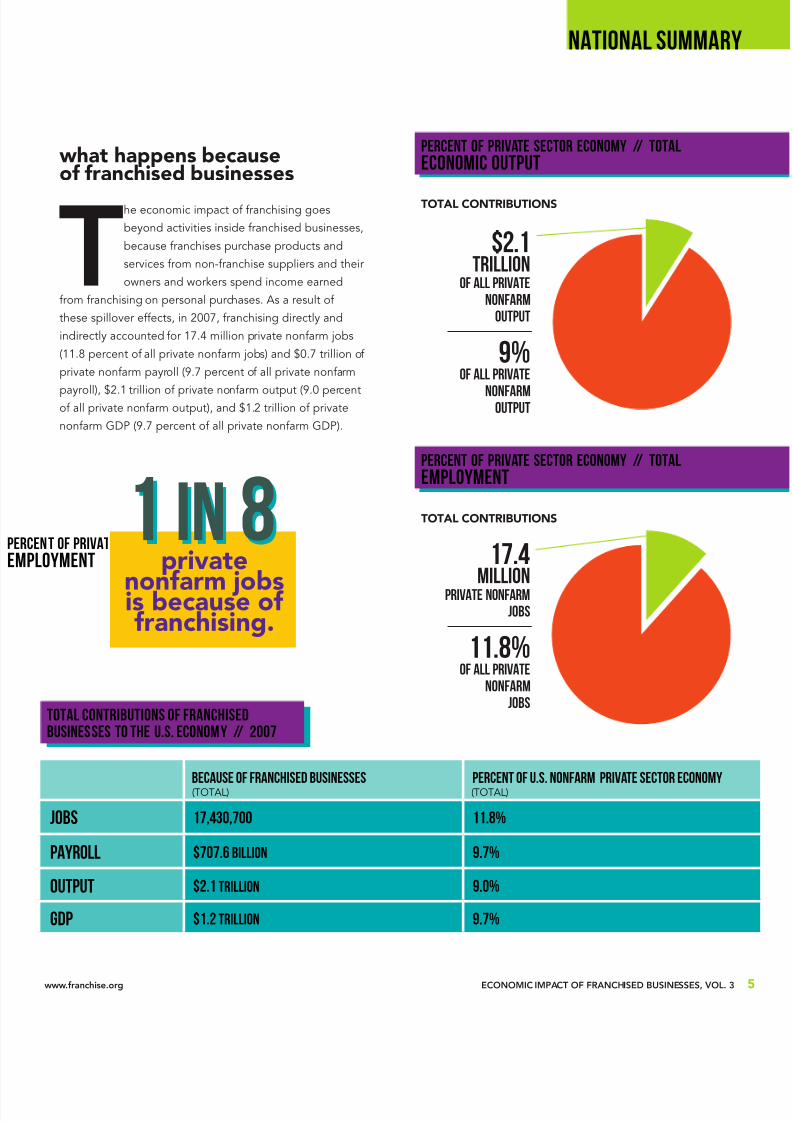
JOBS 17,430,700 11.8%
PAYROLL $707.6 BILLION 9.7%
OUTPUT $2.1 TRILLION 9.0%
GDP $1.2 TRILLION 9.7%
NATIONAL SUMMARY
PERCENT OF PRIVATE SECTOR ECONOMY // TOTAL
ECONOMIC OUTPUT
PERCENT OF PRIVATE SECTOR ECONOMY // TOTAL
EMPLOYMENT
Theeconomicimpactoffranchisinggoes
beyondactivitiesinsidefranchisedbusinesses,
becausefranchisespurchaseproductsand
servicesfromnon-franchisesuppliersandtheir
ownersandworkersspendincomeearned
fromfranchisingonpersonalpurchases.Asaresultof
thesespillovereffects,in2007,franchisingdirectlyand
indirectlyaccountedfor17.4millionprivatenonfarmjobs
(11.8percentofallprivatenonfarmjobs)and$0.7trillionof
privatenonfarmpayroll(9.7percentofallprivatenonfarm
payroll),$2.1trillionofprivatenonfarmoutput(9.0percentofallprivatenonfarmoutput),and$1.2trillionofprivate
nonfarmGDP(9.7percentofallprivatenonfarmGDP).
TOTAL CONTRIBUTIONS
what happens becauseof franchised businesses
TOTAL CONTRIBUTIONS
$2.1TRillion
of ALL PRIVATE
NONFARM
output
9%of ALL PRIVATE
NONFARMoutput
17.4million
PRIVATE NONFARMJOBS
11.8%of ALL PRIVATE
NONFARM
JOBS
1 in 8private
nonfarm jobsis because of franchising.
1 in 8
8/2/2019 Economic Impact 11
http://slidepdf.com/reader/full/economic-impact-11 8/24
6 ECONOMICIMPACTOFFRANCHISEDBUSINESSES,VOL.3 www.buildingopportunity.co
JOBS BY SELECTED ECONOMIC SECTOR // 2007
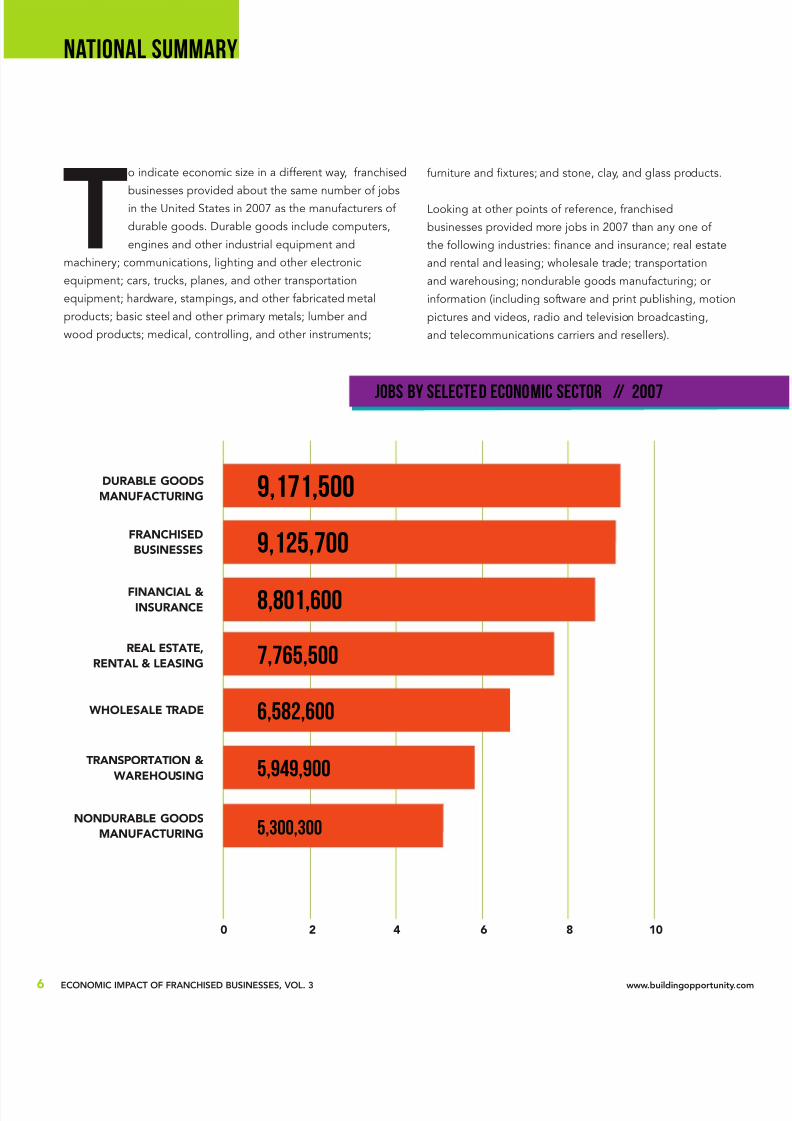
Toindicateeconomicsizeinadifferentway,franchised
businessesprovidedaboutthesamenumberofjobsintheUnitedStatesin2007asthemanufacturersof
durablegoods.Durablegoodsincludecomputers,
enginesandotherindustrialequipmentand
machinery;communications,lightingandotherelectronic
equipment;cars,trucks,planes,andothertransportation
equipment;hardware,stampings,andotherfabricatedmetal
products;basicsteelandotherprimarymetals;lumberand
woodproducts;medical,controlling,andotherinstruments;
DURABLE GOODS
MANUFACTURING
0 2 4 6 8 10
FRANCHISED
BUSINESSES
FINANCIAL &INSURANCE
REAL ESTATE,
RENTAL & LEASING
WHOLESALE TRADE
TRANSPORTATION &
WAREHOUSING
NONDURABLE GOODS
MANUFACTURING
9,171,500
9,125,700
8,801,600
7,765,500
6,582,600
5,949,900
5,300,300
furnitureandxtures;andstone,clay,andglassproducts.
Lookingatotherpointsofreference,franchised
businessesprovidedmorejobsin2007thananyoneof
thefollowingindustries:nanceandinsurance;realestate
andrentalandleasing;wholesaletrade;transportation
andwarehousing;nondurablegoodsmanufacturing;or
information(includingsoftwareandprintpublishing,motion
picturesandvideos,radioandtelevisionbroadcasting,
andtelecommunicationscarriersandresellers).
NATIONAL SUMMARY
8/2/2019 Economic Impact 11
http://slidepdf.com/reader/full/economic-impact-11 9/24
www.franchise.org ECONOMICIMPACTOFFRANCHISEDBUSINESSES,VOL.3
NATIONAL SUMMARY
DIRECT IMPACT OF FRANCHISED BUSINESSES
JOBS
DIRECT IMPACT OF FRANCHISED BUSINESSESESTABLISHMENTS
DIRECT IMPACT OF FRANCHISED BUSINESSES
OUTPUT
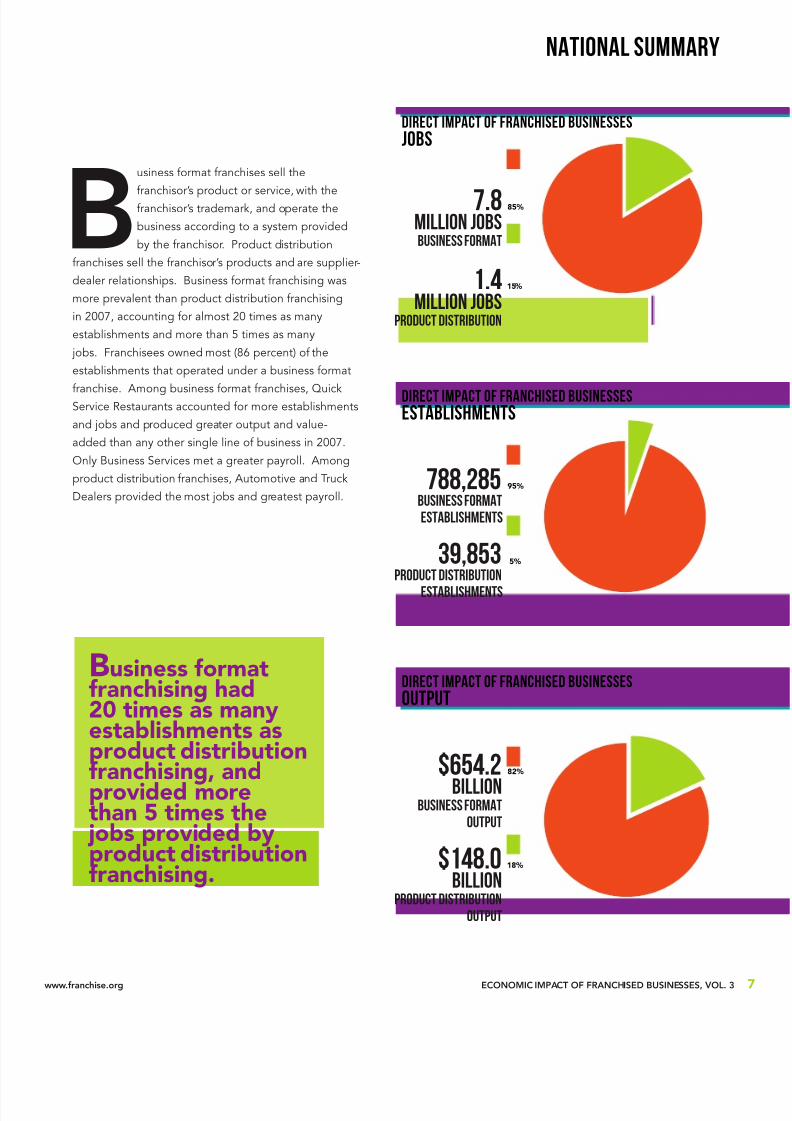
Businessformatfranchisessellthe
franchisor’sproductorservice,withthefranchisor’strademark,andoperatethe
businessaccordingtoasystemprovided
bythefranchisor.Productdistribution
franchisessellthefranchisor’sproductsandaresupplier-
dealerrelationships.Businessformatfranchisingwas
moreprevalentthanproductdistributionfranchising
in2007,accountingforalmost20timesasmany
establishmentsandmorethan5timesasmany
jobs.Franchiseesownedmost(86percent)ofthe
establishmentsthatoperatedunderabusinessformat
franchise.Amongbusinessformatfranchises,QuickServiceRestaurantsaccountedformoreestablishments
andjobsandproducedgreateroutputandvalue-
addedthananyothersinglelineofbusinessin2007.
OnlyBusinessServicesmetagreaterpayroll.Among
productdistributionfranchises,AutomotiveandTruck
Dealersprovidedthemostjobsandgreatestpayroll.
7.8MILLION JOBSBUSINESS FORMAT
1.4MILLION JOBS
PRODUCT DISTRIBUTION
788,285BUSINESS FORMAT
establishments
39,853PRODUCT DISTRIBUTION
establishments
$654.2Billion
BUSINESS FORMAT
output
$148.0Billion
PRODUCT DISTRIBUTION
output
85%
95%
82%
15%
5%
18%
Business formatfranchising had20 times as manyestablishments asproduct distributionfranchising, andprovided morethan 5 times the jobs provided byproduct distributionfranchising.
8/2/2019 Economic Impact 11
http://slidepdf.com/reader/full/economic-impact-11 10/24
8 ECONOMICIMPACTOFFRANCHISEDBUSINESSES,VOL.3 www.buildingopportunity.co
INDUSTRIES
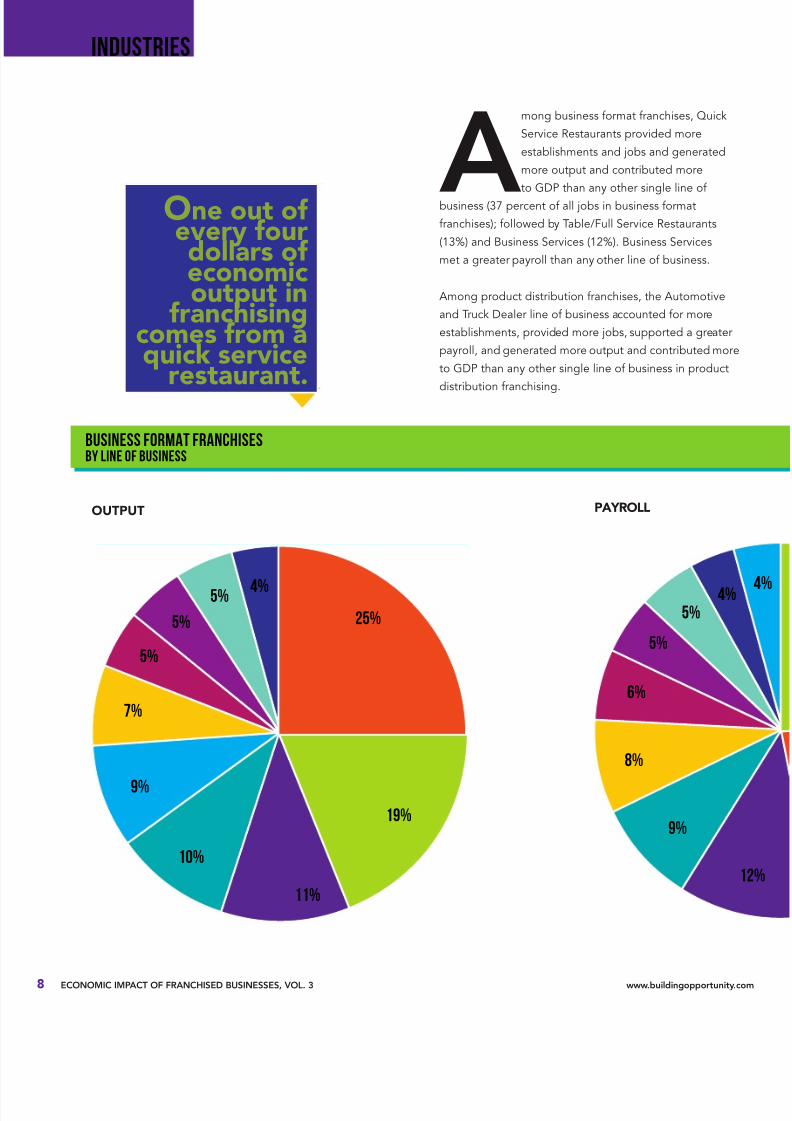
A
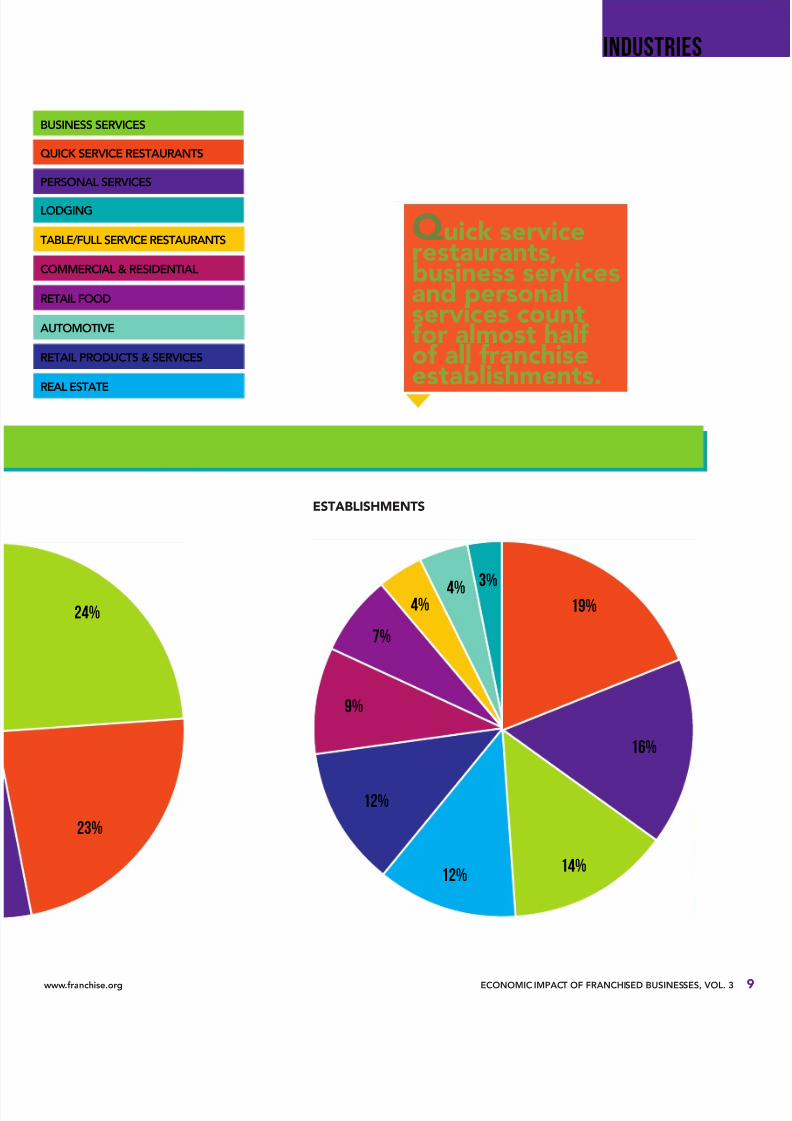
mongbusinessformatfranchises,Quick
ServiceRestaurantsprovidedmore
establishmentsandjobsandgenerated
moreoutputandcontributedmore
toGDPthananyothersinglelineof
business(37percentofalljobsinbusinessformat
franchises);followedbyTable/FullServiceRestaurants
(13%)andBusinessServices(12%).BusinessServices
metagreaterpayrollthananyotherlineofbusiness.
Amongproductdistributionfranchises,theAutomotive
andTruckDealerlineofbusinessaccountedformore
establishments,providedmorejobs,supportedagreater
payroll,andgeneratedmoreoutputandcontributedmore
toGDPthananyothersinglelineofbusinessinproduct
distributionfranchising.
BUSINESS FORMAT FRANCHISESBY LINE OF BUSINESS
PAYROLLOUTPUT
25%
19%
11%
9%
10%
8%
9%
6%7%
5%5%
5%5%
4%5% 4%
One out of every fourdollars of economicoutput in
franchisingcomes from aquick service
restaurant.
8/2/2019 Economic Impact 11
http://slidepdf.com/reader/full/economic-impact-11 11/24
www.franchise.org ECONOMICIMPACTOFFRANCHISEDBUSINESSES,VOL.3
INDUSTRIES
ESTABLISHMENTS
24% 19%
23%
16%
14%12%
12%
9%
7%
4%4%
3%
BUSINESSSERVICES
QUICKSERVICERESTAURANTS
PERSONALSERVICES
LODGING
TABLE/FULLSERVICERESTAURANTS
COMMERCIAL&RESIDENTIAL
RETAILFOOD
AUTOMOTIVE
RETAILPRODUCTS&SERVICES
REALESTATE
Quick servicerestaurants,business servicesand personalservices countfor almost half of all franchiseestablishments.
8/2/2019 Economic Impact 11
http://slidepdf.com/reader/full/economic-impact-11 12/24
10 ECONOMICIMPACTOFFRANCHISEDBUSINESSES,VOL.3 www.buildingopportunity.co
INDUSTRIES
PERCENT OF PRIVATE SECTOR ECONOMY // DIRECT
EMPLOYMENT
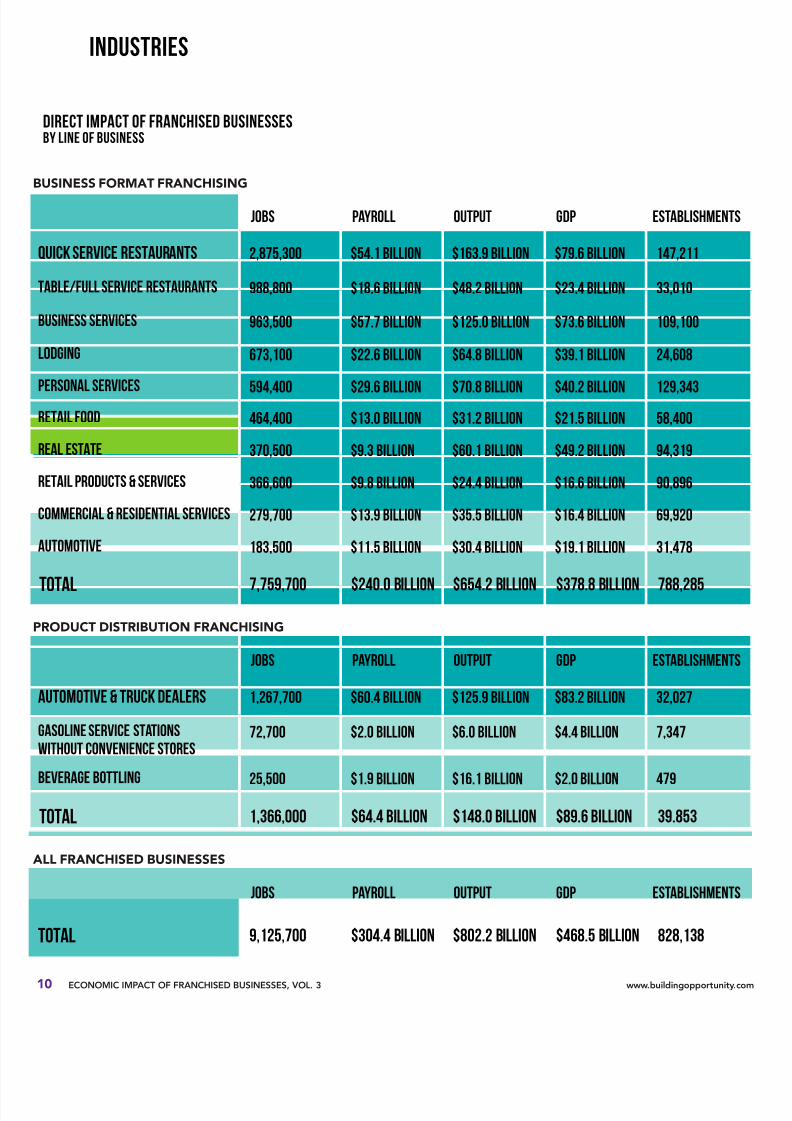
DIRECT IMPACT OF FRANCHISED BUSINESSESBY LINE OF BUSINESS
JOBS PAYROLL OUTPUT GDP ESTABLISHMENTS
QUICK SERVICE RESTAURANTS 2,875,300 $54.1 BILLION $163.9 BILLION $79.6 BILLION 147,211
TABLE/FULL SERVICE RESTAURANTS 988,800 $18.6 BILLION $48.2 BILLION $23.4 BILLION 33,010
BUSINESS SERVICES 963,500 $57.7 BILLION $125.0 BILLION $73.6 BILLION 109,100
LODGING 673,100 $22.6 BILLION $64.8 BILLION $39.1 BILLION 24,608
PERSONAL SERVICES594,400 $29.6 BILLION $70.8 BILLION $40.2 BILLION 129,343
RETAIL FOOD 464,400 $13.0 BILLION $31.2 BILLION $21.5 BILLION 58,400
REAL ESTATE 370,500 $9.3 BILLION $60.1 BILLION $49.2 BILLION 94,319
RETAIL PRODUCTS & SERVICES 366,600 $9.8 BILLION $24.4 BILLION $16.6 BILLION 90,896
COMMERCIAL & RESIDENTIAL SERVICES 279,700 $13.9 BILLION $35.5 BILLION $16.4 BILLION 69,920
AUTOMOTIVE 183,500 $11.5 BILLION $30.4 BILLION $19.1 BILLION 31,478
TOTAL 7,759,700 $240.0 BILLION $654.2 BILLION $378.8 BILLION 788,285
JOBS PAYROLL OUTPUT GDP ESTABLISHMENTS
AUTOMOTIVE & TRUCK DEALERS 1,267,700 $60.4 BILLION $125.9 BILLION $83.2 BILLION 32,027
GASOLINE SERVICE STATIONS
WITHOUT CONVENIENCE STORES72,700 $2.0 BILLION $6.0 BILLION $4.4 BILLION 7,347
BEVERAGE BOTTLING25,500 $1.9 BILLION $16.1 BILLION $2.0 BILLION 479
TOTAL 1,366,000 $64.4 BILLION $148.0 BILLION $89.6 BILLION 39.853
JOBS PAYROLL OUTPUT GDP ESTABLISHMENTS
TOTAL 9,125,700 $304.4 BILLION $802.2 BILLION $468.5 BILLION 828,138
BUSINESS FORMAT FRANCHISING
PRODUCT DISTRIBUTION FRANCHISING
ALL FRANCHISED BUSINESSES
8/2/2019 Economic Impact 11
http://slidepdf.com/reader/full/economic-impact-11 13/24
www.franchise.org ECONOMICIMPACTOFFRANCHISEDBUSINESSES,VOL.3
INDUSTRIES
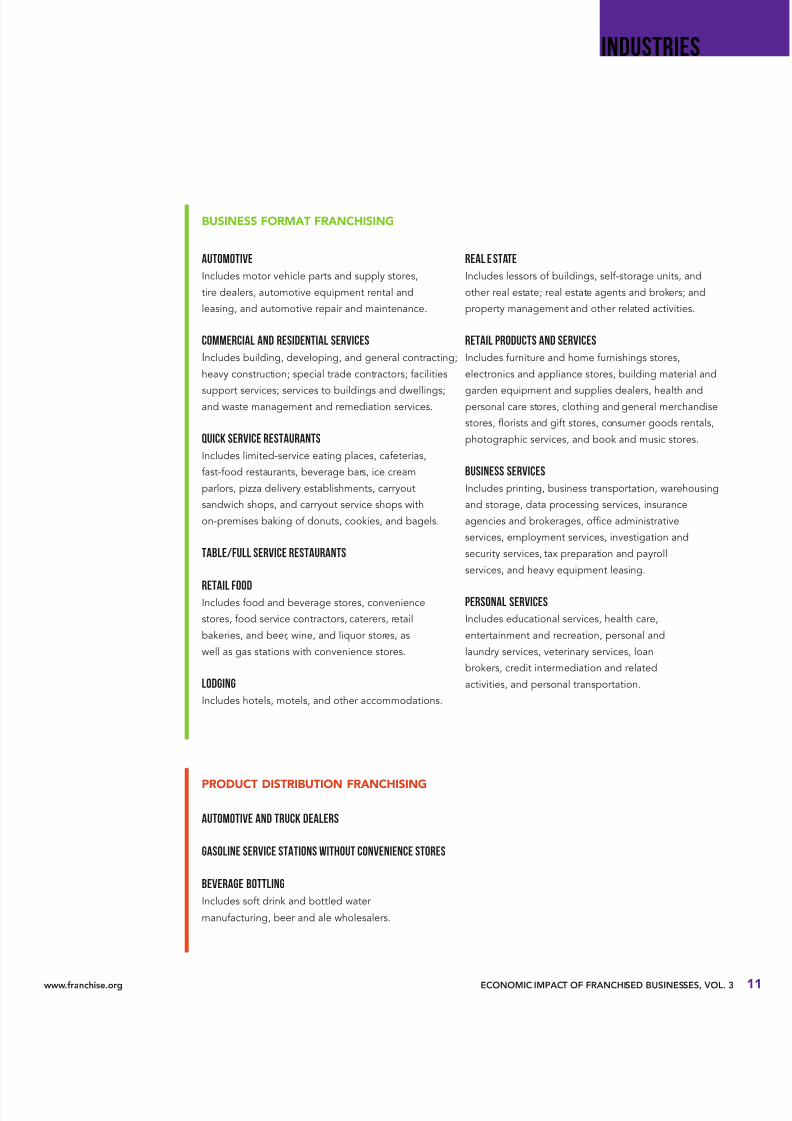
Automotive
Includesmotorvehiclepartsandsupplystores,
tiredealers,automotiveequipmentrentaland
leasing,andautomotiverepairandmaintenance.
Commercial and Residential Services
Includesbuilding,developing,andgeneralcontracting;
heavyconstruction;specialtradecontractors;facilities
supportservices;servicestobuildingsanddwellings;andwastemanagementandremediationservices.
Quick Service Restaurants
Includeslimited-serviceeatingplaces,cafeterias,
fast-foodrestaurants,beveragebars,icecream
parlors,pizzadeliveryestablishments,carryout
sandwichshops,andcarryoutserviceshopswith
on-premisesbakingofdonuts,cookies,andbagels.
Table/Full Service Restaurants
Retail FoodIncludesfoodandbeveragestores,convenience
stores,foodservicecontractors,caterers,retail
bakeries,andbeer,wine,andliquorstores,as
wellasgasstationswithconveniencestores.
Lodging
Includeshotels,motels,andotheraccommodations.
Automotive and Truck Dealers
Gasoline Service Stations without Convenience Stores
Beverage BottlingIncludessoftdrinkandbottledwater
manufacturing,beerandalewholesalers.
Real E state
Includeslessorsofbuildings,self-storageunits,and
otherrealestate;realestateagentsandbrokers;and
propertymanagementandotherrelatedactivities.
Retail Products and ServicesIncludesfurnitureandhomefurnishingsstores,
electronicsandappliancestores,buildingmaterialand
gardenequipmentandsuppliesdealers,healthandpersonalcarestores,clothingandgeneralmerchandise
stores,oristsandgiftstores,consumergoodsrentals,
photographicservices,andbookandmusicstores.
Business Services
Includesprinting,businesstransportation,warehousing
andstorage,dataprocessingservices,insurance
agenciesandbrokerages,ofceadministrative
services,employmentservices,investigationand
securityservices,taxpreparationandpayroll
services,andheavyequipmentleasing.
Personal ServicesIncludeseducationalservices,healthcare,
entertainmentandrecreation,personaland
laundryservices,veterinaryservices,loan
brokers,creditintermediationandrelated
activities,andpersonaltransportation.
BUSINESS FORMAT FRANCHISING
PRODUCT DISTRIBUTION FRANCHISING
8/2/2019 Economic Impact 11
http://slidepdf.com/reader/full/economic-impact-11 14/24
12 ECONOMICIMPACTOFFRANCHISEDBUSINESSES,VOL.3 www.buildingopportunity.c
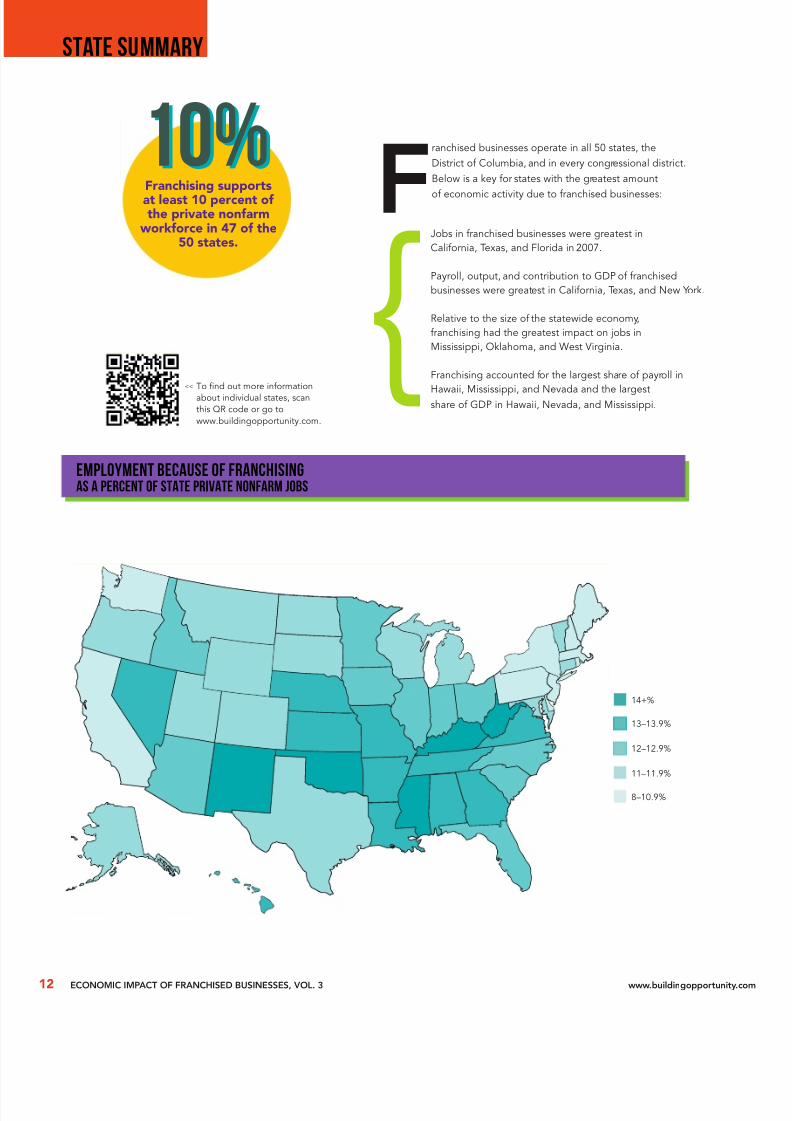
10%
STATE SUMMARY
Franchisedbusinessesoperateinall50states,the
DistrictofColumbia,andineverycongressionaldistrict.
Belowisakeyforstateswiththegreatestamount
ofeconomicactivityduetofranchisedbusinesses:
{
Jobsinfranchisedbusinessesweregreatestin
California,Texas,andFloridain2007.
Payroll,output,andcontributiontoGDPoffranchised
businessesweregreatestinCalifornia,Texas,andNewYork.
Relativetothesizeofthestatewideeconomy,
franchisinghadthegreatestimpactonjobsin
Mississippi,Oklahoma,andWestVirginia.
Franchisingaccountedforthelargestshareofpayrollin
Hawaii,Mississippi,andNevadaandthelargestshareofGDPinHawaii,Nevada,andMississippi.
Franchising supports
at least 10 percent of the private nonfarm
workforce in 47 of the50 states.
10%
EMPLOYMENT BECAUSE OF FRANCHISINGAS A PERCENT OF STATE PRIVATE NONFARM JOBS
14+%
13–13.9%
12–12.9%
11–11.9%
8–10.9%
Tondoutmoreinformationaboutindividualstates,scanthisQRcodeorgotowww.buildingopportunity.com.
<<
8/2/2019 Economic Impact 11
http://slidepdf.com/reader/full/economic-impact-11 15/24
www.franchise.org ECONOMICIMPACTOFFRANCHISEDBUSINESSES,VOL.3
STATE SUMMARY
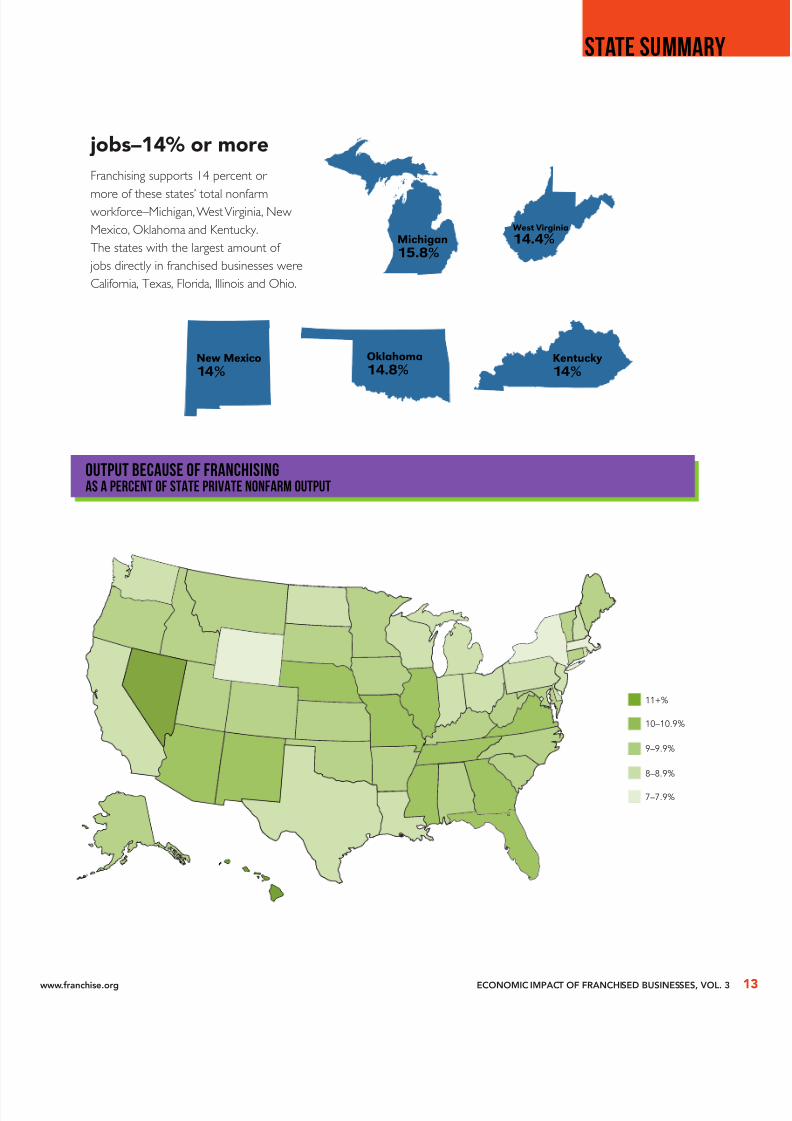
OUTPUT BECAUSE OF FRANCHISINGAS A PERCENT OF STATE PRIVATE NONFARM output
Michigan
15.8%
Oklahoma
14.8%
West Virginia
14.4%
New Mexico
14%Kentucky
14%
jobs–14% or more
Franchising supports 14 percent or
more of these states’ total nonfarmworkforce–Michigan, West Virginia, New
Mexico, Oklahoma and Kentucky.
The states with the largest amount of
jobs directly in franchised businesses were
California, Texas, Florida, Illinois and Ohio.
11+%
10–10.9%
9–9.9%
8–8.9%
7–7.9%
8/2/2019 Economic Impact 11
http://slidepdf.com/reader/full/economic-impact-11 16/24
14 ECONOMICIMPACTOFFRANCHISEDBUSINESSES,VOL.3 www.buildingopportunity.c
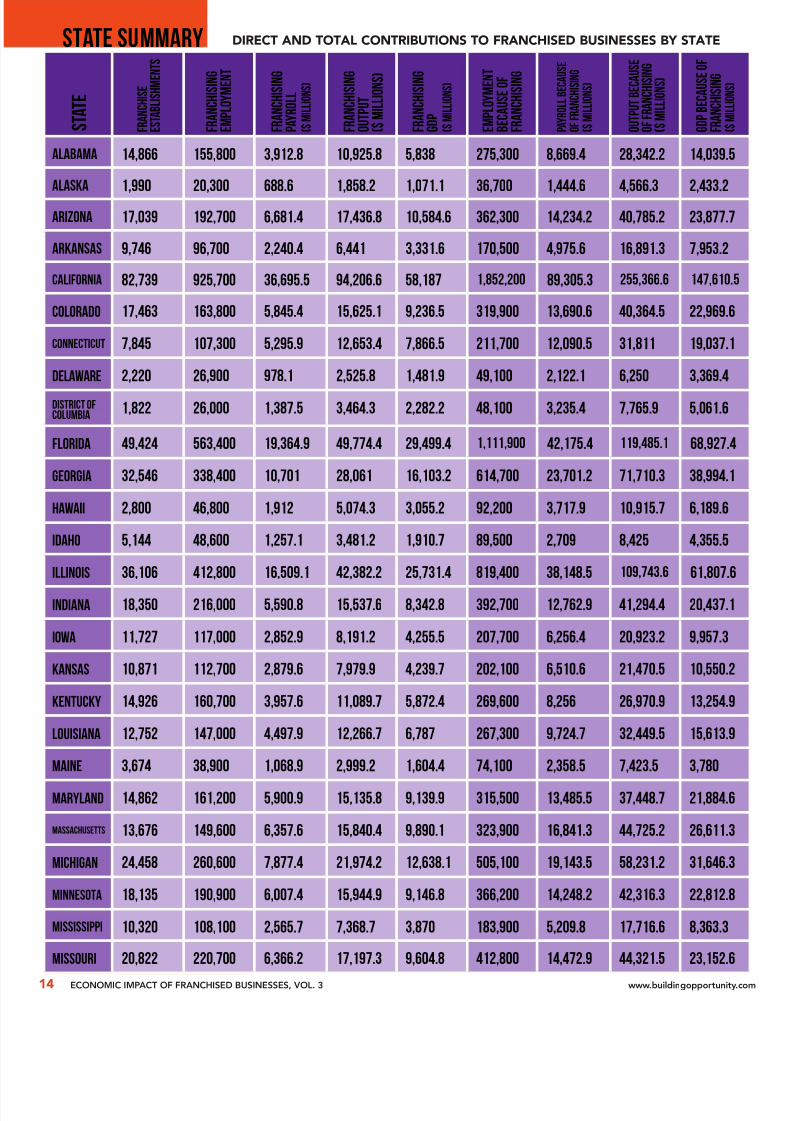
STATE SUMMARY
ALABAMA 14,866 155,800 3,912.8 10,925.8 5,838 275,300 8,669.4 28,342.2 14,039.5
ALASKA 1,990 20,300 688.6 1,858.2 1,071.1 36,700 1,444.6 4,566.3 2,433.2
ARIZONA 17,039 192,700 6,681.4 17,436.8 10,584.6 362,300 14,234.2 40,785.2 23,877.7
ARKANSAS 9,746 96,700 2,240.4 6,441 3,331.6 170,500 4,975.6 16,891.3 7,953.2
CALIFORNIA 82,739 925,700 36,695.5 94,206.6 58,187 1,852,200 89,305.3 255,366.6 147,610.5
COLORADO 17,463 163,800 5,845.4 15,625.1 9,236.5 319,900 13,690.6 40,364.5 22,969.6
CONNECTICUT 7,845 107,300 5,295.9 12,653.4 7,866.5 211,700 12,090.5 31,811 19,037.1
DELAWARE 2,220 26,900 978.1 2,525.8 1,481.9 49,100 2,122.1 6,250 3,369.4
DISTRICT OFCOLUMBIA
1,822 26,000 1,387.5 3,464.3 2,282.2 48,100 3,235.4 7,765.9 5,061.6
FLORIDA 49,424 563,400 19,364.9 49,774.4 29,499.4 1,111,900 42,175.4 119,485.1 68,927.4
GEORGIA 32,546 338,400 10,701 28,061 16,103.2 614,700 23,701.2 71,710.3 38,994.1
HAWAII 2,800 46,800 1,912 5,074.3 3,055.2 92,200 3,717.9 10,915.7 6,189.6
IDAHO 5,144 48,600 1,257.1 3,481.2 1,910.7 89,500 2,709 8,425 4,355.5
ILLINOIS 36,106 412,800 16,509.1 42,382.2 25,731.4 819,400 38,148.5 109,743.6 61,807.6
INDIANA 18,350 216,000 5,590.8 15,537.6 8,342.8 392,700 12,762.9 41,294.4 20,437.1
IOWA 11,727 117,000 2,852.9 8,191.2 4,255.5 207,700 6,256.4 20,923.2 9,957.3
KANSAS 10,871 112,700 2,879.6 7,979.9 4,239.7 202,100 6,510.6 21,470.5 10,550.2
KENTUCKY 14,926 160,700 3,957.6 11,089.7 5,872.4 269,600 8,256 26,970.9 13,254.9
LOUISIANA 12,752 147,000 4,497.9 12,266.7 6,787 267,300 9,724.7 32,449.5 15,613.9
MAINE 3,674 38,900 1,068.9 2,999.2 1,604.4 74,100 2,358.5 7,423.5 3,780
MARYLAND 14,862 161,200 5,900.9 15,135.8 9,139.9 315,500 13,485.5 37,448.7 21,884.6
MASSACHUSETTS 13,676 149,600 6,357.6 15,840.4 9,890.1 323,900 16,841.3 44,725.2 26,611.3
MICHIGAN 24,458 260,600 7,877.4 21,974.2 12,638.1 505,100 19,143.5 58,231.2 31,646.3
MINNESOTA 18,135 190,900 6,007.4 15,944.9 9,146.8 366,200 14,248.2 42,316.3 22,812.8
MISSISSIPPI 10,320 108,100 2,565.7 7,368.7 3,870 183,900 5,209.8 17,716.6 8,363.3
MISSOURI 20,822 220,700 6,366.2 17,197.3 9,604.8 412,800 14,472.9 44,321.5 23,152.6
DIRECT AND TOTAL CONTRIBUTIONS TO FRANCHISED BUSINESSES BY STATE
F R A N C H I S I N G
E M P L O Y M E N T
F R A N C H I S E
E S T A B L I S H M E N T S
S T A T E
F R A N C H I S I N G
G D P
( $ M I L L I O N S )
F R A N C H I S I N G
O U T P U T
( $ M I L L I O N S )
E M P L O Y M E N T
B E C A U S E O F
F R A N C H I S I N G
G D P B E C A U S E O F
F R A N C H I S I N G
( $ M I L L I O N S )
O U T P U T B E C A U S E
O F F R A N C H I S I N G
( $ M I L L I O N S )
F R A N C H I S I N G
P A Y R O L L
( $ M I L L I O N S )
P A Y R O L L B E C A U S E
O F F R A N C H I S I N G
( $ M I L L I O N S )
8/2/2019 Economic Impact 11
http://slidepdf.com/reader/full/economic-impact-11 17/24
www.franchise.org ECONOMICIMPACTOFFRANCHISEDBUSINESSES,VOL.3
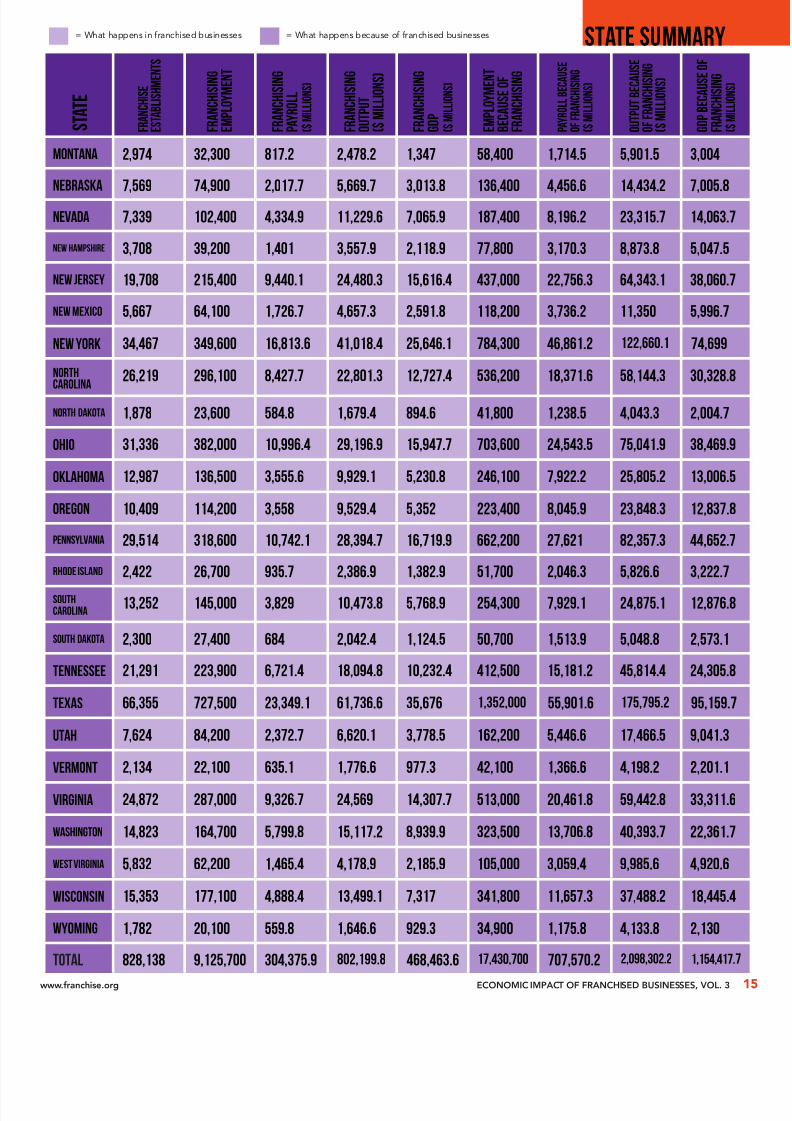
STATE SUMMARY
MONTANA 2,974 32,300 817.2 2,478.2 1,347 58,400 1,714.5 5,901.5 3,004
NEBRASKA 7,569 74,900 2,017.7 5,669.7 3,013.8 136,400 4,456.6 14,434.2 7,005.8
NEVADA 7,339 102,400 4,334.9 11,229.6 7,065.9 187,400 8,196.2 23,315.7 14,063.7
NEW HAMPSHIRE 3,708 39,200 1,401 3,557.9 2,118.9 77,800 3,170.3 8,873.8 5,047.5
NEW JERSEY 19,708 215,400 9,440.1 24,480.3 15,616.4 437,000 22,756.3 64,343.1 38,060.7
NEW MEXICO 5,667 64,100 1,726.7 4,657.3 2,591.8 118,200 3,736.2 11,350 5,996.7
NEW YORK 34,467 349,600 16,813.6 41,018.4 25,646.1 784,300 46,861.2 122,660.1 74,699
NORTHCAROLINA
26,219 296,100 8,427.7 22,801.3 12,727.4 536,200 18,371.6 58,144.3 30,328.8
NORTH DAKOTA 1,878 23,600 584.8 1,679.4 894.6 41,800 1,238.5 4,043.3 2,004.7
OHIO 31,336 382,000 10,996.4 29,196.9 15,947.7 703,600 24,543.5 75,041.9 38,469.9
OKLAHOMA 12,987 136,500 3,555.6 9,929.1 5,230.8 246,100 7,922.2 25,805.2 13,006.5
OREGON 10,409 114,200 3,558 9,529.4 5,352 223,400 8,045.9 23,848.3 12,837.8
PENNSYLVANIA 29,514 318,600 10,742.1 28,394.7 16,719.9 662,200 27,621 82,357.3 44,652.7
RHODE ISLAND 2,422 26,700 935.7 2,386.9 1,382.9 51,700 2,046.3 5,826.6 3,222.7
SOUTHCAROLINA
13,252 145,000 3,829 10,473.8 5,768.9 254,300 7,929.1 24,875.1 12,876.8
SOUTH DAKOTA 2,300 27,400 684 2,042.4 1,124.5 50,700 1,513.9 5,048.8 2,573.1
TENNESSEE 21,291 223,900 6,721.4 18,094.8 10,232.4 412,500 15,181.2 45,814.4 24,305.8
TEXAS 66,355 727,500 23,349.1 61,736.6 35,676 1,352,000 55,901.6 175,795.2 95,159.7
UTAH 7,624 84,200 2,372.7 6,620.1 3,778.5 162,200 5,446.6 17,466.5 9,041.3
VERMONT 2,134 22,100 635.1 1,776.6 977.3 42,100 1,366.6 4,198.2 2,201.1
VIRGINIA 24,872 287,000 9,326.7 24,569 14,307.7 513,000 20,461.8 59,442.8 33,311.6
WASHINGTON 14,823 164,700 5,799.8 15,117.2 8,939.9 323,500 13,706.8 40,393.7 22,361.7
WEST VIRGINIA 5,832 62,200 1,465.4 4,178.9 2,185.9 105,000 3,059.4 9,985.6 4,920.6
WISCONSIN 15,353 177,100 4,888.4 13,499.1 7,317 341,800 11,657.3 37,488.2 18,445.4
WYOMING 1,782 20,100 559.8 1,646.6 929.3 34,900 1,175.8 4,133.8 2,130
TOTAL 828,138 9,125,700 304,375.9 802,199.8 468,463.6 17,430,700 707,570.2 2,098,302.2 1,154,417.7
= What happens in franchised businesses = What happens because of franchised businesses
F R A N C H I S I N G
E M P L O Y M E N T
F R A N C H I S E
E S T A B L I S H M E N T S
S T A T E
F R A N C H I S I N G
G D P
( $ M I L L I O N S )
F R A N C H I S I N G
O U T P U T
( $ M I L L I O N S )
E M P L O Y M E N T
B E C A U S E O F
F R A N C H I S I N G
G D P B E C A U S E O F
F R A N C H I S I N G
( $ M I L L I O N S )
O U T P U T B E C A U S E
O F F R A N C H I S I N G
( $ M I L L I O N S )
F R A N C H I S I N G
P A Y R O L L
( $ M I L L I O N S )
P A Y R O L L B E C A U S E
O F F R A N C H I S I N G
( $ M I L L I O N S )
8/2/2019 Economic Impact 11
http://slidepdf.com/reader/full/economic-impact-11 18/24
16 ECONOMICIMPACTOFFRANCHISEDBUSINESSES,VOL.3 www.buildingopportunity.c
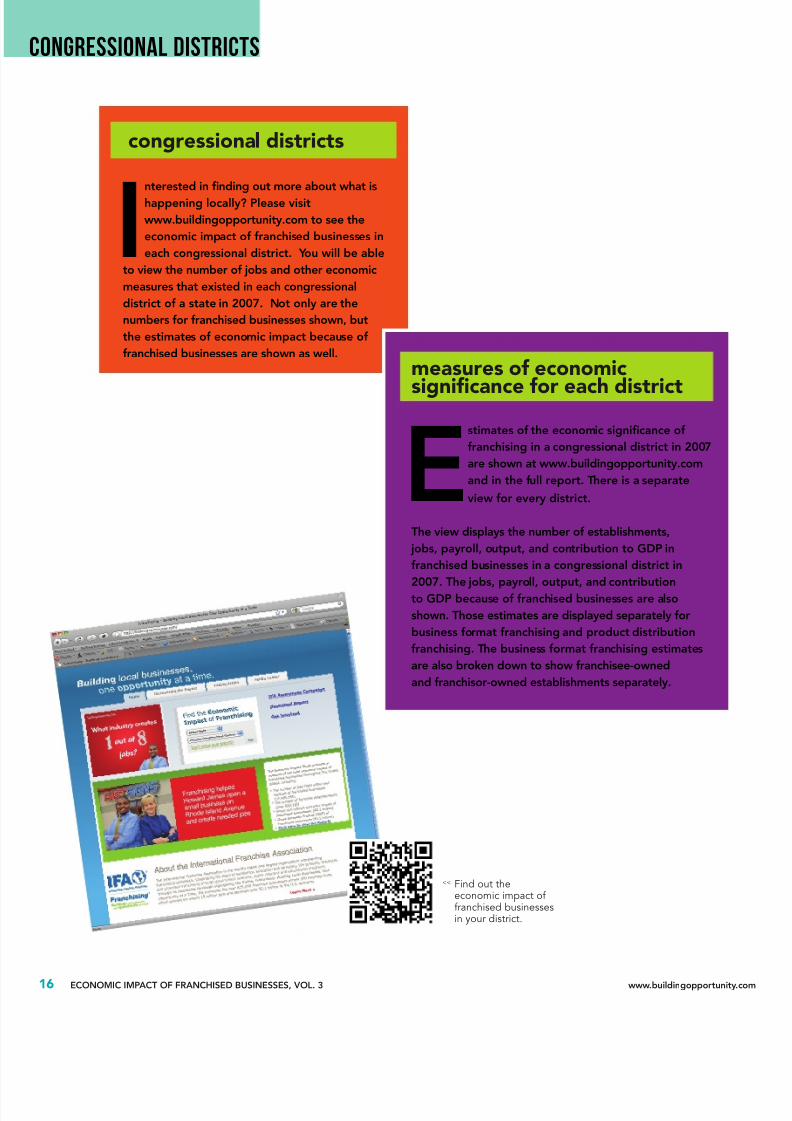
Interestedinndingoutmoreaboutwhatis
happeninglocally?Pleasevisit
www.buildingopportunity.comtoseethe
economicimpactoffranchisedbusinessesin
eachcongressionaldistrict.Youwillbeable
toviewthenumberofjobsandothereconomic
measuresthatexistedineachcongressional
districtofastatein2007.Notonlyarethe
numbersforfranchisedbusinessesshown,but
theestimatesofeconomicimpactbecauseof
franchisedbusinessesareshownaswell.
congressional districts
Estimatesoftheeconomicsignicanceof
franchisinginacongressionaldistrictin2007
areshownatwww.buildingopportunity.com
andinthefullreport.Thereisaseparate
viewforeverydistrict.
Theviewdisplaysthenumberofestablishments,
jobs,payroll,output,andcontributiontoGDPin
franchisedbusinessesinacongressionaldistrictin
2007.Thejobs,payroll,output,andcontribution
toGDPbecauseoffranchisedbusinessesarealso
shown.Thoseestimatesaredisplayedseparatelyfor
businessformatfranchisingandproductdistribution
franchising.Thebusinessformatfranchisingestimates
arealsobrokendowntoshowfranchisee-owned
andfranchisor-ownedestablishmentsseparately.
measures of economic
signicance for each district
CONGRESSIONAL DISTRICTS
<< Findouttheeconomicimpactoffranchisedbusinessesinyourdistrict.
8/2/2019 Economic Impact 11
http://slidepdf.com/reader/full/economic-impact-11 19/24
Toderivethestatisticsinthis
reportwehavecombinedand
processeddatafromseveral
differentsources.Theprimary
datasourceforthisreportisthe
2007EconomicCensus,publishedbythe
U.S.CensusBureau.The2007Economic
CensusFranchiseReportprovidesestimates
offranchisedestablishments,employment,
annualsales,andpayrollamongbusinesses
withpaidemployeesbydetailedindustry
sectoratthenationallevel.Thesedataweresupplementedusingdatafroma
varietyofsources:CountyBusinessPatterns,
2007,U.S.BureauoftheCensus;ZipCode
BusinessPatterns,2007,U.S.Bureauof
theCensus;NonemployerStatistics,2007,
U.S.BureauoftheCensus;The2002
In2004,theFoundationreleasedVolume
IofThe Economic Impact of Franchised
Businesses,whichprovidedmeasuresof
thetotaleconomicimpactoffranchised
businessesintheUnitedStatesusingdata
for2001.VolumeIIofthestudy,released
in2008,usedthesamedatasourcesand
methodologytoestimatethetotaleconomic
impactoffranchisedbusinessesin2005.
Duetomajorchangesintheunderlyingdata
setsandmethodologiesusedinthisreport,
theestimatescontainedinthisreportare
notcomparabletopreviousvolumesofthe
study.Inparticular,thecurrentestimates
incorporateinformationfromacensusof
businesseswithpaidemployees,asreported
inthe2007EconomicCensusFranchise
SurveyofBusinessOwners,U.S.Bureau
oftheCensus;MarketPlaceDVD-ROM,
April-June2008edition,Dun&Bradstreet;
IMPLAN,MinnesotaIMPLANGroup.
Formeasuringactivityoccurringbecause
offranchisedbusinesses,PwCusedthe
economicmodelingsystemdevelopedby
theMinnesotaIMPLANGroup.Themodel
providesaconsistentframeworktotrace
suchspillovereffectsandestimatethe
jobs,payroll,output,andcontributiontoGDPthatoccurthroughouttheeconomy
becauseoffranchisedbusinesses.
Formoredetailsonresearch
methodologyseethefullreport.
Report,alongwithotherdatasources.
Intheprevioustwovolumesofthisstudy,
a“congressionaldistrict”wasdenedas
acollectionofthosewholecountiesany
portion(otherthanademinimisportion)of
whichfallsintheactualcongressionaldistrict
Asaresult,intheprevioustwovolumes,
summingresultsacrosscongressional
districtswouldresultindoublecounting.
Forthecurrentreport,PwCrevisedtheirmethodologysothateconomicactivitywithi
acountylocatedinmultiplecongressional
districtsisallocatedamongthose
congressionaldistrictsusingzip-codelevel
datatoprovideanexactmappingtoactual
congressionaldistricts.Assuch,summing
resultsacrosscongressionaldistrictsinastat
wouldnowyieldexactlythestatetotals.
methodology
note on comparability with
previous estimates
ABOUT THE DATA
www.franchise.org ECONOMICIMPACTOFFRANCHISEDBUSINESSES,VOL.3 17
8/2/2019 Economic Impact 11
http://slidepdf.com/reader/full/economic-impact-11 20/24
18 ECONOMICIMPACTOFFRANCHISEDBUSINESSES,VOL.3 www.buildingopportunity.c
TheInternationalFranchiseAssociationis
theworld’soldestandlargestorganizationrepresentingfranchisingworldwide.
Celebrating50yearsofexcellence,
educationandadvocacy,IFAprotects,
enhancesandpromotesfranchisingthroughgovernment
relations,publicrelationsandeducationalprograms.
Throughitsawarenesscampaignhighlightingthetheme,
Franchising: Building Local Businesses, One Opportunity
at a Time,IFApromotesthenearly18millionjobs
and$2.1trillionofeconomicactivitygeneratedby
franchising.IFAmembersincludefranchisecompanies
inover90differentbusinessformatcategories,
individualfranchiseesandcompaniesthatsupportthe
industryinmarketing,lawandbusinessdevelopment.
T
heIFAEducationalFoundation
servesastheresearchandeducation
armoftheInternationalFranchise
Association.TheFoundationisa501
(c)(3)non-protorganizationand
donationsaretaxdeductible.TheFoundationconductsresearchtoexpandtheknowledgeand
awarenessoffranchising’sroleintheeconomy;
providescontinuingeducationandprofessional
developmentprogramsthroughtheInstituteof
CertiedFranchiseExecutives(ICFE),andworksto
increaseopportunitiesforwomenandminorities
infranchisingthroughtheIFADiversityInstitute.
The terms “franchising” and “franchise”
are often used interchangeably to mean a
business, a type of business, or an industry.
Strictly speaking, the “franchise” is the
agreement or license between two parties
which gives a person or group of people
(the franchisee) the rights to market a
product or service using the trademark and
operating methods of another business
(the franchisor). The franchisee has theobligation to pay the franchisor certain fees
and royalties in exchange for these rights. In
this sense, franchising is not a business or an
industry, but it is a way of doing business.
This research study is focused on two
types of franchises–product distribution
franchises and business format franchises.
Product distribution franchises sell the
ABOUT FRANCHISING
franchisor’s products and are supplier-dealer
relationships. In general, the franchisor
licenses the use of its trademark to the
franchisee but may not in all cases provide
the franchisee with a system for running its
business. Examples of product distribution
franchises are soft drink distributors,
automobile dealerships, and gas stations.
Business format franchises not only sellthe franchisor’s product or service with the
franchisor’s trademark, but operate the
business according to a system provided
by the franchisor. The franchisor provides
training, marketing materials, and an
operations manual to the franchisee.
There are many examples of business
format franchises, including–quick service
restaurants, automotive services, lodging,
real estate agents, convenience stores, and
tax preparation services, to name a few.
The International Franchise Association
represents business format franchising.
The typical franchise company (franchisor)
will have establishments that are operated
by franchisees as well as establishments
that are operated by corporate employees.
Over three quarters of franchisedestablishments are owned by franchisees.
The remainder are owned by the franchisor.
In the study, gures for “franchised
businesses” include franchisee-owned
and franchisor-owned establishments.
For more information about
franchising, please visit the IFA
website at www.franchise.org.
about the internationalfranchise association
about the ifa educationalfoundation

8/2/2019 Economic Impact 11
http://slidepdf.com/reader/full/economic-impact-11 21/24
www.franchise.org ECONOMICIMPACTOFFRANCHISEDBUSINESSES,VOL.3
Advertising/DirectMail
AssistedLiving
Accounting/TaxServices
AutomotiveProductsandServices
Auto&TruckRentals
ATM’s
Batteries:Retail/CommericalBeverages
Business/ManagementConsulting
Bookstores
BusinessServices
BusinessBrokers
Campgrounds
Chemicals&RelatedProducts
Children’sServices
CheckCashing/FinancialServiceCenter
Clothing&Shoes
CommercialLighting
Computer/Electronics/InternetServices
ConsumerBuyingServices
CosmeticsConstruction:Materials,
Services&Remodeling
ConvenienceStores
DatingServices
DrugStores
EducationalProducts&Services
EmploymentServices
EnvironmentalServices
EquipmentLeasing&Financing
EstatePlanning
EventPlanning
FranchiseConsulting
Food:Carribean
Accountants
Advertising/Design
Attorneys
AudioVisualProductions
BackgroundScreeningServices
BusinessProducts/Systems
CallCenter/AnsweringService
CellPhoneProvidersCheck/CreditCardServices
ComputerSoftware/InternetServices
Construction/Management
ConsumerFeedback/MarketResearch
Convention/PlanningTravel
DirectMail
Displays&Fixtures
DisputeResolution
DocumentRetrievalServices
Education/Training
ExecutiveSearch
FinancialServices
Fitness
FloristShops
Food:BakedGoods/Donuts/Pastries
Food:Candy/Popcorn/Snacks
Food:IceCream/Yogurt
Food:PizzaFood:Restaurants
Food:Specialty
GolfEquipment,Products&Services
HairSalons&Services
HandymanServices
HealthAids&Services
HomeImprovement
HomeAppliances:Sales,Rental&Rep.
HomeFurnishings:Retail,Sale&Rental
HomeInspection/RadonDetection
Hotels&Motels
Insurance
JanitorialServices
JewelryLaundry&DryCleaning
Lawn,Garden&Agricultural
Maintenance,Cleaning&Sanitation
MedSpa
Food:MealPreparation
Maid&PersonalServices
MarineServices
Metal
OpticalAids&Services
PackagePreparation/Shipment/MailService
PaintingServices
ParalegalServices
PayrollServices
PestControlServices
PetServices
Photography&Supplies
Playgrounds
PressureWashing&Restoration
Printing/PhotocopyingServices
Pre-employmentScreeningServicesPublications
Rental:Equipment&Supplies
Recreation:Equipment&Supplies
RealEstateServices
Recreation:Exercise/SportsEnt./Products
RecyclingProductsandServices
RetailStores:Specialty
SecuritySystems
SeniorCare
SignProducts&Services
SeniorLivingCommunities
Storage
TanningCenters
TelecommunicationServicesTools&Hardware
TransportationServices
TravelAgents
Vending
Video/AudioSales&Rentals
Vitamin&MineralStores
WaterConditioning
WeddingPlanning
WeightControl
WildlifeManagementControl
FRANCHISE OPPORTUNITIESBY INDUSTRY CATEGORY
SUPPLIER FORUMBY INDUSTRY CATEGORY
FinancialServices
FloralServices
FranchiseBrokers
FranchiseConsultants
FranchiseResearchServices
Hotels
HumanResources
InsuranceInteriorDesign
InternationalDevelopmentConsultants
InternetSites
Lighting
Maintenance,Cleaning&Sanitation
Manuals
Marketing/PublicRelations
MultimediaDesign
MysteryShopper
OnlineAdvertising
Organizations
PointofSalesSystems
Printing
PromotionalItems
Publications
RealEstate
SecuritySystems
SignProducts&Services
SiteSelectionTaxCreditProgram
Telecommunications
TeleconferencingServices
TradeShows/Expos
TranslationServices
Uniforms
Utilities
Vehicles
www.franchise.org ECONOMICIMPACTOFFRANCHISEDBUSINESSES,VOL.3

8/2/2019 Economic Impact 11
http://slidepdf.com/reader/full/economic-impact-11 22/24
20 ECONOMICIMPACTOFFRANCHISEDBUSINESSES,VOL.3 www.buildingopportunity.c
NOTES

8/2/2019 Economic Impact 11
http://slidepdf.com/reader/full/economic-impact-11 23/24

8/2/2019 Economic Impact 11
http://slidepdf.com/reader/full/economic-impact-11 24/24
International Franchise Association
1501KSt.NW,Suite350
Washington,DC20005
Phone:(202)628-8000
Fax:(202)628-0812
www.franchise.org