regional economic impact assessment of climate change...
TRANSCRIPT
Regional Economic Impact Assessment of Climate Change Legislation:
A Case for Michigan
Regional Economic Impact Assessment of Climate Change Legislation:
A Case for Michigan
Sugandha D TuladharCRA International
Washington DC
October 15, 2007

2
Talk outline
• Why do some states/regions have different energy use patterns?– Economic structure of the state– Demographic patterns – Production technology
• How do we capture regional differences?• What kind of a model is needed to inform implementation of
climate policies?• What approaches and tools are available for performing regional
analysis– Input-output modeling– CGE modeling– CRA’s integrated modeling approach
• Analysis of two federal GHG emissions policies using MRN-NEEM- Stringent Cap and Trade Program- Moderate Cap and Trade with a Safety Valve Program
• Impact on the State of Michigan

3
Outline
• Regional variations in economic impacts of climate policies• Capturing the regional effects
– Selecting the appropriate model– Approaches and tools for regional analysis
• MRN-NEEM Multi-Region National Model• Example of a regional analysis of climate policies
– Analysis of two federal GHG emissions policies using MRN-NEEM– Impact on the State of Michigan

4
Energy policy will have different resulting impacts on different regions/states? Why?
0.70
0.80
0.90
1.00
1.10
1997 1998 1999 2000 2001 2002 2003 2004
Ener
gy In
tens
ity In
dex
(199
7=1)
USINAZNMFLMIOHNCTXRIUTCONJMTIAWIILWACANYMNPACT

5
Energy policy will have different resulting impacts on different regions/states? Why?
0%
20%
40%
60%
80%
100%
MI US MI US MI US MI US MI US
1997 1999 2001 2003 2005
(%)
Durable goods Nondurable goods Rest Agriculture, forestry, fishing, and hunting Mining UtilitiesConstruction

6
There is need to perform analysis at regional level
• Types of models and tools used to perform regional analysis
– Regionalized input-output based modeling- Multipliers or Regional Purchase Coefficients (RPCs) used to estimate the
response in economic behavior to a policy change- Multiplier-based analysis lacks demand response feedbacks, substitutability of
inputs, and is often static in nature- Although simple to model, results would not accurately reflect the true cost of the
policy- Examples: IMPLAN model, REMI model
– CGE modeling- Most appropriate economic tool to perform regional analysis of climate policies- Based on sound micro-economic foundations representing effects on cost of
production, regional supply and demand balances, and consumer welfare- Captures general equilibrium and ripple effects throughout the economy- Developments in future technologies can be represented explicitly

7
What Kind of Modeling Capabilities are Required?
• Sound treatment of economic decisions and markets – Household and business decisions based on rational economic calculations– Complete accounting for factor inputs so that all costs are accounted for– Supply and demand equilibrium that supports efficient use of limited resources, unless
there are specific market failures represented in the model
• Detail sufficient to differentiate the impacts of alternative policy approaches
– Detailed representation of the electricity sector (the sector subject to the most complex and critical regulatory interventions)
– Explicit representation of electricity, fuel, and other trade with the rest of the United States
– Ability to determine effects and costs of measures within the model, rather than as externally imposed assumptions about costs and energy savings
• Impossibility of outsmarting agents about future price trends and policy decisions
MRN-NEEM is such a framework that integrates a technology rich bottom-up model with a comprehensive top-down CGE framework

8
MRN-NEEM: MRN Overview
• MRN is CRA’s Multi-Region National model– One of a set of CGE models developed at CRA – Current CRA team: Tom Rutherford, Paul Bernstein, Sugandha Tuladhar, David
Montgomery, Anne Smith
• MRN data– New IMPLAN data including 2002 input-output matrices and trade flow data– EIA state-level energy production, consumption and price data– Capability of analyzing California in relation to U.S. economy and energy markets
• Key economic mechanisms included in MRN model– Possibility of premature retirement of capital– Impacts on government budgets, tax interaction and “double dividend” effects– Improvement in technology over time or in response to policies to represent
technology breakthroughs– Sufficiently long time horizon to capture anticipation of future policies
• Linkage to NEEM– Replaced typical CES representation of electricity production function with a detailed
electric power sector model because top-down models cannot capture decisions about what kind of technology to use for future generation capacity
– Iteration between models to obtain consistent solutions for prices and quantities

9
Integration of MRN and NEEM Provides a Unique Capability for Analysis of GHG Policy Impacts
MRNEcon-wide
macro-econ.impacts model
NEEMNational
electricity generation
model
PolicyScenario
Costs/Impacts to units and
electric sector
Costs/Impacts to units and
electric sector
• Electricity prices• Coal prices• Gas used in generation
• Elec. demand change• Gas price change• Carbon price
Impacts to coalsupply regionsImpacts to coalsupply regions
Cost/Impacts to consumersCost/Impacts to consumers
Impacts to all sectors (incl.
transport)
Impacts to all sectors (incl.
transport)
In 27 NEEM regions
In 13 mining regions
In 9 MRN regions & by state
In 9 MRN regions& by state

10
MRN Regional Coverage: 10 Region
MRN Region States
NYNEMA, ME, NH, NY, RI, VT, CT
PJME PA, MD, DC, NJ, DECALI CA
WEST
WA, OR, AK, HI, ID, MT, NV, UT, CO, WY, AZ, NM
SESTMS, GA, AL, TN, VA, SC, NC, FL
OKTX TX, OKMAPP ND, SD, NE, KS, MN
MSVL IA, MO, AR, LA, WI, ILECRR IN, OH, KY, WVMIST MI

11
MRN Sectoral Coverage: 11 Industrial Sectors* Energy Sectors
1 COL Coal2 CRU Natural Gas and Crude3 ELE Electric Generation4 GAS Natural Gas Distribution5 OIL Refined Petroleum
* General Sectors6 AGR Agriculture7 CNS Construction8 DWE Owner-occupied dwellings9 MIN Metal and Nonmetal Mining
10 M_V Motor Vehicles -- SIC 37111 SRV Services 12 TRN Transportation Services
* MECS Energy Sectors13 ALU Aluminum14 CHM Chemicals15 COM Computer and Electronic Products16 ELQ Electrical Equipment and Appliances17 FAB Fabricated Metal Products18 FOO Food and Kindred Products19 I_S Iron and Steel20 MAC Machinery21 MSC Miscellaneous Manufacturing22 OPM Other Primary Metals23 PAP Paper and Pulp Mills24 PRN Printing and Related Support25 RUB Plastics and Rubber26 SCG Nonmetallic Mineral Products27 TEX Textiles and Apparel and Leather28 TRQ Transportation Equipment29 WOO Wood Products and Furniture
Energy COL Coal extractionCRU Natural Gas extractionELE Electric GenerationGAS Natural Gas DistributionOIL Refined Petroleum
Non-energy AGR AgricultureM_V Motor Vehicles ManufacturingEIS Energy intensive sectorsTRN Transportation ServicesSRV ServicesMAN Manufactured and processed goods

12
MRN Inputs Based on Public Macroeconomic Data
* CRA corrects IMPLAN’s regional economic data to make them usable for energy analysis• Raw IMPLAN data are inconsistent with energy quantities and prices reported by EIA• CRA modifies the IMPLAN energy accounts to match EIA’s state-level energy data
EIAEnergy flows and prices
EIA (AEO)Forecasts of energy prices and quantities
National Bureau of Economic Research’s TAXSIM model
Tax rate and revenue data
IMPLAN *Input-output tables of US economy at state level
SourceData

13
MRN-NEEM: NEEM Overview• CRA’s North American Electricity and Environment Model (NEEM) is
designed to model:– Decisions about the timing and mix of new generating capacity – Retirement and mothball decisions – Environmental compliance decisions for SOx, NOx and Hg including pollution control retrofits and
choice of emission controls for new units– Fuel choice in new units and fuel switching in existing units– Dispatch decisions (20 period load duration curve)
• NEEM models the US electric power system and portions of the Canadian system
– Fundamental geographical structure is determined by transmission interfaces - 28 NERC regions/sub-regions
– Additional geographic structure within regions to reflect environmental regulations, usually along state boundaries
– Operates over a 45 year time horizon matching MRN
• NEEM is one of the leading electric power models nationwide– Designed by Ira Shavel, who also created the IPM model used by EPA for similar purposes– NEEM, IPM and NEMS have been accepted as the most comprehensive modeling frameworks for
analysis of impacts of 3P and 4P regulations on the power sector– NEEM has capabilities and features beyond those of other models

14
Regional Analysis of Nationwide Climate Policies
• Two generic federal climate change policies selected1. Stringent policy 2. Moderate policy with a safety valve
• These two broad policies bracket most of the climate change bills that have been proposed in the US Congress over the past couple of years.
• We look at economic impacts of these comprehensive national policies on the state of Michigan

15
Nationwide Climate Change Policies Analyzed
NCEP Proposal (Bingaman)Safe Climate Act (Waxman)Model Proposed Legislation
NoneNoneOther Regulatory or Transportation Subsidies
AvailableAvailableAlternative Transportation Fuel
YesYesOffsets
Free, based on size of region’s economyFree, based on size of region’s economyAllowance Allocation
YesYesBanking
Raising the starting price of a safety value to $10 per ton of carbon-dioxide equivalent emissionsIncreasing the rate of escalation in the safety-value price to 5 percent per year in real terms
NoneSafety Valve
2006 level by 202015% below 2006 level by 2030
2009 level by 20102% annual cuts from 2011-2020
1990 level by 20205% annual cuts from 2021
80% below 1990 level by 2050
Target Emissions
Moderate Cap and Trade Policy with Safety Valve
Stringent Cap and Trade Policy

16
Total Emissions – Baseline and Cap
0
2000
4000
6000
8000
10000
12000
14000
16000
2010 2015 2020 2025 2030 2035 2040 2045 2050Year
(Mill
ion
shor
t ton
s of
CO
2e)
BaU Stringent ModerateCap ModerateSV
2006 Level15% below 2020 70% below 2020 in
2100
1990 Level
80% below 1990 Level

17
Carbon Price depends on Policy design and stringency of the policy
Carbon Price
5671
90114
145
185
236
299
9 12 15 20 25 32 4152
0
50
100
150
200
250
300
350
2015 2020 2025 2030 2035 2040 2045 2050Year
(200
7 D
olla
rs p
er s
hort
ton
of C
O2e
)
0
200
400
600
800
1000
1200
1400
(200
7 D
olla
rs p
er m
etric
ton
of C
)
Stringent ModerateSV

18
Stringent policy causes much greater reduction in emissions from the baseline
Percent Change GHG Emission Reduction
-100%
-90%
-80%
-70%
-60%
-50%
-40%
-30%
-20%
-10%
0%
2010 2015 2020 2025 2030 2035 2040 2045 2050Year
(%)
Stringent ModerateSV
19
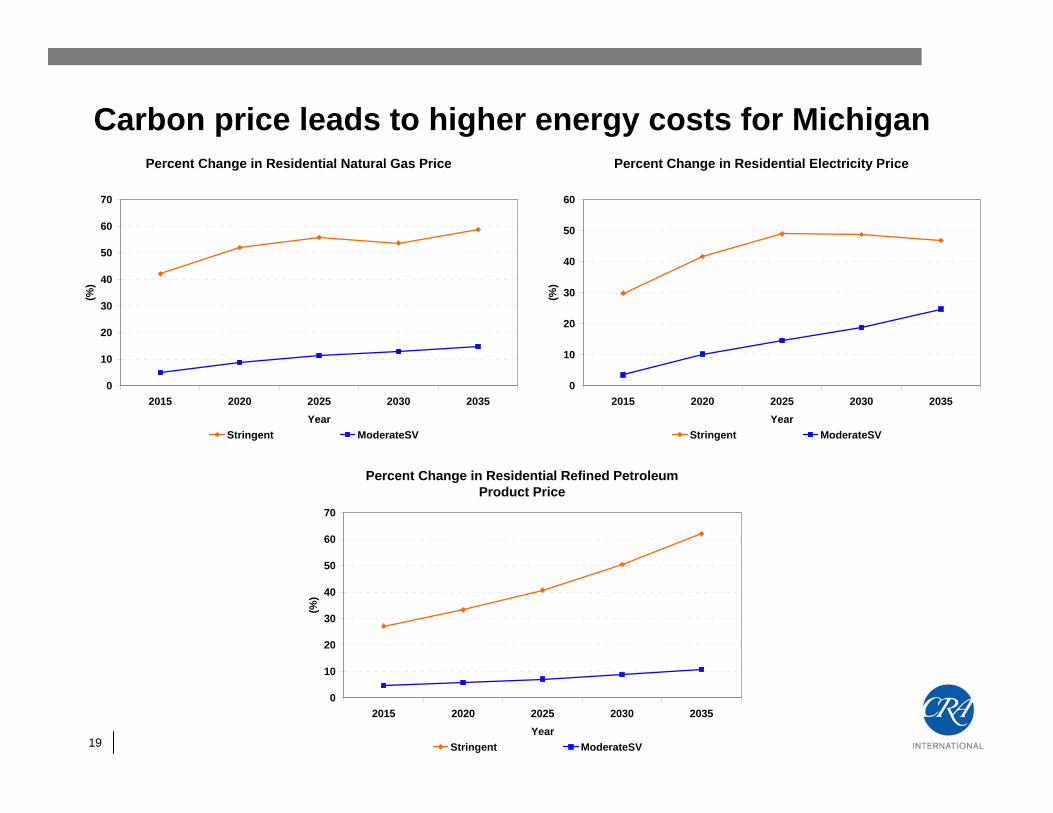
Carbon price leads to higher energy costs for MichiganPercent Change in Residential Natural Gas Price
0
10
20
30
40
50
60
70
2015 2020 2025 2030 2035Year
(%)
Stringent ModerateSV
Percent Change in Residential Electricity Price
0
10
20
30
40
50
60
2015 2020 2025 2030 2035Year
(%)
Stringent ModerateSV
Percent Change in Residential Refined Petroleum Product Price
0
10
20
30
40
50
60
70
2015 2020 2025 2030 2035Year
(%)
Stringent ModerateSV

20
Higher energy costs leads to higher cost of production and hence lower industrial output in Michigan
Percent Change in Industrial Output
-6.0
-5.0
-4.0
-3.0
-2.0
-1.0
0.0
1.0
2015 2025 2035 2015 2025 2035
ModerateSV Stringent
(%)
AGREISM_VMANSRVTRN

21
Reduction in industrial output leads to lower GSP and lower income sources
Percent Change in GSP
-4.0
-3.5
-3.0
-2.5
-2.0
-1.5
-1.0
-0.5
0.0
2015 2020 2025 2030 2035Year
(%)
Stringent ModerateSV
22
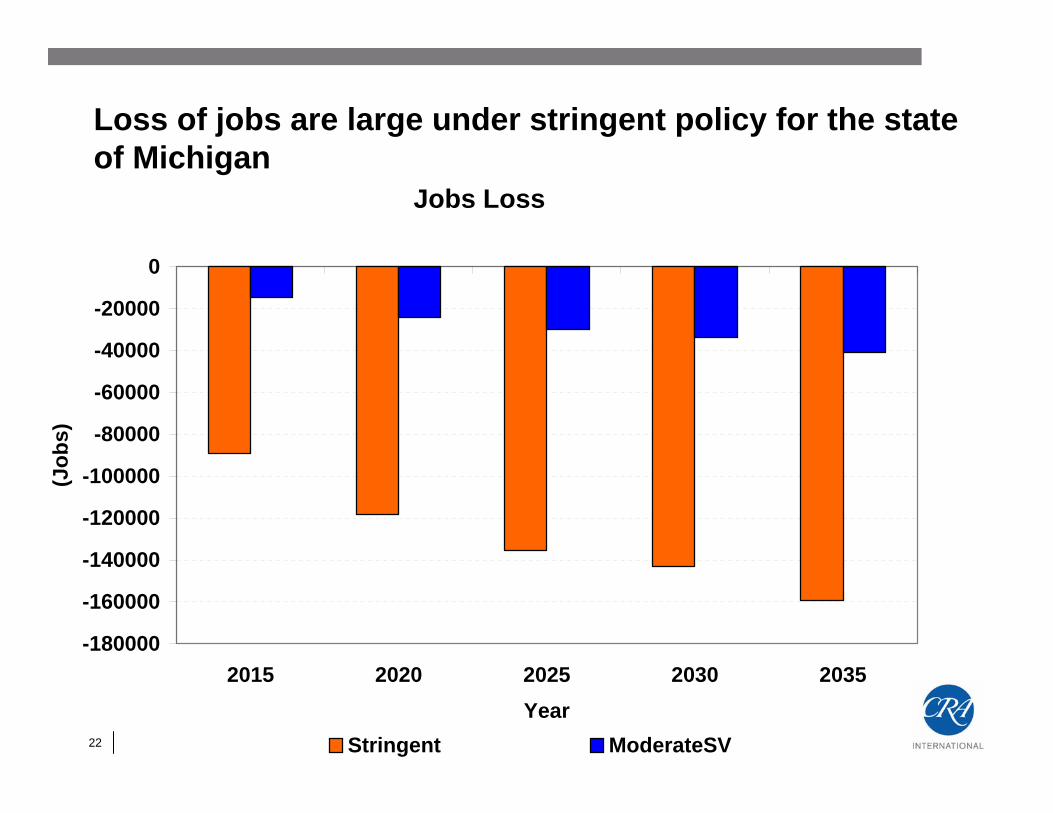
Loss of jobs are large under stringent policy for the state of Michigan
Jobs Loss
-180000
-160000
-140000
-120000
-100000
-80000
-60000
-40000
-20000
0
2015 2020 2025 2030 2035Year
(Job
s)
Stringent ModerateSV

23
There will be a cost: Cost per household
Loss in Consumption Per Houshold(expressed in current consumption per household)
0
200
400
600
800
1000
1200
1400
1600
1800
2000
2010 2015 2020 2025 2030 2035Year
(200
7 D
olla
rs p
er H
ouse
hold
)
Stringent ModerateSV
j

24
Michigan compared to some selected states
Percent Change in GSP in 2020
-4.5
-4.0
-3.5
-3.0
-2.5
-2.0
-1.5
-1.0
-0.5
0.0IN AZ NM FL MI OH NC TX RI UT CO NJ MT IA WI IL WA CA NY MN PA CT MD
Year
(%)

25
Conclusion and climate policy implications for Michigan
• There is a cost of climate change legislation for Michigan• Key industrial sectors are impacted by climate policies• The cost depends upon stringency of the policy and
policy design options chosen– Economy-wide policies were modeled in order to put a uniform price on
carbon with no sector-specific regulations– Inclusion of CAFE standards that cause larger reductions in new car
sales would have even greater impacts on Michigan• All states are not impacted equally
– The degree of impact varies widely across states depending on their mix of industry and sources of energy
– Regional model suited to capture regional heterogeneity • Safety valve is an important policy design element,
particularly for MI, to avoid high costs