economic feasibility methods: new agricultural and rural
TRANSCRIPT

South Dakota State UniversityOpen PRAIRIE: Open Public Research Access InstitutionalRepository and Information Exchange
Bulletins South Dakota State University AgriculturalExperiment Station
8-1-1988
Economic Feasibility Methods: New Agriculturaland Rural EnterprisesT. L. Dobbs
Follow this and additional works at: http://openprairie.sdstate.edu/agexperimentsta_bulletins
This Bulletin is brought to you for free and open access by the South Dakota State University Agricultural Experiment Station at Open PRAIRIE: OpenPublic Research Access Institutional Repository and Information Exchange. It has been accepted for inclusion in Bulletins by an authorizedadministrator of Open PRAIRIE: Open Public Research Access Institutional Repository and Information Exchange. For more information, pleasecontact [email protected].
Recommended CitationDobbs, T. L., "Economic Feasibility Methods: New Agricultural and Rural Enterprises" (1988). Bulletins. Paper 708.http://openprairie.sdstate.edu/agexperimentsta_bulletins/708

y, 10�
�u�ust, \ 988
tconoro\c f eas\b\\\\� �e\\\Ons·.
NeW ��r\cu\tura\ anc\
Ruta\ tntet\lr\ses

Published in accordance with an act passed in 1881 by the 14th Legislative Assembly, Dakota Territory, establishing the Dakota Agricultural College and with the act of re
organization passed in 1887 by the 17th Legislative Assembly, which established the Agricultural Experiment Station at South Dakota State University.

B 703 August, 1988
Economic Feasibility Methods:
New Agricultural and Rural Enterprises Thomas L. Dobbs
Professor of Economics
"Traditional" agriculture will not be supplanted in most Midwest and Great Plains states. Due to climate, natural resources, and location, such mainline crop and livestock enterprises as corn, wheat, soybeans, cattle, and hogs will continue to be major elements of these states' agricultural economies for many years to come. Consequently, we must continue to give substantial attention to production and marketing efficiencies of major crop and livestock products.
At the same time, however, new employment and income generating opportunities are critically needed in rural areas. In South Dakota and a number of other states, much of the agricultural production is shipped out in raw form; there is little within-state "value added" beyond the farm gate. The downturn in agricultural prices and the associated "farm depression" of the 1980s have accentuated needs and concerns for rural economic diversification.
Attempts to diversify cover many fronts. Some concentrate on increasing agricultural processing (Dobbs, 1984); the alcohol fuels interests of the late 1970s and early 1980s are representative. Homebased businesses constitute another area of focus in recent years (Dobbs, 1985); craft production, bed-and-breakfast, specialized food preparation, accounting, and house cleaning enterprises are examples. Specialty crop production is another area; farm families are looking for ways to devote some of their acreage to non-conventional crops that might offer higher returns (Pflueger and Hedin, 1987). Vegetables and ornamentals often are considered. Likewise, non-conventional animal enterprises such as fish farming are being considered in some instances.
For any new enterprise, it is critical that its economic feasibility be carefully examined at the outset. Many enterprises have failed after substantial sums of money were spent. Often, though not always, an objective feasibility analysis could have pointed to problems in advance. Sometimes the problems might have been avoided or mitigated; other times, the anticipated problems could have been a signal to avoid the enterprise.
Many events that determine the economic success or failure of a new agricultural or rural enterprise can not be predicted with any degree of accuracy. However, some events can be foreseen or at least anticipated in rough approximation.
1
Those events can be incorporated into economic feasibility analyses.
The purpose of this bulletin is to outline and describe methods of economic feasibility analysis for a new business enterprise. In some cases, individuals and groups can conduct their own feasibility analysis. In other cases, where investments are large and complex, professional assistance may have to be employed. In either case, this bulletin can be useful in clarifying what needs to be included in a feasibility analysis.
Economic feasibility analyses contain the following four components: (1) cost estimates; (2) an examination of markets for the product or service; (3) an analysis of pricing possibilities; and (4) an examination of profit potential and breakeven points. These components are interrelated and cumulative.
For sound planning and loan applications, these four components must be incorporated into a business plan. The business plan contains economic information on costs, markets, pricing, and estimated profits, along with related information on the form of business organization and planned funding sources. It also includes the planned management structure. The final section of this bulletin contains guidelines for putting together the business plan.
Estimating costs
Stated in its most simple terms, an economic feasibility analysis is a comparison of anticipated costs and returns associated with a planned business enterprise. This first section of the bulletin deals with estimation of costs, and the next two sections (on markets and pricing) deal with estimation of returns. Costs and returns are then brought together in the subsequent section on profits and break-even points.
Costs must be separated into "fixed" and "variable" categories. Fixed costs are those associated with the initial investment and those that are on-going regardless of the amount of good or service produced. These are sometimes called "overhead" or "sunk" costs. Variable costs literally vary with the level of output; they often are referred to as operating costs. A sample list of fixed and variable cost items for home-based businesses is shown in Table 1.

Table 1. Sample list of fixed and variable cost items, for a home-based business.
Fixed
1. Cost of modifying part of home* 2. Utility costs, repairs .. and maintenance allocated to operation
of the business 3. Auto* 4. Advertising 5. Tools and equipment* 6. Insurance 7. Interest 8. Dues and subscriptions 9. Licenses or inspection fees
1 O. Legal and accounting services
11. Other: _______________ _
Variable
1. Materials/supplies 2. Your (and family's) labor 3. Hired labor 4. Variable transportation or shipping costs
5. Other: _________________ _
*Depreciate, to figure cost on an annual basis.
A more detailed list of fixed (capital and other) and variable (operating) costs from an actual feasibility study (Hoffman and Dobbs, 1982) is shown in Annex A. Estimated costs for each item necessary to produce fuel alcohol and feed byproduct in a rural, small-scale plant are shown. Total capital and other fixed costs are $0.33/gallon of alcohol produced, and variable or operating costs total $1.75. Combined fixed and variable costs (before deduction of a credit for sale of the animal feed byproduct) are $2.08/gallon.
The example in Annex A illustrates how the capital components of fixed costs can be put on an "annualized" basis so that they can be added to variable costs. The coal-fired boiler, for example, has an estimated initial cost of $26,450, with an assumed useful life of 10 years, after which it would have zero economic worth. The assumed annual interest cost on capital is 15%, either in the form of interest payments on borrowed funds or foregone earnings on investors' own capital.
"Amortization factors" can be used to determine annual payments if interest and principal are repaid in equal installments over a period of time. From the selected set of amortization factors in Annex B, we can see that the factor for a 10-year loan at 15% annual interest (discount rate) is .199. Multiplying the boiler's $26,450 capital cost by this .199 amortization factor yields an "annualized" ("annual amortized") cost of $5,264. That figure, divided by gallons of alcohol fuel produced annually, results in $0.03/gallon of
2
alcohol for the boiler cost. The same procedure was used for other capital items shown in Annex A.
Amortization costs above include both depreciation and interest on investment in one figure. Another way to "annualize" capital costs is to figure depreciation and interest separately. To break depreciation and interest out as separate items, a two-step process is used.
(1) First, depreciation is calculated. Ignoring income tax considerations here, we can use a simple straight-line depreciation method. The formula is
D = (C - SV) + L
where
D = Annual depreciation, C = Initial cost,
SV = Salvage value at end of investment period, and L = Useful life.
This "economic" concept of depreciation spreads costs out over the entire useful life of a capital asset, not just over the "tax classification" life. For the boiler, costing $26,450 and lasting 10 years (with no salvage value), annual depreciation is ($26,450 - 0) 7 10 = $2,645/year.
(2) Then, interest on average investment is determined. The formula for that is
IAV = [(C + SV) + 2]1,
where
IAV = Interest on average investment, I = Annual interest rate, and
C and SV have the same meanings as in the depreciation formula.
In this example, IAV = [(26,450 + 0) 7 2].15 [(26,450)7 2].15 = [13,225].15 = $1,984/year.
By adding annual depreciation and interest together, we obtain the following: $2 ,645 + $1,984
= $4,629. This figure is of the same general magnitude as the annual figure obtained by amortizing ($5,264).
An alternative to either the amortization method or the depreciation-plus-interest method is to discount all costs to their "present value." In effect, this takes all annual recurring fixed costs (such as insurance and property taxes) and variable (operating) costs and discounts to a "present value." The sum of the present values of annual costs can then be added to initial capital costs to obtain a total present value of fixed and variable costs. If this approach is used, then annual returns (revenues) would need to be similarly discounted and summed to carry out the feasibility analysis. If the present value of all revenues exceeds the present value of all costs at the selected discount (interest) rate, then the

proposed project is economically feasible. This approach is explained in more detail in Annex C.
Regardless of the method used for analyzing costs, initial estimates of each fixed and variable cost item must be made. How we do this depends on the type of enterprise we are planning, the information available, and staff and resources available to make estimates. Often, information will be needed from various professions and disciplines (e.g., engineers, agronomists, economists, etc.) and from various types of sources
(e.g., already operating enterprises of the same or similar type, published documents, manufacturers and suppliers, etc.).
We can sometimes settle for less detailed and accurate cost information in preliminary feasibility analyses than we need for final analyses upon which loan applications are based. For instance, cost/square foot rules of thumb sometimes suffice for building cost estimates in preliminary analyses, whereas detailed contractor estimates are needed in final analyses.
Examining markets
At the other side of the feasibility equation from costs are returns. Returns, or revenues, for a business enterprise are based upon available markets and the product pricing strategy chosen. Markets are discussed first.
Many of the small-scale enterprises being considered in rural America have specialized markets. Therefore, examining the market is usually more complex than simply assessing the local "going price" and assuming that we can sell an unlimited amount of the product from our new enterprise at that price.
Instead, a market examination process involving the following three general steps is needed: (1) identification of the trade area in which we might realistically expect to sell our product; (2) examination of the population, income, and purchasing characteristics of the trade area; and (3) determination of present and potential competition for our new enterprise.
Economic feasibility studies at SDSU of smallscale fuel alcohol and feed byproduct production included such market examinations. One study (Dobbs and Hoffman, 1983), for example, assessed the market for a semi-wet (70% moisture) distillers wet grain (DWG) byproduct from a possible cornbased alcohol plant. The trade area and potential consuming population were examined by determining (1) the number of beef farms. in a county in which the plant might be located, (2) the protein feed supplement requirements of those farms, on average, (3) the number of farms required to consume (through their protein feed supplement purchases) the annual DWG output of the plant, and ( 4) the market territory size required to encompass that number of farms.
Computer analyses showed that DWG could economically substitute for purchased protein
3
supplements such as soybean meal and for some alfalfa and corn. Conventional suppliers of processed animal feed were the principal competition for DWG from an alcohol plant.
Two different sets of assumptions were used a bout the proportion of farmers in the surrounding area who might substitute DWG in their livestock rations for conventional protein supplements (and for some alfalfa and corn). These assumptions, of course, influenced the size of the necessary marketing territory. We can see in this particular example that analyses overlapped a good deal for the three market examination steps.
Examinations of markets for new fruit or vegetable enterprises (as an example) require the same three steps, but analyses must be tailor-made to individual situations. Local markets can become quickly saturated when new fruit and vegetable enterprises become established and expand (Estes, 1985). Thus, determination of the marketing territory often involves study of how far the enterprise can reach into regional or national markets. Preservation, storage, and transportation become critical.
To reach into regional or national markets, our product would have to appeal in price or quality or have some other perceived advantages to consumers in those markets. Will there be consumers in regional markets who will substitute our product-at the same price or even at a premium price-for that which they presently buy because of real or perceived quality differences? Or do we have production advantages, permitting us to undercut the competition on the basis of cost? How much will transportation and storage costs increase as we ship farther away? And, even if we do make inroads into more distant markets, are new competitors likely to soon emerge who will erode our market share? All of these questions enter market examinations for fruit, vegetable, and ornamental horticulture enterprises.
Feasibility analyses for products and services of various ''home-based'' businesses involve the same general market examination steps and some special considerations. In determining the trade area and the number of potential consumers and their purchasing characteristics, we can sometimes use data from various population and business censuses. Sales tax data compiled by state agencies may be helpful. Sometimes, special mail, telephone, or personal interview surveys may be warranted.
Finally, it behooves potential entrepreneurs to "scout" the competition. Competitors are understandably reluctant to share their trade secrets-including their costs, customer lists, and pricing strategies. But much can be learned from common-sense observation of their practices and pricing policies. If, for example, competitors appear to have considerable excess capacity (i.e., the ability to produce more than they presently do), we should be cautious. Is that excess capacity due to poor quality, poor service, or unrealistically

high prices? Or is it due to a very limited (and shrinking) market for the product we intend to produce? In any event, how can we "meet the competition? "
Markets are not static; they change constantly and need to be continuously reassessed. At some point, however, we must decide that our information is complete enough to move to the next step-developing a pricing strategy for the product or service we intend to provide. Recognizing that markets and pricing are interrelated, we turn to product pricing in the next section.
Pricing the product
Putting a meaningful price on the product or service we intend to sell requires information on both costs and markets. On the one hand, the price must be sufficient to cover costs and return a reasonable profit. On the other hand, the price must be competitive and be within economic reach of targeted customers.
The need to estimate fixed and variable costs of production was discussed in an earlier section of this bulletin. We can now use that information in examining the cost aspect of our pricing strategy. Suppose that our proposed business involves a "service" -such as a hunting guide or house cleaning service. The following formula could be used to determine an hourly charge (Dobbs, 1985b):
Hourly charge to customers
Fixed costs/yr Nonlabor variable costs/job Desired + hourly
wage
���� + ��������
Hours worked/yr Hours/job
Some hypothetical fixed and variable cost numbers can be inserted:
$3,000 $40 Hourly charge to customers 1,000 hr
+�
+ $5
3 + 8 + 5 $16/hr
In this example, if fixed costs are $3,000/yr,
nonlabor variable costs are $40/job, we expect to
spend 5 hr/job and 1000 hr/yr in this business, and
desire to earn at least $5/hr for our time, then the
hourly charge to customers must be at least $16/hr.
A slightly different formula can be used for determining a cost- based price for a "product" instead of a "service." The terms of that formula follow (Dobbs, 1985b):
price -
Selling cixed costs/yr
each -
Hours worked/yr
+ Nonlabor variable costs/item +
+ hourly x requ.i red
Desire) 4oursv wage per item (Desired profit/yr)
Items sold/yr,
Those terms repeated in the above equation have the same meaning as when used in the
4
previous equation. In this equation, however, a "profit" objective-a return for risk and management over and above the direct return to the owner-operator's hourly labor-has been incorporated. A "profit" term also could be included in the formula for pricing a service. It is perfectly reasonable in any business to provide for a profit, over and above the return necessary to cover readily identifiable costs.
Again an example can help to illustrate the formula. Suppose we plan to produce and sell a newly developed product for which the following pricing data have been estimated: (a) fixed costs are $2,200/yr; (b) we expect to spend 900 hr/yr of our time in the business; ( c) the desired direct return on our own labor is $5/hr; (d) it will take an average of 3 hr of labor for each unit produced and sold, resulting in 300 units produced/yr; ( e) non-labor variable costs come to $11.33/item; and (f) we desire a before-tax profit (over and above remuneration for labor and other costs) of $2,500/yr. The following calculations then yield a required selling price of $42/unit of production:
Se�ing ( $2200 price =
per unit 900 + $v x (3) + 11.33 +
= (2.44 + 5) x (3) + 11.33 + 8.33
( $2500 :\ 300)
= (7.44) x (3) + 11.33 + 8.33 = 22.32 + 11.33 + 8.33
= 41.98, approximately $42/unit.
Such formulas as these yield minimum practical
selling prices. If the prospective business will not
provide revenues sufficient to cover costs and
meet reasonable profit objectives, it is usually
better not to enter into the venture at all.
A common mistake is failure to include personal
and family members' labor as costs when
determining selling prices. Even if there is not a
direct cash outlay for that labor, it usually has
some "opportunity cost." In other words, if a
family member does not become involved with the
business, he or she might obtain salaried
employment elsewhere. The "alternative"
employment opportunities provide a basis for
pricing owner and family labor. Having determined cost- (and profit)-based
selling prices, we can now return to the market examination.
Perhaps a lack of competition will make it
possible to sell at prices higher than minimums
determined by the formulas. By making some
market-derived judgments about how much product can be sold at various alternative prices,
we can derive data to estimate profits for different price-quantity combinations. It may make sense to
raise the price above the minimum level, even if this reduces the physical volume of sales. The final answer regarding profit maximizing price and quantity depends on the magnitude of variable costs and the sensitivity of sales volume to prices.

In some cases, cost-based formulas may indicate we can not compete in the existing market. The analysis may show that the price we would have to charge to cover costs and provide a reasonable profit would be above that of already existing competitors. Should that be the case, it is time to start exploring other business alternatives if there are no ways of reducing costs below levels originally estimated.
Figuring profits and break-even points
Information from the cost, market, and pricing analyses needs to be brought together in a profit and loss (or income) statement. An example of such a statement for a hypothetical small business appears as Annex D. Although businesses need to prepare profit and loss statements at the end of each tax year, estimated statements also should be prepared in the feasibility analysis stage.
In light of estimated costs, potential markets, and the planned pricing strategy, what are annual profits expected to be? In the example shown in Annex D, we see that expected annual net income or profit (before income taxes) is $4,900 if we charge $50/unit. The business appears to be worth pursuing.
But, reflecting back on the earlier discussion of product pricing, what if we were not able to sell as much of the product as planned at $50/unit? We had planned to sell 300 units, but how few could we sell and at least cover costs? The following "break-even point" formula can be used in answering that question:
Break-even point quantity
Total fixed costs
Selling price/unit-Variable cost/unit
Let us continue to use $2,200/yr as the total of fixed costs in this example. Variable costs (including self and family labor) total $7,900 when 300 units are produced and sold (Annex D). This comes to $26.33/unit. With this information, the break-even quantity can be determined as follows:
Break-even point quantity
$2,200
$50 - $26.33
$2,200
23.67
92.94 (i.e., 93) units
What this tells us is that both variable and fixed costs would be covered-although there would be no "profit" -even if only 93 units of the product were produced and sold. In other words, at $50/unit, we would need only 93 units each year to cover those costs which vary with the level of
5
production (variable costs) and those costs we are stuck with (fixed costs) if we invest in the business and operate at any level of output.
With the numbers in this particular example, there is a considerable margin for error, since the actual anticipated sales volume (300 units) is more than three times the break-even volume (93 units).
We have now covered the basic elements of a feasibility analysis. How to incorporate the feasibility information and other information into a "business plan" is presented in the next section.
Putting together a business plan
A sound business plan is essential for successful operation of any new enterprise. A business plan often will be imperative if borrowed capital is required at start-up. Lenders normally want to see economic feasibility information (described in the previous sections of this bulletin) brought together in a plan showing the proposed business's goals and how those goals will be achieved.
Formats vary for presentation and organization, but most business plans should contain (1) the form of business organization to be used, (2) the market analysis, (3) financial statement projections, (4) sources of proposed financing, and (5) the management plan.
Form of business organization
The business plan should specify the form of business organization you intend to use. Among the alternatives are sole proprietorships, general partnerships, family partnerships, limited partnerships, regular corporations, Subchapter S corporations, and cooperatives. Legal, tax, and personal preference considerations will influence which organizational form you choose (Pfeiffer and Mandigo, 1984). Financial considerations also will be critical. Some specific considerations include these:
- What are the possible sources of financing? Which type of business organization is best
. for obtaining the necessary financial resources?
- Who is going to control the business? How much personal control do you as the entrepreneur want to retain?
- What skills are needed for the business that you yourself do not possess?
- What form of organization will minimize taxes?
- How much risk are you prepared to carry? If the answer is "not very much," then forms of organization that limit personal liability should be considered.
- How important is ease of formation and dissolution of the business? For example, it may be more difficult and expensive to dissolve a corporation than a sole

proprietorship or partnership. - What would happen to the business if you
could no longer manage it?
- How will the form of business organization affect your ability to purchase supplies and market your product?
The bottom line is, "What form of business organization will best help you achieve your shortand long-term business goals?"
Market analysis
Information from the market assessment and product pricing portions of the feasibility analysis must be included in the business plan. The geographic scope of the market, intended customers, magnitude and nature of the competition, and pricing strategy all should be described.
In addition, the actual methods for advertising and marketing the product need to be spelled out. Marketing (or the lack of it) can "make" or "break" a business. Both you, as the potential businessperson, and the potential lenders must have a clear vision and understanding of how product marketing is to be done. This means there must be a budget and plan for advertising and promotion.
Many persons start small businesses with skilled production knowledge. Too often, however, they have little experience with and have given insufficient attention to marketing the product. There is no chance for economic success if the product is not effectively marketed.
Financial statements
Three types of financial statements should be included in the business plan. They are (1) projected profit and loss (or income) statements, (2) cash flow projections, and (3) balance sheets.
Profit and loss statements were described in an earlier section and an example is shown in Annex D. Difficult as it is to do, expected profits and losses must be projected for several years down the road. Since most businesses have a gradual build-up phase, it is highly desirable to project the profit and loss picture at the end of each of the first 3 to 5 years. This set of projections then constitutes part of the plan for building up the business.
Cash flow projections are similar to, but distinctly different from, profit and loss statements. An example cash flow statement
format (for the same hypothetical business as is
shown in annex D) is presented as Annex E. A
business may be profitable by the end of a 3-year
period, for example, but not have sufficient
positive cash flow to remain operating that long.
Entrepreneurs often "beg, borrow, and steal" to
put the necessary initial investment capital
together, but do not provide for adequate
6
operating capital to see themselves through those initial lean months and years. The cash flow projection part of the business plan is intended to help entrepreneurs confront and hopefully avoid that problem.
Cash flow projections should be broken down at least quarterly during the first year or two (quarterly breakdowns are not shown in Annex E), and annual projections should run for 3 to 5 years. The cash flow projections show all sources of investment and operating funds for the business-including cash on hand, sales receipts, loan receipts, and any other sources. Balanced against the cash inflow are all destinations of cash outflow-including purchases of fixed assets, loan payments, operating expenses, tax payments, etc. In the cash flow projections, receipts and expenditures are entered at the time they are expected to actually occur, not in the period to which they are allocated for profit and loss statement or income tax purposes.
The cash flow projections do not tell us whether or not the business will be profitable. Instead, they answer one simple but critical question: "Will there be adequate funds available in each time period to operate the business according to plan? "
Finally, balance sheets constitute the other type of financial statement needed in the business plan. Depending on the type of business organization chosen and sources of financing sought, you may need to present both (1) an initial balance sheet for the proposed business and (2) a personal balance sheet (often called a net worth statement) for the individual(s) involved. These balance sheets show assets and liabilities of the individual or business. The difference between assets and liabilities is referred to by various names, including "proprietor's capital," "owner's equity," and ''net worth.'' Lenders look at the balance sheets to help them determine the financial strength of the business and its owners.
In addition to preparing the initial balance sheet(s), it is desirable to project ahead one or several years with the business balance sheet. A sample end-of-first-year balance sheet (for the same hypothetical business as is shown in Annexes D and E) is shown in Annex F. In this example, assets are projected to total $16,000 at the end of the first year of business operation, and liabilities are projected to total $5,000 ($1,000 in current liabilities and $4,000 in long-term liabilities). The difference between assets and liabilities-proprietor's capital-at the end of the first year is $11,000.
Sources of financing
Planned sources of equity and debt financing need to be identified in the business plan. The forms of financing will depend, in part, on the form of business organization (discussed ear lier). Stocks, bonds, and bank loans are among the types of financing drawn on by corporations, for

example. Sole proprietorships and partnerships often draw on informal sources-such as borrowing from relatives and borrowing against life insurance policies-in addition to bank financing and other more conventional sources. Principal sources of business loan money listed by Pfeiffer and Mandigo (1984, p. 26) are the following:
- Commercial banks - Savings and loan companies - Loans from the seller (the previous owner of
the business), family, relatives, or friends - Finance companies - Factoring companies (which buy your
accounts receivable and in many cases assume the risk of bad debts)
- Inventory financing companies - Government sources (such as the Small
Business Administration, the Farmer's Home Administration, special loan funds of state government, etc.)
- Credit unions - Floor planning companies (which pay the
factory invoice for the merchandise that goes on the retailer's sales floor)
- Various leasing companies - Investment clubs - Internal financing (such as buying from
suppliers on credit)
How easy it is to get funds from these various sources will depend on numerous factors, including the potential profitability of the proposed business, degree of risk involved, amount of equity financing provided by the owner-investor(s), previous credit history(ies) of the borrower(s ), and loan collateral which the borrower(s) can offer. Terms and conditions of various financing sources should be explored and compared before the business plan is finalized.
Management plan
The final component of the business plan to be discussed here is the management plan. This is partly related to the form of business organization, but it also refers to the larger, overall management strategy. Goals, objectives, and tasks (procurement, personnel management, accounting, production, marketing) required to meet the goals and objectives are identified in the management plan. An organizational structure (consistent with the form of business organization) is laid out which shows chains of command and delegations of responsibility for accomplishing the various tasks. Where the authority rests for various decisions should be identified in the management plan.
In a nutshell, the management plan shows how decisions will be made and how those decisions will be carried out in the various operational components of the business.
7
Summary
Poor investments can often be avoided and the chances of succeeding with potentially good investments can be enhanced if sound feasibility analyses are undertaken. These analyses need to include cost estimates, market assessments, product pricing strategies, and forecasts of profits.
Information from a feasibility analysis is combined with business goals, organizational plans, and production and marketing plans to constitute the overall business plan.
Feasibility analyses and resulting business plans are essential in efforts to undertake new agricultural and rural enterprises.
•
References
Aplin, R.D., G.L. Casler, and C.P. Francis, Capital investment analysis: Using discounted cash flows. Columbus, Ohio: Grid Publishing, Inc., 1977.
Daines, S.R., et al. Agribusiness and rural enterprise project analysis manual. Washington, D.C.: Development Support Bureau, U.S. Agency for International Development, 1980.
Dobbs, T.L. Ag supply and processing linkages between agriculture and rural development, presentation for panel on Policy Issues on the Role and Development of a National Rural Development Policy at 1984 American Agricultural Economics Association Annual Meeting, Ithaca, New York. Panel proceedings published by the USDA's Office of Rural Development, and abstract appears in American Journal of Agricultural Economics, 66, No. 5 (December 1984).
___ . Economics of home-based businesses. SDSU Economics Newsletter No. 223. Brookings, SD: June 5, 1985a.
___ . Small business economics: Handout for workshops on your home business. SDSU EMC 887. Brookings, SD: 1985b.
___ , 0. Paananen, and P.A. Rechard. Criteria and methods for state water resource planning. University of Wyoming Water Resources Research Institute Series No. 22. Laramie, Wyoming: January 1971.
___ and R. Hoff man.- Small-scale fuel alcohol production from corn: Economic feasibility prospects. SDSU Agricultural Experiment Station Bulletin 687. Brookings, SD: June 1983.
Estes, E. (ed.). Proceedings of analyzing the potential for alternative fruit and vegetable crop production seminar. Sponsored by S-178 Technical Committee and the Farm Foundation. New Orleans: November 4, 1985.
Hoffman, R., and T.L. Dobbs. Small-scale plant: Costs of making fuel alcohol. SDSU Agricultural Experiment Station Bulletin 686. Brookings, SD: September 1982.
Pfeiffer, J.W., and L. Mandigo. Guide to starting or buying a business. Sioux Falls, SD: Pro-Mark Press, 1984.
Pflueger, B.W., and J. Hedin. Is alternative agriculture for you? SDSU Economics Newsletter No. 251. Brookings, SD: June 29, 1987.

Annex A. Example of fixed and variable costs, a fuel alcohol plant.
175,074 gallons of 185 proof alcohol, including denaturant, and 1,356 tons of DWG, 15% interest rate, $2.50/bu corn, alcohol yield of 2.6 gal/bu of corn
Capital and other fixed costs ( 1) (2) (3)
Useful Capital life
Item cost' (years)
A. Items not likely to be available
Coal-fired boiler $ 26,450 10 Fermentation tanks 23,300 10 Grain handling system 12,800 10 Alcohol storage 5,000 10 Auger 500 5 Heat exchanger 1, 750 10 Feed byproduct storage 1,200 20 Water softeners (2) 1,000 5 Building 26,000 20 Distillation column 19,000 10 Temperature meter 300 10 Pressure gauges (2) 50 10 Pumps and motors 2,350 5 Pipes and accessories 1,000 5 Centrifuge 32,000 10 Flow meters (2) 150 10 Differential pressure cell 250 10 Cooling tower 3,900 10 Laborato� 3,000 10
Subtotal A = $160,000
B. Items possibly already available among members of a cooperative group
Vertical auger Skid-steer loader (or tractor loader
of some kind) Steel grain bin
Subtotal B =
C. Other fixed costs
Insurance Maintenance Property taxes
Subtotal C =
Total capital and other fixed costs (A + B + C)
$2,400 10 20,000 20
4,100 20 $26,500
$186,500
8
(4) Annual
amortized cost (at 15%
interest)
$ 5,264 4,637 2,547
995 149 348 191 298
4,134 3, 781
60 10
700 298
6,368 30 50
776 597
$31,233
$ 478 3,180
652 $ 4,310
Annual cost
$ 9,500 7,450 5,950
$22,900
$58,443
(5) Cost per
gal of denatured alcohol (col 4 -:-
175,074 gal)
$.030 .026 .015 .006 .001 .002 .001 .002 .024 .022 .000* .000* .004 .002 .036 .000* .000* .004 .003
$.178
$.003 .018
.004
.025
$.054 .043 .034
$.131
$.334

Operating costs
(1) (2) (3) (4) (5)
Units/ Cost/gal of Annual gal of non- non-denatured cost denatured Cost/ alcohol (Col. 2 x (Col. 4 x
Item alcohol unit Col. 3) 166,320)
Corn (2.6 gal/bu) .385 bu $2.50/bu $.963 $160, 166 Diazyme L-100 .63 oz .12/oz .076 12,640 Taka-Therm .18 oz .14/oz .025 4,158 Sulfuric acid 1.00 oz .01/fl oz .010 1,663 Ammonium hydroxide .49 oz .05/fl oz .025 4, 158 Yeast .02 lb 1.20/lb .024 3,992 Electricity .89 kwh .029/kwh .026 4,324 Fuel (10,000 btu/lb coal) 2.60 lb 47.00/ton .061 10,146 Water 11.0 gal .99/1000 gal .011 1,830 Labor 78,840 Laboratory tests 2,250 Denaturant (gasoline) .053 gal 1.30/gal .069 11,476 Interest on operating capital 11,089
( 15 % interest/yr for 3 months/yr)
Total operating costs $306,730
Ill. Total costs (I + 11) $365, 173
IV. Credit for feed byproduct $ 52,884
V. Net cost of denatured alcohol (I l l - IV) $312,289
*The annual cost per gallon of denatured alcohol is so small for these items that it rounds to Oat three decimal places.
Source: Hoffman and Dobbs, 1982.
Annex B. Selected amortization factors.
Years
5 10
6%
.237
.136
7%
.244
.142
8%
.250
.149
Discount rate
9
9%
.257
.156
10%
.264
.163
15%
.298
.199
(6)
Cost per gal of denatured
alcohol (Col. 5 +
175,074)
$.915 .072 .024 .009 .024 .023 .025 .058 .010 .450 .013 .066 .063
$1. 752
$2.086
$ .302
$1.784 ($1 . 78, rounded)
20%
.334
.239

Annex C. Discounting
One method for comparing costs and returns occurring over time in a business is by discounting to "present values." Only a very brief description of this procedure is given here, since detailed accounts can be found in various sources (Aplin et al, 1977; Daines et al, 1979; and Dobbs et al, 1971 ). The generalized formula for the discounted present value (Dobbs et al, 1971, p 10) is:
n PV = �
t = 0
where
81 = Benefit or return at time t,
C1 = Cost at time t (C0 is the initial cost outlay),
t = Number of years after initial cost outlay, and
R = Annual interest or discount rate.
All costs and returns are discounted back to the time of the initial cost outlay with this formula.
An example of how discounting with this formula can work with benefit and cost flows for a public water project is shown in the following table. The same general procedures would apply for a private business venture, in which "benefits" would consist of the sales revenues. There are important differences between public projects and private business ventures, however, in such areas as (a) what discount rate to use and (b) what is included among the "benefits."
Benefit and cost streams for hypothetical water project.
Number of Cost Discounted Benefit years after at cost at initial cost time when time
outlay t R=0.05 t
(t) (Ct) (Bt)
0 $5,000 $ 5,000.00 $ 0 1 2,000 1,904.80 0 2 1,000 907.00 1,000 3 1,000 863.80 1,500 4 1,000 822.70 1,500 5 1,000 783.50 3,000 6 1,000 746.20 3,000 7 1,000 710.70 3,000 8 1,000 676.80 3,000 9 1,000 644.60 3,000
10 1,000 613.90 3,000
Total $13,674.00
R =annual interest or discount rate PV =discounted present value Source: Dobbs, Paananen, and Rec hard, p 14.
Discounted Net Discounted Discounted Discounted benefit benefit net benefit net benefit net benefit
when at time when when when R=0.05 t R=0.05 R=0.09 R=0.10
(B1-C1)
$ 0.00 $-5,000 $-5,000.00 $-5,000.00 $-5,000.00 0.00 -2,000 -1,904.80 -1,834.80 -1,818.20
907.00 0 0.00 0.00 0.00 1,295.70 500 431.90 386.10 375.65 1,234.05 500 411.35 354.20 341.50 2,350.50 2,000 1,567.00 1,299.80 1,241.80 2,238.60 2,000 1,492.40 1,192.60 1,129.00 2,132.10 2,000 1,421.40 1,094.00 1,026.40 2,030.40 2,000 1,353.60 1,003.80 933.00 1,933.80 2,000 1,289.20 920.80 848.20 1,841.70 2,000 1,227.80 844.80 771.00
$15,963.85 $2,289.85 $ 261.30 $ -151.65 (PV) (PV) (PV)
10
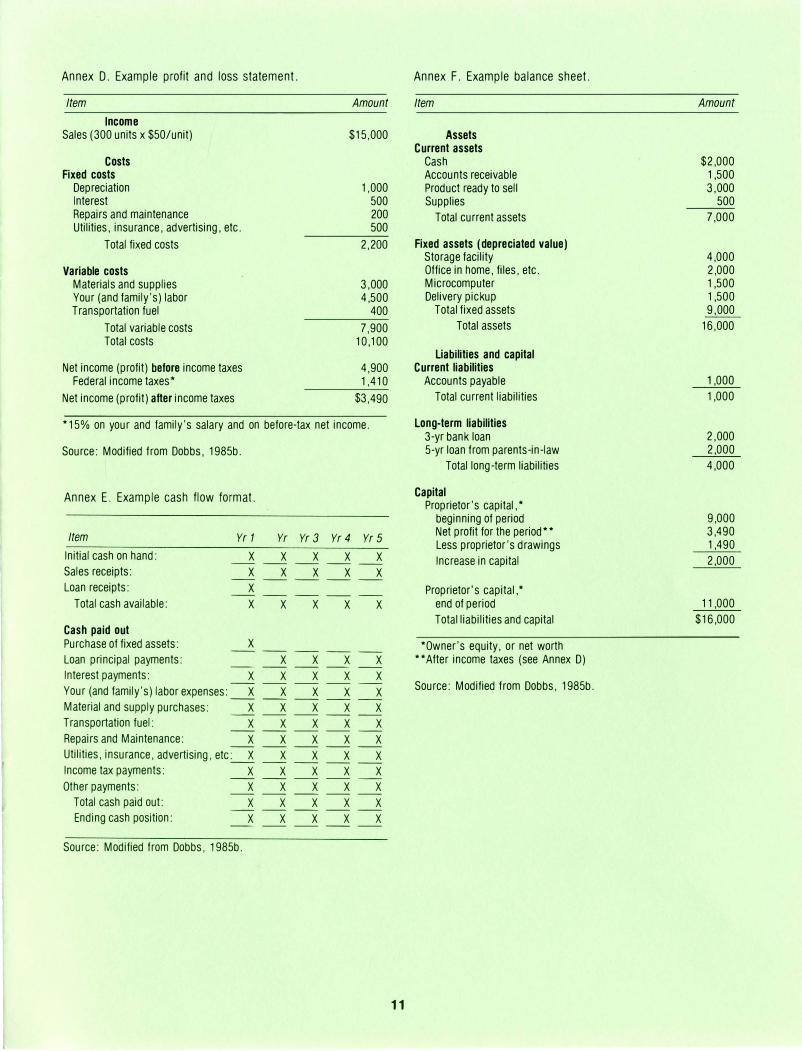
Annex D. Example profit and loss statement.
Item
Income Sales (300 units x $50/unit)
Costs Fixed costs
Depreciation Interest Repairs and maintenance Utilities, insurance, advertising, etc.
Total fixed costs
Variable costs Materials and supplies Your (and family's) labor Transportation fuel
Total variable costs Total costs
Net income (profit) before income taxes Federal income taxes*
Net income (profit) after income taxes
Amount
$15,000
1,000 500 200 500
2,200
3,000 4,500
400
7,900 10,100
4,900 1,410
$3,490
*15% on your and family's salary and on before-tax net income.
Source: Modified from Dobbs, 1985b.
Annex E. Example cash flow format.
Item Yr 1
Initial cash on hand: x
Yr Yr 3 Yr 4 Yr 5
x x x x -- -- -- -- --Sales receipts: x x x x x -- -- -- -- --
Loan receipts: x -- -- -- -- --
Total cash available: x
Cash paid out Purchase of fixed assets: X
x x x x
-- -- -- -- --
Lo an principal payments: ____ x __ x __ x __ x Interest payments: __ x __ X __ x __ x __ x Your (and family's) labor expenses: __ x __ X __ x __ X __ x Material and supply purchases: __ X __ X __ X __ x __ X Transportation fuel: __ x __ x __ x __ x __ x Repairs and Maintenance: __ X __ X __ X __ X __ X Utilities, insurance, advertising, etc� __ X __ X __ X __ X Income tax payments: __ X __ X __ X __ X __ x Other payments: __ x __ x __ x __ x __ x
Total cash paid out: __ x __ x __ x __ x __ x Ending cash position: __ x __ x __ x __ x __ x
Source: Modified from Dobbs, 1985b.
1 1
Annex F. Example balance sheet.
Item
Assets Current assets
Cash Accounts receivable Product ready to sell Supplies
Total current assets
Fixed assets (depreciated value) Storage facility Office in home, files, etc. Microcomputer Delivery pickup
Total fixed assets Total assets
Liabilities and capital Current liabilities
Accounts payable Total current liabilities
Long-term liabilities 3-yr bank loan 5-yr loan from parents-in-law
Total long-term liabilities
Capital Proprietor's capital,*
beginning of period Net profit for the period** Less proprietor's drawings Increase in capital
Proprietor's capital,* end of period Total liabilities and capital
*Owner's equity, or net worth **After income taxes (see Annex D)
Source: Modified from Dobbs, 1985b.
Amount
$2,000 1,500 3,000
500 7,000
4,000 2,000 1,500 1,500 9,000
16,000
1,000 1,000
2,000 2,000 4,000
9,000 3,490 1,490 2,000
11,000 $16,000