feasibility study on agricultural plastic waste...
TRANSCRIPT
Feasibility Study on Agricultural Plastic Waste Management:
‘’A sustainable model for Agricultural Plastic Waste management Feasibility and Options in Municipality of Ilida-Western Greece’’
I. Acknowledgements
ABS: Acrylonitrile-Butadiene-Styrene
B&C: Building and Construction
CA sites: Civic Amenity sites
C&I: Commercial and Industrial
ELV: End of Life Vehicle
EPR: Extended Producer Responsibility
EU: European Union
FTE: Full time equivalent
GHG: Greenhouse Gases
LCI: Life Cycle Inventory
MBT: Mechanical Biological Treatment
MRF: Material Recovery Facility
MS: Member State
MSW: Municipal Solid Waste
“Other plastic waste”: Other plastics stream include bulky plastic waste and plastic waste not included in the other five waste streams, namely Packaging waste, WEEE, ELV, B&C waste and agricultural waste.
“Other plastic resins”: Other plastic resins include all other plastic resins used for manufacturing of plastic products except the six plastics resins specifically analyzed in this report, namely PET, PE-HD, PE-LD, PP, PS and PVC.
PA: Polyamide
PE-HD: High Density Polyethylene
PE-LD: Low Density Polyethylene
PET: Polyethylene Terephthalate
PO: Polyolefin
PP: Polypropylene
PRE: Plastics Recyclers Europe
PS: Polystyrene
PUR: Polyurethane
PVC: Polyvinyl Chloride
RDF: Refuse Derived Fuel
SRF: Solid Recovered Fuel
WEEE: Waste Electrical and Electronic Equipment
WFD: Waste Framework Directive
APW: Agri Plastic Waste
web- based GIS: Geographic information system
Programme AWARD: Agricultural Waste valorization for a competitive and sustainable Regional Development
JMD: Joint Ministerial Decision
PD: Presidential Decision
GDP: Gross Domestic Product
PPPP: Public Private People Partnerships
PPP: public-private partnerships
SMEs: Small and Medium Enterprises
ROI: Return on Investment
WEEE: Waste from Electrical and Electronic Equipment
I&T packaging: Industries & Trade packaging
APE: Agriculture Plastic & Environment
EC: European Commission
EEE: Electrical and electronic equipment
ESBO: epoxidised soybean oil
UNEP: United Nations Environment Programme
LAs: Local Authorities
B&C: Building and Construction waste
GVA: gross value added
PE: polyethylene
WTE: Waste to energy
LDPE: Low-density polyethylene
PE- HDand PP: mixed polyolefin
YPEKA: Ministry of Environment, Physical Planning and Public Works previous title of
EYEP: Hellenic Environmental Inspectorate
OJG: Official Journal of the Government
NOAMPOW: National Organization for the Alternative Management of Packaging and Other Waste
IEA: International Energy Agency
CO2: Carbon dioxide
EPD: Environmental Product Declarations
NSRF: National Strategic Reference Framework
LDPE: Low density polyethylene plastics
ODA: Official Development Assistance
II. Contents I. Acknowledgements ............................................................................................................ 2
IV. Preface ........................................................................................................................... 4
General objectives: ................................................................................................................ 5
Specific objectives: ................................................................................................................. 5
V. Introduction to AWARD project ......................................................................................... 5
a) Objectives and Background of the project .................................................................... 6
VI. Important considerations .............................................................................................. 7
a) Methodology of the Research ....................................................................................... 7
Research value ....................................................................................................................... 7
Principles and core orientation milestones ........................................................................... 7
VII. Political Analysis ............................................................................................................. 8
a) Waste Plastic Targeted EU Policy Framework ............................................................. 11
National Waste Management Plan ESDA "Convert waste into resources, promoting the concept of circular economy in practice" .............................................................................................. 11
Planning of the Ministry ....................................................................................................... 12
Waste Framework Directive, 2008/98/EC ........................................................................... 12
Landfill Directive, 1999/31/EC ............................................................................................. 13
Packaging and Packaging Waste Directive, 94/62/EC .......................................................... 13
Registration, Evaluation, Authorization and restriction of Chemicals (REACH), 1907/2006/E14
Waste Electrical and Electronic Equipment Directive, 2002/96/EC .................................... 14
End-of-Life Vehicles Directive, 2000/53/EC ......................................................................... 14
Ecodesign Directive, 2005/32/EC, 2009/125/EC .................................................................. 14
Lead Market Initiative .......................................................................................................... 15
Regulation on shipments of waste, (EC) 1013/2006 ............................................................ 15
Thematic Strategy on the Prevention and Recycling of Waste ............................................ 16
VIII. General Characteristics of the focus area .................................................................... 16
a) Uses of Plastic on the Farm .......................................................................................... 18
a) Ilida Municipality .......................................................................................................... 18
Social Analysis of the focus area .......................................................................................... 20
1
IX. ‘’Agricultural Plastic Waste Management’’ Feasible solutions and best practices in EU level 20
a) Uses of Plastic on the Farm .......................................................................................... 22
a) Waste generated .......................................................................................................... 22
Share of recyclable plastics rate .......................................................................................... 23
Feasible solutions for sustainable agricultural plastic waste management. A comprehensive model for the eligible area .............................................................................................................. 23
A feasible model for APW management in Ilida .................................................................. 25
Description of the model ..................................................................................................... 26
Parameters of the model ..................................................................................................... 27
B&C and Agricultural plastic waste ...................................................................................... 27
ELV plastic waste .................................................................................................................. 28
Data and assumptions in sorting/pre-treatment of plastic waste ....................................... 28
Data and assumptions in transportation ............................................................................. 30
Data and assumptions in recycling of plastic waste ............................................................ 31
Data and assumptions in incineration and landfilling .......................................................... 32
Pre-treatment/sorting of collected plastics ......................................................................... 33
Transportation of plastics to recyclers ................................................................................. 34
Recycling of plastics ............................................................................................................. 35
Technological analysis .......................................................................................................... 35
Avoided emissions from incineration .................................................................................. 36
X. A feasible model............................................................................................................... 38
Description of the model ..................................................................................................... 38
How a management system may work ................................................................................ 39
Significance of Estimates Viability of a Recycling Program .................................................. 39
Guidelines for the use of Agricultural Plastics (AP) at farm level ........................................ 40
Use of agricultural plastics ................................................................................................... 40
Guidelines for the removal and storage of Agricultural Plastics (AP) at the farm ............... 40
Temporary storage ............................................................................................................... 41
Guidelines for the transportation and delivery of the plastics at the collection area ......... 41
Potential Collection Sites ..................................................................................................... 43
Agricultural Film Recycling in Ilida Municipality: Steps in the Process ................................ 44
2
Pre-treatment process efficiency ......................................................................................... 45
Agricultural Film Recycling: Collection & Hauling ................................................................ 46
Processing of Recycled Plastic .............................................................................................. 46
XI. Alternative Uses of Agriculture Recycled Plastic ......................................................... 47
What are BMPs for Agricultural Films? ................................................................................ 47
Waste-to-Energy .................................................................................................................. 47
Issues re: a WTE Component to an Agricultural Film Recycling Program ............................ 47
Re-Processing & Manufacture of New Products.................................................................. 48
Products Made from Recycled Agricultural Films ................................................................ 48
Identifying Markets for Recycled Film ................................................................................. 48
XII. Agricultural plastic market in Greece .......................................................................... 49
Suppliers and Distribution .................................................................................................... 51
Collectors ............................................................................................................................. 52
Recyclers / Regenerators ..................................................................................................... 52
Energy / Heat Industry ......................................................................................................... 53
Data and Economics of Recycling and Energy Recovery ...................................................... 54
XIII. GREEN PAPER On a European Strategy on Plastic Waste in the Environment ............ 55
POLICY OPTIONS FOR IMPROVING MANAGEMENT OF PLASTIC WASTE IN EUROPE .......... 56
Application of the waste hierarchy to plastic waste management ..................................... 57
XIV. Biodegradable plastics ................................................................................................. 58
A generalization leads to questions based on a green paper (Brussels, 7.3.2013 COM (2013) 123 final) ..................................................................................................................................... 59
XV. The human factor ......................................................................................................... 60
The inhabitants .................................................................................................................... 60
The Local Authorities ........................................................................................................... 60
The beneficiary ..................................................................................................................... 60
Opportunities ....................................................................................................................... 60
Threats ................................................................................................................................. 60
XVI. Business Model ............................................................................................................ 61
XVII. Strategic recommendations for Sustainability of the Model ................................... 62
XVIII. Bibliography ............................................................................................................. 63
3
Picture 1 Satellite view of the focus area ................................................................................ 18 Picture 2 Structure of the plastic waste value chain model .................................................... 27 Picture 3 RDF production and use in the plastics recycling value chain .................................. 33
Figure 1 GENERATION OF POST-CONSUMER PLASTICS WASTE BY APPLICATION (2011) ........ 21 Figure 2 COLLECTION FOR RECYCLING AND ENERGY RECOVERY RATES PER COUNTRY (2011)21 Figure 3 Generation of packaging waste by waste type (1997-2007) ..................................... 24 Figure 4 Generation of waste by economic activity (Shares, 2006) ........................................ 24
Table 1 Permanent population and area of the municipality of Ilida (2011) .......................... 17 Table 2 Demographic data of the sub-Regional entity, Ilia ...................................................... 17 Table 3 Data for crop species in the municipality of Ilida ........................................................ 20 Table 5 Distribution of plastic waste by source and annual growth rates .............................. 23 Table 6 Plastic waste recyclability rates assumed for future scenarios .................................. 23 Table 7 EU-28 average costs and employment intensity in the pre-treatment/sorting of plastic waste ................................................................................................................................................. 29 Table 8 Breakdown of the plastic resins content in the six waste streams analyzed in the model, at the output of the pre-treatment/sorting step, (%) .................................................................. 30 Table 9 Transport to recyclers and other waste management options .................................. 30 Table 10 Average recycling costs and employment by resin ................................................... 31 Table 11 PRICES FOR RECYCLED PLASTIC RESINS, 1994 & 2004 (CENTS PER LB) ..................... 32 Table 12 Plastic Waste Types ................................................................................................... 46 Table 13 Interface of the plastic industry ................................................................................ 50 Table 14 Greek plastic industry per type ................................................................................. 50
4
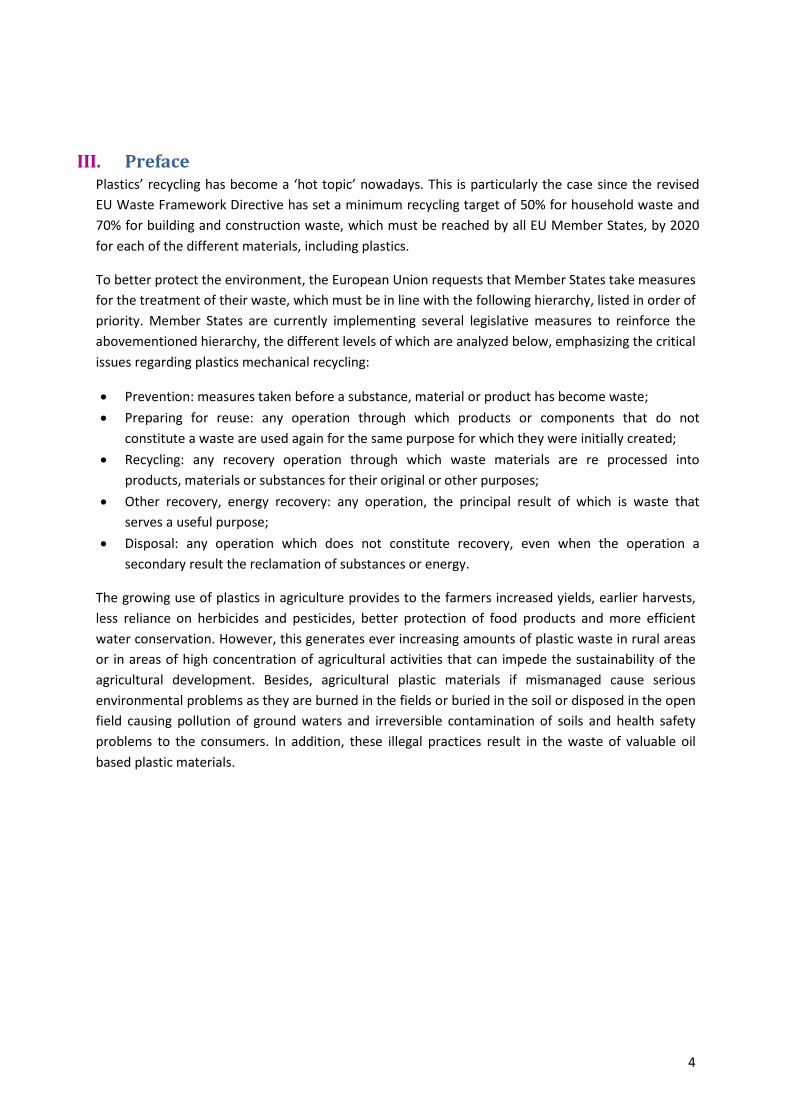
III. Preface Plastics’ recycling has become a ‘hot topic’ nowadays. This is particularly the case since the revised EU Waste Framework Directive has set a minimum recycling target of 50% for household waste and 70% for building and construction waste, which must be reached by all EU Member States, by 2020 for each of the different materials, including plastics.
To better protect the environment, the European Union requests that Member States take measures for the treatment of their waste, which must be in line with the following hierarchy, listed in order of priority. Member States are currently implementing several legislative measures to reinforce the abovementioned hierarchy, the different levels of which are analyzed below, emphasizing the critical issues regarding plastics mechanical recycling:
• Prevention: measures taken before a substance, material or product has become waste; • Preparing for reuse: any operation through which products or components that do not
constitute a waste are used again for the same purpose for which they were initially created; • Recycling: any recovery operation through which waste materials are re processed into
products, materials or substances for their original or other purposes; • Other recovery, energy recovery: any operation, the principal result of which is waste that
serves a useful purpose; • Disposal: any operation which does not constitute recovery, even when the operation a
secondary result the reclamation of substances or energy.
The growing use of plastics in agriculture provides to the farmers increased yields, earlier harvests, less reliance on herbicides and pesticides, better protection of food products and more efficient water conservation. However, this generates ever increasing amounts of plastic waste in rural areas or in areas of high concentration of agricultural activities that can impede the sustainability of the agricultural development. Besides, agricultural plastic materials if mismanaged cause serious environmental problems as they are burned in the fields or buried in the soil or disposed in the open field causing pollution of ground waters and irreversible contamination of soils and health safety problems to the consumers. In addition, these illegal practices result in the waste of valuable oil based plastic materials.
5
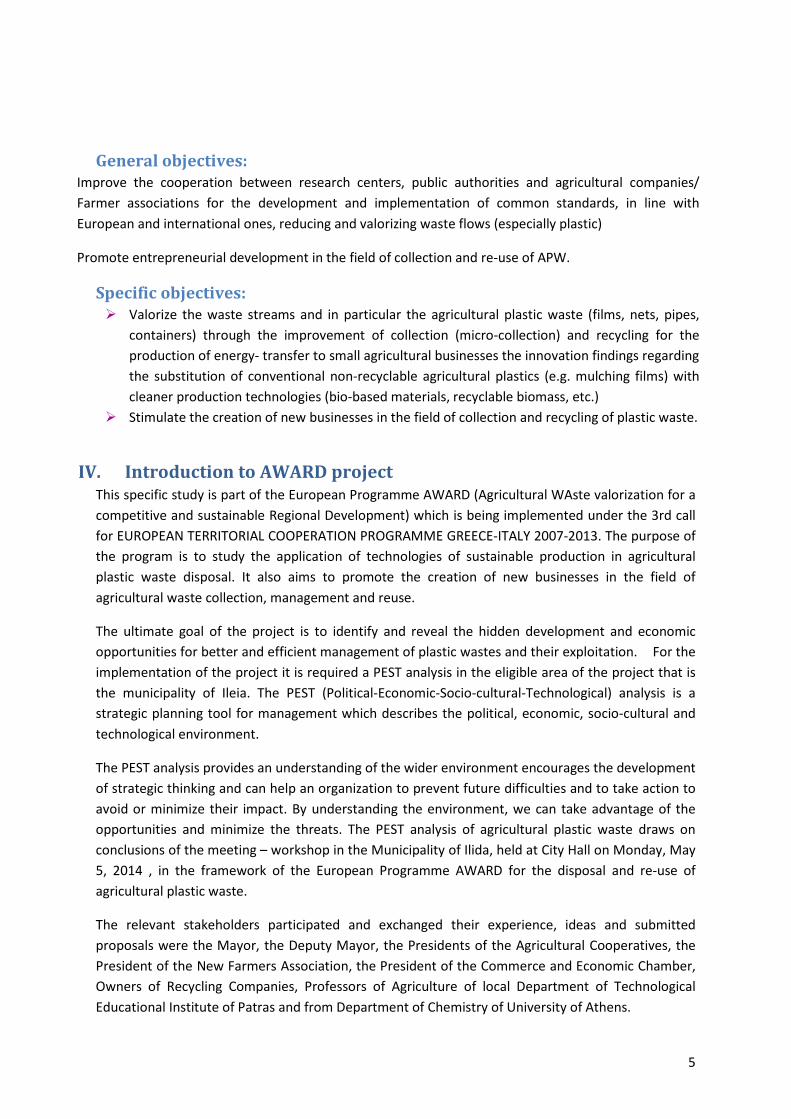
General objectives: Improve the cooperation between research centers, public authorities and agricultural companies/ Farmer associations for the development and implementation of common standards, in line with European and international ones, reducing and valorizing waste flows (especially plastic)
Promote entrepreneurial development in the field of collection and re-use of APW.
Specific objectives: Valorize the waste streams and in particular the agricultural plastic waste (films, nets, pipes,
containers) through the improvement of collection (micro-collection) and recycling for the production of energy- transfer to small agricultural businesses the innovation findings regarding the substitution of conventional non-recyclable agricultural plastics (e.g. mulching films) with cleaner production technologies (bio-based materials, recyclable biomass, etc.)
Stimulate the creation of new businesses in the field of collection and recycling of plastic waste.
IV. Introduction to AWARD project This specific study is part of the European Programme AWARD (Agricultural WAste valorization for a competitive and sustainable Regional Development) which is being implemented under the 3rd call for EUROPEAN TERRITORIAL COOPERATION PROGRAMME GREECE-ITALY 2007-2013. The purpose of the program is to study the application of technologies of sustainable production in agricultural plastic waste disposal. It also aims to promote the creation of new businesses in the field of agricultural waste collection, management and reuse.
The ultimate goal of the project is to identify and reveal the hidden development and economic opportunities for better and efficient management of plastic wastes and their exploitation. For the implementation of the project it is required a PEST analysis in the eligible area of the project that is the municipality of Ileia. The PEST (Political-Economic-Socio-cultural-Technological) analysis is a strategic planning tool for management which describes the political, economic, socio-cultural and technological environment.
The PEST analysis provides an understanding of the wider environment encourages the development of strategic thinking and can help an organization to prevent future difficulties and to take action to avoid or minimize their impact. By understanding the environment, we can take advantage of the opportunities and minimize the threats. The PEST analysis of agricultural plastic waste draws on conclusions of the meeting – workshop in the Municipality of Ilida, held at City Hall on Monday, May 5, 2014 , in the framework of the European Programme AWARD for the disposal and re-use of agricultural plastic waste.
The relevant stakeholders participated and exchanged their experience, ideas and submitted proposals were the Mayor, the Deputy Mayor, the Presidents of the Agricultural Cooperatives, the President of the New Farmers Association, the President of the Commerce and Economic Chamber, Owners of Recycling Companies, Professors of Agriculture of local Department of Technological Educational Institute of Patras and from Department of Chemistry of University of Athens.
6
The meeting-workshop reached at common conclusions incorporated in a declaration regarding the establishment of an efficient and effective of an integrated management scheme and utilization of Agricultural Plastic Waste (Label agriwaste). According to this declaration, the integrated management scheme constitutes the prerequisite for an integrated solution of the problem leading to the health and environment protection and to the economic development of the Municipality of Ilida.
a) Objectives and Background of the project
The project stems from the observation of the massive use of plastic materials in agriculture, whose disposal is a high cost for companies, besides being a serious environmental problem.
General aim of the project is therefore to contribute to enhance competitiveness of the agricultural companies of the eligible regions, by reducing the costs of collection and disposal of plastic wastes and actually even making value of them through re-use and energy production. Particularly, specific objectives are:
• to introduce the use of technologies (web based GIS) in the collection and harmonization of data, information and intervention strategies at the trans-national scale on Agricultural Plastic Waste (APW) production and disposal
• to promote the application of European and international standards in public policies and to develop common local plans and procedures to reduce waste flows (especially plastics), through the cooperation between research centers, public authorities and small agricultural companies;
• to test the procedures of collection commonly developed through the implementation of a temporary pilot station of disposal, cleaning and re-use
• to transfer to small agricultural businesses the innovation and technological findings regarding on the one hand the substitution of conventional non-recyclable agricultural plastics with cleaner technologies and on the other hand the optimization of the management cycle of waste, so reducing costs due to bureaucratic and organizational burden
• to raise awareness of farmers on the possibility of making value of the plastic waste stream, through recycling or energy recovery processes, so not endangering the environmental stability in the region
• to stimulate the creation of new small businesses in the field of collection and recycling of plastic waste, an economic sector nowadays limitedly exploited
• to promote the mainstreaming of results in regional and national policies through activities of communication and awareness raising
7
V. Important considerations This is very important to note the fact that this Feasibility Study is a research tool which is enabling the development of a conclusive model for APW management, containing propositions and options to draft innovative strategies, fitting to the special needs and to justify the political priorities of the focus area: Ilida Municipality. This tool must comply with the spirit of:
GREEN PAPER of European Committee “On a European Strategy on Plastic Waste in the Environment” Brussels, 7.3.2013,
The EU Environmental protection Laws, Directives and Joint Ministerial Decisions (JMDs),1 National Laws, Human and Environmental safety rules, The Guidelines of A.W.A.R.D. Project.
a) Methodology of the Research
During the implementation of this current study in the framework of A.W.A.R.D. project, the following methodological approach has been adopted, aiming to a comprehensive understanding of Agricultural plastic waste management. The methodology consists of:
Statistical Data Collection & interviews / public consultation, P.E.S.T Analysis, S.W.O.T Analysis, WEB GIS development.
Research value This Feasibility Study presents a major research value due to the multiple dimensions that are being studied:
Financial Feasibility. Technical Feasibility. Legal Feasibility. Geomorphological particularities. Agricultural Production volumes. Refined APW output & market distribution. Social and Environmental sustainability. International experience & best practices.
Principles and core orientation milestones According to the EU Directives as well as the Guidelines of the Project, this study must be obligatory oriented according to the following principles regarding the Political determination and Scientific Documentation that is so far provided and considered being standardized and compulsory:
1 Extensive presentation will be presented further bellow.
8
Prevention Reuse of APW Zero tolerance on APW burning Disposal of zero APW in landfills No APW buried in the fields No APW uncontrolled discharge Energy recovery
VI. Political Analysis Regarding the existing legal framework for waste management, the new framework Law 4042/2012 (GG Α΄ 24/2012) on waste management, transposes the Waste Framework Directive 98/2008/EC and the Directive 99/2008/EC. Articles 2 to 9 harmonize the national law with the provisions of Directive 2008/99/EC concerning the protection of the environment through criminal law and foresee sanctions for cases causing or likely to cause pollution or degradation of the environment. 2
Articles 10 to 48 of Law 4042/2012 harmonize national law with the provisions of Directive 2008/98/EC concerning waste and the repealing of certain Directives. The mentioned Articles establish measures to protect the environment and human health by preventing or reducing the adverse impacts of waste production and waste management and reducing the overall impact of the use of resources.
The adoption of Law 4042/2012, combined with Law 3854/2010 (GG A’ 94/2010), relating to alternative management of specific waste streams, provides a comprehensive legal framework for waste management. Further, the existing legal framework is based on the Joint Ministerial Decision (JMD) 50910/2727/2003 (GG B’ 1909/2003) “Measures and Conditions for Solid Waste Management - National and Regional Planning Management in compliance with the provisions of the Directive 91/156/EEC”. This JMD sets the objectives and principles of management of solid waste, including the requirements of the national and the regional plans for integrated waste management.
Furthermore, the JMD foresees the responsible bodies for managing solid waste (FoSDA) and the measures for the rehabilitation and use of disposal sites.3 Article 5, par. 1 defines the guidelines for the management of solid waste throughout the country and suggests appropriate the measures which promote (under d.) the use of waste as an energy source. Article 11 provides the obligations of the waste holders in accordance to Law 2939/2001 (GG A’ 179/2001).
The regulatory framework for the waste management since 01.07.2011 is set in the reforming Law for the administrative restructuring 3852/10 (GG A’ 87/2010) as follows: The Municipalities manage the urban waste (art. 94, nr. 25) in accordance to the regional Plan of the Prefecture (art. 186, nr.29) which is scheduled according to JMD 50910/2003. The above framework foresees the founding of union societies consisting of Municipalities within a Prefecture through a Presidential Decision (PD),
2 Source Waste Framework Directive 98/2008/EC and the Directive 99/2008/EC. Articles 2 to 9 3 Source Law 2939/2001 (GG A’ 179/2001).
9
which will automatically take over all responsibilities from the member Municipalities. The region of Western Greece is divided in three sub-regions. Aetoloacarnania, Achaia and Ileia. Head of the Region is elected directly by the population as well the regional Council. An elected vice Governor is responsible for each Sub-Region. Ilida Municipality is the second biggest City of Sub Region Ileia.
Regarding the main issue of this analysis4, the waste treatment is regulated at EU level by Directive 75/442/EEC of 15 July 1975 on waste. According to Article 4 of the Directive, Member States must ensure that the disposal or recovery of waste will be implemented without endangering human health or the environment and without using processes or methods which could harm the environment. There is a common belief that the burning of waste in open spaces is incompatible with this obligation. All installations in which recovery or disposal operations are being carried out must obtain a permit and be subject to examination and control by the competent authorities.
Furthermore, there is specific EU legislation on the issue of waste incineration, which is imposed by the Directive 2000/76/EC of the European Parliament and of the Council of 4 December 2000 on the incineration of waste. This directive establishes operational controls, emission limits and monitoring requirements. Directive 2000/76/E, however, covers only the controlled incineration or co-incineration plants, i.e. fixed or mobile technical units and equipment. It is impossible, therefore, to be applied in the burning of waste in open areas, for example in agricultural fields. The uncontrolled burning of polyvinyl chloride (PVC) or other plastics outdoors may cause significant pollution and should not be undertaken. In contrast, controlled incineration of plastic waste5 in suitable incineration units is a harmless solution, consistent with the requirements of Directive 2000/76/EC.
The Directive 2006/12/EC sets a new context to the concept of pre-processing the waste generated as a necessity, for its t use as raw material that will enter the production process for the production of a new product, or as a resource for energy production. It also sets out the procedures required for the licensing of processing units for the recovery of the waste.
When information regarding illegal waste management practices will be delivered to the Commission, then the Commission may initiate infringement proceedings in front of the European Court. If the Court decides that a Member State has failed to fulfill its obligations, the Member State will be required to take the necessary measures to comply with the judgment, in accordance with Article 228 of the EC Treaty. Otherwise, the member state may be imposed heavy fines.
The proper implementation of the above legislation and also of the Directive 1999/31/EC of 26 April 1999 that lays down strict requirements for the landfilling of waste would ensure a high level of environmental protection in the Member States. On the other hand, it is necessary to introduce other legislation to reduce illegal waste disposal, such as burning outdoors. Under EU waste legislation, regional administrations can take responsibility for the collection and disposal of waste. At the same time, however, Member States should take into account the principle of 'polluter pays' that is contained in Article 15 of Directive 75/442/EEC about waste, whereby the cost of waste 4 Source 75/442/EEC of 15 July 1975 on waste 5 of Directive 2000/76/EC
10
disposal lies with the owner, the previous holder or producer of such waste. In the policy sector regarding agriculture plastic waste, which is the interest of this project, currently there is not specific EU legislation. After extensive desk work, it was decided for the project implementation team to go in the eligible area and talk directly with stakeholders in order to form a more comprehensive view.
The overall situation in what concerns the plastic waste management in the eligible area is ambiguous. Although there is, on the part of the Ministry of the Environment, relative information about the pros and cons of all possible modes of agricultural waste management, it is clear that it lies to the wishes of the farmers that will operate them. The solution of burning big amount of waste, has been banned, nevertheless it continues to be the simplest solution for farmers. According to the law there are several principles governing environmental legislation. The main principle refers to the responsibility of the producer and the “polluter pays” principle.
Farmers were not aware of impositions on their site of these principles. Many farmers and members of agricultural cooperatives support the fact that it depends on them to manage the agricultural plastic waste since they have no cooperation with the respective authorities. In areas where farmers belong to cooperatives that showed interest in Environmental Law enforcement, farmers indicated that they knew quite well the impact on the environment by burning and burying the waste. On the contrary there were several farmers who claimed lack of knowledge on the subject and tried to throw the blame on the side of the State. But the fact that some farmers declared themselves happy with the level of communication with the Municipalities and the Agricultural Cooperatives shows us that the interest identified by both farmers and Local Authorities is the main factor affecting the existence or absence of good and continuous information of farmers. Farmers in the eligible area stated that their only interest is that at the end of the cultivation period the plastic waste can be easily and quickly removed from the area.
They were not aware of the existence of State subsidies or any kind of facilities if they adopt good practices in the collection process of agricultural plastic waste. Farmers’ opinion was not negative in what concerns the possibility to gather the plastic waste, but only in a broader context because till recently they chose to burn plastic wastes as they had not something to gain if they collected it or used another solution.
“Kallikratis" law made substantial changes in the administrative structure of the country, now divided into the following major decentralized administrations: Attica, Thessaly and Central Greece, Epirus and Western Macedonia, Aegean Islands, Crete, Central - Eastern Macedonia and Thrace, Peloponnese, Ionian Islands and Western Greece. Head is a General Secretary appointed by the central government, assisted by an Advisory Board, composed of representatives of regional governments and municipalities. These authorities operate as decentralized authorities of the central government and are composed by two or three regions (excluding Athens and Crete). Regional disparities regarding economic development are determined by the population, the level of urbanization, geographic location and the availability of transport infrastructure. In 2007, for example, differences in per capita GDP (PPS) varied between 14,900 euros and 31,900 euros,
11
depending on the respective region, while the unemployment rate showed differentiation between 5,3% and 12,7%.
Greece established a National Waste Management Plan (ESDA), issued and in force since 12.22.2003. The National Solid Waste Management Planning (JMD 50910/2727/2003) refers to all types of waste (urban and non-urban, hazardous and industrial waste) across the country. Any project must be provided from ESDA in order to be implemented. At the moment an updated ESDA is in the phase of development.
a) Waste Plastic Targeted EU Policy Framework
The management of plastic waste cuts across a number of policy fields: not only the sustainable management of resources but also climate change, energy, biodiversity, habitat protection, agriculture and soil protection. This section provides an overview of existing EU measures to reduce the environmental impacts of plastic waste.
Note that regulations are not usually targeted specifically at plastic waste, let alone specific types of plastic. This limits the incentive to divert plastic waste when, for example, other elements of the waste stream such as paper or glass will meet weight-based targets far more easily and quickly.
National Waste Management Plan ESDA "Convert waste into resources, promoting the concept of circular economy in practice" The Deputy Minister for Productive Reconstruction, Environment and Energy Ioannis Tsironis announce the completion of the revision of the National Waste Management Plan (ESDA). ESDA has been posted on the Ministry website www.ypeka.gr (ENVIRONMENT section, subsection WASTE MANAGEMENT), which is also suspended and the National Strategic Plan for Prevention of Waste Generation, an integral element of the new Planning.
"It's an ambitious design, which marks the reversal of the policies followed so far of the governments of the last 10 years at least and leads to an economy and a society with zero waste. A society that will convert waste into resources, promoting the concept of Circular Economy in practice, "said the Deputy Minister". The harmonization with the European legislation and building -and in some cases exceeded the most positive elements of the acquis, together with the secured financing of all necessary infrastructure and activities are the first step in the transition from medieval type uncontrolled discharge of waste into the modern concept of recovery in an environmentally friendly way and the society, " he noted.
The Convention, which was formed jointly with the Ministry of Interior and Administrative Reconstruction, encapsulates the radically different political conception of the new governance in an alternative waste management model, modern and environmentally friendly, with priorities decentralization of activities at municipal level which The role is upgraded, the qualitative and quantitative enhancement of recycling with emphasis on separation at source, separate collection and treatment of the organic fraction, the small scale of processing and recovery plants, to encourage social participation, and especially to safeguard the public character of waste
12
management. The objectives of ESDA fully adopt the methodology of the hierarchy of waste management of national and Community legislation, beyond the logic of centralized management units of mixed municipal waste, for the separate collection of recyclable and bio-waste and the reduction of waste production and management costs.
Based on the above framework, the national waste policy is geared to the following objectives landmark 2020: waste generated per capita have fallen dramatically, preparation for re-use and recycling by separate collection of recyclable - biowaste applicable 50 % of all municipal solid waste, energy recovery be a complementary form of management when they have run out of room for any other kind of recovery and landfilling being the last option and is limited to less than 30% of all municipal solid Waste. ESDA includes management and other waste streams such as industrial waste, agricultural plastic, the sludge of wastewater treatment plants.
Planning of the Ministry Adoption of Special National Hazardous Waste Management Plan, whose preparation is completed and will soon enter into public consultation the Environmental Impact Study Strategy.
Adaptation of the Regional Waste Management Plans in targeting and guidance of the revised national planning as September 30th.
Configure laws and regulations, and implementation of the Convention, including measures to facilitate the siting mild waste management infrastructure.
Diversity initiatives by the ESDA and dialogue involving both Professional, Scientific and social actors and Local Authorities to facilitate the updating of the PESDA.
Actions technical and administrative support of the municipalities and their agencies, in cooperation with the Ministry of Interior, for training until September 15 of the Local Municipal Plans and their implementation then efficiently and effectively.
Financing of actions and infrastructure of Local Municipal Plans and related projects of the PESDA, through the ESDA and other Community and national programs, in cooperation with the Ministry of Economy, Shipping and Tourism.
Awareness, participation and ultimately mobilization of civil society is an effective driving force and a prerequisite for success of the new Planning.
Waste Framework Directive, 2008/98/EC The Waste Framework Directive (WFD), revised in 2008, aims to protect human health and the environment against harmful effects caused by the collection, transport, treatment, storage and landfilling of waste.
The Directive:
sets new recycling targets to be achieved by EU Member States by 2020, including recycling rates of 50% by weight for household and similar wastes and 70% for construction and demolition waste;
13
strengthens provisions on waste prevention through an obligation on Member States to develop national waste prevention programs and a commitment from the EC to report on prevention and set waste prevention objectives;
sets a clear, five-step “hierarchy” of waste management options; prevention is the preferred option, followed by reuse, recycling and other forms of recovery – with safe disposal as a last resort;
Clarifies a number of important definitions, such as recycling, recovery and waste itself. In particular, it draws a line between waste and by-products. Through the concept of End-of-Waste, it also defines criteria to indicate when waste has been recovered enough – through recycling or other treatment – to become a non-waste (e.g. secondary material, by-product and product). Furthermore, the criteria will include limit values for pollutants where necessary and take into account any possible adverse environmental effects of the substance or object.
Plastics typically make up a large proportion of the waste streams covered by the Directive so the revision is likely to have a significant impact.
Landfill Directive, 1999/31/EC Directive 1999/31/EC of 26 April 1999, the Landfill Directive, on the landfill of waste has set a combination of intermediate and long-term targets for the phased reduction of biodegradable waste going to landfill, and banned the disposal to landfill of certain materials (e.g. infectious hospital and other clinical wastes). It also requires the pre-treatment of wastes going to landfill (which can include sorting).
The Directive will therefore have an influence on the disposal of biodegradable plastics. Possible future increases in use of this material, for example in food packaging, may create difficulties in meeting the biodegradable waste to landfill targets.
The requirement for treatment or sorting of waste may boost recycling of plastics, as this can be a crucial but costly stage in the process of plastic recycling – mandating sorting of waste could therefore increase recycling levels by providing greater volumes of treated and sorted plastics.
Packaging and Packaging Waste Directive, 94/62/EC Directive 94/62/EC on Packaging and Packaging Waste covers all packaging placed on the market in the Community and all packaging waste, and requires the return and/or collection of used packaging in order to meet targets for the recovery and recycling of this material. This includes plastic packaging and plastic packaging waste. By no later than 31 December 2008, a target of 22.5% for the return and/or collection of plastic materials contained in packaging were to be attained.5
Although the target dates have passed, amendment 2005/20/EC set different target deadlines until the end of 2012 for ten Member States (the Czech Republic, Estonia, Cyprus, Latvia, Lithuania, Hungary, Malta, Poland, Slovenia and Slovakia).
14
Commission Decision 1999/177/EC established a derogation for plastic crates and plastic pallets in relation to the heavy metal concentration levels established in the Directive on Packaging and Packaging Waste. In 2009, the Commission extended the derogation.
Registration, Evaluation, Authorization and restriction of Chemicals (REACH), 1907/2006/E REACH aims to lower levels of pollution and increase safety levels in relation to the use of hazardous chemicals. Recycled plastics are affected as it requires recycling firms to provide information on the types of chemicals included in their recycled plastics. Furthermore, the Regulation requires recycled plastics producers to register chemicals in the European Chemicals Agency database.
Waste Electrical and Electronic Equipment Directive, 2002/96/EC Electrical and electronic equipment (EEE) being an important source of waste plastic, Directive 2002/96/EC on Waste Electrical and Electronic Equipment has some important implications for plastics recycling. The Directive sets out certain design requirements, the result of which could be a gradual reduction in the variety of plastic components in EEE products. The legislation increases the emphasis on the recyclability of EEE product components, though costs and economic feasibility remain barriers to its success.
End-of-Life Vehicles Directive, 2000/53/EC Vehicles form a small but significant part of the plastic waste stream. Directive 2000/53/EC, the End-of-Life Vehicles (ELV) Directive, sets out targets aiming to reduce the amount of waste from vehicles when they reach the end-of-life stage. One such target is that by 1 January 2015, reuse and recovery of vehicle material (including plastics) must be increased to a minimum of 85%. However, plastic parts in vehicles do not at present contribute greatly to targets in the ELV Directive, and rates of recycling for ELV plastics are relatively low.10
Ecodesign Directive, 2005/32/EC, 2009/125/EC The Ecodesign Directive is one of the important building blocks of the Sustainable Consumption and Production and Sustainable Industrial Policy Action Plan of the European Commission. Ecodesign Directive is a product-based policy tool that seeks to integrate environmental aspects in the design phase of products with the aim of improving their environmental performance throughout the product’s life cycle. Requirements regarding the ecodesign of products can contribute to sustainable production by substituting the worst-performing products on the market and shifting the economy towards solutions with least life-cycle costs.
The Ecodesign Directive covers all the environmental impacts caused by products during any phase of the life cycle. In all Ecodesign preparatory studies, a life-cycle assessment of typical products is carried out and impacts are calculated for 13 environmental indicators (emissions to air, to water, resource consumption, waste generation, etc.). The use of plastics in a product can have a significant effect on several of these indicators.
Other environmental issues with relevance to plastic waste, such as natural resource consumption, have been highlighted as key aspects in environmental policy development in the EU in recent years.
15
For example, the 6th Environmental Action Programme introduced the concept of Thematic Strategies, covering several fields such as air, soils, natural resources, or waste prevention and recycling. The Ecodesign Directive is a horizontal tool with a wide scope that makes possible to address issues on all those subjects. For the development of the new working plan of the Ecodesign Directive, material efficiency (including in relation to plastics) and other environmental aspects will be just as important as energy efficiency.
Plastic materials and articles intended to come into contact with food Directive
Directive 2002/72/EC, relating to plastic materials and articles intended to come into contact with food, establishes a list of monomers and other substances, such as additives, that are permitted for use in the manufacture of food packaging. It also amends existing restrictions, in particular related to epoxidised soybean oil (ESBO) migration in PVC gaskets used to seal glass jars containing foods for infants and young children.
Lead Market Initiative DG Enterprise and Industry has initiated a policy to drive six lead markets,12 bringing together the European Commission, Member States and industry. Of particular interest from a plastics perspective are the bio-based products and recycling markets. The programme develops policy initiatives under four broad themes:
standardization, labelling and certification; legislation; public procurement; Complementary actions.
Bio-plastics are included in the bio-based products program and this involves proposals, amongst others, to apply the EU Eco-label to products with a minimum level of bio-based content, map bio-refinery facilities and fund research through FP7 calls. The recycling program aims to, for example, support the implementation of the WFD, stimulate demand for recycled products through public procurement, set up eco-innovation projects to develop new recycling techniques and support best practice networks.
Regulation on shipments of waste, (EC) 1013/2006 This Regulation aims to prevent the illegal shipment of waste. Under Article 59, checks can be carried out on waste shipments or on related recovery or disposal.
The rationale for the review of the waste shipment Regulations in 2006 was the implementation of various changes in the UNEP Basel convention on transboundary movements of waste. According to the Regulation’s provisions, two types of procedures can apply in cases where transboundary shipments are allowed: 13 the so-called “green list” and the notification procedure. When waste falls within the scope of the green list, transboundary shipments are facilitated.
16
Plastic waste is generally on the green list, 14 except when unsorted, dirty or contaminated. Nevertheless, main destination countries such as China and India have considerably reinforced their control procedures.
National authorities contacted for the purposes of study responded that they do not possess statistics on plastics waste shipments since this material is green-listed and does not require notification to the authorities.
Thematic Strategy on the Prevention and Recycling of Waste The European Commission Communication of 21 December 2005 describes the Thematic Strategy on the Prevention and Recycling of Waste, which sets out guidelines for EU action and describes the ways in which waste management can be improved. The aim of the strategy is to reduce the negative impact on the environment caused by waste throughout its lifespan. This overall strategy encompasses many of the legislative developments discussed above.
The main focus of the strategy for preventing waste production is on reducing the environmental impact of waste and products that will become waste. In order to be effective, this impact must be reduced at every stage of a resource’s lifespan. The strategy places particular emphasis on biodegradable waste, two-thirds of which must be redirected to be disposed of using methods other than landfill as is required under the Landfill Directive, 1999/31/EC.
Remaining issues related to plastics include the potential to increase the use of plastic waste as a resource and reduce the need for virgin resources (landfilling of plastics increased by 22% between 1990 and 2002 despite increased recycling). However, there may be limited net environmental advantage to recycling some mixed/contaminated plastic waste for non-technical applications when it replaces a less polluting feedstock such as wood.
Work is currently ongoing to review the strategy and a parallel study to this one is examining this in detail. That study in particular aims to make an assessment regarding the impact to date of the Thematic Strategy towards the key objectives to increase recycling and reuse; to improve disposal; and to prevent waste.
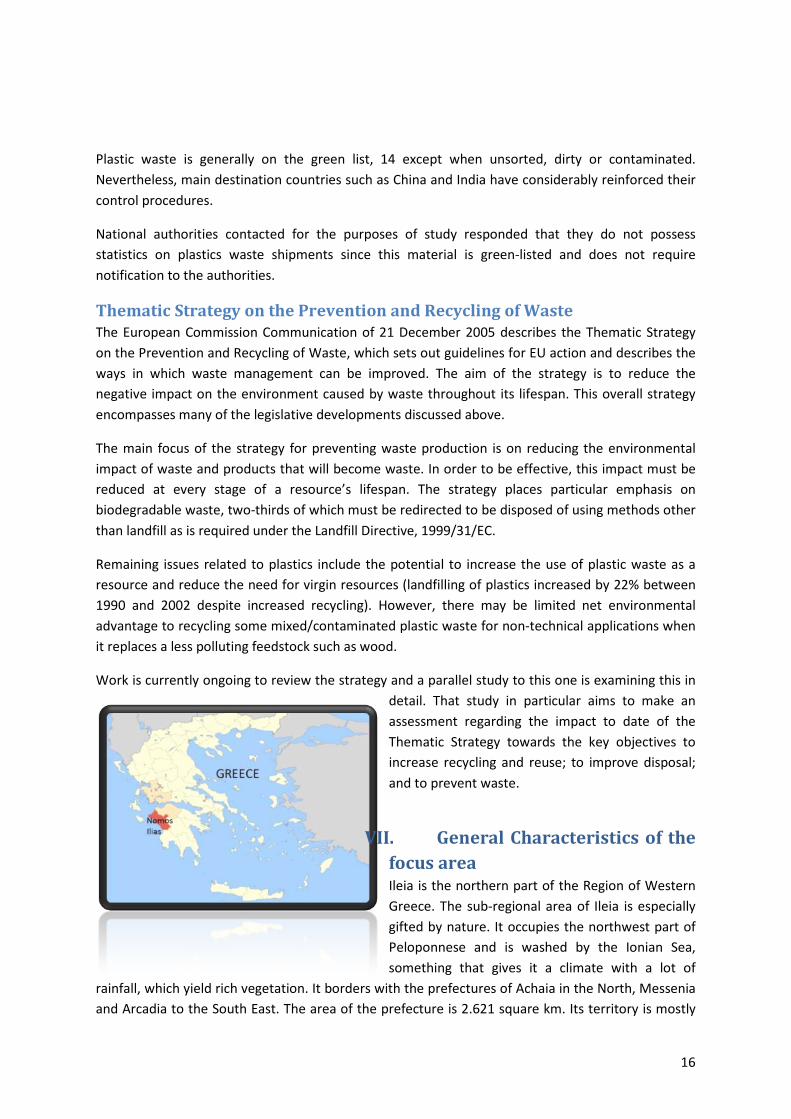
VII. General Characteristics of the focus area Ileia is the northern part of the Region of Western Greece. The sub-regional area of Ileia is especially gifted by nature. It occupies the northwest part of Peloponnese and is washed by the Ionian Sea, something that gives it a climate with a lot of
rainfall, which yield rich vegetation. It borders with the prefectures of Achaia in the North, Messenia and Arcadia to the South East. The area of the prefecture is 2.621 square km. Its territory is mostly
17
flat. The total population of the County is 193.288 inhabitants representing 1.71% of the total population of the country. The large urban center of the prefecture is the Municipality of Pyrgos (Tower) that gathers administrative and other services. Other important cities of the prefecture are Amaliada, Gastouni, Krestena and Zacharo, Olympia. Main rivers of Ilia spends are Alfeios River and Pinios, while the main mountains are Erymanthos, Minthi and Foloi. The geomorphology of the soil is determined by Plains forming the plain of Ileia, the largest of Peloponnese, while mountains are situated in the area of Olympia. The biggest mountains are situated in the borders with Arcadia. Erymanthos Mountain has its highest peak in Ilia, the Lampia (1,797 m) and Skiadovouni. Further south one can find Foloi, Lapithas and Minthi.
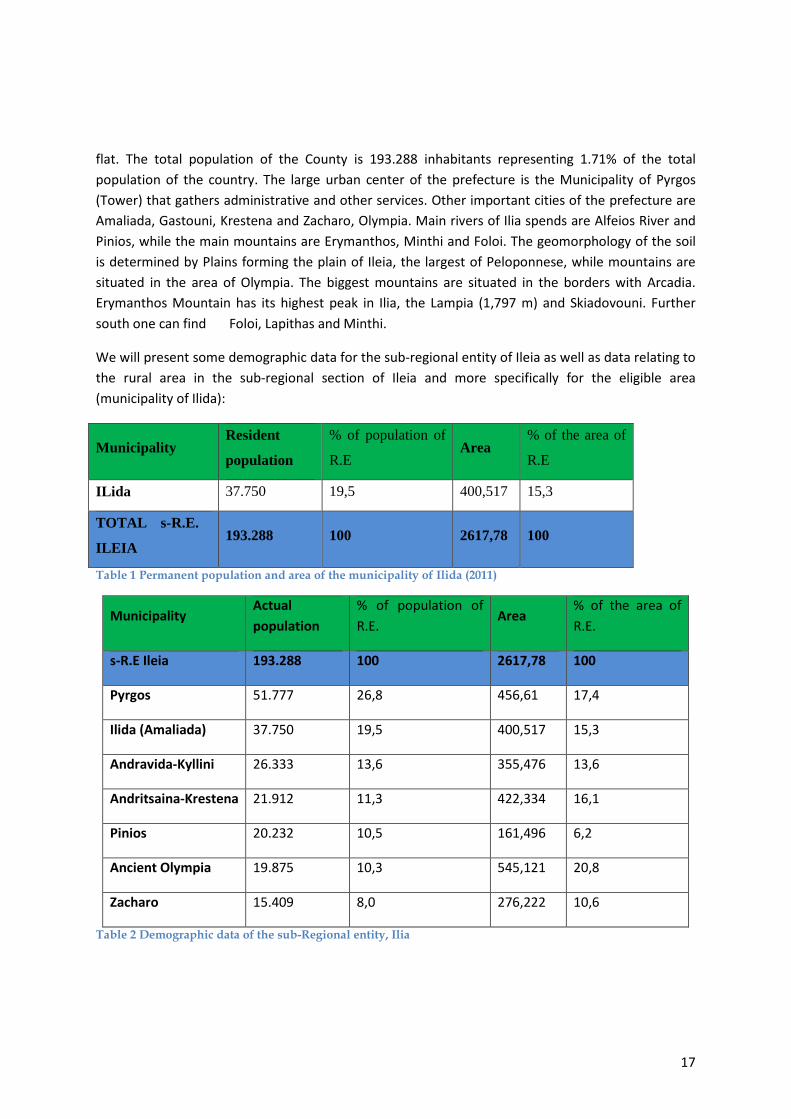
We will present some demographic data for the sub-regional entity of Ileia as well as data relating to the rural area in the sub-regional section of Ileia and more specifically for the eligible area (municipality of Ilida):
Municipality Resident
population
% of population of
R.E Area
% of the area of
R.E
ILida 37.750 19,5 400,517 15,3
TOTAL s-R.E.
ILEIA 193.288 100 2617,78 100
Table 1 Permanent population and area of the municipality of Ilida (2011)
Municipality Actual population
% of population of R.E.
Area % of the area of R.E.
s-R.E Ileia 193.288 100 2617,78 100
Pyrgos 51.777 26,8 456,61 17,4
Ilida (Amaliada) 37.750 19,5 400,517 15,3
Andravida-Kyllini 26.333 13,6 355,476 13,6
Andritsaina-Krestena 21.912 11,3 422,334 16,1
Pinios 20.232 10,5 161,496 6,2
Ancient Olympia 19.875 10,3 545,121 20,8
Zacharo 15.409 8,0 276,222 10,6
Table 2 Demographic data of the sub-Regional entity, Ilia
18
a) Uses of Plastic on the Farm
Uses of plastics and polymers in agriculture include mulch films, greenhouse covering, floating and hoop-supported crop covers, netting for turfgrass production and bird screens, netting and sprayed materials for erosion control, pots and trays, stakes and labels, irrigation systems, soil amendments, antitranspirants, cordage, and bale wraps or silage bags. In addition, many products purchased for use on the farm, including pesticides and fertilizers, come in plastic containers. The greatest use nationally and the greatest geographical concentrations occur with the polyethylene-based mulch and greenhouse films.
a) Ilida Municipality
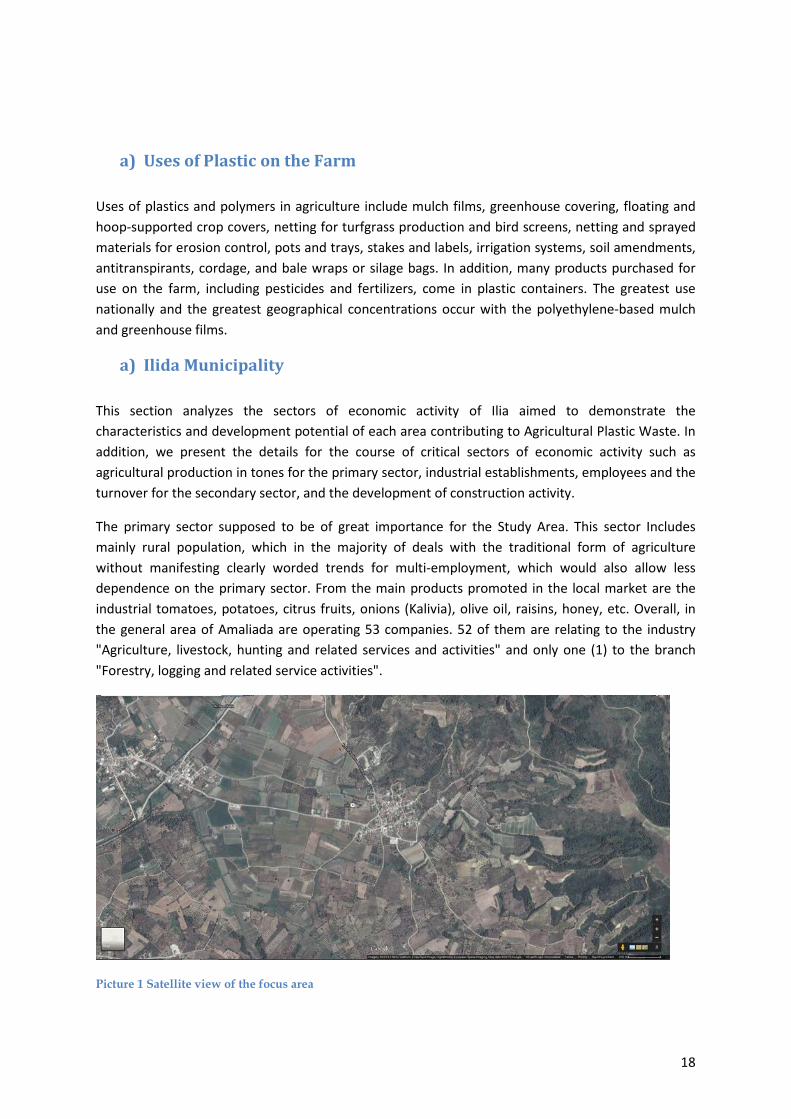
This section analyzes the sectors of economic activity of Ilia aimed to demonstrate the characteristics and development potential of each area contributing to Agricultural Plastic Waste. In addition, we present the details for the course of critical sectors of economic activity such as agricultural production in tones for the primary sector, industrial establishments, employees and the turnover for the secondary sector, and the development of construction activity.
The primary sector supposed to be of great importance for the Study Area. This sector Includes mainly rural population, which in the majority of deals with the traditional form of agriculture without manifesting clearly worded trends for multi-employment, which would also allow less dependence on the primary sector. From the main products promoted in the local market are the industrial tomatoes, potatoes, citrus fruits, onions (Kalivia), olive oil, raisins, honey, etc. Overall, in the general area of Amaliada are operating 53 companies. 52 of them are relating to the industry "Agriculture, livestock, hunting and related services and activities" and only one (1) to the branch "Forestry, logging and related service activities".
Picture 1 Satellite view of the focus area
19
As it is apparent from the data of ELSTAT, in the focus area agricultural land estimated in a percentage of 65%. The land of Amaliada imbedded in the consolidation and irrigated by sprinkling network is 36.980 hectares. As regards the areas in consolidation and are irrigated by surface irrigation, are 17.971 hectares. On the arable land, 47% almost covered by arable crops and relatively high is the proportion occupied by tree crops in a percentage of 18%.
A remarkable percentage occupied by horticultural crops which account for 10% of the total. In all irrigated crops in Amaliada, outweighs the maize crop, industrial tomatoes, citrus, vegetables, melon fields (watermelons, melons), potatoes and beans, while rainfed distinguished cereals, grapevines (for raisin) and olives. It is also highly developed and olive growing. The grown in total 28.961 hectares of olive trees (approximately).
Agriculture in Ilida has been significant improved by modernization and irrigation systems and achieved a degree of restructured crops in recent years. This restructuring of crops resulted in the adoption of dynamic crops demanding water and fertilization, resulting in the wrong management of the water resources of the municipality and pollution of groundwater. Crops are irrigated by Peneus through the eponymous collective irrigation project as well as a significant number of private wells (140 wells Amaliadas patent licenses), exploiting groundwater in the area.
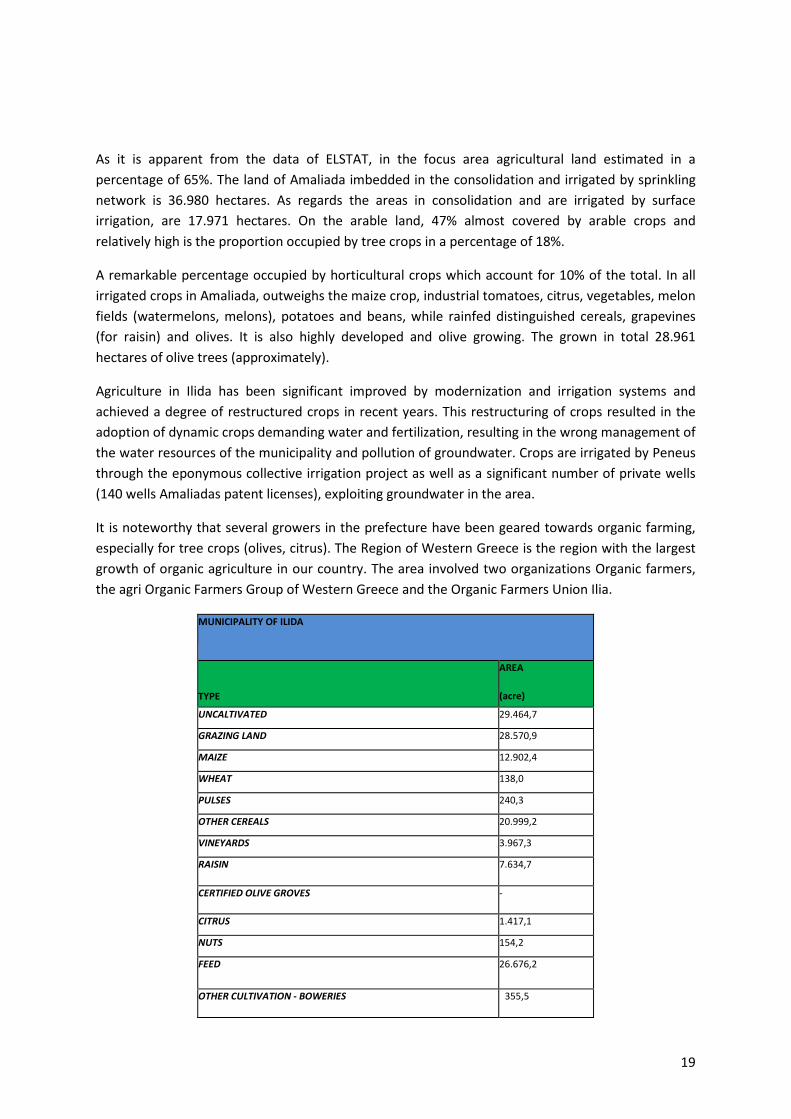
It is noteworthy that several growers in the prefecture have been geared towards organic farming, especially for tree crops (olives, citrus). The Region of Western Greece is the region with the largest growth of organic agriculture in our country. The area involved two organizations Organic farmers, the agri Organic Farmers Group of Western Greece and the Organic Farmers Union Ilia.
MUNICIPALITY OF ILIDA
TYPE
AREA
(acre)
UNCALTIVATED 29.464,7
GRAZING LAND 28.570,9
MAIZE 12.902,4
WHEAT 138,0
PULSES 240,3
OTHER CEREALS 20.999,2
VINEYARDS 3.967,3
RAISIN 7.634,7
CERTIFIED OLIVE GROVES -
CITRUS 1.417,1
NUTS 154,2
FEED 26.676,2
OTHER CULTIVATION - BOWERIES 355,5
20
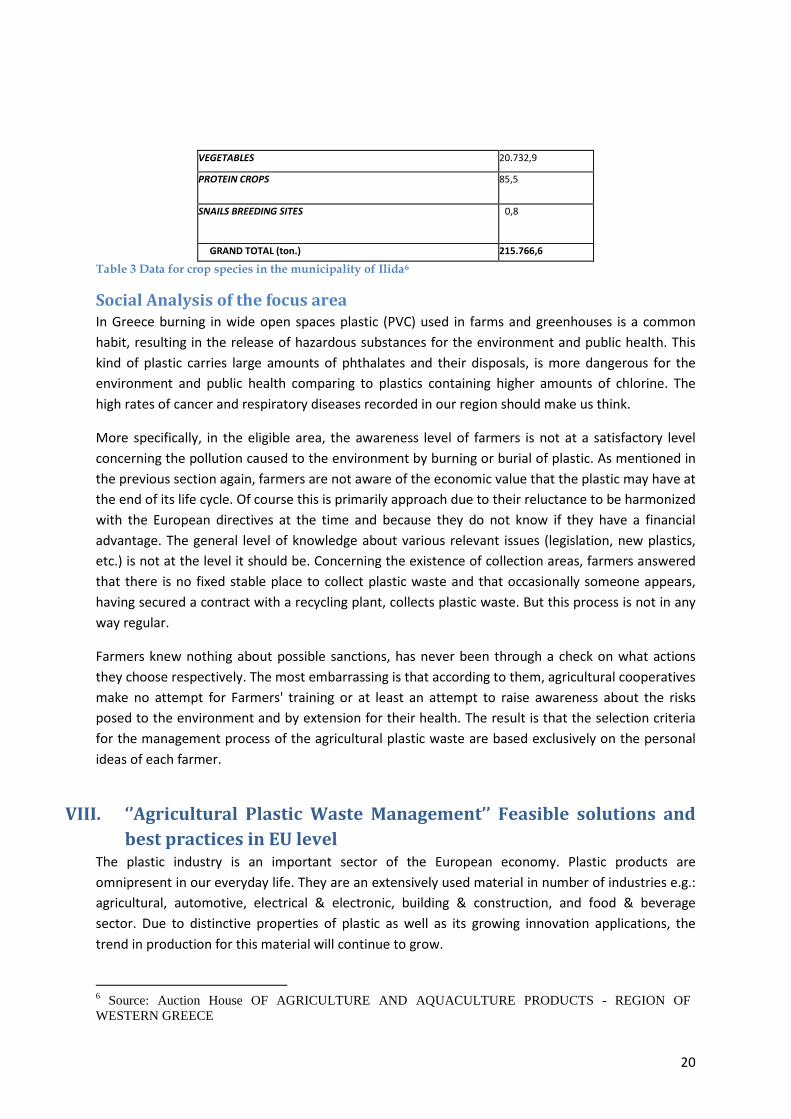
VEGETABLES 20.732,9
PROTEIN CROPS 85,5
SNAILS BREEDING SITES 0,8
GRAND TOTAL (ton.) 215.766,6 Table 3 Data for crop species in the municipality of Ilida6
Social Analysis of the focus area In Greece burning in wide open spaces plastic (PVC) used in farms and greenhouses is a common habit, resulting in the release of hazardous substances for the environment and public health. This kind of plastic carries large amounts of phthalates and their disposals, is more dangerous for the environment and public health comparing to plastics containing higher amounts of chlorine. The high rates of cancer and respiratory diseases recorded in our region should make us think.
More specifically, in the eligible area, the awareness level of farmers is not at a satisfactory level concerning the pollution caused to the environment by burning or burial of plastic. As mentioned in the previous section again, farmers are not aware of the economic value that the plastic may have at the end of its life cycle. Of course this is primarily approach due to their reluctance to be harmonized with the European directives at the time and because they do not know if they have a financial advantage. The general level of knowledge about various relevant issues (legislation, new plastics, etc.) is not at the level it should be. Concerning the existence of collection areas, farmers answered that there is no fixed stable place to collect plastic waste and that occasionally someone appears, having secured a contract with a recycling plant, collects plastic waste. But this process is not in any way regular.
Farmers knew nothing about possible sanctions, has never been through a check on what actions they choose respectively. The most embarrassing is that according to them, agricultural cooperatives make no attempt for Farmers' training or at least an attempt to raise awareness about the risks posed to the environment and by extension for their health. The result is that the selection criteria for the management process of the agricultural plastic waste are based exclusively on the personal ideas of each farmer.
VIII. ‘’Agricultural Plastic Waste Management’’ Feasible solutions and best practices in EU level
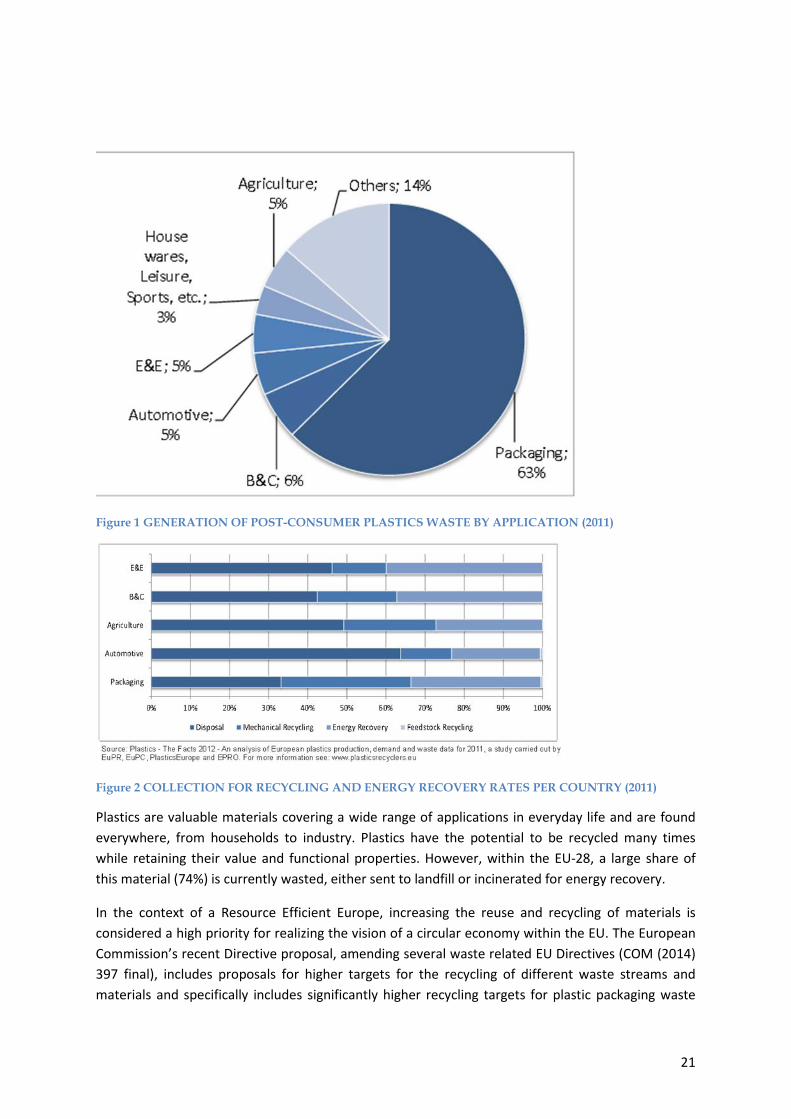
The plastic industry is an important sector of the European economy. Plastic products are omnipresent in our everyday life. They are an extensively used material in number of industries e.g.: agricultural, automotive, electrical & electronic, building & construction, and food & beverage sector. Due to distinctive properties of plastic as well as its growing innovation applications, the trend in production for this material will continue to grow.
6 Source: Auction House OF AGRICULTURE AND AQUACULTURE PRODUCTS - REGION OF WESTERN GREECE
21
Figure 1 GENERATION OF POST-CONSUMER PLASTICS WASTE BY APPLICATION (2011)
Figure 2 COLLECTION FOR RECYCLING AND ENERGY RECOVERY RATES PER COUNTRY (2011)
Plastics are valuable materials covering a wide range of applications in everyday life and are found everywhere, from households to industry. Plastics have the potential to be recycled many times while retaining their value and functional properties. However, within the EU-28, a large share of this material (74%) is currently wasted, either sent to landfill or incinerated for energy recovery.
In the context of a Resource Efficient Europe, increasing the reuse and recycling of materials is considered a high priority for realizing the vision of a circular economy within the EU. The European Commission’s recent Directive proposal, amending several waste related EU Directives (COM (2014) 397 final), includes proposals for higher targets for the recycling of different waste streams and materials and specifically includes significantly higher recycling targets for plastic packaging waste
22
(45% by 2020 and 60% by 2025), as compared to the existing ones. This would require considerable expansion in the recycling of plastic waste in EU-28.
Taking into account the aspirations of the EU to increase recycling, both in quantity and quality, this report aims at highlighting the potential impacts of increased plastic recycling in EU-28 through an environmental, economic and social impacts assessment of recycling projections in 2020 and 2025.
The quantification of increased recycling impacts in EU-28 was enabled by the creation of a plastic waste management flow model, analyzing in detail the potential future waste flows of plastics and the influence of the increased recycling targets within the different waste management options.
In the case of agricultural plastic waste, there are no legally binding targets by EU regulation; however there is a voluntary commitment in place by Agriculture Plastic & Environment (APE) Europe for collecting and recycling 70% of used agricultural plastics films across Europe by 2020. APE Europe is a professional association bringing together companies and organizations involved in agri-plastics. The target of 70% collection for recycling is translated into the recycling output target of 30%, taking into account technical constrains in the recycling of agri-plastics.
This target is considered feasible by PRE and its members, however it is considered necessary that systems for the collection and recycling of agricultural Plastic are needed in all MS. Currently, such systems are only limited to a few EU-28 countries.
A hypothetical increase of this target could take place by 2025, since the economic interest for recycling agricultural plastic might spur the interest for industry voluntary commitments. By 2025, the target for agricultural plastic waste could rise to 35%
a) Uses of Plastic on the Farm
Uses of plastics and polymers in agriculture include mulch films, greenhouse covering, floating and hoop-supported crop covers, netting for turfgrass production and bird screens, netting and sprayed materials for erosion control, pots and trays, stakes and labels, irrigation systems, soil amendments, antitranspirants, cordage, and bale wraps or silage bags. In addition, many products purchased for use on the farm, including pesticides and fertilizers, come in plastic containers. The greatest use nationally and the greatest geographical concentrations occur with the polyethylene-based mulch and greenhouse films.
a) Waste generated
The amount of post-consumer plastic waste generated in 2012 is provided by Plastics Europe’s statistics published in their yearly report (Plastics Europe, 2013). This amount refers to total waste and not specifically to waste categories. In the modelling of the plastics recycling value chain in this study, plastics waste is divided into six different streams: Packaging, WEEE, ELV, Building and Construction, Agricultural and Other plastic waste. For the determination of the waste amount for each category, a percentage breakdown to different sources of plastic was used (BIO et. al, 2011), as
23
presented in Table 3. Similar percentages in the proportion of post-consumer plastic waste can be found in other sources as well (OECD, 2010).
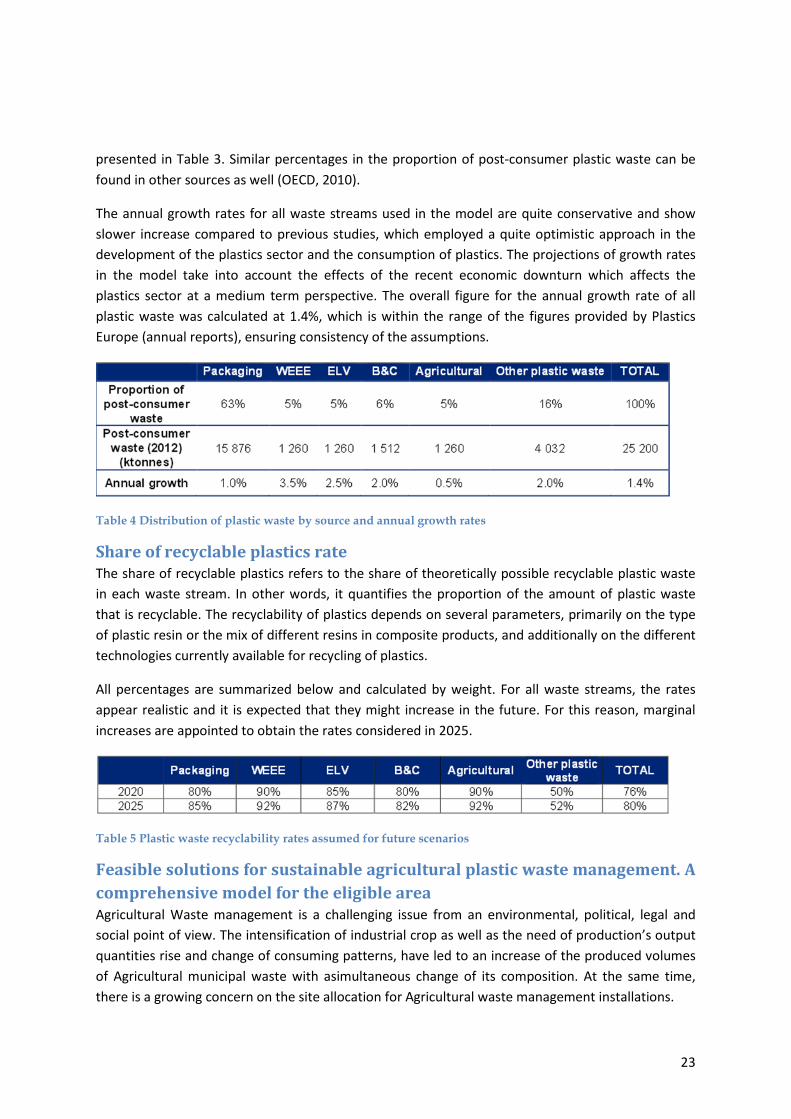
The annual growth rates for all waste streams used in the model are quite conservative and show slower increase compared to previous studies, which employed a quite optimistic approach in the development of the plastics sector and the consumption of plastics. The projections of growth rates in the model take into account the effects of the recent economic downturn which affects the plastics sector at a medium term perspective. The overall figure for the annual growth rate of all plastic waste was calculated at 1.4%, which is within the range of the figures provided by Plastics Europe (annual reports), ensuring consistency of the assumptions.
Table 4 Distribution of plastic waste by source and annual growth rates
Share of recyclable plastics rate The share of recyclable plastics refers to the share of theoretically possible recyclable plastic waste in each waste stream. In other words, it quantifies the proportion of the amount of plastic waste that is recyclable. The recyclability of plastics depends on several parameters, primarily on the type of plastic resin or the mix of different resins in composite products, and additionally on the different technologies currently available for recycling of plastics.
All percentages are summarized below and calculated by weight. For all waste streams, the rates appear realistic and it is expected that they might increase in the future. For this reason, marginal increases are appointed to obtain the rates considered in 2025.
Table 5 Plastic waste recyclability rates assumed for future scenarios
Feasible solutions for sustainable agricultural plastic waste management. A comprehensive model for the eligible area Agricultural Waste management is a challenging issue from an environmental, political, legal and social point of view. The intensification of industrial crop as well as the need of production’s output quantities rise and change of consuming patterns, have led to an increase of the produced volumes of Agricultural municipal waste with asimultaneous change of its composition. At the same time, there is a growing concern on the site allocation for Agricultural waste management installations.

24
Figure 3 Generation of packaging waste by waste type (1997-2007)
Figure 4 Generation of waste by economic activity (Shares, 2006)7
Furthermore, until recently, big quantities of useful materials (i.e. paper, glass, aluminum, plastic, metal and wood) have not been, in some cases, exploited to their full potential, through recovery and recycling. However, in recent years, significant progress has been accomplished in solid agricultural waste management, through increased allocation of funds, focusing largely on the promotion of recycling and the expansion of the number of managed sanitary landfill sites throughout the country.
After the communication campaign is launched, it is of great importance to develop a smart and practical chain of waste flow from the field to recycling facility and finally to the market as a new product for re use in municipal level as it is recommended by the EU directives.
First step is the development of a vast network of waste distribution. Gathering the waste for every field in a specific location in properly constructed silos, for space saving, where plastic has no contact with atmospheric conditions, air, rain, soil etc.
After gathering a specific amount of waste, there must be a scheduled transportation of the waste from the gathering site to the recycling establishments. The transportation process must be accurate in order to provide a continuous flow of waste to recycling, where the treatment processes always operating at 100% of its treatment capability.
7 Source National Centre of Environment and Sustainable Development (NCESD), 2010
25
Plastic diverse material as PET, PP, PE, PVC etc must be separated on gathering site in different silos, because each plastic material depending of it use has different treatment process. That practically means for instance that chemical fertilizers containers must be separated of greenhouse films before the treating process.
In treatment process plastic output has to be categorized according to quality, color, composition parameters etc. it necessary to coordinate this model to the market in order to insure the successful distribution of the output.
So there are different types of possible customers willing to buy refined plastic materials. Each type of customer has different needs. Marketing strategy is important for understanding customer’s needs, identifying numerous target groups and responding to them with specific products.
The price of recycled plastic material is depending on products demand in market. As a matter of fact financial crisis is actually increasing the demand, while recycled plastic raw material for industrial purposes is cheaper.
After all every plastic waste producer considered being a polluter according to EU principal ’’The polluter pays’’. From a single unit to large agricultural businesses, facilities and establishments every ’’polluter’’ wants to get rid of the waste that is daily generated, without paying fines. For this reason the input for a plastic treatment facility is guaranteed.
A feasible model for APW management in Ilida The model for the Agricultural plastic recycling value chain maps the different parameters and criteria influencing the amount of plastic waste that can be recycled, together with the associated costs and labor required for the different scenarios considered.
The recycling value chain of plastics is very diverse and involves a multitude of actors in each step of the chain, from collection, transport, dismantling, sorting (possibly several steps) and finally to recycling.
The overall structure of the model, the associated parameters and all necessary assumptions are presented in the following sections. The model is constructed in a simple and comprehensive way, avoiding over-complication of the value chain, by integrating the flows of different plastic waste streams and plastic resins.
The conclusive agricultural plastic waste management model consists of the following general Phases:
Collection of APW (including transportation to temporary storage sites). Storage & Sorting solutions for the collected APW according to different plastic resins. Pre-treatment & balling of the APW for easier transportation. Transportation of the sorted and balled APW resins to recycling facilities. Recycling by type of resin. Final market access for the refined APW output.
26
Energy recovery from non-recycled APW.
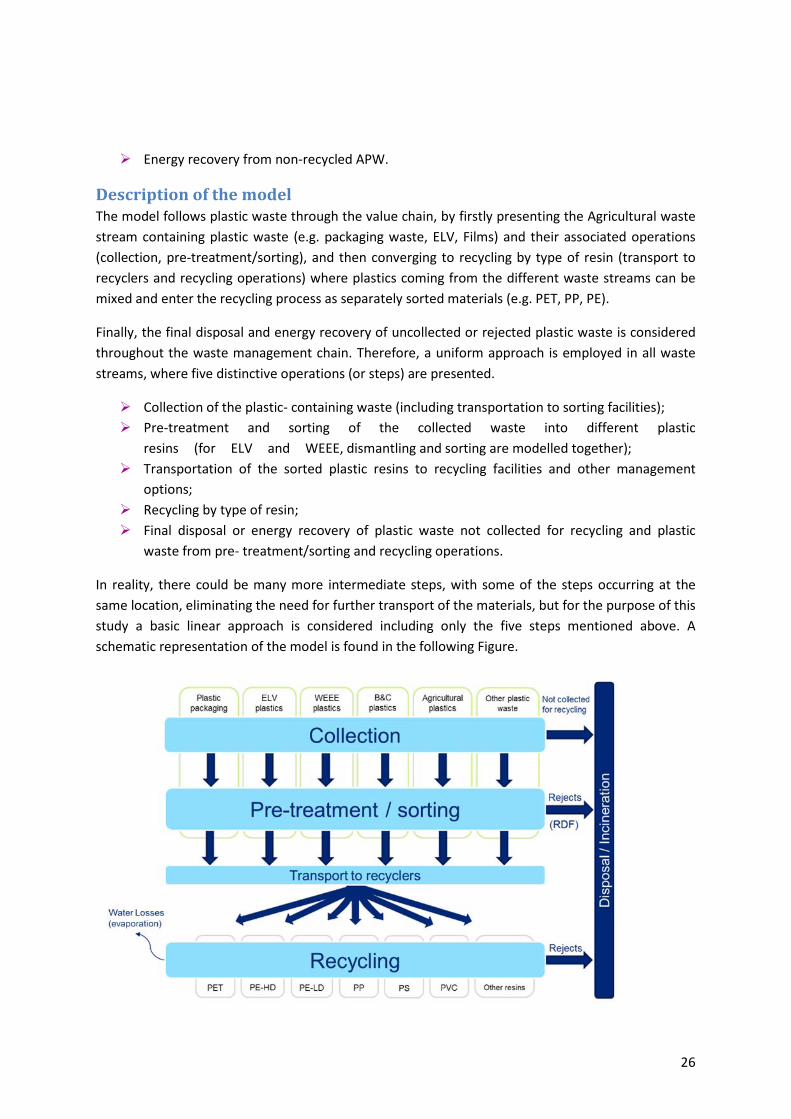
Description of the model The model follows plastic waste through the value chain, by firstly presenting the Agricultural waste stream containing plastic waste (e.g. packaging waste, ELV, Films) and their associated operations (collection, pre-treatment/sorting), and then converging to recycling by type of resin (transport to recyclers and recycling operations) where plastics coming from the different waste streams can be mixed and enter the recycling process as separately sorted materials (e.g. PET, PP, PE).
Finally, the final disposal and energy recovery of uncollected or rejected plastic waste is considered throughout the waste management chain. Therefore, a uniform approach is employed in all waste streams, where five distinctive operations (or steps) are presented.
Collection of the plastic- containing waste (including transportation to sorting facilities); Pre-treatment and sorting of the collected waste into different plastic
resins (for ELV and WEEE, dismantling and sorting are modelled together); Transportation of the sorted plastic resins to recycling facilities and other management
options; Recycling by type of resin; Final disposal or energy recovery of plastic waste not collected for recycling and plastic
waste from pre- treatment/sorting and recycling operations.
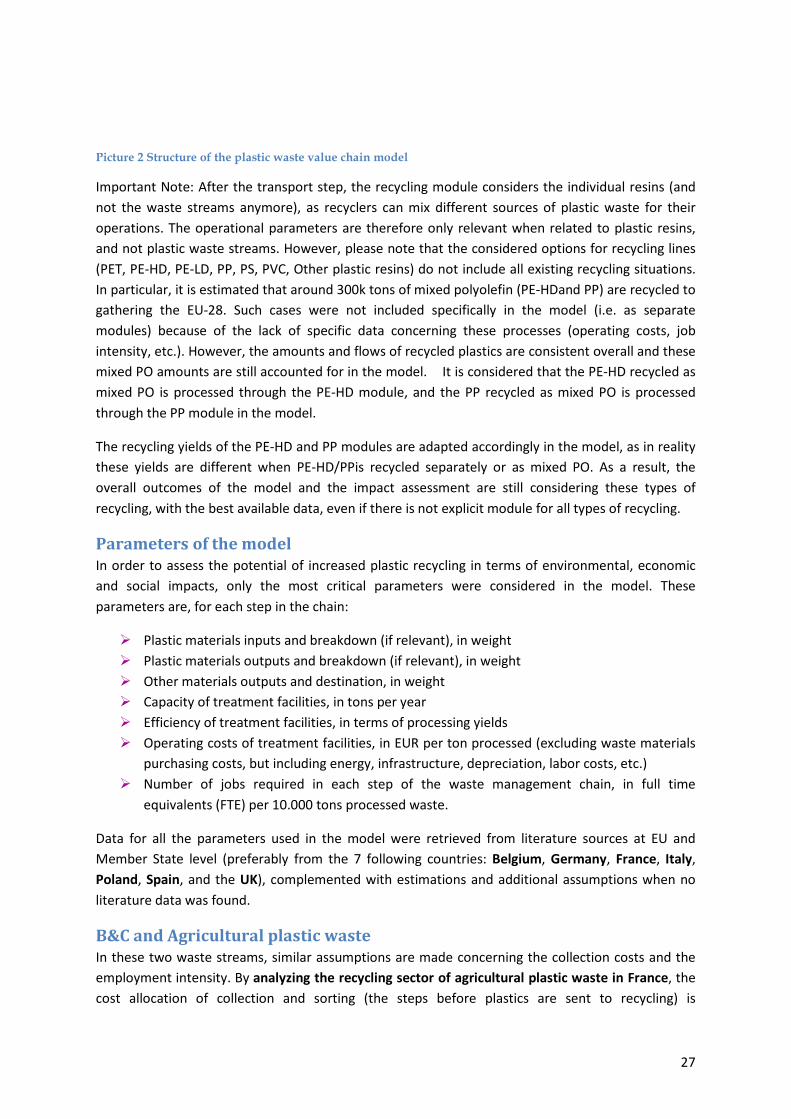
In reality, there could be many more intermediate steps, with some of the steps occurring at the same location, eliminating the need for further transport of the materials, but for the purpose of this study a basic linear approach is considered including only the five steps mentioned above. A schematic representation of the model is found in the following Figure.
27
Picture 2 Structure of the plastic waste value chain model
Important Note: After the transport step, the recycling module considers the individual resins (and not the waste streams anymore), as recyclers can mix different sources of plastic waste for their operations. The operational parameters are therefore only relevant when related to plastic resins, and not plastic waste streams. However, please note that the considered options for recycling lines (PET, PE-HD, PE-LD, PP, PS, PVC, Other plastic resins) do not include all existing recycling situations. In particular, it is estimated that around 300k tons of mixed polyolefin (PE-HDand PP) are recycled to gathering the EU-28. Such cases were not included specifically in the model (i.e. as separate modules) because of the lack of specific data concerning these processes (operating costs, job intensity, etc.). However, the amounts and flows of recycled plastics are consistent overall and these mixed PO amounts are still accounted for in the model. It is considered that the PE-HD recycled as mixed PO is processed through the PE-HD module, and the PP recycled as mixed PO is processed through the PP module in the model.
The recycling yields of the PE-HD and PP modules are adapted accordingly in the model, as in reality these yields are different when PE-HD/PPis recycled separately or as mixed PO. As a result, the overall outcomes of the model and the impact assessment are still considering these types of recycling, with the best available data, even if there is not explicit module for all types of recycling.
Parameters of the model In order to assess the potential of increased plastic recycling in terms of environmental, economic and social impacts, only the most critical parameters were considered in the model. These parameters are, for each step in the chain:
Plastic materials inputs and breakdown (if relevant), in weight Plastic materials outputs and breakdown (if relevant), in weight Other materials outputs and destination, in weight Capacity of treatment facilities, in tons per year Efficiency of treatment facilities, in terms of processing yields Operating costs of treatment facilities, in EUR per ton processed (excluding waste materials
purchasing costs, but including energy, infrastructure, depreciation, labor costs, etc.) Number of jobs required in each step of the waste management chain, in full time
equivalents (FTE) per 10.000 tons processed waste.
Data for all the parameters used in the model were retrieved from literature sources at EU and Member State level (preferably from the 7 following countries: Belgium, Germany, France, Italy, Poland, Spain, and the UK), complemented with estimations and additional assumptions when no literature data was found.
B&C and Agricultural plastic waste In these two waste streams, similar assumptions are made concerning the collection costs and the employment intensity. By analyzing the recycling sector of agricultural plastic waste in France, the cost allocation of collection and sorting (the steps before plastics are sent to recycling) is
28
approximately 150 EUR/t. In France, it is widely agreed that the transportation costs amount to 50 EUR/t, which roughly can be appointed to the collection of plastic waste from farms. There are no complicated collection paths for agricultural waste, therefore the transportation costs can be roughly attributed to the collection and the remaining 100 EUR/t to sorting.
For B&C plastic waste, similar values for the costs of collection and sorting of PVC waste have been identified in literature sources. Using the same logic as in agricultural plastic waste, the cost of collection of B&C plastic waste is assumed to be 50 EUR/t. However, this partition might not be as straight forward because there can be selective sorting at the source (at the construction site) before the collection step and the borders between sorting and collection are not definitely set. For simplification reasons and due to lack of detailed data, a similar approach to agricultural plastic waste is used for B&C plastic waste.
It is considered that the employment intensity of the collection in these two waste streams is lower compared to the other waste streams. An employment factor of 10 FTE per 10 000 tons is assumed in the model, since there is complete absence of any data in literature sources.
ELV plastic waste The collection of end-of-life vehicles used in Agricultural production is specific, as the collection is performed by the dismantling actor, which includes this service in its prices, either from commercial dealers or from households. As a result, the specific costs of collection can be derived from the total costs, reported by the ELV pre-treatment and sorting facilities, by isolating the cost incurred for the acquisition and transport of the ELV to the dismantling facility. However, the same approach could not be followed for the direct jobs created by the collection of ELV. Therefore, no jobs are allocated in the collection of ELV but the employment intensity is kept aggregated within the sorting/dismantling step of the chain. The breakdown of costs is taken from a French study (ADEME, 2003) and the average costs associated with the acquisition of ELV is 41 EUR per ton.8
Data and assumptions in sorting/pre-treatment of plastic waste the sorting/pre-treatment yields should be understood as the percentage of plastics waste that is sorted for recycling against that which is going to landfill or incineration, only considering the sorting/pre- treatment step (excluding collection). In the case of packaging waste for example, 18% of plastics packaging waste that is being sorted in a MRF or PRF is rejected from the process and is disposed of. However, this 82% yield in the sorting of plastic packaging waste consists an average figure and includes many different sorting processes. At this point, it would be relevant to point out that the sorting/pre-treatment processes are different for each of the waste streams examined in the model. Plastic packaging waste might go through one or multiple sorting operations, according to different technologies used at sorting/pre-treatment plants and the desired level of purity. By increasing the sorting steps, the sorting yield changes as well. For WEEE and ELV waste streams, for example, there are additional steps before the sorting of plastics, usually including dismantling and shredding of the plastic components. All these operations – dismantling, shredding, and sorting – are included in what is called ‘sorting/pre-treatment yields’ in the model. 8 Source French study (ADEME, 2003)
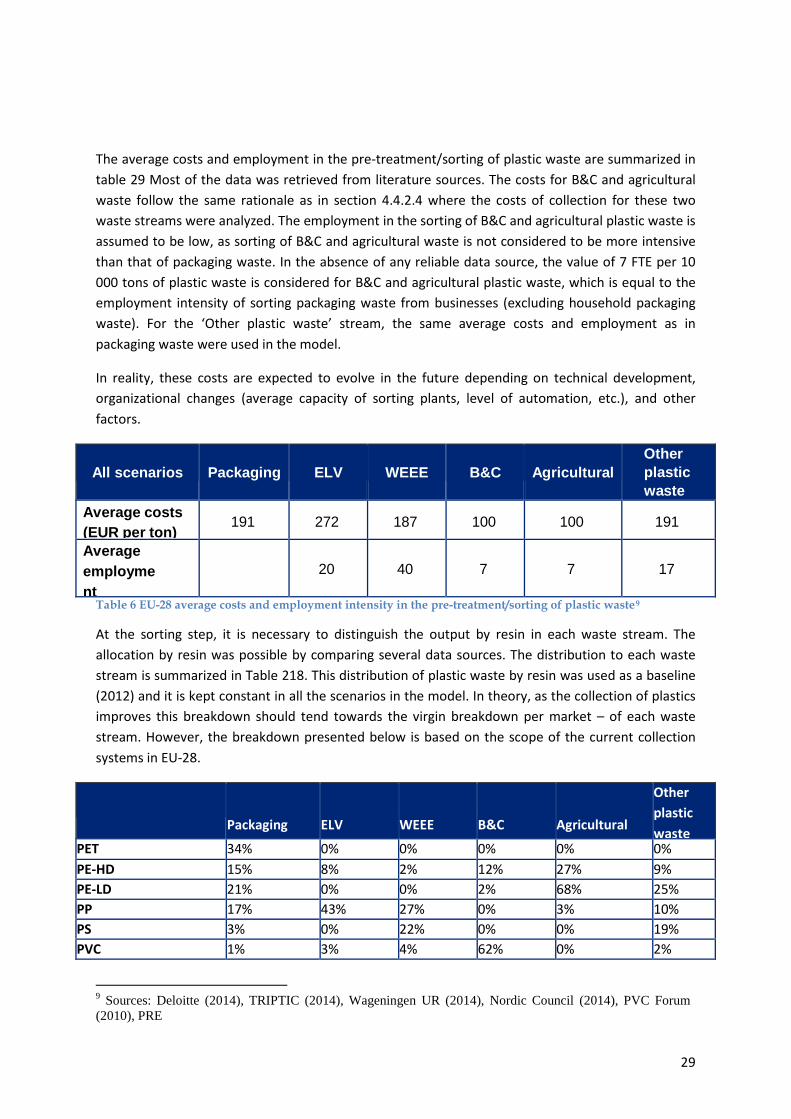
29
The average costs and employment in the pre-treatment/sorting of plastic waste are summarized in table 29 Most of the data was retrieved from literature sources. The costs for B&C and agricultural waste follow the same rationale as in section 4.4.2.4 where the costs of collection for these two waste streams were analyzed. The employment in the sorting of B&C and agricultural plastic waste is assumed to be low, as sorting of B&C and agricultural waste is not considered to be more intensive than that of packaging waste. In the absence of any reliable data source, the value of 7 FTE per 10 000 tons of plastic waste is considered for B&C and agricultural plastic waste, which is equal to the employment intensity of sorting packaging waste from businesses (excluding household packaging waste). For the ‘Other plastic waste’ stream, the same average costs and employment as in packaging waste were used in the model.
In reality, these costs are expected to evolve in the future depending on technical development, organizational changes (average capacity of sorting plants, level of automation, etc.), and other factors.
All scenarios
Packaging
ELV
WEEE
B&C
Agricultural
Other plastic waste
Average costs (EUR per ton)
191
272
187
100
100
191
Average employment
20
40
7
7
17
Table 6 EU-28 average costs and employment intensity in the pre-treatment/sorting of plastic waste9
At the sorting step, it is necessary to distinguish the output by resin in each waste stream. The allocation by resin was possible by comparing several data sources. The distribution to each waste stream is summarized in Table 218. This distribution of plastic waste by resin was used as a baseline (2012) and it is kept constant in all the scenarios in the model. In theory, as the collection of plastics improves this breakdown should tend towards the virgin breakdown per market – of each waste stream. However, the breakdown presented below is based on the scope of the current collection systems in EU-28.
Packaging
ELV
WEEE
B&C
Agricultural
Other plastic waste
PET 34% 0% 0% 0% 0% 0% PE-HD 15% 8% 2% 12% 27% 9% PE-LD 21% 0% 0% 2% 68% 25% PP 17% 43% 27% 0% 3% 10% PS 3% 0% 22% 0% 0% 19% PVC 1% 3% 4% 62% 0% 2%
9 Sources: Deloitte (2014), TRIPTIC (2014), Wageningen UR (2014), Nordic Council (2014), PVC Forum (2010), PRE
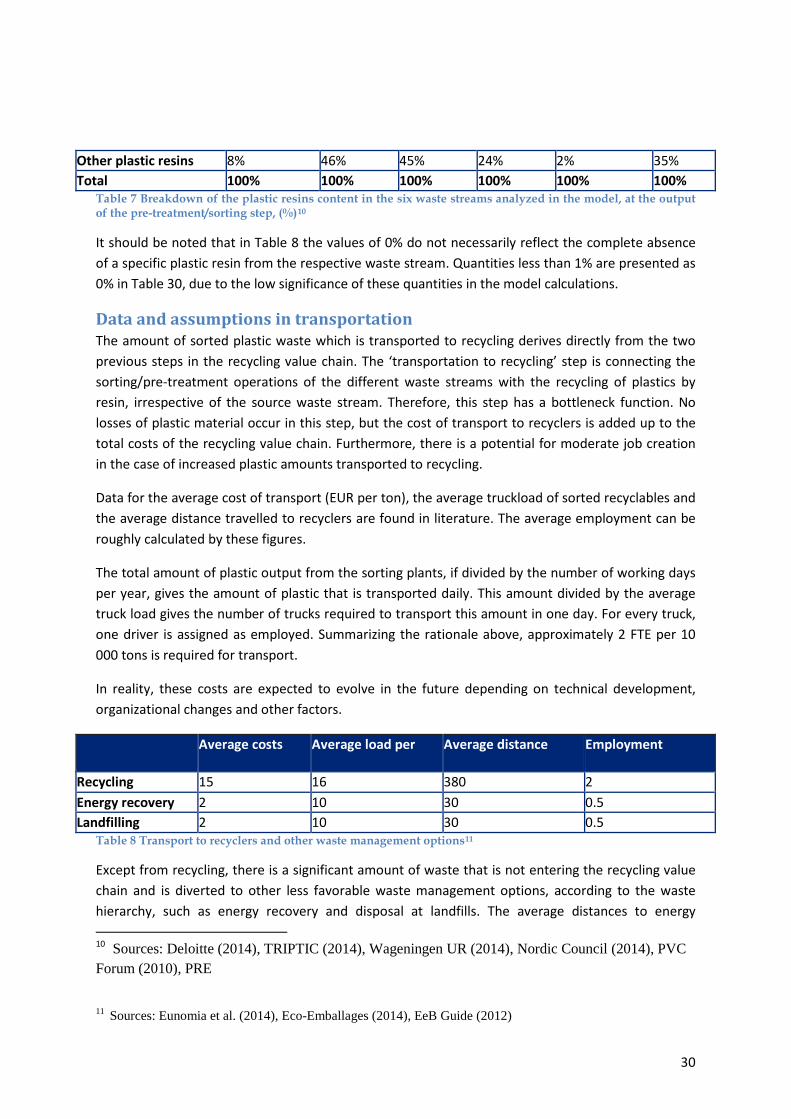
30
Other plastic resins 8% 46% 45% 24% 2% 35% Total 100% 100% 100% 100% 100% 100%
Table 7 Breakdown of the plastic resins content in the six waste streams analyzed in the model, at the output of the pre-treatment/sorting step, (%)10
It should be noted that in Table 8 the values of 0% do not necessarily reflect the complete absence of a specific plastic resin from the respective waste stream. Quantities less than 1% are presented as 0% in Table 30, due to the low significance of these quantities in the model calculations.
Data and assumptions in transportation The amount of sorted plastic waste which is transported to recycling derives directly from the two previous steps in the recycling value chain. The ‘transportation to recycling’ step is connecting the sorting/pre-treatment operations of the different waste streams with the recycling of plastics by resin, irrespective of the source waste stream. Therefore, this step has a bottleneck function. No losses of plastic material occur in this step, but the cost of transport to recyclers is added up to the total costs of the recycling value chain. Furthermore, there is a potential for moderate job creation in the case of increased plastic amounts transported to recycling.
Data for the average cost of transport (EUR per ton), the average truckload of sorted recyclables and the average distance travelled to recyclers are found in literature. The average employment can be roughly calculated by these figures.
The total amount of plastic output from the sorting plants, if divided by the number of working days per year, gives the amount of plastic that is transported daily. This amount divided by the average truck load gives the number of trucks required to transport this amount in one day. For every truck, one driver is assigned as employed. Summarizing the rationale above, approximately 2 FTE per 10 000 tons is required for transport.
In reality, these costs are expected to evolve in the future depending on technical development, organizational changes and other factors.
Average costs
Average load per
Average distance
Employment
Recycling 15 16 380 2 Energy recovery 2 10 30 0.5 Landfilling 2 10 30 0.5
Table 8 Transport to recyclers and other waste management options11
Except from recycling, there is a significant amount of waste that is not entering the recycling value chain and is diverted to other less favorable waste management options, according to the waste hierarchy, such as energy recovery and disposal at landfills. The average distances to energy 10 Sources: Deloitte (2014), TRIPTIC (2014), Wageningen UR (2014), Nordic Council (2014), PVC Forum (2010), PRE
11 Sources: Eunomia et al. (2014), Eco-Emballages (2014), EeB Guide (2012)
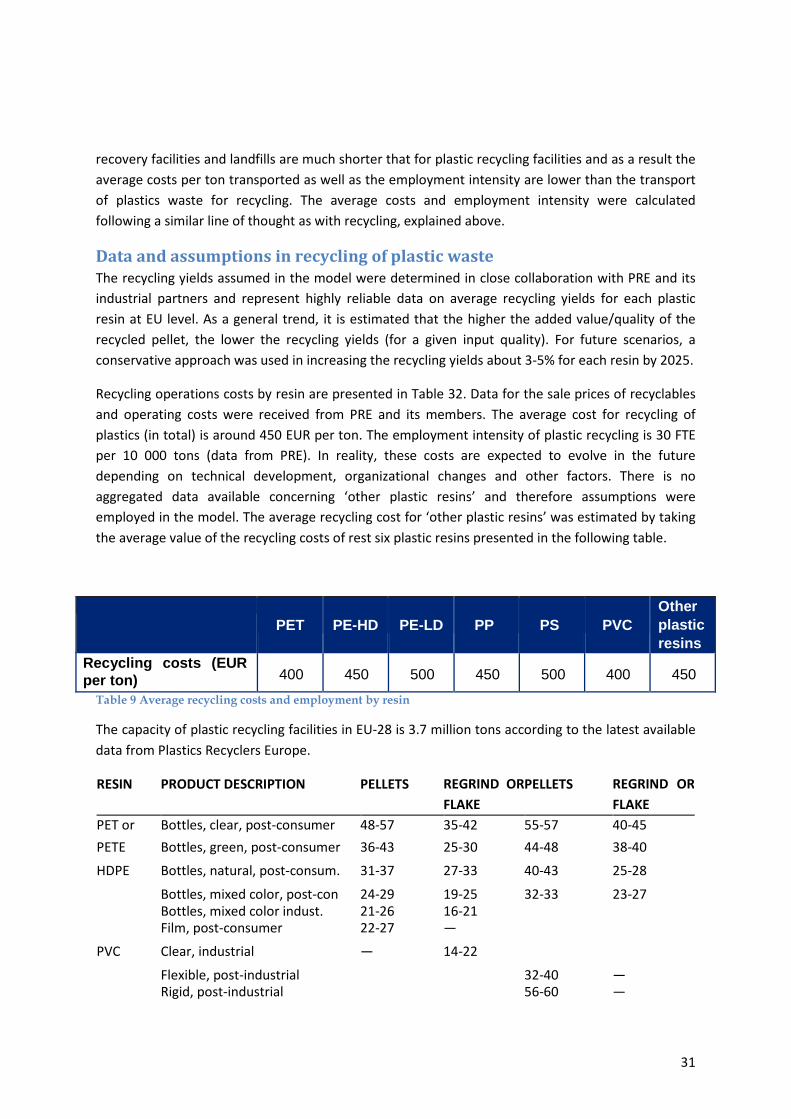
31
recovery facilities and landfills are much shorter that for plastic recycling facilities and as a result the average costs per ton transported as well as the employment intensity are lower than the transport of plastics waste for recycling. The average costs and employment intensity were calculated following a similar line of thought as with recycling, explained above.
Data and assumptions in recycling of plastic waste The recycling yields assumed in the model were determined in close collaboration with PRE and its industrial partners and represent highly reliable data on average recycling yields for each plastic resin at EU level. As a general trend, it is estimated that the higher the added value/quality of the recycled pellet, the lower the recycling yields (for a given input quality). For future scenarios, a conservative approach was used in increasing the recycling yields about 3-5% for each resin by 2025.
Recycling operations costs by resin are presented in Table 32. Data for the sale prices of recyclables and operating costs were received from PRE and its members. The average cost for recycling of plastics (in total) is around 450 EUR per ton. The employment intensity of plastic recycling is 30 FTE per 10 000 tons (data from PRE). In reality, these costs are expected to evolve in the future depending on technical development, organizational changes and other factors. There is no aggregated data available concerning ‘other plastic resins’ and therefore assumptions were employed in the model. The average recycling cost for ‘other plastic resins’ was estimated by taking the average value of the recycling costs of rest six plastic resins presented in the following table.
PET
PE-HD
PE-LD
PP
PS
PVC
Other plastic resins
Recycling costs (EUR per ton)
400
450
500
450
500
400
450
Table 9 Average recycling costs and employment by resin
The capacity of plastic recycling facilities in EU-28 is 3.7 million tons according to the latest available data from Plastics Recyclers Europe.
RESIN PRODUCT DESCRIPTION PELLETS REGRIND OR FLAKE
PELLETS REGRIND OR FLAKE
PET or Bottles, clear, post-consumer 48-57 35-42 55-57 40-45 PETE Bottles, green, post-consumer 36-43 25-30 44-48 38-40 HDPE Bottles, natural, post-consum. 31-37 27-33 40-43 25-28 Bottles, mixed color, post-con 24-29 19-25 32-33 23-27 Bottles, mixed color indust. 21-26 16-21 Film, post-consumer 22-27 — PVC Clear, industrial — 14-22 Flexible, post-industrial 32-40 — Rigid, post-industrial 56-60 —
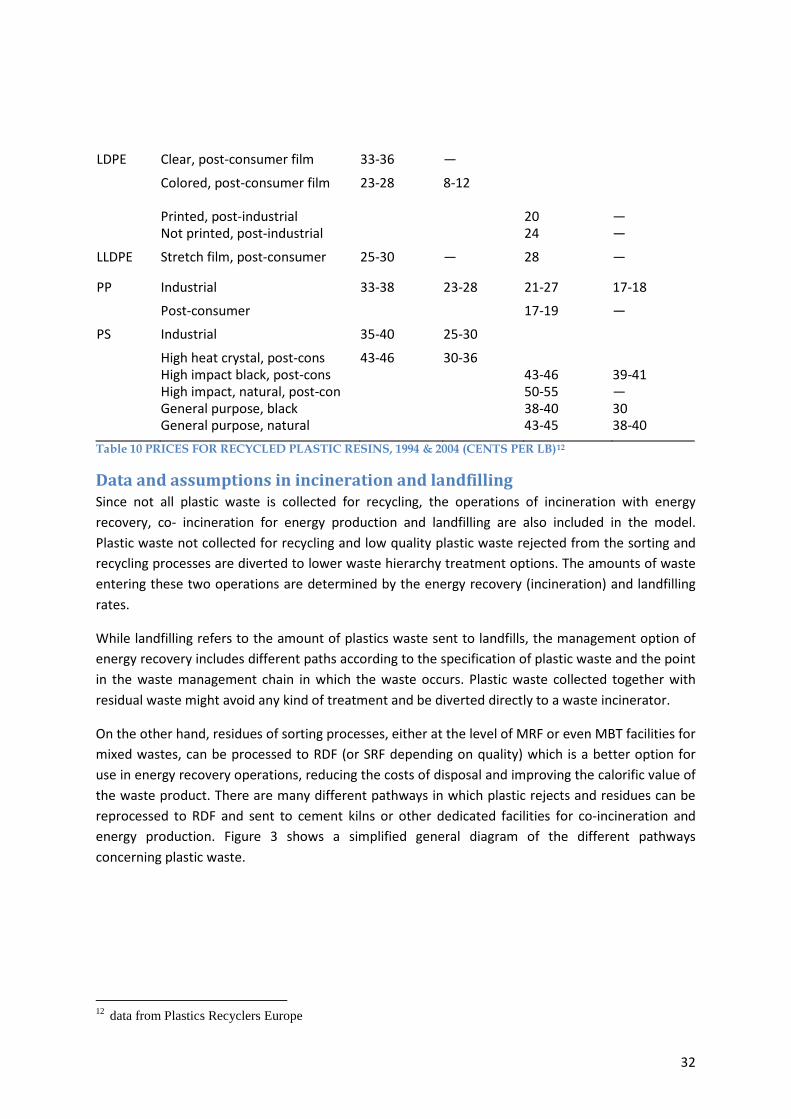
32
LDPE Clear, post-consumer film 33-36 — Colored, post-consumer film
23-28 8-12
Printed, post-industrial 20 — Not printed, post-industrial 24 — LLDPE Stretch film, post-consumer 25-30 — 28 —
PP Industrial 33-38 23-28 21-27 17-18 Post-consumer 17-19 — PS Industrial 35-40 25-30 High heat crystal, post-cons 43-46 30-36 High impact black, post-cons 43-46 39-41 High impact, natural, post-con 50-55 — General purpose, black 38-40 30 General purpose, natural 43-45 38-40 Table 10 PRICES FOR RECYCLED PLASTIC RESINS, 1994 & 2004 (CENTS PER LB)12
Data and assumptions in incineration and landfilling Since not all plastic waste is collected for recycling, the operations of incineration with energy recovery, co- incineration for energy production and landfilling are also included in the model. Plastic waste not collected for recycling and low quality plastic waste rejected from the sorting and recycling processes are diverted to lower waste hierarchy treatment options. The amounts of waste entering these two operations are determined by the energy recovery (incineration) and landfilling rates.
While landfilling refers to the amount of plastics waste sent to landfills, the management option of energy recovery includes different paths according to the specification of plastic waste and the point in the waste management chain in which the waste occurs. Plastic waste collected together with residual waste might avoid any kind of treatment and be diverted directly to a waste incinerator.
On the other hand, residues of sorting processes, either at the level of MRF or even MBT facilities for mixed wastes, can be processed to RDF (or SRF depending on quality) which is a better option for use in energy recovery operations, reducing the costs of disposal and improving the calorific value of the waste product. There are many different pathways in which plastic rejects and residues can be reprocessed to RDF and sent to cement kilns or other dedicated facilities for co-incineration and energy production. Figure 3 shows a simplified general diagram of the different pathways concerning plastic waste.
12 data from Plastics Recyclers Europe
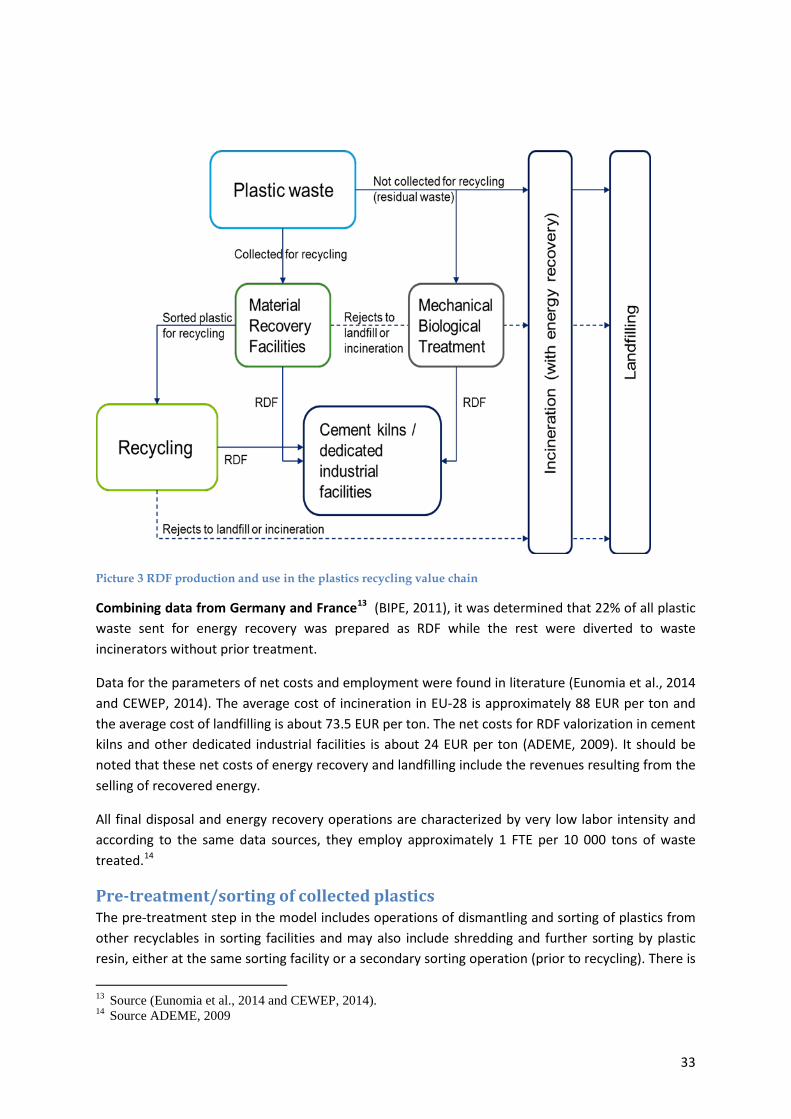
33
Picture 3 RDF production and use in the plastics recycling value chain
Combining data from Germany and France13 (BIPE, 2011), it was determined that 22% of all plastic waste sent for energy recovery was prepared as RDF while the rest were diverted to waste incinerators without prior treatment.
Data for the parameters of net costs and employment were found in literature (Eunomia et al., 2014 and CEWEP, 2014). The average cost of incineration in EU-28 is approximately 88 EUR per ton and the average cost of landfilling is about 73.5 EUR per ton. The net costs for RDF valorization in cement kilns and other dedicated industrial facilities is about 24 EUR per ton (ADEME, 2009). It should be noted that these net costs of energy recovery and landfilling include the revenues resulting from the selling of recovered energy.
All final disposal and energy recovery operations are characterized by very low labor intensity and according to the same data sources, they employ approximately 1 FTE per 10 000 tons of waste treated.14
Pre-treatment/sorting of collected plastics The pre-treatment step in the model includes operations of dismantling and sorting of plastics from other recyclables in sorting facilities and may also include shredding and further sorting by plastic resin, either at the same sorting facility or a secondary sorting operation (prior to recycling). There is
13 Source (Eunomia et al., 2014 and CEWEP, 2014). 14 Source ADEME, 2009
34
considerable lack of data concerning GHG emission factors of sorting and pre-treatment operations. However, through PRE, it was possible to gather information on the energy use of a sorting facility for plastic packaging waste. The specific sorting plant is using 50 kWh of electricity per ton of input material. Taking the average GHG emissions factor for EU-28 electricity mix, it was calculated that the emission factor at the sorting step is 26.5 kg CO2e/t. The average GHG emissions factor for EU-28 electricity mix was calculated by combining GHG emission data from the Ecoinvent LCI database with data on the electricity sources by fuel at EU level from the International Energy Agency (IEA).15
The emission factor assigned to the pre-treatment/sorting step is not representing satisfactorily the operations of dismantling, shredding and sorting in other waste streams besides packaging waste, but nevertheless it constitutes a relevant approximation of the impact of sorting in the plastic recycling value chain due to the fact that packaging waste represents 63% of the total plastic waste produced. However, GHG emissions from sorting of plastics have been found to be insignificant (Nordic Council, 2015) and therefore the impact of the assumption made in this step of the chain will not have any noticeable effect throughout the whole value chain.16
Transportation of plastics to recyclers The transportation module in the model includes all plastic waste transferred from the sorting facilities to recyclers, but also includes the transportation of plastic waste unfit for recycling to other treatment options (e.g. RDF preparation, incineration, landfilling). The Life Cycle Inventory (LCI) ‘Transport: lorry 16-32 t, EURO4/RER’ from Eco invent database was used for the transportation step of the chain. The emissions factor of diesel fuel is 3.07 kg CO2e per litre of diesel and the fuel consumption of lorry type 16-32 tons is 0.3 liters per kilometer. The average load per truck is estimated at 16 tons (Eunomia, 2014) and the average distance travelled to recyclers is 380 km (Eco-Emballages, 2014). This average distance concerns specifically the situation in France and refers only to plastic recycling facilities within the context of packaging waste. However, plastic recyclers are specialized by plastic resin and not by waste stream, so in principle the same facilities receiving packaging waste could potentially treat waste from other streams as well (depending on quality and end applications). The density of recyclers and the distances are different in MS but the figure above is a good approximation at EU level, since extensive areas in EU periphery are far away from plastic recycling facilities. A general figure for the average distance to recyclers used extensively in literature is 250 km but this refers to all recycling facilities in general, irrespective of the material. It is considered more reliable to use data specific for plastic recyclers. For the treatment options of incineration and landfilling, the average distance is assumed at 30 km (EeBGuide, 2012). The resulting GHG emissions factor for transportation of plastics waste to recyclers is estimated at 21.88 g CO2e/kg material, while the GHG emissions factor for transportation to incinerators or landfills is estimated at 2.76 g CO2e/kg material.
15 International Energy Agency (IEA) 16 Nordic Council, 2015
35
Recycling of plastics Recycling includes operations of plastic recycling by resin at specialized recyclers’ facilities, from receiving the sorted material (bales) to the production of pellets or flakes of recycled plastics. In the recycling step, there are two different effects which are accounted in the impact assessment.
Technological analysis The process of collecting the plastic and the procedure for its installation in large areas is now being operated mechanically. To be considered fit to undergo any specific processing, plastic waste should be cleaned somewhat and not be full of dirt and agrochemicals. Actually farmers simply gather and burn or worse yet, prepare the field for the next arable period with plastic in it, leading to greatly reduced quality of the crop as after several crops, the field has large quantities of plastic inside. As mentioned again, farmers prefer the option of burning plastic in the eligible area. The main reason for this is that they are facing space problem with this, since they take up a lot of space to be stored or processed in a different way.
The minority of farmers who collect plastic and deliver it to some recycling companies indicate that their fields are in their vast majority surrounded by satisfactory road network, facilitating plastic waste collection. Nevertheless the majority of the farmers, for their convenience are choosing to burn the plastic wastes, or to plow plastic in the field letting the plastic into the soil. Other farmers choose to throw plastic waste in landfills with garbage from urban areas.
Those who used biodegradable plastics showed a dispute in the ability of the plastic to bio degrades. Regarding the LabelAgriWaste, integrate the collection, sampling and labelling procedures and the methodologies to valorize the agricultural plastic waste streams by facilitating their routing to the best disposal alternative (technically feasible, most environmental friendly and economically valuable). The labelling in addition to facilitating and improving the efficiency of the disposal alternatives will allow transport of labelled agricultural plastic waste across boundaries and valuation of the waste streams in an open European market simultaneously preserving valuable material resources and protecting the environment. The technical requirements of waste streams for each disposal alternative will be developed as well as the methodology to reach these requirements.
This will provide the farmers SMEs with clean guideline on how to collect and sort the waste to reach the specs. Waste sampling and labelling methodology will be developed and field-tested. The marketability of the product "waste" resulting from the standardization will provide strong incentives to achieve 100% waste collection rates resulting in a cleaner environment.
The goals of the labeling scheme may be summarized as follows: better sustainability of plastic use in agriculture, environmental soundness, efficiency, economy and fair distribution of costs. The technical means incorporated in the labeling scheme to achieve these goals include: A) Traceability/accounting/transparency B) Standardization/Marketability for creation of open market C) Best technology.
36
In this respect the technical recommendations of LabelAgriWaste have to be taken seriously into account. The Region of Western Greece and the structural Funds being further programmed at the moment for the period of 2014-20 should be targeted while schemes of PPPP nature should be examined. Importantly, the member of the Greek parliament Mr. M. Stratakis put a question regarding the financing of the European research project Labelagriwaste for the exploitation of the used agri plastic waste. Furthermore, he proposes the establishment of a “Used Agri Plastic Waste System” which will finance and monitor the management of the system and, also it will be responsible for the city planning and creation of the recycling units-centers in which the used agri plastic waste will be exploited.
Regarding the progress made by Greece in in recycling issues, after the Waste Framework Directive 98/2008 was published, the European Union required from Member States to promote recycling programs in order to implement waste prevention and management.
Four years later a new Law was published in Greece [3854/2010] referring the amendment of the former legislation on recycling. The National Agency on Alternative Management of Packaging and Other Products (EOEDSAP) is launched, amending the operating of the approved recycling systems to ensure the smooth functioning of the market and improve effectiveness. In packaging waste the national recycling performance is on the road to cover all EU targets. In organic fraction recycling the system just started being developed (www. ypeka.gr/ ENVIRONMENT/ RECYCLING).
Additionally, there are several alternative Management Systems provided. The systems are licensed and operated under the responsibility of producers/ managers, nationwide and expand gradually geographically. The PD 117, (GG A’ 82/2004) and MD 133480/14.11.2011 (GG B' 2711/2011) regulate the management of waste from electrical and electronic equipment. Inert material aggregates can be reused according to the JMD 8 / 2010 referring to alternative management of aggregates and recycling systems of waste from demolition and construction. Law 2939/2001 (GG A’ 179/2001) refers on packaging and alternative management of packaging and other products.
The JMD 80568/4225/1991 (GG B’ 641/1991) foresees the methods, conditions and restrictions for use in agriculture of sludge from the treatment of domestic and urban sewage. The JMD 7589/731/2000 (GG B’ 514/2000) establishes measures and procedures for the management of polychlorinated biphenyls and terphenyls (ROV /ROT). The JMD 18083/1098 E.103 / 2003 (GG B’ 606/2003) sets the regulatory framework regarding the plans for the disposal / decontamination of equipment containing ROV.
Avoided emissions from incineration Similarly to virgin plastics substitution, besides the direct emissions of plastic waste incineration, there are also benefits resulting from the production of energy from the incineration of waste. Such benefits are characterized by avoided GHG emissions from the production of energy from fossil fuels. In order to estimate the avoided emissions from incineration, first the amount of energy produced in the incineration plants must be calculated. The potential for energy production was calculated as follows:
37
Energy content = kg waste incinerated • Σ (waste fraction (%) • calorific value (J/kg))
The calorific value of the plastics waste fraction is 30 (GJ/Mg) (IPCC, 2006). The avoided emissions from incineration are calculated as follows:
kg CO2 savings = energy content (MJ) • (electricity share • efficiency of electricity conversion • CO2 emissions/MJ for electricity + heat share • efficiency of heat conversion • CO2 emissions/MJ for thermal energy)
The CO2 emissions per MJ electricity and CO2 emissions per MJ thermal energy represent the average emissions of the energy mix in EU-28. For electricity the emissions factor is 0.147 kg CO2/MJ and for thermal energy 0.086 kg CO2/MJ. These emission factors were calculated from data on the average energy mix for the production of electricity and heat in EU-28 provided by the International Energy Agency (IEA) for the year 2009, and life cycle inventories of the Ecoinvent LCI database for different electricity and heat production technologies.17
The distribution of production of electricity and thermal energy in the incineration plants are estimated on the basis of CEWEP national reports (CEWEP, 2014) and the background information for the European Reference Model on Municipal Waste Management (Eunomia, 2014). The aggregated average distribution is estimated at 40% electricity and 60%18 heat production in the incinerators of EU-28. The efficiency of electricity conversion is considered at 38% and the efficiency of heat conversion at 91% (European Commission, 2006).19 The GHG emissions factor for the avoided emissions from incineration is therefore estimated at 2 079 kg CO2e/t of plastic waste.20
17 IPCC, 2006 18 Eunomia, 2014 19 European Commission, 2006 20 CEWEP, 2014
38
IX. A feasible model The model for the Agricultural plastic recycling value chain maps the different parameters and criteria influencing the amount of plastic waste that can be recycled, together with the associated costs and labor required for the different scenarios considered.
The recycling value chain of plastics is very diverse and involves a multitude of actors in each step of the chain, from collection, transport, dismantling, sorting (possibly several steps) and finally to recycling.
The overall structure of the model, the associated parameters and all necessary assumptions are presented in the following sections. The model is constructed in a simple and comprehensive way, avoiding over-complication of the value chain, by integrating the flows of different plastic waste streams and plastic resins.
Description of the model The model follows plastic waste through the value chain, by firstly presenting the Agricultural waste stream containing plastic waste (e.g. packaging waste, ELV, Films) and their associated operations (collection, pre-treatment/sorting), and then converging to recycling by type of resin (transport to recyclers and recycling operations) where plastics coming from the different waste streams can be mixed and enter the recycling process as separately sorted materials (e.g. PET, PP, PE).
Finally, the final disposal and energy recovery of uncollected or rejected plastic waste is considered throughout the waste management chain. Therefore, a uniform approach is employed in all waste streams, where five distinctive operations (or steps) are presented.
• Collection of the plastic- containing waste (including transportation to sorting facilities); • Pre-treatment and sorting of the collected waste into different plastic
resins (for ELV and WEEE, dismantling and sorting are modelled together);
Objectives:
Rejection of zero APW in landfills. No uncontrolled combustion. No waste buried in the fields. No uncontrolled discharge. Use 100% recycling / regeneration and energy recovery through incineration.
Those involved in the management of agricultural plastics are:
• Production industry (clear plastic) • Plants and dealers or importers of such products in the territory • Merchants (clear plastic) • The category includes all those traded to the consumer of these products. • Farmers / agribusinesses (consumers) (clean plastic made APW) The category
includes all final consumers of these products be it retail or wholesale sale.
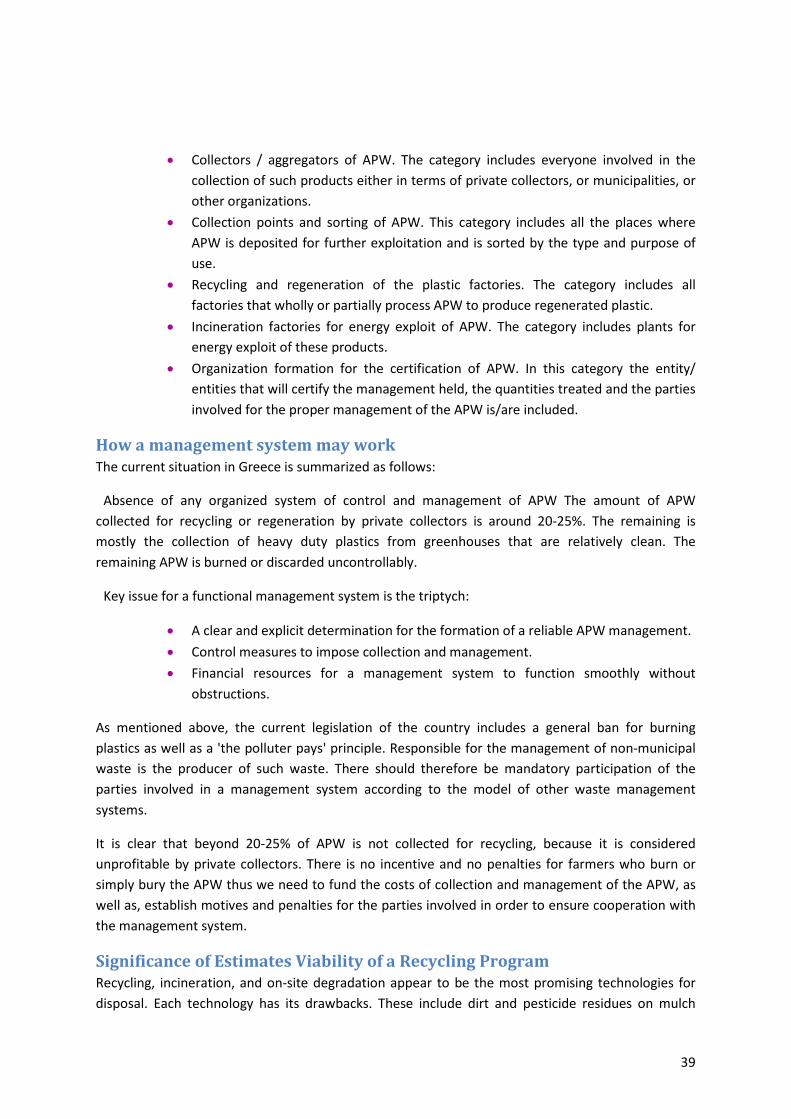
39
• Collectors / aggregators of APW. The category includes everyone involved in the collection of such products either in terms of private collectors, or municipalities, or other organizations.
• Collection points and sorting of APW. This category includes all the places where APW is deposited for further exploitation and is sorted by the type and purpose of use.
• Recycling and regeneration of the plastic factories. The category includes all factories that wholly or partially process APW to produce regenerated plastic.
• Incineration factories for energy exploit of APW. The category includes plants for energy exploit of these products.
• Organization formation for the certification of APW. In this category the entity/ entities that will certify the management held, the quantities treated and the parties involved for the proper management of the APW is/are included.
How a management system may work The current situation in Greece is summarized as follows:
Absence of any organized system of control and management of APW The amount of APW collected for recycling or regeneration by private collectors is around 20-25%. The remaining is mostly the collection of heavy duty plastics from greenhouses that are relatively clean. The remaining APW is burned or discarded uncontrollably.
Key issue for a functional management system is the triptych:
• A clear and explicit determination for the formation of a reliable APW management. • Control measures to impose collection and management. • Financial resources for a management system to function smoothly without
obstructions.
As mentioned above, the current legislation of the country includes a general ban for burning plastics as well as a 'the polluter pays' principle. Responsible for the management of non-municipal waste is the producer of such waste. There should therefore be mandatory participation of the parties involved in a management system according to the model of other waste management systems.
It is clear that beyond 20-25% of APW is not collected for recycling, because it is considered unprofitable by private collectors. There is no incentive and no penalties for farmers who burn or simply bury the APW thus we need to fund the costs of collection and management of the APW, as well as, establish motives and penalties for the parties involved in order to ensure cooperation with the management system.
Significance of Estimates Viability of a Recycling Program Recycling, incineration, and on-site degradation appear to be the most promising technologies for disposal. Each technology has its drawbacks. These include dirt and pesticide residues on mulch
40
films, the presence of stabilizers and photo activators, possible limitations to recycling mixtures of types of plastics, and high costs for recycling and incineration facilities.
Landfilling has been the primary disposal option for all plastic. Restrictions placed on disposal of agricultural Plastics in landfills and the difficulties in finding sites for new landfills are forcing the development of alternative disposal technology. Other unacceptable disposal practices are including disking mulches into the soil, on-site burning, and gathering by unauthorized scrap traders.
Options such as controlled temporary storage and recycling are complicated by the diversity of types of plastics used in agriculture and, in many areas, by the geographically dispersed nature of agricultural plastics use. Types of polymers used in agricultural plastics include low-density polyethylene (PE), linear low-density PE, high-density PE, polyester, polypropylene, PE terephthalate, polyvinyl chloride, polystyrene, nylon, and biopolymers such as starch and cellulose. These sometimes are commingled in the same product. Plastics also contain stabilizers and dyes, including heavy metals, which may limit the types of products produced from recycled materials.
Guidelines for the use of Agricultural Plastics (AP) at farm level When the Farmer buys new agricultural plastics, he/she should make certified photocopies of the invoices and submit them along with the delivered APW at the collection area. The invoice should mention at least: the name of the company that produced the plastic, the trade name of the product (referred to a standard sheet with the characteristic of the material) and the quantity purchased. Tracing of the materials should be incorporated in the invoice information.
Then, the Farmer could ask - the relevant Office of the BAT Province/ agronomist/ the municipality/ the exporter in that area - to be informed on:
• The location of the nearest collection station for agricultural plastic waste • The telephone and the Manager of the station with whom to arrange the delivery of the
APW • The list of APW accepted by the collection station • Guidelines on the acceptable APW
Use of agricultural plastics When the Farmer uses agrochemicals, he/she should be sure to write down the chemical used and the date it was used. This information provides good accounting and will be needed at the time the plastic waste will be delivered at the collection area. In the same sheet, the date of installation and the date of removal of the plastic from the field should be reported as well.
Guidelines for the removal and storage of Agricultural Plastics (AP) at the farm
• The quality of the plastic depends highly on been free from contamination. The Farmer should try to avoid the soil and the plants during the removal of the plastic from the field. The Farmer should also try to separate any ropes and other materials attached to the plastic. Removal using a machine can save time and avoid contaminating of the plastic with soil,
41
stones, vegetation, etc. Several suggestions are going to be uploaded the AWARD Project website, or provided with the training material according to the particular product.
• With previous agreement with the collection area, it is possible to roll or fold the plastic removed in tight bunches helps their handling (see Figures on next page 10). Use plastic ropes - not wires - to tighten them up.
• Do not mix the different kinds of plastic materials (i.e. plastic films and ropes or pipes or even different kind of plastic films) otherwise they will not be accepted at the collection area because they will require additional work to be processed. Concentrate the different kinds of AP in separate piles.
Temporary storage Wastes must be grouped according to similar categories in the place of production (farm) in such a way as to prevent leakage, pollution of soil and water, sanitation problems in general, damage to property or persons . The wastes of different types should not be mixed with one another or hazardous waste can be mixed with non-hazardous waste.
The maximum temporary storage maximum, within the farm, is fixed at the value of:
10 cubic meters of hazardous waste that means an area of 5 x 2 x 1 mt
20 cubic meters of non-hazardous waste, that means an area of 5 x 2 x 2 mt
Disposal must be made these quantities are reached, and no later than 12 months after their production.
The temporary storage must be carried out on the site where the waste is produced and may consist of a warehouse or a covered shed with waterproof floor, or in a "dedicated area", well defined and not accessible to non-experts. It is not allowed to transport waste from a production site to another.
Guidelines for the transportation and delivery of the plastics at the collection area
• Make sure that the collection station is open. Ask if the collection station accepts the plastic that is intended to be discarded on the particular date, or follow the announced program for delivery of agricultural plastics from the BAT Province.
• The Farmer could use, if authorized, his/her means to transport the plastic from the field to the collection station. Do not mix the plastics upon loading them in the truck. The plastics should be accompanied by their purchase and data keeping records provided by the supplier. Without these records and invoices, the collected material will not be accepted.
• Alternatively, follow the arrangements made by the Manager of the collection area or the arrangement made by the exporter of the products, in case such arrangements are applicable, so that they collect the APW directly from the fields and transport them at the collection area. In this case, provide the transporter with the record and the copies of the invoices so that he delivers them along with APW to the collection area. All guidelines described above for the use, removal and storage should be observed strictly in this case.
42
• Upon arrival at the collection area, contact the Manager. He will first weigh the truck and then guide the Farmer. The Farmer needs to provide the Manager with the purchase documents and the data keeping records provided by the supplier (pesticides used, date of initial installation and date of removal from the field).
• The Manager will inspect visually the truck and if the material is confirmed as “accepted” he will direct it to the correct location in the collection area where that particular plastic waste could be unloaded.
• Upon emptying the truck, the Manager will reweigh the truck and record the weight of the plastic delivered and compare it with the amount of the plastic bought (invoices).
• The Manager will give a provisional certificate and send the final certificate by post the deliveries of the total amount of the agricultural plastic waste in the year will be completed.
• Pesticide or agrochemicals containers may be delivered under specific rules and conditions, as applicable, following the guidelines of the Manager.
Agricultural Film Recycling: Guidelines for the Process
There are four basic steps in the movement of agricultural films from farm to factory: (i) collection and hauling, (ii) sorting and baling, (iii) reclamation by cleaning and pelletizing, and finally (iv) manufacture of new products. However, there are variations to the route.
Collection and hauling can involve:
• farmer drop-off of materials on specific collection days or during certain periods of the year, • contract hauling from farms to a central collection site, arranged and paid by the farmers, • pick-up organized (and possibly paid for) by the recycling program, or • backhauling of films by the supplier, when bringing new films for the next season or at some
other time. Backhauling is also referred to as “buy-back” or as a “milk run.”
Hauling to a central collection area can occur before or after the handling steps (sorting and baling).
Baling can be done with a portable baler brought to the farm, by a semi-portable baler rented for occasional use at a local collection point, or by a stationary baler at a central recycling facility.
Cleaning could occur at any stage. Transportation and baling of clean materials is more cost efficient because the additional weight and bulk of non-recyclable contaminants are eliminated, but on-farm cleaning may be difficult and not completely effective. More rigorous cleaning may still be needed at the re-processing facility in order for the dairy films to be suitable for re-processing. Similarly, sorting of recyclable quality films from waste may be most efficient on-farm, but that would require a large time investment by people skilled in making such distinctions.
The route taken in any particular case will be a function of the equipment and facilities locally available and economically pragmatic for the scale of a recycling program. Is a compilation of quantitative measures pertinent to each of the four steps in the recycling process, drawn from a number of recycling programs and other sources of information.
43
Potential Collection Sites The collection for recycling rate indicates the minimum percentage of waste that has to be collected to meet the recycling target (s), also given the assumptions made on the other flexible parameters.
For example, in order to achieve the 45% recycling output rate, 70% of plastic packaging must be collected (with the pre-treatment and recycling efficiencies considered).
The only exception to this approach is the collection rate for WEEE, which is not calculated like the other plastic products, because there is a specific target for collection in EU legislation. This target is set to 85% of WEEE generated within the territory of MS, starting from 2019, and it is one of the possible collection target presented in 2012/19/EU Directive on WEEE. This specific target is selected because it is directly related to WEEE amounts and not to EEE put on the market as in the case of the other collection target of the WEEE directive: ‘the minimum collection rate to be achieved annually shall be 65% of the average weight of EEE placed on the market in the three preceding years in the Member State concerned’. These two targets are considered by the European Commission’s equivalent in the effort of meeting the collected quantities.
An ideal collection site would have the following characteristics:
• Staffing during collection periods by person(s) who would sort materials by quality, resin type and color; collect tipping fees if necessary, and maintain BMPs during storage and handling.
• Multi-functional to allow staff to occupy themselves with other projects, particularly if the drop- off period spans any length of time.
• Covered structure on-site. • sufficient space to accommodate delivery vehicles, loose film, a baler (if baling is to be done
on this site), and a dry van-type truck trailer • Large farms (or composting facilities, scrap dealers, etc.) could be suitable collection sites for
agricultural film. These facilities could either contract directly with a waste management group to supply a dumpster, or work through their local recycling agency.
The physical space needed for processing plastic film can be a major constraint for recycling agencies, companies, and the primary reason that some do not deal with this material. As a means of saving space, the Plastic Film Recovery Guide recommends storing loose film in a dry van (or enclosed truck trailer) at the collection site. While this would be sufficient for keeping the clean, homogeneous films generated from industrial and commercial sites out of the elements, it would be difficult to use such a space for handling of agricultural films, which also require room for sorting recyclable quality films from waste, as well as sorting by color and resin type.
Collection for recycling rate indicates the minimum percentage of waste that has to be collected to meet the recycling target (s), also given the assumptions made on the other flexible parameters.
For example, in order to achieve the 45% recycling output rate, 70% of plastic packaging must be collected (with the pre-treatment and recycling efficiencies considered).
44
The only exception to this approach is the collection rate for WEEE, which is not calculated like the other plastic products, because there is a specific target for collection in EU legislation. This target is set to 85% of WEEE generated within the territory of MS, starting from 2019, and it is one of the possible collection target presented in 2012/19/EU Directive on WEEE. This specific target is selected because it is directly related to WEEE amounts and not to EEE put on the market as in the case of the other collection target of the WEEE directive: ‘the minimum collection rate to be achieved annually shall be 65% of the average weight of EEE placed on the market in the three preceding years in the Member State concerned’. These two targets are considered by the European Commission’s equivalent in the effort of meeting the collected quantities.
Agricultural Film Recycling in Ilida Municipality: Steps in the Process Ilida agricultural production is basically oriented to strawberries and tomatoes Greenhouses. For this reason it is considered necessary to adjust the plastic waste management model to agricultural film elaboration by developing a comprehensive plan including the following parameters:
There are four basic steps in the movement of agricultural films from farm to factory
• Collection and hauling, • Sorting and baling, • Reclamation by cleaning and pelletizing, • Manufacture of new products.
(However, there are variations to the route depending on specific occasions of each plastic waste source.)
Collection and hauling can involve:
• farmer drop-off of materials on specific collection days or during certain periods of the year, • contract hauling from farms to a central collection site, arranged and paid by the farmers, • pick-up organized (and possibly paid for) by the recycling program, or • backhauling of films by the supplier, when bringing new films for the next season or at some
other time. Backhauling is also referred to as “buy-back” or as a “milk run.” • Hauling to a central collection area can occur before or after the handling steps (sorting and
baling).
Baling can be done with a portable baler brought to the farm, by a semi-portable baler rented for occasional use at a local collection point, or by a stationary baler at a central recycling facility.
Cleaning could occur at any stage. Transportation and baling of clean materials is more cost efficient because the additional weight and bulk of non-recyclable contaminants are eliminated, but on-farm cleaning may be difficult and not completely effective. More rigorous cleaning may still be needed at the re-processing facility in order for the dairy films to be suitable for re-processing. Similarly, sorting of recyclable quality films from waste may be most efficient on-farm, but that would require a large time investment by people skilled in making such distinctions.
45
The route taken in any particular case will be a function of the equipment and facilities locally available and economically pragmatic for the scale of a recycling program. Is a compilation of quantitative measures pertinent to each of the four steps in the recycling process, drawn from a number of recycling programs and other sources of information.
Pre-treatment process efficiency The pre-treatment process efficiency is relatively high for the packaging waste stream.
The pre-treatment efficiency for packaging waste from households is 75% and that of commercial/industrial post-consumer packaging is 95% according to a recent study by Expra (2014). Taking into consideration that the split between post- consumer plastic packaging waste from households and commercial sources is 62%/38%3in EU-28, the pre-treatment efficiency of 82% is considered for the packaging waste stream in the model Baseline situation.21
For all the other waste streams, given the lack of data available, estimations were made with consultation of PRE. In the case of WEEE and ELV, the steps of dismantling and shredding precede that of sorting and the plastics that are collected can be then forwarded to a sorting facility for further sorting into different resins.
There is a certain percentage of loss during the dismantling stage that usually ends up to incineration or landfilling, which is reflected in reduced efficiency rates in these two waste streams. It is estimated that the pre-treatment process efficiency of ELV waste stream is about 50%.
Considering the high growth rate of these waste streams and the pressure put into treatment facility operators to improve efficiencies, the sorting rate is projected to increase considerably in the future scenarios. Specifically for the WEEE plastics waste stream, the pre -treatment efficiency rate is a calculated value (because there are two targets imposed at different steps in the WEEE stream and it is directly related to the targets set out in the recast of the WEEE Directive 2012/19/EU. Considering the 2020 targets for collection (85% of generated WEEE) and the ‘Output ’recycling rate (where 45% is estimated to be a realistic recycling target for plastics for WEEE, see section 3.1), a minimum pre -treatment efficiency of 61% is required by 2020 in order to achieve the recycling targets, according to the model. The pre-treatment efficiencies for all waste streams are considered to increase in the future scenarios, taking into consideration prospective improvements in the sorting/dismantling processes and advances in technology that would enable higher yields without compromising the quality of sorting, producing better sorted material with fewer contaminants. An important issue which needs to be tackled effectively in the coming years for the improvement of the sorting yields is the efficient sorting of black plastics. Today, it is not possible to sort black plastic effectively and high volumes of these materials are lost from potential recycling.
21 Expra (2014).
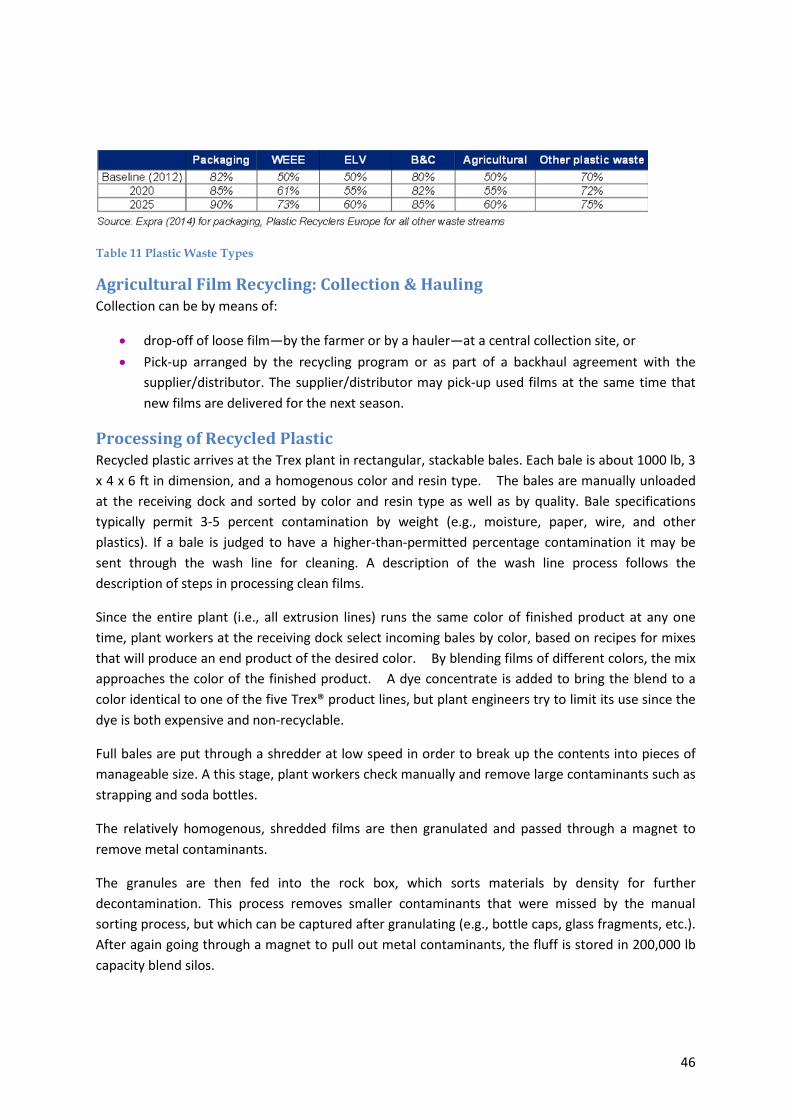
46
Table 11 Plastic Waste Types
Agricultural Film Recycling: Collection & Hauling Collection can be by means of:
• drop-off of loose film—by the farmer or by a hauler—at a central collection site, or • Pick-up arranged by the recycling program or as part of a backhaul agreement with the
supplier/distributor. The supplier/distributor may pick-up used films at the same time that new films are delivered for the next season.
Processing of Recycled Plastic Recycled plastic arrives at the Trex plant in rectangular, stackable bales. Each bale is about 1000 lb, 3 x 4 x 6 ft in dimension, and a homogenous color and resin type. The bales are manually unloaded at the receiving dock and sorted by color and resin type as well as by quality. Bale specifications typically permit 3-5 percent contamination by weight (e.g., moisture, paper, wire, and other plastics). If a bale is judged to have a higher-than-permitted percentage contamination it may be sent through the wash line for cleaning. A description of the wash line process follows the description of steps in processing clean films.
Since the entire plant (i.e., all extrusion lines) runs the same color of finished product at any one time, plant workers at the receiving dock select incoming bales by color, based on recipes for mixes that will produce an end product of the desired color. By blending films of different colors, the mix approaches the color of the finished product. A dye concentrate is added to bring the blend to a color identical to one of the five Trex® product lines, but plant engineers try to limit its use since the dye is both expensive and non-recyclable.
Full bales are put through a shredder at low speed in order to break up the contents into pieces of manageable size. A this stage, plant workers check manually and remove large contaminants such as strapping and soda bottles.
The relatively homogenous, shredded films are then granulated and passed through a magnet to remove metal contaminants.
The granules are then fed into the rock box, which sorts materials by density for further decontamination. This process removes smaller contaminants that were missed by the manual sorting process, but which can be captured after granulating (e.g., bottle caps, glass fragments, etc.). After again going through a magnet to pull out metal contaminants, the fluff is stored in 200,000 lb capacity blend silos.
47
X. Alternative Uses of Agriculture Recycled Plastic
What are BMPs for Agricultural Films? Critical points to cover in a BMP guide are the need to store plastics away from UV light, moisture and additional dirt, and to collect films when they are dry—since moist films act as a magnet for contaminants. Care should be taken to prevent exposure to manure, which one re-processor saw as the major constraint to their re-processing of silage bags. The practicality and impact of suggestions to reduce contamination—such as cutting silage bags horizontally to separate the bottom portion from the less-contaminated sides and top—should be explored and incorporated into BMPs if effective.
Waste-to-Energy Waste-to-energy (WTE) is a means of disposal that involves the controlled burning of high Btu waste products to provide energy in the forms of steam or electricity. It is an established technology: More than half of the solid waste generated on Long Island, New York, is now disposed by WTE processing (American Ref-fuel undated), and more than 70 percent of waste in Denmark and Switzerland is incinerated for energy recovery.54 Plastic resins have a very high energy content, approximately double the average gross heat value for coal and nearly twice that of rubber, three times that of wood, and five times the average of municipal solid waste (MSW)
Although WTE processing is a means of extracting additional use and value from waste materials, it is not considered to be recycling. We did not investigate the economic, legal or environmental issues of WTE in any depth for this study. However, because of the marginal quality of much used agricultural plastic, we recommend that WTE be critically evaluated as an off-farm disposal option. To facilitate such assessments, we have provided links to additional sources of information about WTE. We also outline several particular concerns and issues regarding WTE that arose in course of this study.
Since tipping fees for WTE are typically comparable or higher than landfilling fees, WTE cannot be thought of as an income-generating or cost-saving measure for the agricultural community. However, WTE contributes to the domestic energy supply and offers an off-farm disposal option for non-recyclables (e.g., for very contaminated LDPE films and mixed resin agricultural plastics).
A study funded by the National Watermelon Board found an 85:1 energy balance from a system of collecting used mulch films, processing them into nuggets, and burning the plastic at high temperature with coal.
Issues re: a WTE Component to an Agricultural Film Recycling Program • Landfill option. In some areas, farmers are not permitted to landfill large films because the
films become entangled in landfill equipment or (ii) disposal is precluded due to perception or reality of pesticide residue. Thus WTE may be the only off-farm disposal option.
• Landfill quotas. Since marginal-quality agricultural films would likely have been disposed on-farm, and thus would not have contributed to county landfill quotas, the issue may arise of how to account for their disposal if materials are diverted to a waste-to-energy facility.
48
I.e., would diversion of waste agricultural plastics from landfill to waste-to-energy facilities provide a respite from the landfill quota contracts, similar to the allowance for recycled materials?
• Tipping fees. Particularly in its first years of operation when old materials stored on the farm may be collected, an agricultural film recycling program is likely to receive films that are too contaminated or degraded for recycling. The collection program is likely to proceed more smoothly and with better farmer participation in the future if (i) these materials are accepted, rather than turned away, and (ii) costs to the farmer (i.e., the tipping fee) are kept artificially low by some means of subsidy. Program planners should anticipate this scenario and determine who should be responsible for these fees when incurred as part of a plastic film recycling program.
Re-Processing & Manufacture of New Products Re-processors, brokers and manufacturers are all potential markets for recycled films. They are considered together here because in some cases manufacturers of new products also reclaim the recycled film, pelletizing or grinding and cleaning it as needed for the production process. In other cases, recycling companies or agencies perform these steps, and then broker the sale of pellets or regrind to end- markets. In still other cases, brokers are intermediaries between the handling and reclaiming steps; i.e., they purchase bales of recycled films from recyclers and “shop it around” to find markets for re- processing and/or manufacture.
A full truckload containing 40,000 lb of cargo is the target “unit of exchange” referenced by most re- processing markets. To maximize transportation efficiency—i.e., in order to be able to fit at least 40,000 lb of plastic on a dry trailer—the minimum target bale density is 12-15 lb per cubic foot, with typically no more than 20 lb per square ft pressure. Bale weight is typically 900-1200 lb, which extrapolates to 38-42 bales per full truckload.
Products Made from Recycled Agricultural Films The most promising end-uses for recycled films are those that will not be compromised by the colors and contaminants of the used plastics. Such products include garbage and construction bags; agricultural bags, wraps and covers; lumber for uses that are neither decorative nor structural; construction materials like roof shingles and asphalt paving mix; mulch and playground chips, etc. Some of the technologies that will permit these uses are still under development. Market development for LDPE plastics in general lags behind that of other resins, and agricultural plastics are but a small proportion of the LDPE feedstock on the market.
Identifying Markets for Recycled Film There has been so much instability, growth, and change in the plastics recycling market over the past decades that authors of earlier reports about agricultural plastics recycling, and plastics recycling more generally, have lamented that the information they wrote about re-processing markets was out-of-date before it was published. The internet now enables access to current information in a way that the printed word could not. However, the fact of being listed (or not listed) on the web does not guarantee accuracy of the information, nor reliability of the firm.
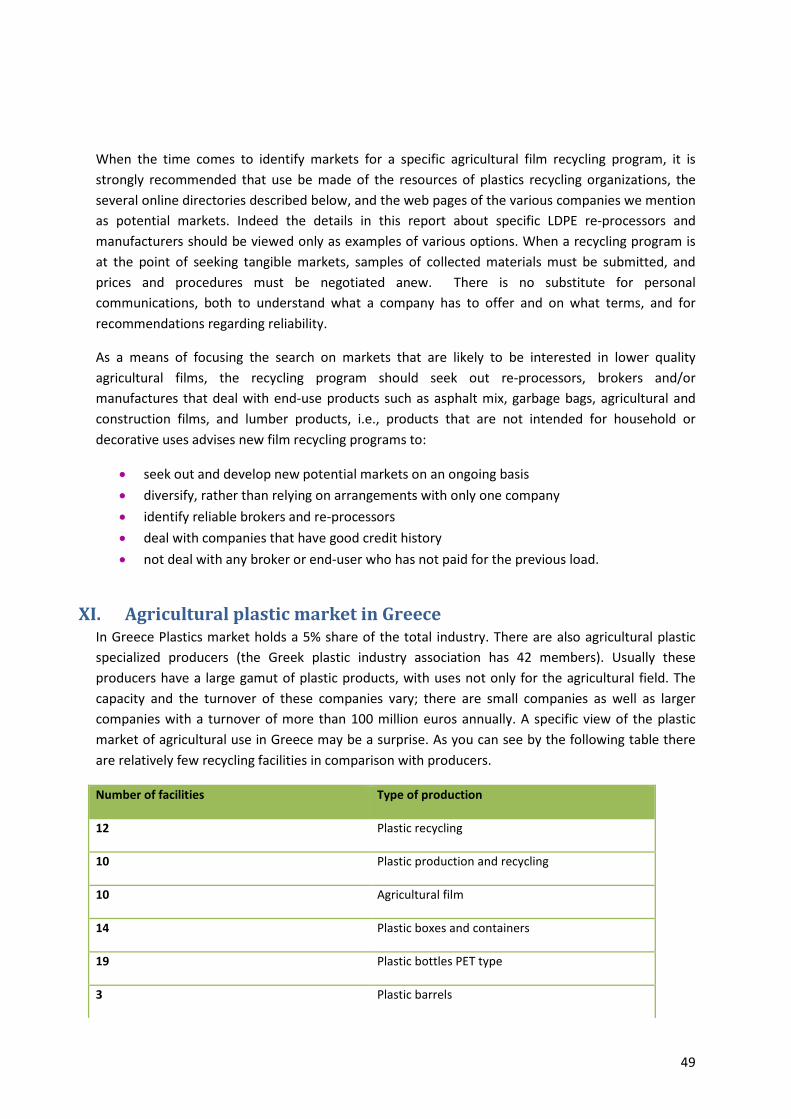
49
When the time comes to identify markets for a specific agricultural film recycling program, it is strongly recommended that use be made of the resources of plastics recycling organizations, the several online directories described below, and the web pages of the various companies we mention as potential markets. Indeed the details in this report about specific LDPE re-processors and manufacturers should be viewed only as examples of various options. When a recycling program is at the point of seeking tangible markets, samples of collected materials must be submitted, and prices and procedures must be negotiated anew. There is no substitute for personal communications, both to understand what a company has to offer and on what terms, and for recommendations regarding reliability.
As a means of focusing the search on markets that are likely to be interested in lower quality agricultural films, the recycling program should seek out re-processors, brokers and/or manufactures that deal with end-use products such as asphalt mix, garbage bags, agricultural and construction films, and lumber products, i.e., products that are not intended for household or decorative uses advises new film recycling programs to:
• seek out and develop new potential markets on an ongoing basis • diversify, rather than relying on arrangements with only one company • identify reliable brokers and re-processors • deal with companies that have good credit history • not deal with any broker or end-user who has not paid for the previous load.
XI. Agricultural plastic market in Greece In Greece Plastics market holds a 5% share of the total industry. There are also agricultural plastic specialized producers (the Greek plastic industry association has 42 members). Usually these producers have a large gamut of plastic products, with uses not only for the agricultural field. The capacity and the turnover of these companies vary; there are small companies as well as larger companies with a turnover of more than 100 million euros annually. A specific view of the plastic market of agricultural use in Greece may be a surprise. As you can see by the following table there are relatively few recycling facilities in comparison with producers.
Number of facilities Type of production
12 Plastic recycling
10 Plastic production and recycling
10 Agricultural film
14 Plastic boxes and containers
19 Plastic bottles PET type
3 Plastic barrels
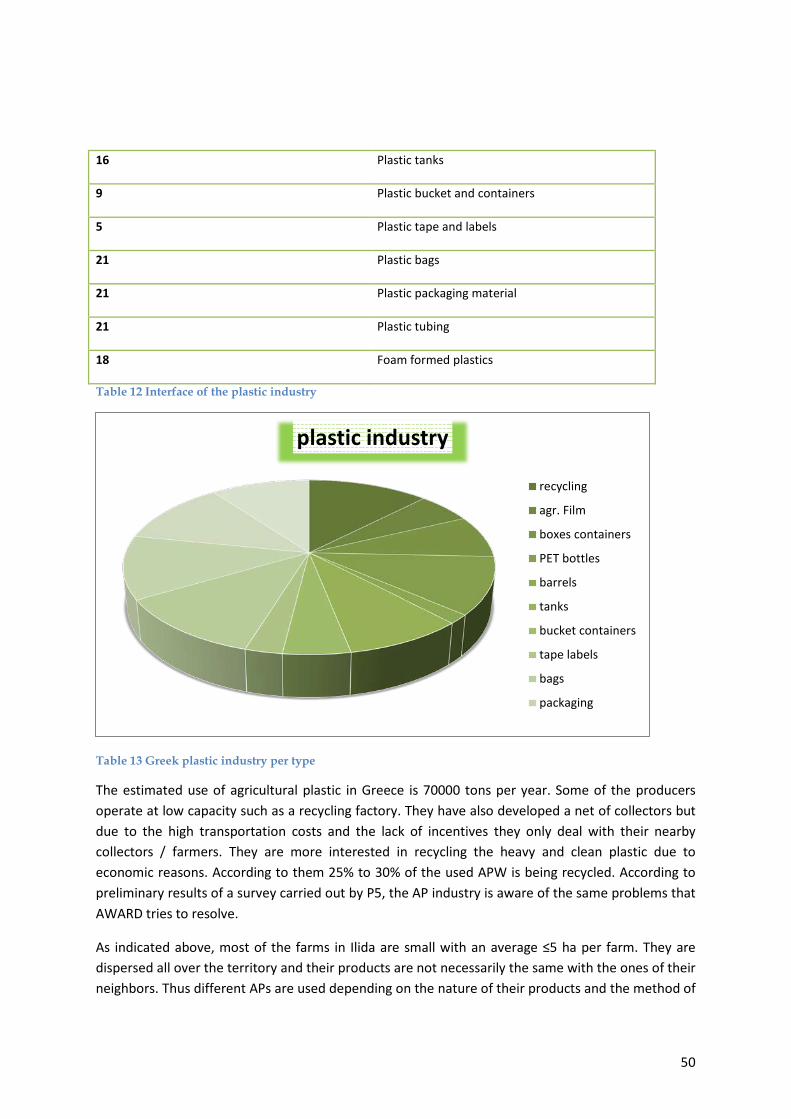
50
16 Plastic tanks
9 Plastic bucket and containers
5 Plastic tape and labels
21 Plastic bags
21 Plastic packaging material
21 Plastic tubing
18 Foam formed plastics
Table 12 Interface of the plastic industry
Table 13 Greek plastic industry per type
The estimated use of agricultural plastic in Greece is 70000 tons per year. Some of the producers operate at low capacity such as a recycling factory. They have also developed a net of collectors but due to the high transportation costs and the lack of incentives they only deal with their nearby collectors / farmers. They are more interested in recycling the heavy and clean plastic due to economic reasons. According to them 25% to 30% of the used APW is being recycled. According to preliminary results of a survey carried out by P5, the AP industry is aware of the same problems that AWARD tries to resolve.
As indicated above, most of the farms in Ilida are small with an average ≤5 ha per farm. They are dispersed all over the territory and their products are not necessarily the same with the ones of their neighbors. Thus different APs are used depending on the nature of their products and the method of
plastic industry
recycling
agr. Film
boxes containers
PET bottles
barrels
tanks
bucket containers
tape labels
bags
packaging
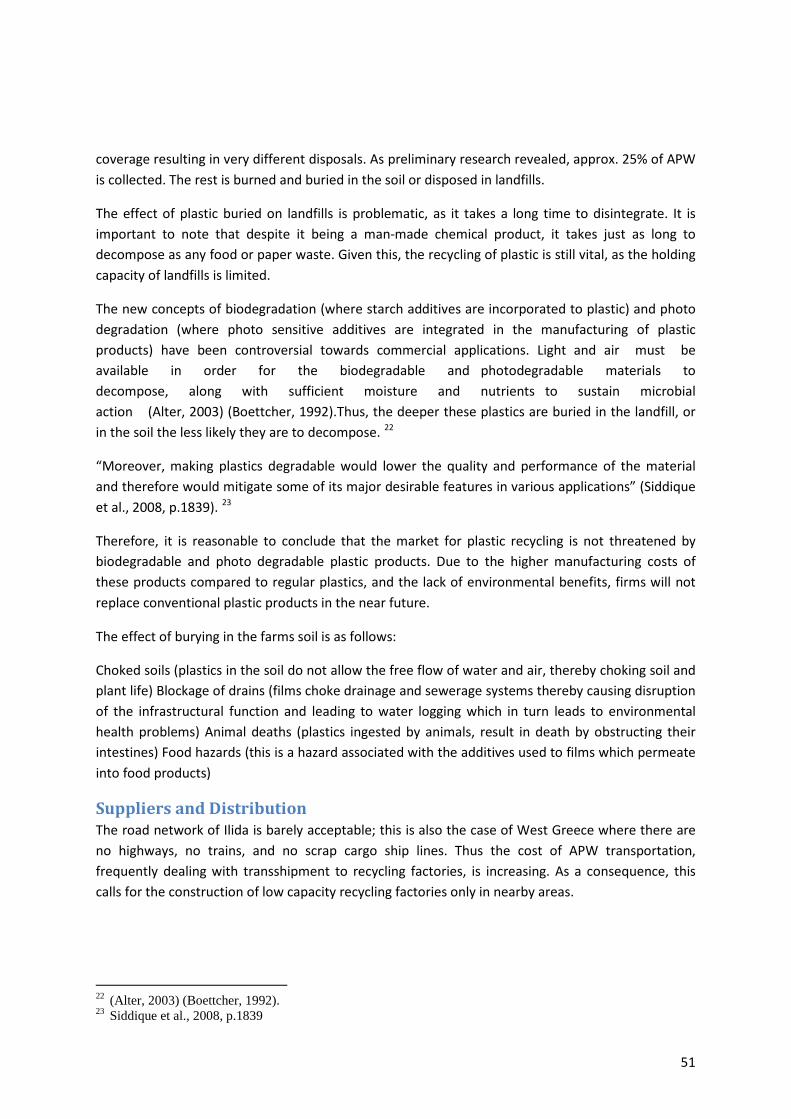
51
coverage resulting in very different disposals. As preliminary research revealed, approx. 25% of APW is collected. The rest is burned and buried in the soil or disposed in landfills.
The effect of plastic buried on landfills is problematic, as it takes a long time to disintegrate. It is important to note that despite it being a man-made chemical product, it takes just as long to decompose as any food or paper waste. Given this, the recycling of plastic is still vital, as the holding capacity of landfills is limited.
The new concepts of biodegradation (where starch additives are incorporated to plastic) and photo degradation (where photo sensitive additives are integrated in the manufacturing of plastic products) have been controversial towards commercial applications. Light and air must be available in order for the biodegradable and photodegradable materials to decompose, along with sufficient moisture and nutrients to sustain microbial action (Alter, 2003) (Boettcher, 1992).Thus, the deeper these plastics are buried in the landfill, or in the soil the less likely they are to decompose. 22
“Moreover, making plastics degradable would lower the quality and performance of the material and therefore would mitigate some of its major desirable features in various applications” (Siddique et al., 2008, p.1839). 23
Therefore, it is reasonable to conclude that the market for plastic recycling is not threatened by biodegradable and photo degradable plastic products. Due to the higher manufacturing costs of these products compared to regular plastics, and the lack of environmental benefits, firms will not replace conventional plastic products in the near future.
The effect of burying in the farms soil is as follows:
Choked soils (plastics in the soil do not allow the free flow of water and air, thereby choking soil and plant life) Blockage of drains (films choke drainage and sewerage systems thereby causing disruption of the infrastructural function and leading to water logging which in turn leads to environmental health problems) Animal deaths (plastics ingested by animals, result in death by obstructing their intestines) Food hazards (this is a hazard associated with the additives used to films which permeate into food products)
Suppliers and Distribution The road network of Ilida is barely acceptable; this is also the case of West Greece where there are no highways, no trains, and no scrap cargo ship lines. Thus the cost of APW transportation, frequently dealing with transshipment to recycling factories, is increasing. As a consequence, this calls for the construction of low capacity recycling factories only in nearby areas.
22 (Alter, 2003) (Boettcher, 1992). 23 Siddique et al., 2008, p.1839
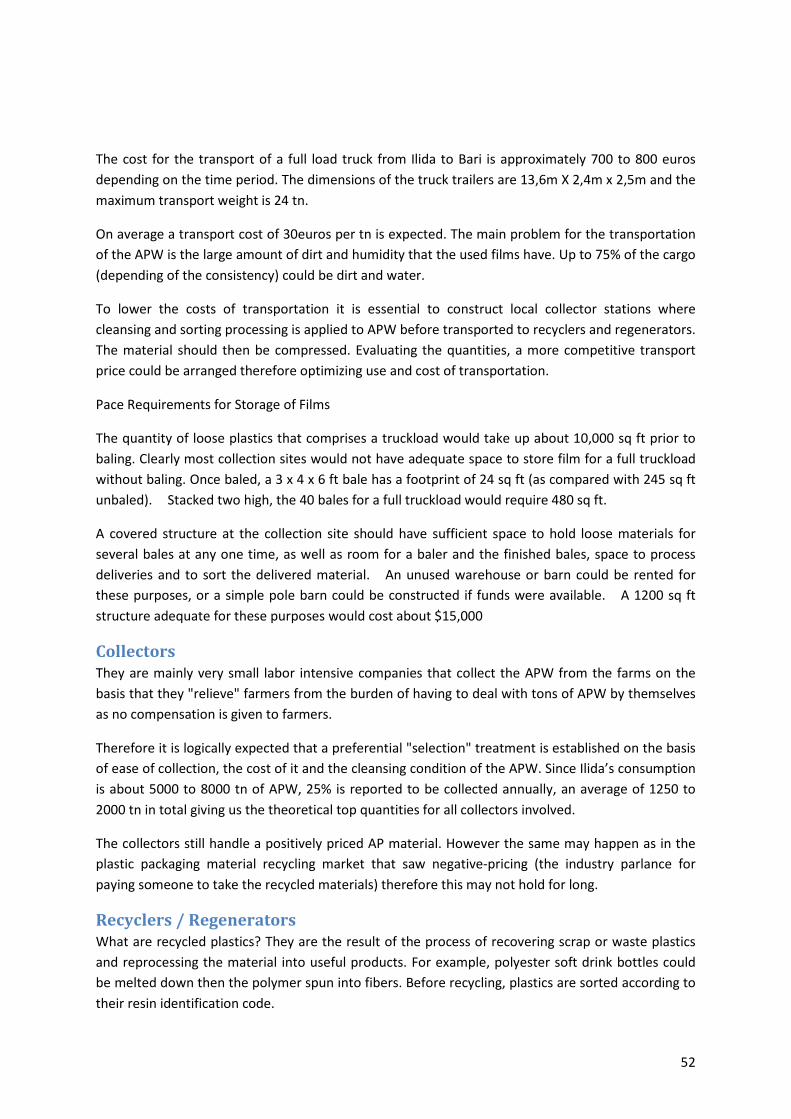
52
The cost for the transport of a full load truck from Ilida to Bari is approximately 700 to 800 euros depending on the time period. The dimensions of the truck trailers are 13,6m X 2,4m x 2,5m and the maximum transport weight is 24 tn.
On average a transport cost of 30euros per tn is expected. The main problem for the transportation of the APW is the large amount of dirt and humidity that the used films have. Up to 75% of the cargo (depending of the consistency) could be dirt and water.
To lower the costs of transportation it is essential to construct local collector stations where cleansing and sorting processing is applied to APW before transported to recyclers and regenerators. The material should then be compressed. Evaluating the quantities, a more competitive transport price could be arranged therefore optimizing use and cost of transportation.
Pace Requirements for Storage of Films
The quantity of loose plastics that comprises a truckload would take up about 10,000 sq ft prior to baling. Clearly most collection sites would not have adequate space to store film for a full truckload without baling. Once baled, a 3 x 4 x 6 ft bale has a footprint of 24 sq ft (as compared with 245 sq ft unbaled). Stacked two high, the 40 bales for a full truckload would require 480 sq ft.
A covered structure at the collection site should have sufficient space to hold loose materials for several bales at any one time, as well as room for a baler and the finished bales, space to process deliveries and to sort the delivered material. An unused warehouse or barn could be rented for these purposes, or a simple pole barn could be constructed if funds were available. A 1200 sq ft structure adequate for these purposes would cost about $15,000
Collectors They are mainly very small labor intensive companies that collect the APW from the farms on the basis that they "relieve" farmers from the burden of having to deal with tons of APW by themselves as no compensation is given to farmers.
Therefore it is logically expected that a preferential "selection" treatment is established on the basis of ease of collection, the cost of it and the cleansing condition of the APW. Since Ilida’s consumption is about 5000 to 8000 tn of APW, 25% is reported to be collected annually, an average of 1250 to 2000 tn in total giving us the theoretical top quantities for all collectors involved.
The collectors still handle a positively priced AP material. However the same may happen as in the plastic packaging material recycling market that saw negative-pricing (the industry parlance for paying someone to take the recycled materials) therefore this may not hold for long.
Recyclers / Regenerators What are recycled plastics? They are the result of the process of recovering scrap or waste plastics and reprocessing the material into useful products. For example, polyester soft drink bottles could be melted down then the polymer spun into fibers. Before recycling, plastics are sorted according to their resin identification code.
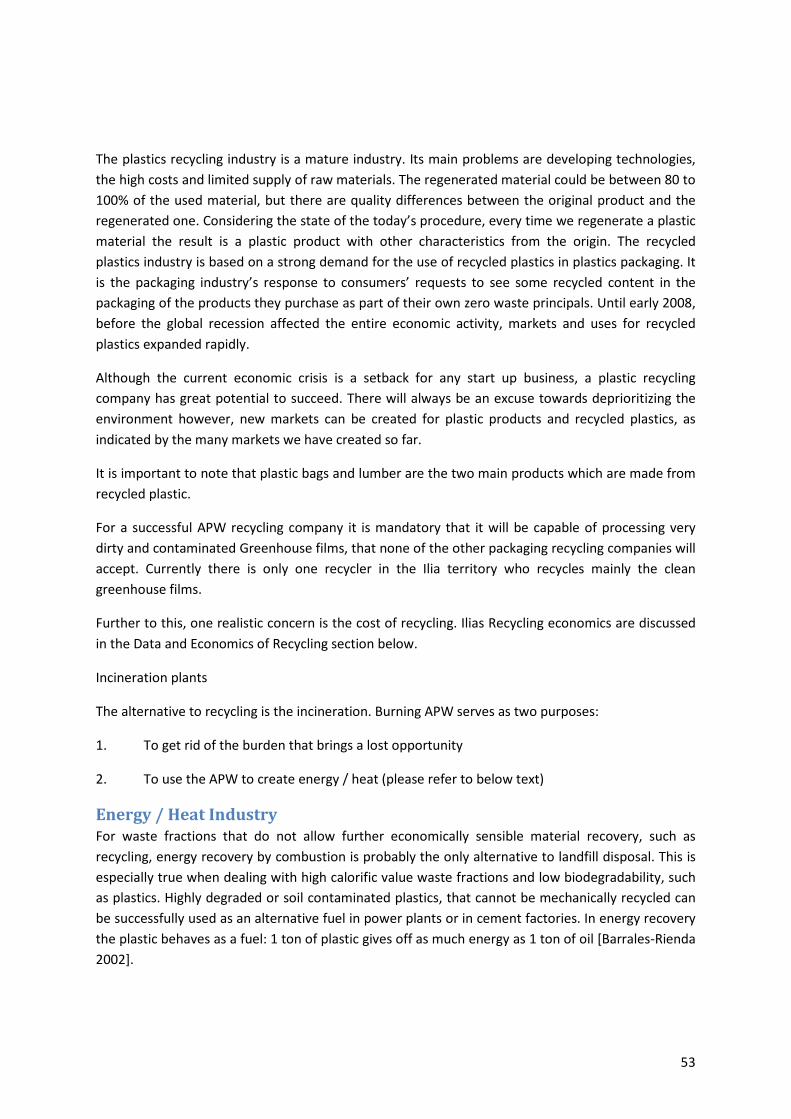
53
The plastics recycling industry is a mature industry. Its main problems are developing technologies, the high costs and limited supply of raw materials. The regenerated material could be between 80 to 100% of the used material, but there are quality differences between the original product and the regenerated one. Considering the state of the today’s procedure, every time we regenerate a plastic material the result is a plastic product with other characteristics from the origin. The recycled plastics industry is based on a strong demand for the use of recycled plastics in plastics packaging. It is the packaging industry’s response to consumers’ requests to see some recycled content in the packaging of the products they purchase as part of their own zero waste principals. Until early 2008, before the global recession affected the entire economic activity, markets and uses for recycled plastics expanded rapidly.
Although the current economic crisis is a setback for any start up business, a plastic recycling company has great potential to succeed. There will always be an excuse towards deprioritizing the environment however, new markets can be created for plastic products and recycled plastics, as indicated by the many markets we have created so far.
It is important to note that plastic bags and lumber are the two main products which are made from recycled plastic.
For a successful APW recycling company it is mandatory that it will be capable of processing very dirty and contaminated Greenhouse films, that none of the other packaging recycling companies will accept. Currently there is only one recycler in the Ilia territory who recycles mainly the clean greenhouse films.
Further to this, one realistic concern is the cost of recycling. Ilias Recycling economics are discussed in the Data and Economics of Recycling section below.
Incineration plants
The alternative to recycling is the incineration. Burning APW serves as two purposes:
1. To get rid of the burden that brings a lost opportunity
2. To use the APW to create energy / heat (please refer to below text)
Energy / Heat Industry For waste fractions that do not allow further economically sensible material recovery, such as recycling, energy recovery by combustion is probably the only alternative to landfill disposal. This is especially true when dealing with high calorific value waste fractions and low biodegradability, such as plastics. Highly degraded or soil contaminated plastics, that cannot be mechanically recycled can be successfully used as an alternative fuel in power plants or in cement factories. In energy recovery the plastic behaves as a fuel: 1 ton of plastic gives off as much energy as 1 ton of oil [Barrales-Rienda 2002].
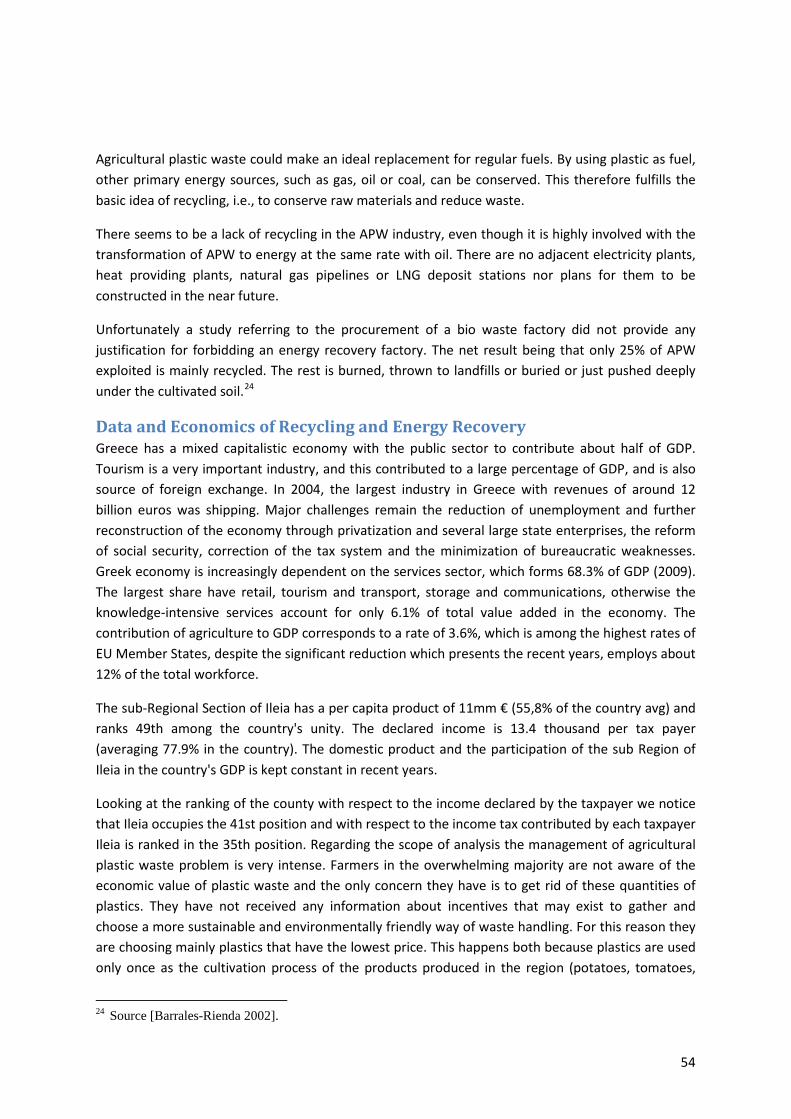
54
Agricultural plastic waste could make an ideal replacement for regular fuels. By using plastic as fuel, other primary energy sources, such as gas, oil or coal, can be conserved. This therefore fulfills the basic idea of recycling, i.e., to conserve raw materials and reduce waste.
There seems to be a lack of recycling in the APW industry, even though it is highly involved with the transformation of APW to energy at the same rate with oil. There are no adjacent electricity plants, heat providing plants, natural gas pipelines or LNG deposit stations nor plans for them to be constructed in the near future.
Unfortunately a study referring to the procurement of a bio waste factory did not provide any justification for forbidding an energy recovery factory. The net result being that only 25% of APW exploited is mainly recycled. The rest is burned, thrown to landfills or buried or just pushed deeply under the cultivated soil.24
Data and Economics of Recycling and Energy Recovery Greece has a mixed capitalistic economy with the public sector to contribute about half of GDP. Tourism is a very important industry, and this contributed to a large percentage of GDP, and is also source of foreign exchange. In 2004, the largest industry in Greece with revenues of around 12 billion euros was shipping. Major challenges remain the reduction of unemployment and further reconstruction of the economy through privatization and several large state enterprises, the reform of social security, correction of the tax system and the minimization of bureaucratic weaknesses. Greek economy is increasingly dependent on the services sector, which forms 68.3% of GDP (2009). The largest share have retail, tourism and transport, storage and communications, otherwise the knowledge-intensive services account for only 6.1% of total value added in the economy. The contribution of agriculture to GDP corresponds to a rate of 3.6%, which is among the highest rates of EU Member States, despite the significant reduction which presents the recent years, employs about 12% of the total workforce.
The sub-Regional Section of Ileia has a per capita product of 11mm € (55,8% of the country avg) and ranks 49th among the country's unity. The declared income is 13.4 thousand per tax payer (averaging 77.9% in the country). The domestic product and the participation of the sub Region of Ileia in the country's GDP is kept constant in recent years.
Looking at the ranking of the county with respect to the income declared by the taxpayer we notice that Ileia occupies the 41st position and with respect to the income tax contributed by each taxpayer Ileia is ranked in the 35th position. Regarding the scope of analysis the management of agricultural plastic waste problem is very intense. Farmers in the overwhelming majority are not aware of the economic value of plastic waste and the only concern they have is to get rid of these quantities of plastics. They have not received any information about incentives that may exist to gather and choose a more sustainable and environmentally friendly way of waste handling. For this reason they are choosing mainly plastics that have the lowest price. This happens both because plastics are used only once as the cultivation process of the products produced in the region (potatoes, tomatoes,
24 Source [Barrales-Rienda 2002].
55
pumpkins, etc.) allow a single use and in addition there is a lack of awareness for the subsequent management. Most of these plastics have along their surface specific marking enabling rapid categorization, according to country of origin and quality. Farmers told us that we can very easily locate all the product information from the invoice of their purchase, so the traceability process is feasible. Having interviewed entrepreneurs collecting Agri-plastic-waste, even for the combustion process chosen by most farmers, we learned that the quantities of plastics are quite polluted by dirt (soil, agrochemicals and other materials).
Finally farmers are well informed about the price of agricultural products of all types (conventional, recycled, biodegradable, etc.), and because there is no single rational management plan or incentives to choose recycled products, they resort to the most economical solution.
There is a debate on PPP/PPPP in public services. Regarding this debate, it began in Greece officially on 2005 through publishing Law 3389/2005 (GG A’ 232/2005). Since then there is an increasing interest for PPP’s in solid waste management. The Greek Government has initiated the process of an international public tender for the appointment of a contractor for the treatment and management of the urban solid waste in the Attica region (www.patt.gov.gr), in Kozani and Thessaloniki (www.sdit.mnec.gr). The projects are proposed to be implemented through public-private partnerships25 (PPP), according to Law 3389/2005. The Greek State will contribute to funding for the project with community support an estimated 30% of project cost. The contractor will be paid based on the amount of incoming waste to achieve specific environmental objectives including the recycling targets and quality characteristics.
With regard to the cost of solid waste treatment, the current level of treatment tariffs ranges between 15 to 45 €/tone.26 The per ton charging is provided in article 9 of Law 3854/2010. The cost differs in rural and urban areas. The low end reflects the cost in metropolitan cities as e.g. Athens and the high end in integrated waste management facilities as e.g. those in Chania Crete. There is no landfill tax on similar financial incentives and the most attractive options are related to the renewable energy technologies and especially to anaerobic digestion. The pricing of power generated from renewable energy units is provided in Chapter D, article 13 of Law 3468/2006 (GG Α’ 129/2006).
XII. GREEN PAPER On a European Strategy on Plastic Waste in the Environment
The purpose of this Green Paper is to launch a broad reflection on possible responses to the public policy challenges posed by plastic waste which are at present not specifically addressed in EU waste legislation. The follow-up to the Green Paper will be an integral part of the wider review of the waste legislation that will be completed in 2014. This review will look at the existing targets for waste recovery and landfill as well as an ex-post evaluation of five directives covering various waste streams.
25 Source Law 3389/2005 26 Source Chapter D, article 13 of Law 3468/2006 (GG Α’ 129/2006).
56
The inherent characteristics of plastic create specific challenges for waste management. Plastic is relatively cheap and versatile with many industrial applications, leading to exponential growth over the past century; a trend that is set to continue. Secondly, plastic is a very durable material which outlives the products made of it. As a result, the generation of plastic waste is growing worldwide. The durability of plastic also means that uncontrolled disposal is problematic as plastic can persist in the environment for a very long time. The need to continue efforts to reduce the incidence and impacts of plastic in the marine environment was particularly highlighted at the Rio+20 Summit.
There are not only challenges, but also opportunities arising from better management of plastic waste. Although plastic is a fully recyclable material, only a small fraction of plastic waste is at present recycled. Enhanced recycling would contribute to the aims of the Roadmap to a Resource Efficient Europe adopted in 20111 and help to reduce greenhouse gas emissions and imports of raw materials and fossil fuels. Appropriately designed measures to recycle plastic can also improve competitiveness and create new economic activities and jobs.
This Green Paper will help reassess the environmental and human health risk of plastic in products when they become waste, addressing their environmentally sound design, both functionally and chemically, and open a reflection process on how to tackle the problem of uncontrolled disposal of plastic waste and marine litter. It should also help move forward the reflection on internalization of life-cycle impacts, from raw material extraction to the end of life phase, into the costs of plastic products.
The Commission launches this consultation in order to collect the facts, assess the stakes and to gather the views of all interested stakeholders on a phenomenon that has many dimensions.
Comments are invited on all or some aspects of the document. Specific questions are listed after each section on policy options.
Member States, the European Parliament, the European Economic and Social Committee and all other interested parties are invited to submit their views on the suggestions set out in this Green Paper. Contributions should be sent to the following address to reach the Commission by 7 June 2013 at the latest:
http://ec.europa.eu/environment/consultations/plastic_waste_en.htm.
Please note that the majority of references in this text based their data on official statistics from EUROSTAT and the EEA.
POLICY OPTIONS FOR IMPROVING MANAGEMENT OF PLASTIC WASTE IN EUROPE The Directive on Waste 2008/98/EC already paved the way for a new thinking in waste management. It establishes extended producer responsibility (Article 8) and describes strong and innovative drivers for sustainable production taking into account the full life cycle of products. Member States are encouraged to take legislative or non-legislative measures in order to strengthen re-use and the prevention, recycling and other recovery operations of waste. Producers should be
57
encouraged to engage in setting up acceptance points for end-oflife products. They may engage in waste management and take financial responsibility for that activity. They shall make information publicly available on the extent to which a product is re-usable and recyclable. Appropriate measures shall be taken to encourage the design of products in order to reduce their environmental impact and the generation of waste during production and subsequent use. Such measures may encourage development, production and marketing of products that are fit for multiple use, technically durable and fit for environmentally-safe end-of-life management.
The policy options presented in this section follow a life-cycle approach starting with plastic design. It is indeed clear that design of plastics and plastic products play a key role for sustainability and determine further stages in the life-cycle of plastics. For example, plastic recycling depends to a large extent on the composition of plastic materials and on the design of plastic products.
Application of the waste hierarchy to plastic waste management As a matter of principle, recycling of plastic waste is a better option than energy recovery or landfilling. Although under a life cycle perspective not all plastic waste may be suitable for recycling, there are no technical reasons why plastic should go to landfill rather than being recycled or exploited for energy recovery. This could be done through a gradual phasing out or a ban on landfilling plastic waste through an amendment to the Landfill Directive 1999/31/EC. Both options are already used for bio waste (phasing out) and tyres, liquids, explosives (ban).
Member States with landfill rates below 5%, such as Germany, the Netherlands, Sweden, Denmark, Belgium, and Austria achieve between 80% and 100% plastic waste recovery, including recycling. All of these countries have enacted measures leading effectively to a diversion of combustible waste from landfills, equivalent to a landfill ban. The majority of less performing Member States apply no such measures and base acceptance of waste in landfills on landfill taxes/fees sometimes as low as only 7€ per tonne.
However, some Member States with high recovery rates and landfill bans still have modest plastic recycling rates of around 28% on average50. The present ratio between plastic recycling and plastic waste energy recovery could be improved via measures on separate collection, sorting and material recovery. A landfill ban generating an automatic preponderance of energy recovery over recycling would not be in line with the waste hierarchy. It may be useful to reflect on how economic instruments could be used to steer the waste flow through the waste hierarchy, avoiding a "vacuum cleaner effect" in favour of waste to energy.
Nearly 50% on average of all plastic in the EU goes to landfill, most of it packaging. The widespread absence of separate waste collection and the lack of other alternatives in many 50 CONSULTIC Marketing & Industrieberatungs GmbH, Kunststoffabfälle und Recycling in Deutschland und Europa, Alzenau 2012.
EN 11 EN Member States help explain the high disposal rate of plastic in landfills51. Landfilled plastic contributes nothing to material recovery and energy recovery and is therefore highly resource inefficient. A study on European waste generation projections to 2035 assessed the introduction of
58
strong policies to extend recycling, and found plastic to have the largest potential for reducing the environmental impacts of waste52.
XIII. Biodegradable plastics Biodegradable plastic66 products are often perceived as a potential solution to plastic littering and have attracted increasing public attention. Although it is still a small segment of the market, production of biodegradable plastics operates today at industrial scale capacity, with a projected increase in Europe from 0.23 Mt/pa in 2007 to 0.93 Mt/pa in 201167.
The term "biodegradable" itself may be misunderstood by customers. While they might interpret the labelling "biodegradable" to mean fit for home composting, in reality, the large majority of biodegradable plastics can only biodegrade under very specific conditions of constantly high temperature and humidity in industrial composting installations and are neither fit for home composting nor do they decompose in reasonable time when littered68. A clear distinction between home-compostable and industrially-compostable plastics may be required, along with consumer education about proper disposal channels. Confusion could cause consumers to take insufficient care in their disposal out of a misunderstanding that objects labelled as biodegradable would decay within short time periods under natural conditions.
There are also biodegradability claims that should be scrutinized. For example, fragmentation of plastic enhanced with an oxidising agent (usually a metal salt) in the presence of oxygen, heat and UV light results in microscopic plastic fragments with similar properties as the bulk plastic. Oxo-degradation residues may have unclear impacts. Oxo-degradable plastics might risk contributing to the micro plastics load reaching the marine environment and therefore might significantly increase the risk of ingestion by animals. The presence of oxidizing agents in the plastic waste streams may also make plastic recycling more difficult. It should be assessed whether the use of the term biodegradable is at all permissible in this case.
Another open question is the extent to which biodegradable plastic can be a solution to plastic marine pollution. Decomposition in the marine environment depends on many factors, such as the type of product, the sufficient presence of relevant micro-organisms, the water temperature and the density of the product. In some Plastral Fidene trials, a starch-PCL72 blend was found to degrade in 20 to 30 weeks in Australian waters while being able to degrade in 20-30 days in compost. Moreover, many biodegradable plastics may not degrade in the intestines of marine species and injury is likely to remain an issue. There are several barriers for biodegradable plastics to achieve quick market penetration.
Without further technical progress in terms of their functional properties, they may not be suitable for some types of packaging applications, such as for fresh food. Existing manufacturing chains, used to petro-plastics, may need costly adaptation to function with biodegradable plastics. The exact influence of biodegradable plastic on aquatic environments, as well as compost toxicity, is yet further to be investigated. Waste treatment systems already in place are not yet capable of separating sufficiently biodegradable plastic from conventional plastic which can jeopardize
59
recycling processes. Technical adaptation might increase separation costs because more sophisticated equipment is likely to be required. As regards composting of bio degradable plastics, investment into composting facilities providing sufficient pre-processing and an adequate composting process would be needed.
What are the applications for which biodegradable plastics deserve to be promoted, what framework conditions should apply?
Would it be appropriate to reinforce existing legal requirements by making a clear distinction between naturally compostable and technically biodegradable plastics, and should such a distinction be subject to mandatory information?
Would the use of oxo-degradable plastic require any kind of intervention with a view to safeguarding recycling processes, and if so, on which level?
A generalization leads to questions based on a green paper (Brussels, 7.3.2013 COM (2013) 123 final) Can plastic be appropriately dealt with in the existing legislative framework for waste
management or does the existing legislation need to be adapted? How can measures to promote greater recycling of plastic best be designed so as to ensure
positive impacts for enhanced competitiveness and growth? Would full and effective implementation of the waste treatment requirements in the
existing landfill legislation reduce sufficiently current landfilling of plastic waste? What measures would be appropriate and effective to promote plastic re-use and recovery
over landfilling? Would a landfill ban for plastic be a proportionate solution or would an increase of landfill taxes and the introduction of diversion targets be sufficient?
What further measures might be appropriate to move plastic waste recovery higher up the waste hierarchy thereby decreasing energy recovery in favour of mechanical recycling? Would a tax for energy recovery be a useful measure?
Should separate door step collection of all plastic waste combined with pay-as- you-throw schemes for residual waste be promoted in Europe, or even be made mandatory?
Are specific plastic waste recycling targets necessary in order to increase plastic waste recycling? What other type of measures could be introduced?
Is it necessary to introduce measures to avoid substandard recycling or dumping of recyclable plastic waste exported to third countries?
Would further voluntary action, in particular by producers and retailers, be a suitable and effective instrument for achieving better resource use in the life cycle of plastic products?
Is there scope to develop deposit and return or lease systems for specific categories of plastic products? If so, how could negative impacts on competition be avoided?
What type of information would you consider necessary to empower consumers to make a direct contribution to resource efficiency when choosing a plastic product?
60
XIV. The human factor
The inhabitants The Awareness of the population in regards to the APW causing environmental problems is not satisfactory. The recycling logo on products does not really mean that the product is recyclable, it just denotes what type of plastic it is based on the number in the center and the plastic industry refuses to change the misunderstood symbol. Even though the benefits of recycling over disposal are manifold, individuals should keep in mind that it better serves the environment to “reduce and reuse” before “recycling” even becomes an option. The whole production, use, collection, transportation, recycling and energy recovery need to be considered as a system that provides incentives to anyone involved and be addressed accordingly. The various actors may seek to optimize their profit.
The Local Authorities In Greece most of LAs are involved in the collection and separation of the so called recycled materials. In terms of plastic waste this is come mainly by plastic packaging which is collected and landfilled or picked by companies for processing.
The LA of Ilias has planned to build a municipality waste management factory that will be able to process civil solid waste.
LAs have not acquired a net of heat / natural gas/ pipelines in West Greece. Therefore there are no corresponding energy recovery plants in the vicinity. A first step towards this is an analysis of the so called AWARD system, based on SWOT that will result to a decision making process and possibly to a well-defined Business, Management and Operating Plan of the "best" solution.
The beneficiary Typically the beneficiary is the eligible territory of Ilida. But in reality it is all the stakeholders mentioned above will benefit.
Opportunities • Establishment of a “Agri Plastic Waste System” • Labeling scheme for the agri plastic waste • Results of the European research project Labelagriwaste • Participation in public-private-people partnerships • New technologies utilization for services and operation upgrade • Favorable EU and state environmental legislation framework
Threats • Lack of environmental awareness • Lack of awareness of public-private-people partnerships schemes • Lack of efficient management • Lack of suitable strategic planning
61
• Interventions in long time planning
Ambiguity of the overall situation regarding the plastic waste management.
Briefly, the situation in the eligible area needs immediate attention as the problem is intensified considerably. Farmers need immediate guidance and awareness on the damages they accumulate at environmental and Public Health level. AWARD is expected to provide a feasible solution for AgriPlasticWaste reuse.
The decision makers need assistance in determining the course of implementing the measures according to the existing regulatory framework. Additionally, the general public and the farmers should be supported in understanding agri plastic waste value and contribution to public health. Furthermore, both groups should be supported in developing a consensus on accepting agri plastic waste plans.
The amount of plastic, used in agricultural production in the eligible area, combined with the gross value of output produced by the local primary sector, indicates the great need of elaborating the waste. The economic benefit that could be obtained by reusing or even distributing in market the refined plastic is significant. Of course the local public authorities which are responsible for agricultural plastic waste management must be compiled with the EU Legislation as well as the relevant EC Directives in order to apply the specific legal framework that will promote Agri plastic waste recycling.
Both financially and technically the management of agri waste plastic is feasible but socially the initiative jeopardized by the lack of awareness and support of local farmers, in this direction, a wide educational campaign has to be conducted in order to inform all local stakeholders and beneficiaries about the economic and environmental significance of such an initiative.
XV. Business Model In order to achieve the general and specific objectives of defining innovative strategies for the APW Management in the targeted aea, i.e. Ilida Municipality, here a specific business model is proposed. The basic idea is to collect and manage all APW from the Municipal and surrounding fields and farms under by applying a zero burning, landfilling and mulching tolerance policy. This policy is stimulated by Project AWARD, with the aim of enhancing a long term plan for transferring continuous flows of clean APW to the recyclers of the area by exploiting also the value of resins that could not be recycled through energy production. Another added value is the promotion of the application of European and international standards within a local plan, consisting of all necessary procedures to reach maximum reuse of Agricultural plastic in the area through recycling. The main stakeholders of this business model are:
• the citizens of Ilida Municipality as the key interest group interested for a healthy, clean environment, free from hazardous fumes
62
• the consumers of the agricultural products who wants healthy, nutritious and quality food for their families free from any plastic interference.
This supplementary value approach for the local farmers and the recyclers alike, combined with the auxiliary benefits provision for the customers of agricultural products will be also secured.
The market segment targeted, is the local recycling facilities who are interested and able to process an amount of approximately 6.400 tn of unexploited Agricultural plastic waste that is burned or landfilled in the fields. This plastic is a vast source of income for the recycling line. Only 20% of the Municipal APW is gathered for recycling proses annually while a percentage of 80% remain unexploited. Major goal of this idea is also to reach full capacity of the recycling facility that will be situated in the Municipality area, while it is also possible to gather more APW input as resource from neighbor Municipalities.
The segmentation of the Recycled APW market by type of resin means that the major advantage comes by processing specific plastics related to Agricultural production with major demand. PP, PVC, PET and PE have strong demand as refined products. Practically that means an existing relatively strong demand for APW reins of PP, PVC, PET and PE products.
The pricing policy will be drafted according to the price of each resin type in the market. It has to be noted that resins as unique products have different prices thus we cannot set a standard price. Tendencies in the price of the recycled resins could be tracked by microeconomic curves in order to draft a successful pricing policy.
The business model will be efficient maximizing the profit and the added value respect to the inputs, with a production cycle with the best conditions of safety and operations. The start-up will be expensive in terms of costs, because the business foresees a specific implantation as well as silos and trucks. Unique weak point of the business model is the price of the material that will change, in positive or negative, the revenues and then the profit.
XVI. Strategic recommendations for Sustainability of the Model
The presented model can be sustainable if only the following pre-conditions exist
a. The political commitment of the Regional and Local Authorities will be secured. To that direction the Municipal Authority of Ilida sent a Letter to the Vice Governor of the Region of Western Greece in order to support and provide solid and concrete evidence regarding the necessity of the operation of a collection and management Co-op.
63
b. All necessary actions have been initiated aiming to achieve a reference of the study’s outputs and conclusions to the Regional Plan for the Solid Waste Management (PESDA).
c. INNOPOLIS will support every initiative aiming at reaching the zero tolerance target regarding the APW Management in the Municipal Area of Ilida.
XVII. Bibliography 1. GREEN PAPER On a European Strategy on Plastic Waste in the Environment. Brussels,
7.3.2013 COM(2013) 123 final. EUROPEAN COMMISSION. 2. ELSTAT 3. EUROSTAT 4. Agricultural Plastics as Solid Waste: What are the Options for Disposal? Delbert D. Hemphill,
Jr. 5. THE MANAGEMENT OF AGRICULTURAL PLASTIC PACKAGING WASTE: A PILOT
EXPERIMENTATION IN SOUTHERN ITALY Carmela Sica1, Zoe Godosi, Pietro Picuno
64
6. HOW TO BOOST PLASTICS RECYCLING AND INCREASE RESOURCE EFFICIENCY? STRATEGY PAPER OF PLASTICS RECYCLERS EUROPE
7. http://www.plasticsrecyclers.eu 8. http://ec.europa.eu/environment/waste/ 9. http://ec.europa.eu/environment/waste/target_review.htm 10. http://www.plasticsconverters.eu/markets/agriculture 11. http://en.european-bioplastics.org/market/applications/agriculturehorticulture/ 12. http://en.european-bioplastics.org/wp-content/uploads/2013/publications/PositionPaper/E
uBP_PositionPaper_Waste.pdf 13. http://www.unep.org/ 14. Ypeka.gr National Waste Management Plan- "Convert waste into resources, promoting the
concept of circular economy in practice" Athens, 30/ 7/ 2015. 15. Law 4042/2012 (GG Α΄ 24/2012) on waste management 16. Waste Framework Directive 98/2008/EC and the Directive 99/2008/EC. Articles 2 to 9 17. Articles 10 to 48 of Law 4042/2012 18. Directive 2008/98/EC 19. Law 2939/2001 (GG A’ 179/2001). 20. 3852/10 (GG A’ 87/2010) 21. JMD 50910/2003 22. 75/442/EEC of 15 July 1975 on waste 23. Directive 2000/76/EC of the European Parliament and of the Council of 4 December 2000 on
the incineration of waste. 24. Directive 2000/76/E 25. Directive 2000/76/EC 26. Directive 2006/12/EC 27. Article 228 of the EC Treaty 28. 1999/31/EC of 26 April 1999 29. Article 15 of Directive 75/442/EEC about waste 30. The National Solid Waste Management Planning (JMD 50910/2727/2003) 31. Landfill Directive, 1999/31/EC - Directive 1999/31/EC of 26 April 1999 32. Packaging and Packaging Waste Directive, 94/62/EC 33. Commission Decision 1999/177/EC 34. Registration, Evaluation, Authorization and restriction of Chemicals (REACH), 1907/2006/E 35. Directive 2002/96/EC on Waste Electrical and Electronic Equipment 36. Directive 2000/53/EC, the End-of-Life Vehicles (ELV) Directive 37. Ecodesign Directive, 2005/32/EC, 2009/125/EC 38. Directive 2002/72/EC 39. Regulation on shipments of waste, (EC) 1013/2006 40. International Energy Agency (IEA) 41. Nordic Council, 2015 42. Waste Framework Directive 98/2008 43. Law [3854/2010]
65
44. PD 117, (GG A’ 82/2004) 45. MD 133480/14.11.2011 (GG B' 2711/2011) 46. Law 2939/2001 (GG A’ 179/2001) 47. JMD 80568/4225/1991 (GG B’ 641/1991) 48. JMD 7589/731/2000 (GG B’ 514/2000) 49. JMD 18083/1098 E.103 / 2003 (GG B’ 606/2003) 50. 2012/19/EU Directive on WEEE 51. Law 3389/2005 (GG A’ 232/2005) 52. Law 3854/2010 53. Chapter D, article 13 of Law 3468/2006 (GG Α’ 129/2006). 54. Auction House OF AGRICULTURE AND AQUACULTURE PRODUCTS - REGION OF WESTERN
GREECE 55. National Centre of Environment and Sustainable Development (NCESD), 2010 56. French study (ADEME, 2003) 57. Deloitte (2014) 58. TRIPTIC (2014) 59. Wageningen UR (2014) 60. Nordic Council (2014) 61. PVC Forum (2010), PRE 62. Eunomia et al. (2014) 63. Eco-Emballages (2014) 64. EeB Guide (2012) 65. Plastics Recyclers Europe 66. Eunomia et al., 2014 and CEWEP, 2014. 67. International Energy Agency (IEA) 68. IPCC, 2006 69. European Commission, 2006 70. CEWEP, 2014 71. Expra (2014). 72. (Alter, 2003) (Boettcher, 1992). 73. Siddique et al., 2008, p.1839 74. Barrales-Rienda 2002