economic empowerment of women in japan - united nations
TRANSCRIPT

Economic Empowerment Economic Empowerment of Women in Japanof Women in Japan
Shizuka TAKAMURA,Counsellor for Gender Equality AnalysisGender Equality Bureau Cabinet Office, Japan
4th Global Forum on Gender Statistics
27th March,2012
ContentsContents
0.The statistical system of Japan1.The Strategy for Rebirth of Japan2.Big Potential of Women3.Issues4.The way ahead
1
00. The statistical system of Japan. The statistical system of Japan
2
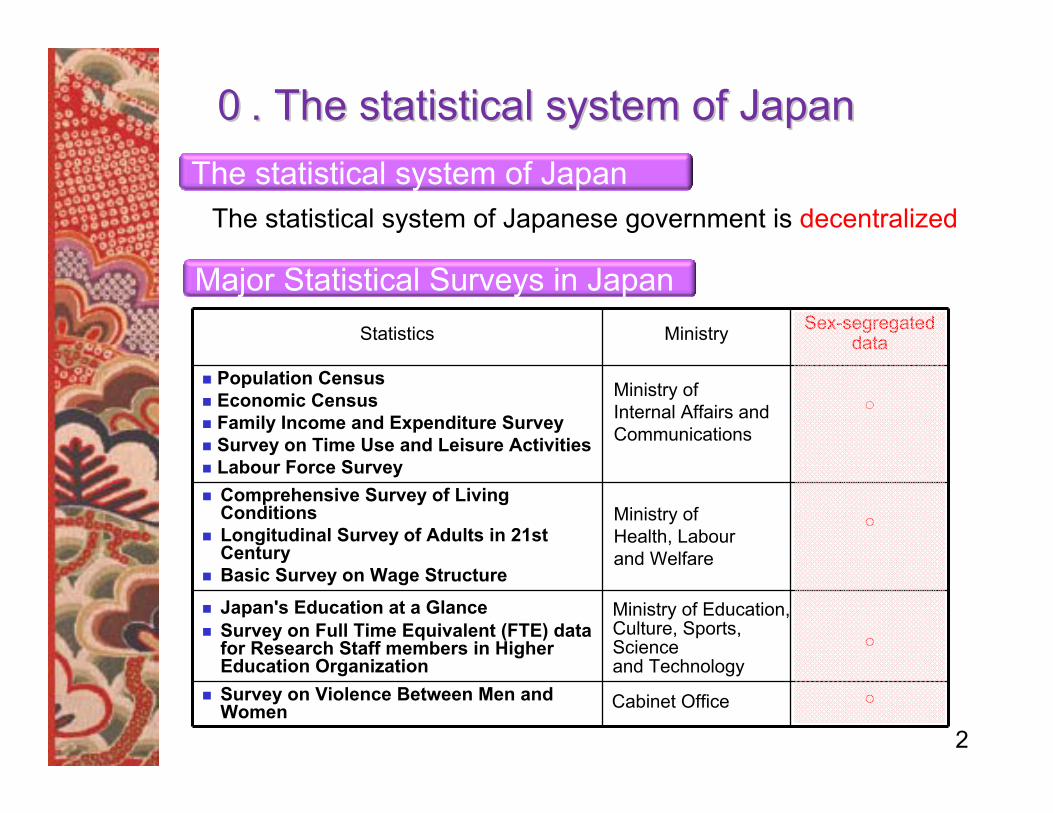
The statistical system of JapanThe statistical system of Japanese government is decentralized
Major Statistical Surveys in JapanStatistics Ministry Sex-segregated
data
Population CensusEconomic Census Family Income and Expenditure SurveySurvey on Time Use and Leisure ActivitiesLabour Force Survey
○
Comprehensive Survey of Living ConditionsLongitudinal Survey of Adults in 21st CenturyBasic Survey on Wage Structure
○
Japan's Education at a GlanceSurvey on Full Time Equivalent (FTE) data for Research Staff members in Higher Education Organization
○
Survey on Violence Between Men and Women Cabinet Office ○
Ministry of Internal Affairs andCommunications
Ministry of Health, Labour and Welfare
Ministry of Education, Culture, Sports, Science and Technology
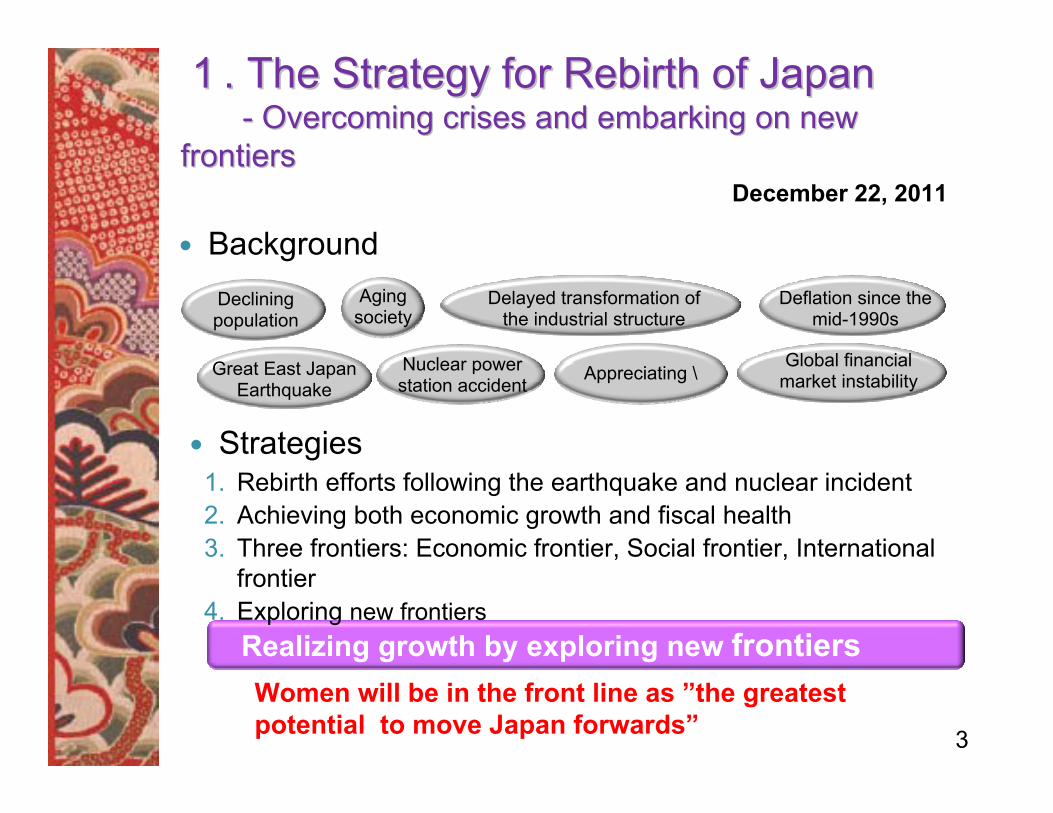
11. The Strategy for Rebirth of Japan. The Strategy for Rebirth of Japan-- Overcoming crises and embarking on new Overcoming crises and embarking on new
frontiersfrontiers
3
Women will be in the front line as ”the greatest potential to move Japan forwards”
December 22, 2011
Background
Strategies
Realizing growth by exploring new frontiers
1. Rebirth efforts following the earthquake and nuclear incident2. Achieving both economic growth and fiscal health3. Three frontiers: Economic frontier, Social frontier, International
frontier4. Exploring new frontiers
Declining population
Aging society
Delayed transformation of the industrial structure
Great East Japan Earthquake
Nuclear power station accident
Global financial market instability
Deflation since the mid-1990s
Appreciating \
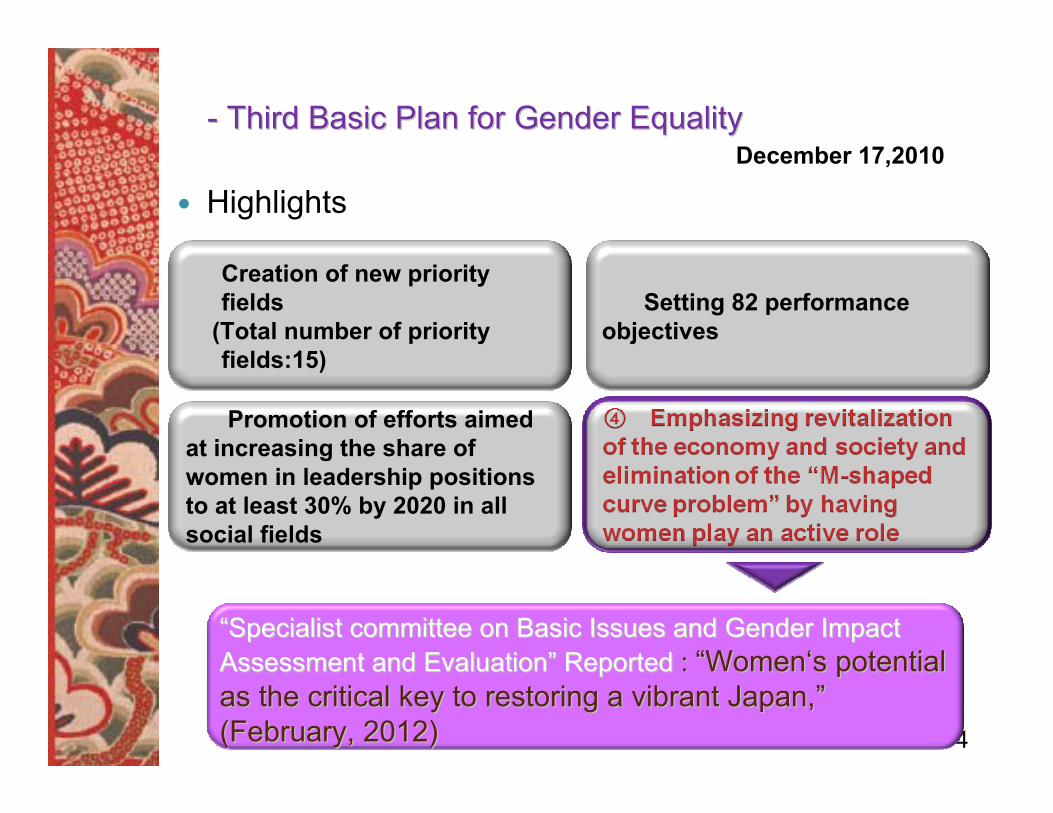
-- Third Basic Plan for Gender EqualityThird Basic Plan for Gender Equality
4
December 17,2010
Highlights
““Specialist committee on Basic Issues and Gender Impact Specialist committee on Basic Issues and Gender Impact Assessment and EvaluationAssessment and Evaluation”” Reported Reported : : ““WomenWomen‘‘s potential s potential as the critical key to restoring a vibrant Japan,as the critical key to restoring a vibrant Japan,””(February, 2012)(February, 2012)
� Promotion of efforts aimed at increasing the share of women in leadership positions to at least 30% by 2020 in all social fields
� Setting 82 performance objectives
� Creation of new priority fields
(Total number of priority fields:15)
22 Big potential of womenBig potential of women
5
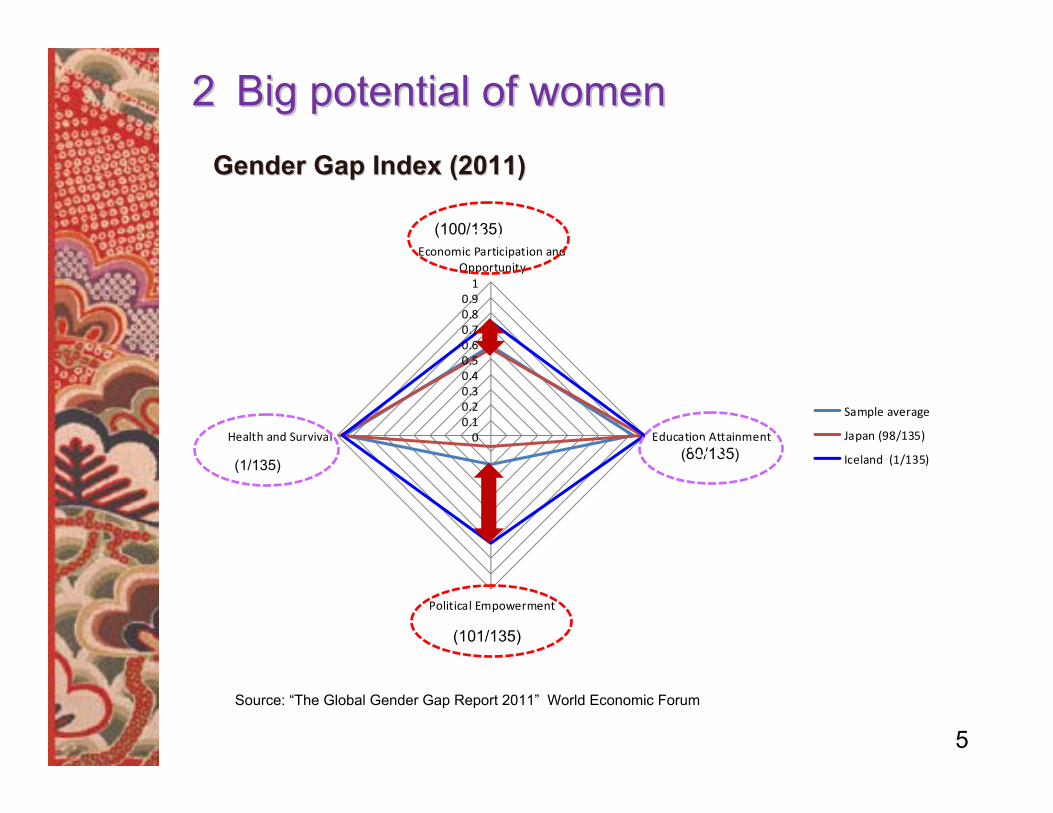
Gender Gap Index (2011)Gender Gap Index (2011)
00.10.20.30.40.50.60.70.80.91
Economic Participation andOpportunity
Education Attainment
Political Empowerment
Health and Survival
Sample average
Japan (98/135)
Iceland (1/135)
(100/135)
(1/135)
(101/135)
(80/135)
Source: “The Global Gender Gap Report 2011” World Economic Forum
Cc Cc
Cc
Cc
01,0002,0003,0004,0005,0006,0000~45~910~1415~1920~2425~2930~3435~3940~4545~4950~5455~5960~6465~6970~7475~7980~8585~8990~9495~99100~104105~
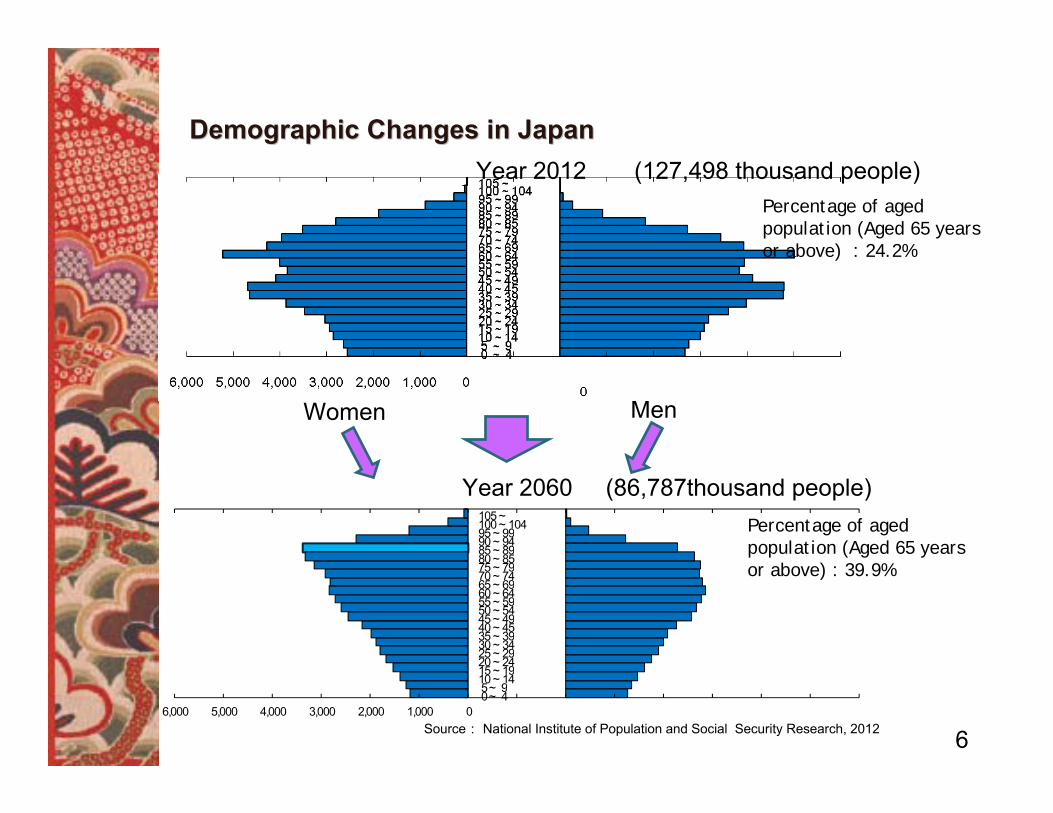
Demographic Changes in JapanDemographic Changes in Japan
6
Women Men
Source: National Institute of Population and Social Security Research, 2012
Year 2060 (86,787thousand people)
Year 2012 (127,498 thousand people)Percentage of aged population (Aged 65 years or above) : 24.2%
Percentage of aged population (Aged 65 years or above) : 39.9%
7
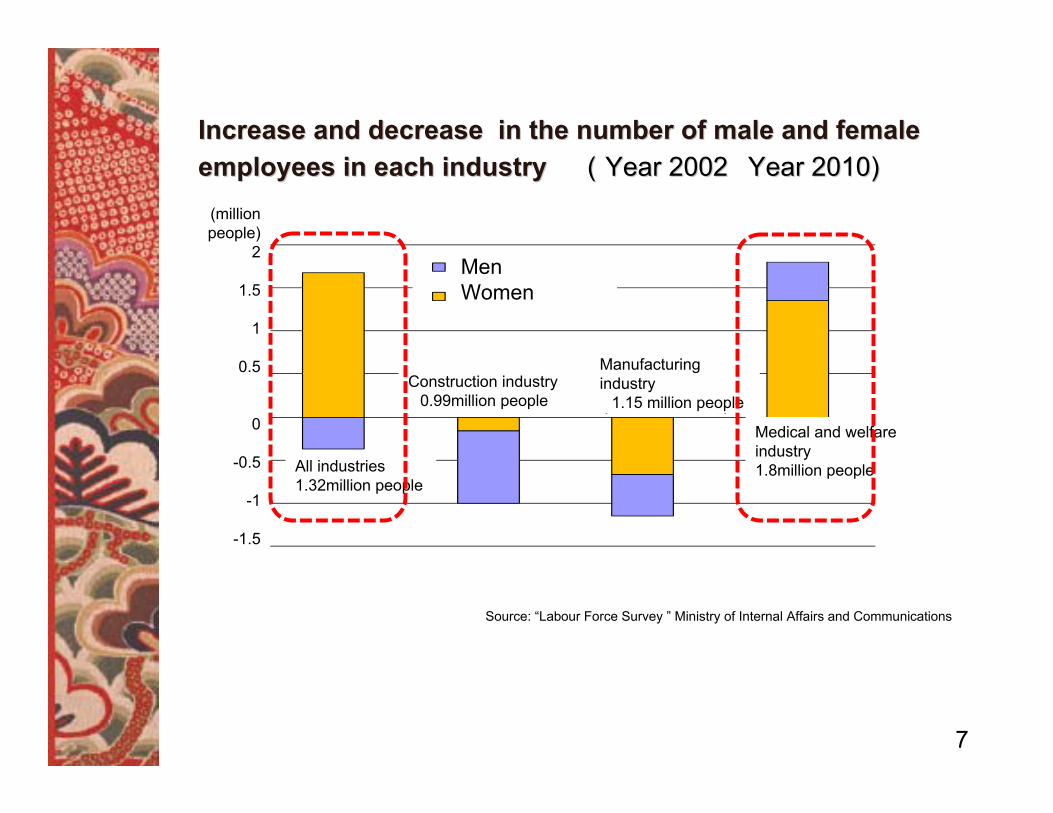
Increase and decrease in the number of male and female Increase and decrease in the number of male and female employees in each industryemployees in each industry ((Year 2002Year 2002��Year 2010)Year 2010)
- 150
- 100
- 50
0
50
100
150
200(万人)
男性女性
全産業(132万人)
建設業(-99万人)
製造業(-115万人)
医療・福祉(180万人)
All industries1.32million people
Construction industry�0.99million people
Manufacturing industry�1.15 million people
Medical and welfare industry1.8million people
MenWomen
(million people)
2
1.5
1
0.5
0
-0.5
-1
-1.5
Source: “Labour Force Survey ” Ministry of Internal Affairs and Communications
8
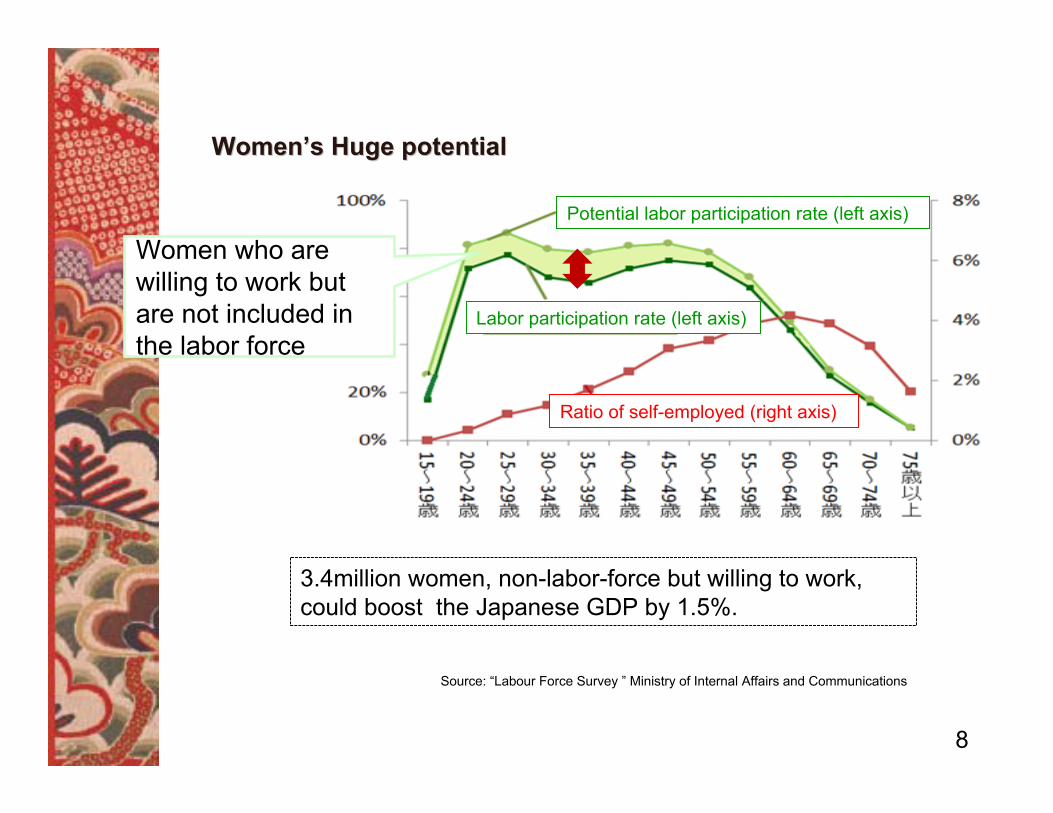
WomenWomen’’s Huge potentials Huge potential
Women who are willing to work but are not included in the labor force
3.4million women, non-labor-force but willing to work,could boost the Japanese GDP by 1.5%.
Ratio of self-employed (right axis)
Labor participation rate (left axis)
Potential labor participation rate (left axis)
Source: “Labour Force Survey ” Ministry of Internal Affairs and Communications
9
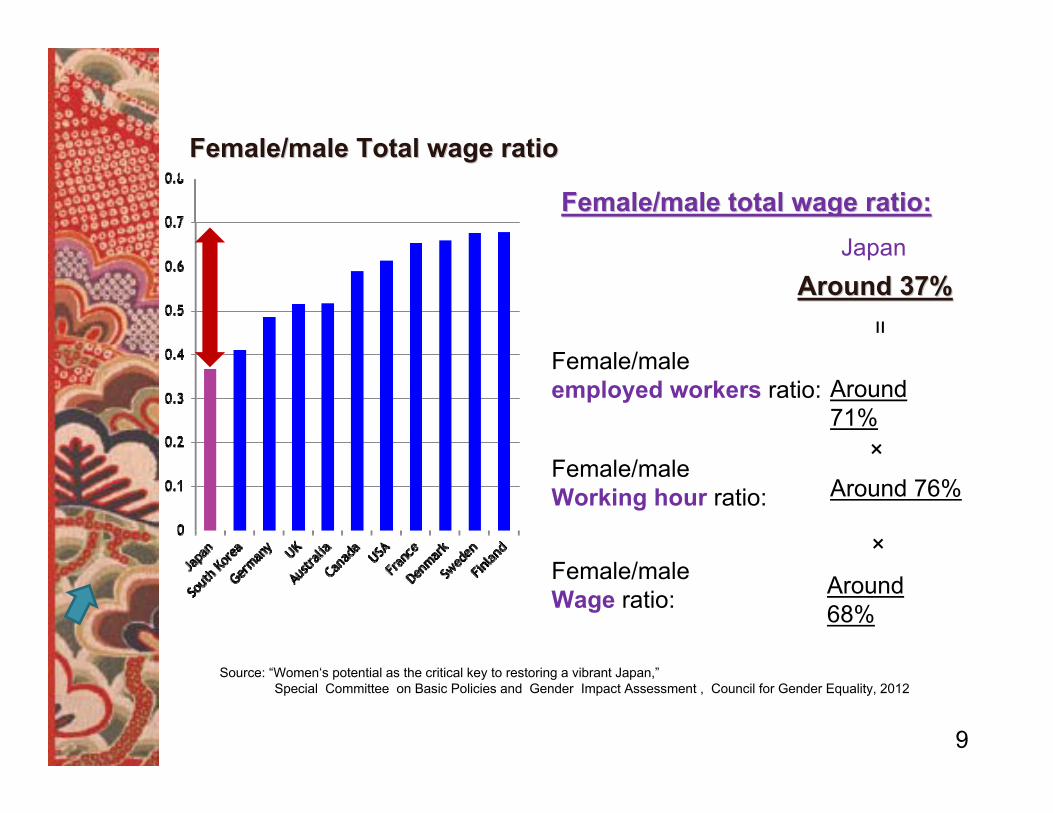
Female/male total wage ratio:Female/male total wage ratio:=
Female/male Total wage ratioFemale/male Total wage ratio
Japan
Around 71%
Female/male Working hour ratio:
Female/male employed workers ratio:
Female/male Wage ratio:
Around 76%
Around 68%
Around 37%Around 37%
×
×
Source: “Women‘s potential as the critical key to restoring a vibrant Japan,”Special Committee on Basic Policies and Gender Impact Assessment , Council for Gender Equality, 2012
10
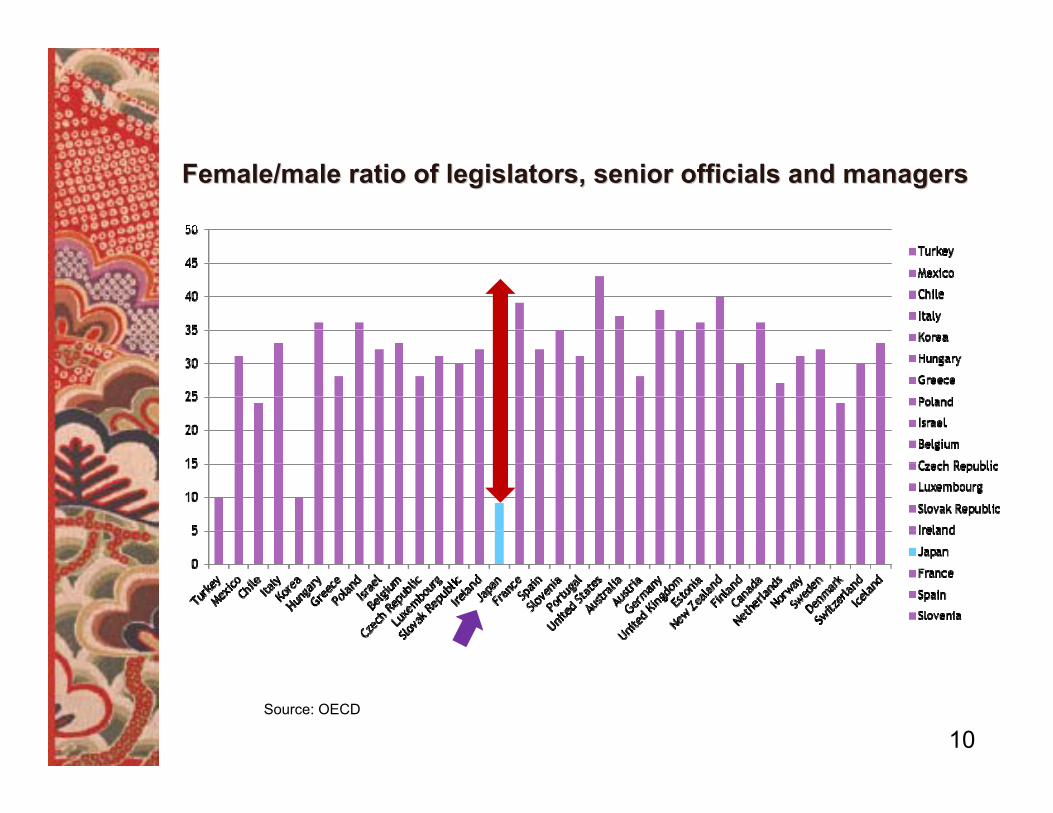
Female/male ratio of legislators, senior officials and managers Female/male ratio of legislators, senior officials and managers
Source: OECD
11
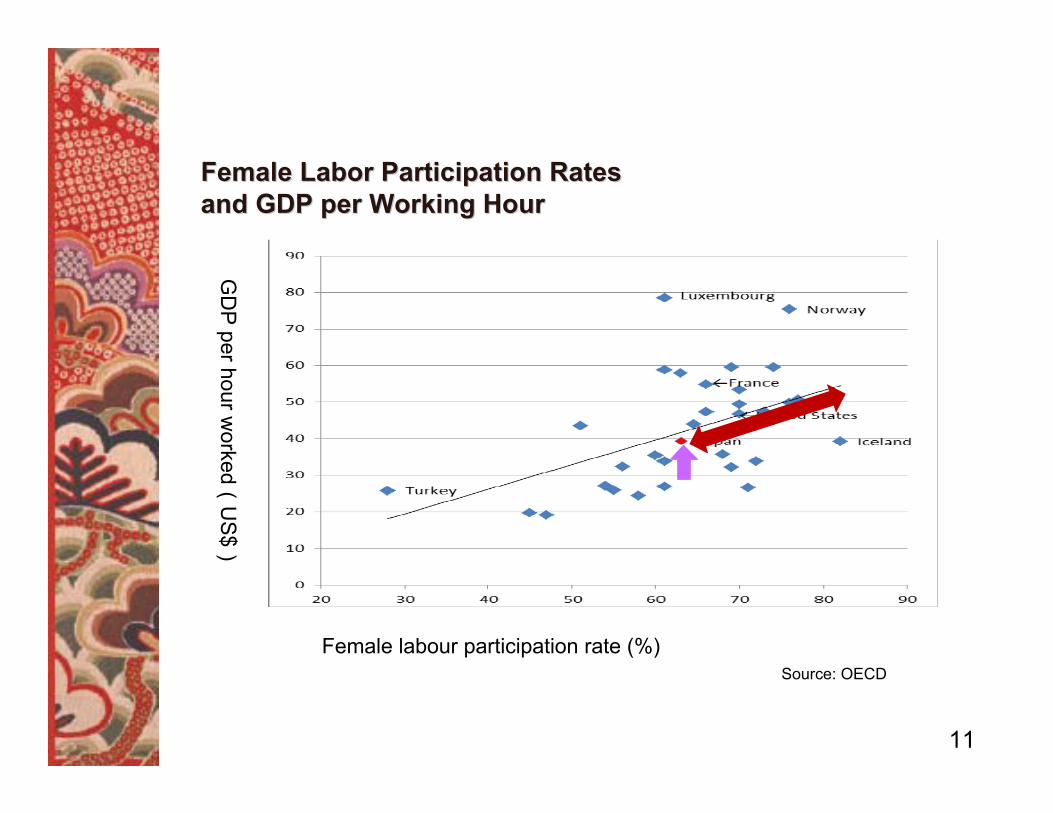
GD
P per hour w
orked(U
S$)
Female labour participation rate (%)Source: OECD
Female Labor Participation Rates Female Labor Participation Rates and GDP per Working Hourand GDP per Working Hour
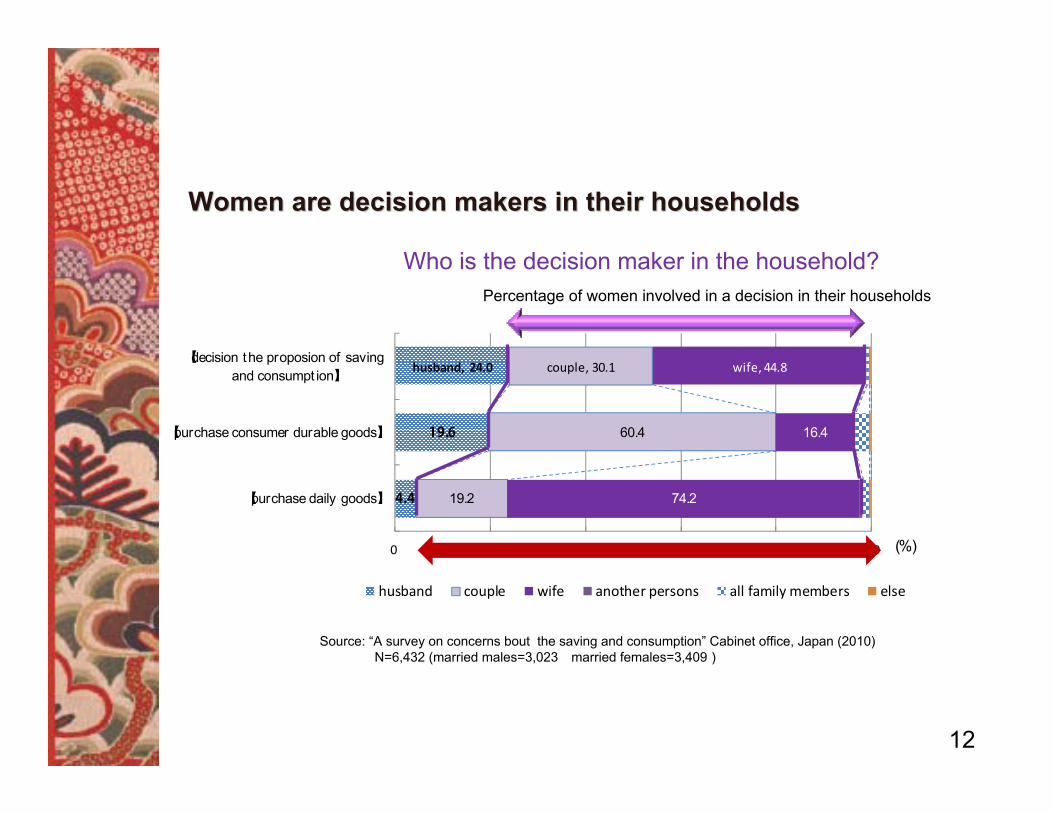
Percentage of women involved in a decision in their households
4.4
19.6
husband, 24.0
19.2
60.4
couple, 30.1
74.2
16.4
wife, 44.8
0 20 40 60 80 100
【purchase daily goods】
【purchase consumer durable goods】
【decision the proposion of savingand consumpt ion】
(%)
husband couple wife another persons all family members else
12
Women are decision makers in their householdsWomen are decision makers in their households
Source: “A survey on concerns bout the saving and consumption” Cabinet office, Japan (2010) N=6,432 (married males=3,023 married females=3,409)
Who is the decision maker in the household?
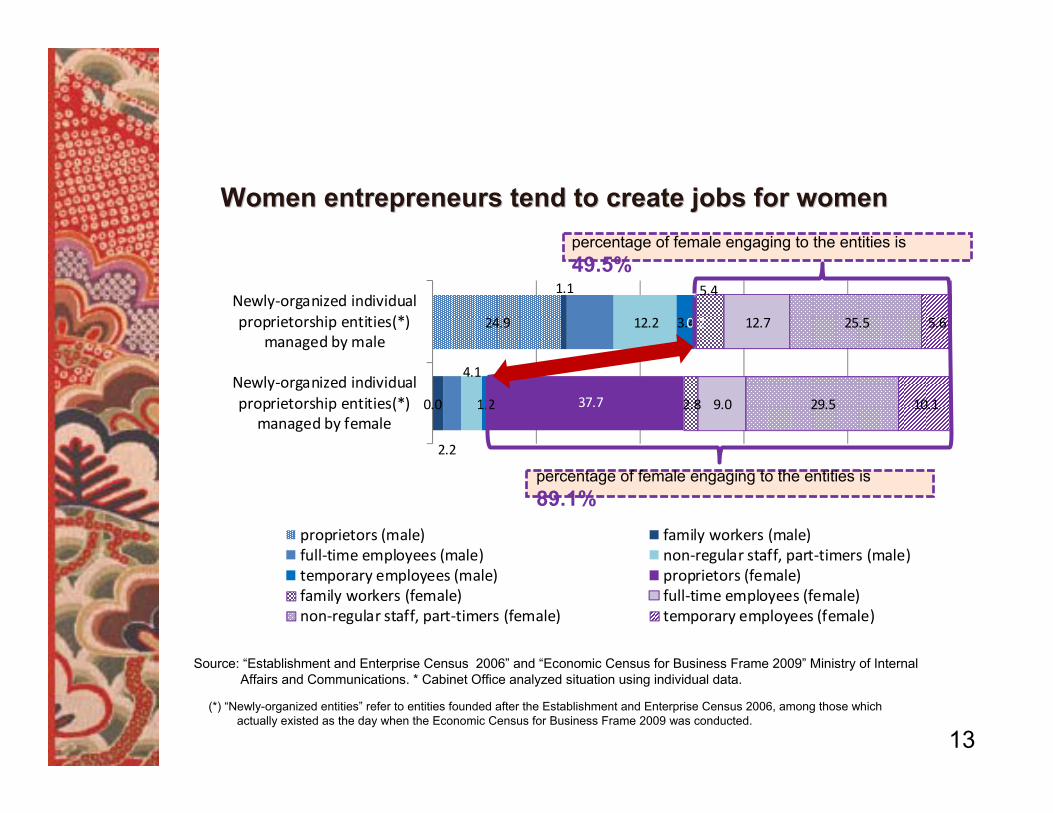
0.0
24.9
2.2
1.1
4.1
12.2
1.2
3.4
37.7
0.2
2.8
5.4
9.0
12.7
29.5
25.5
10.1
5.6
Newly‐organized individualproprietorship entities(*)
managed by female
Newly‐organized individualproprietorship entities(*)
managed by male
proprietors (male) family workers (male)full‐time employees (male) non‐regular staff, part‐timers (male)temporary employees (male) proprietors (female)family workers (female) full‐time employees (female)non‐regular staff, part‐timers (female) temporary employees (female)
13
Women entrepreneurs tend to create jobs for womenWomen entrepreneurs tend to create jobs for womenpercentage of female engaging to the entities is 49.5%
percentage of female engaging to the entities is 89.1%
Source: “Establishment and Enterprise Census 2006” and “Economic Census for Business Frame 2009” Ministry of Internal Affairs and Communications. * Cabinet Office analyzed situation using individual data.
(*) “Newly-organized entities” refer to entities founded after the Establishment and Enterprise Census 2006, among those which actually existed as the day when the Economic Census for Business Frame 2009 was conducted.
14
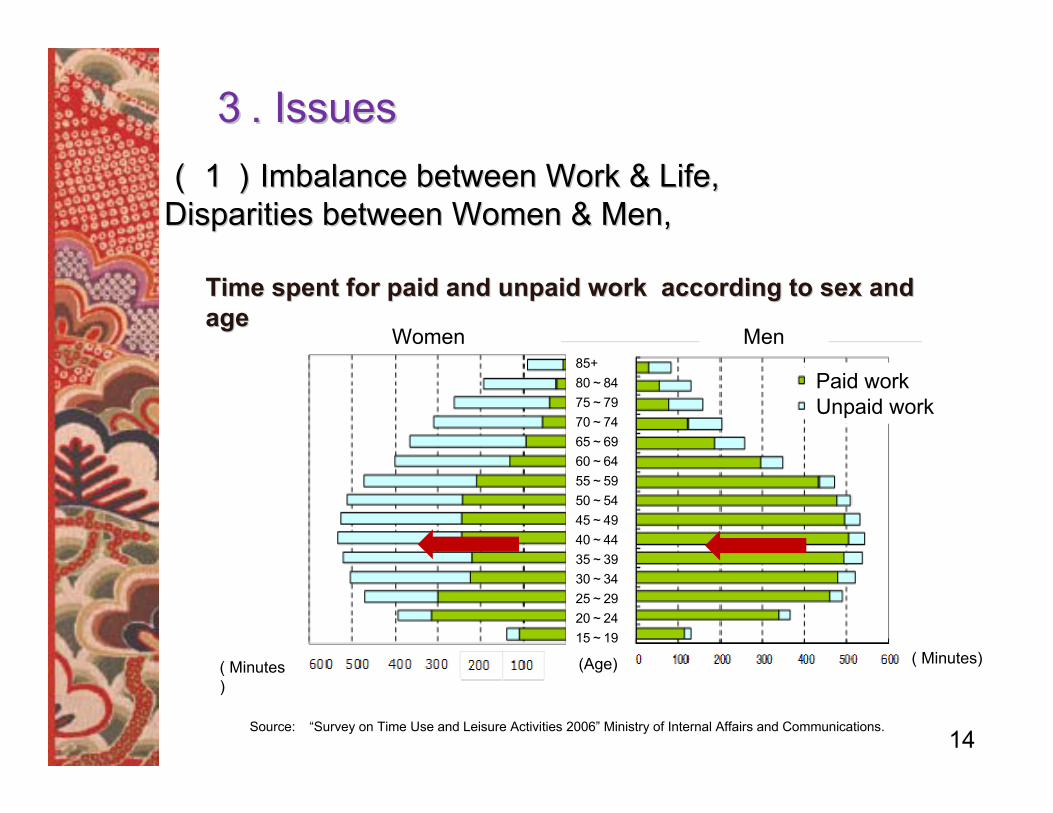
(1)(1)Imbalance between Work & Life, Imbalance between Work & Life, Disparities between Women & Men, Disparities between Women & Men,
33. Issues. Issues
Time spent for paid and unpaid work according to sex and Time spent for paid and unpaid work according to sex and ageage
(published by National Police Agency )
Women Men
Paid workUnpaid work
Source: “Survey on Time Use and Leisure Activities 2006” Ministry of Internal Affairs and Communications.
( Minutes)( Minutes)
(Age)
85+ 80~8475~79 70~7465~6960~6455~5950~5445~4940~4435~3930~3425~2920~2415~19
15
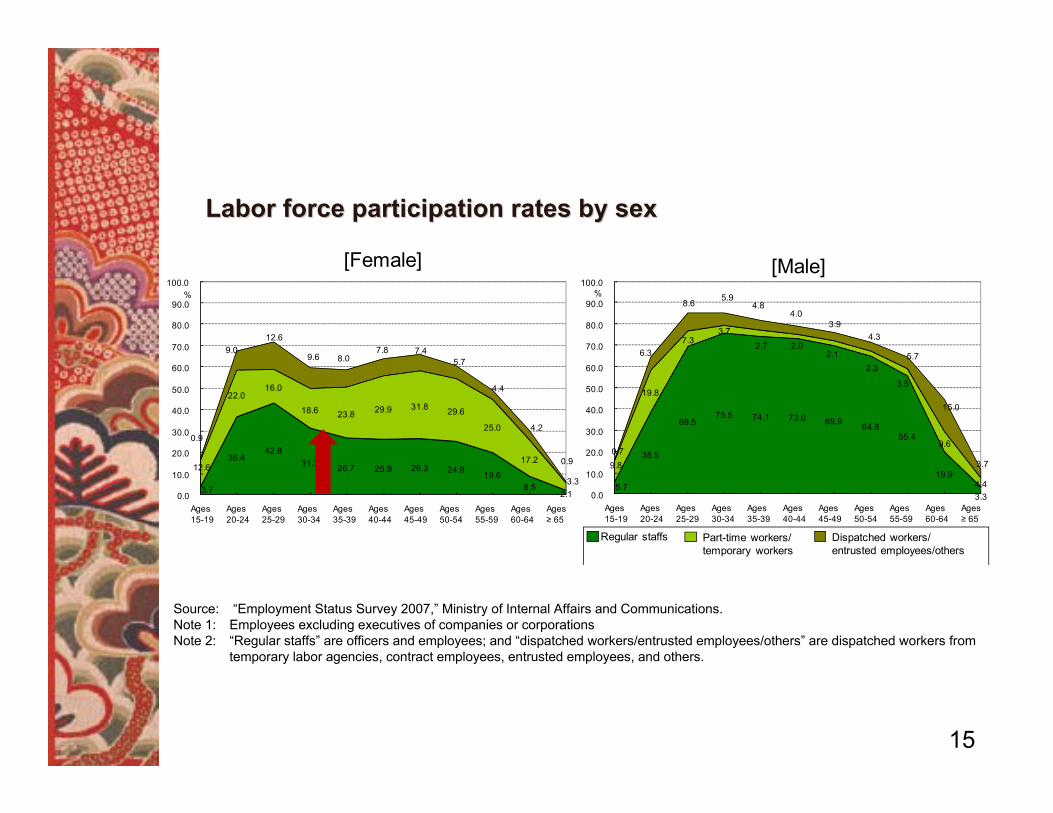
Labor force participation rates by sexLabor force participation rates by sex
36.442.8
31.3 26.7 25.9
8.52.1
18.6 23.8 29.9
17.2
3.7
12.63.3
0.9
4.20.9
0.0
10.0
20.0
30.0
40.0
Ages 15-19
Ages 20-24
Ages 25-29
Ages 30-34
Ages 35-39
Ages 40-44
Ages 60-64
Ages ≥ 65
38.5
69.575.5 74.1 73.0 69.9 64.8
55.4
19.9
19.8
7.33.7
9.6
4.43.3
5.7
9.80.7
6.3
8.6 5.94.8
4.0
15.0
3.7
0.0
10.0
20.0
30.0
40.0
50.0
60.0
70.0
80.0
90.0
Ages 15-19
Ages 20-24
Ages 25-29
Ages 30-34
Ages 35-39
Ages 40-44
Ages 45-49
Ages 50-54
Ages 55-59
Ages 60-64
Ages ≥ 65
Regular staffs Part-time workers/temporary workers
Dispatched workers/entrusted employees/others
%
22.016.0
7.88.09.6
12.69.0
50.0
60.0
70.0
80.0
90.0%
26.3 24.9 19.6
31.8 29.6
25.0
4.4
5.7
Ages 45-49
Ages 50-54
Ages 55-59
7.4
3.5
2.32.1
2.02.7
3.94.3
5.7
100.0100.0
[Female] [Male]
Source: “Employment Status Survey 2007,” Ministry of Internal Affairs and Communications. Note 1: Employees excluding executives of companies or corporations Note 2: “Regular staffs” are officers and employees; and “dispatched workers/entrusted employees/others” are dispatched workers from
temporary labor agencies, contract employees, entrusted employees, and others.
16
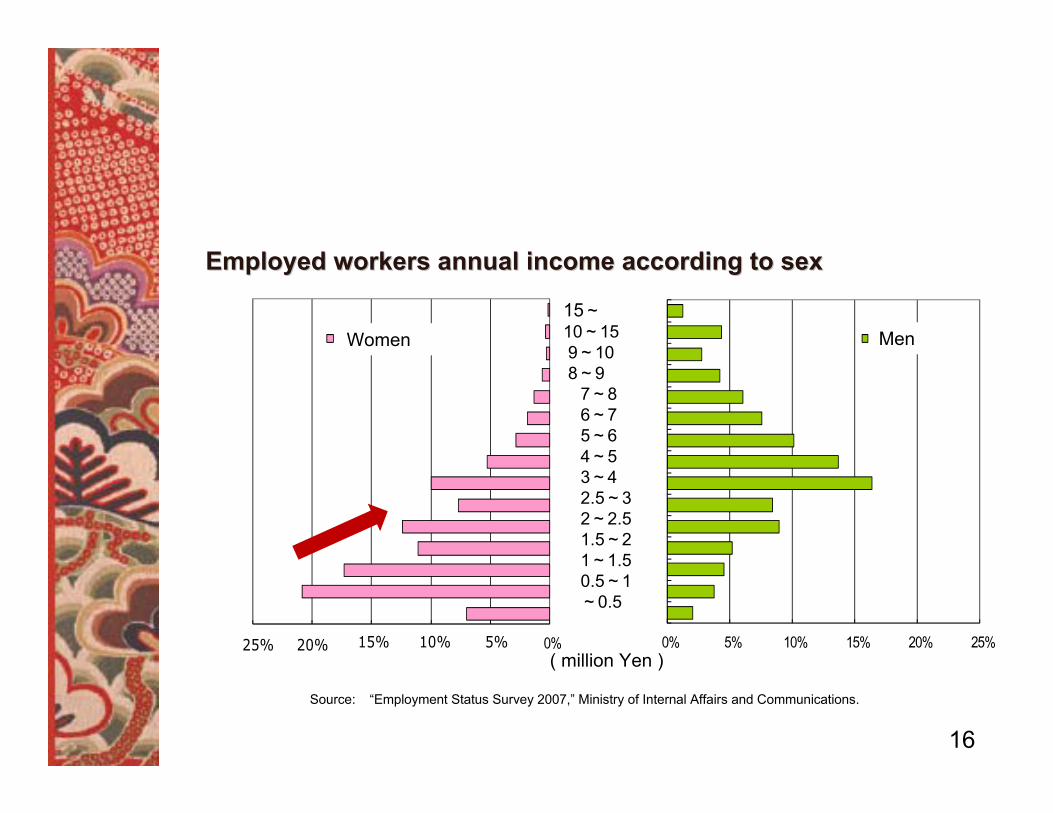
0% 5% 10% 15% 20% 25%
50万円未満50~99万円
100~149万円150~199万円200~249万円250~299万円300~399万円400~499万円500~599万円600~699万円700~799万円800~899万円900~999万円
1000~1499万円1500万円以上
男性
- 25% - 20% - 15% - 10% - 5% 0%
女性
25% 20% 15% 10% 5%
Women Men
Source: “Employment Status Survey 2007,” Ministry of Internal Affairs and Communications.
Employed workers annual income according to sexEmployed workers annual income according to sex
15~10~159~10 8~9
7~86~75~64~53~42.5~32~2.51.5~21~1.50.5~1~0.5
( million Yen )
17
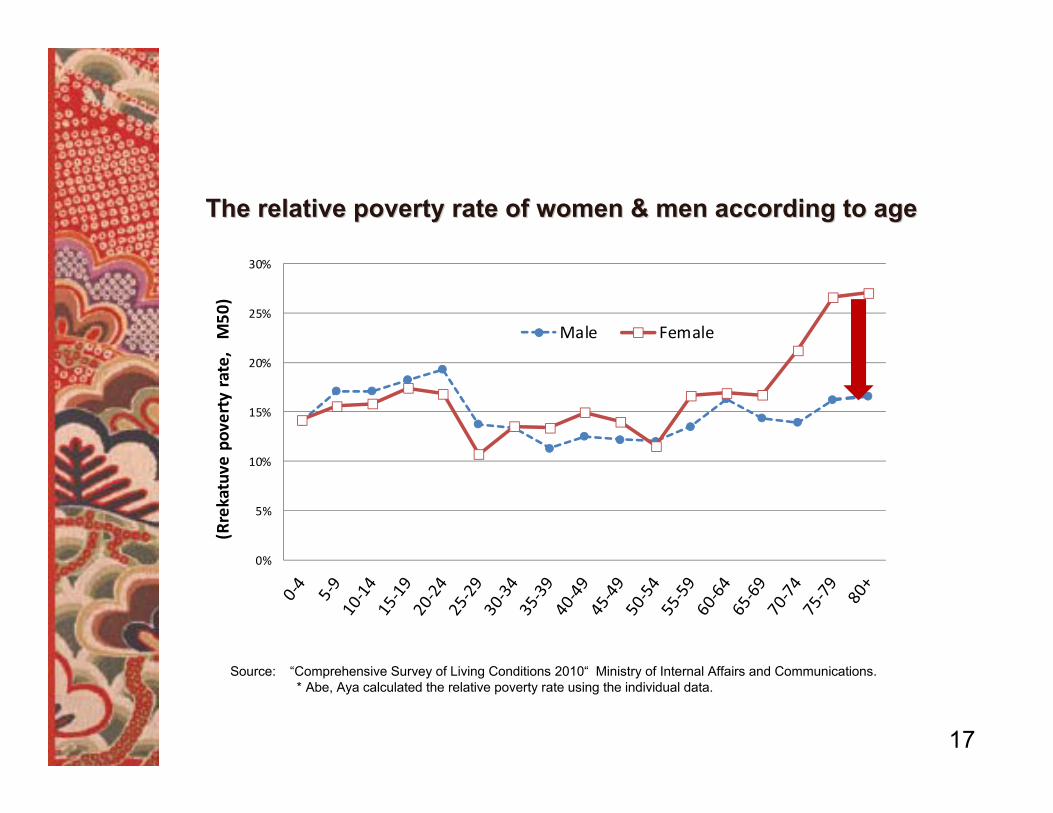
The relative poverty rate of women & men according to ageThe relative poverty rate of women & men according to age
Source: “Comprehensive Survey of Living Conditions 2010“ Ministry of Internal Affairs and Communications. *Abe, Aya calculated the relative poverty rate using the individual data.
0%
5%
10%
15%
20%
25%
30%
(Rrekatuve
poverty rate,
M50
)
Male Female
18
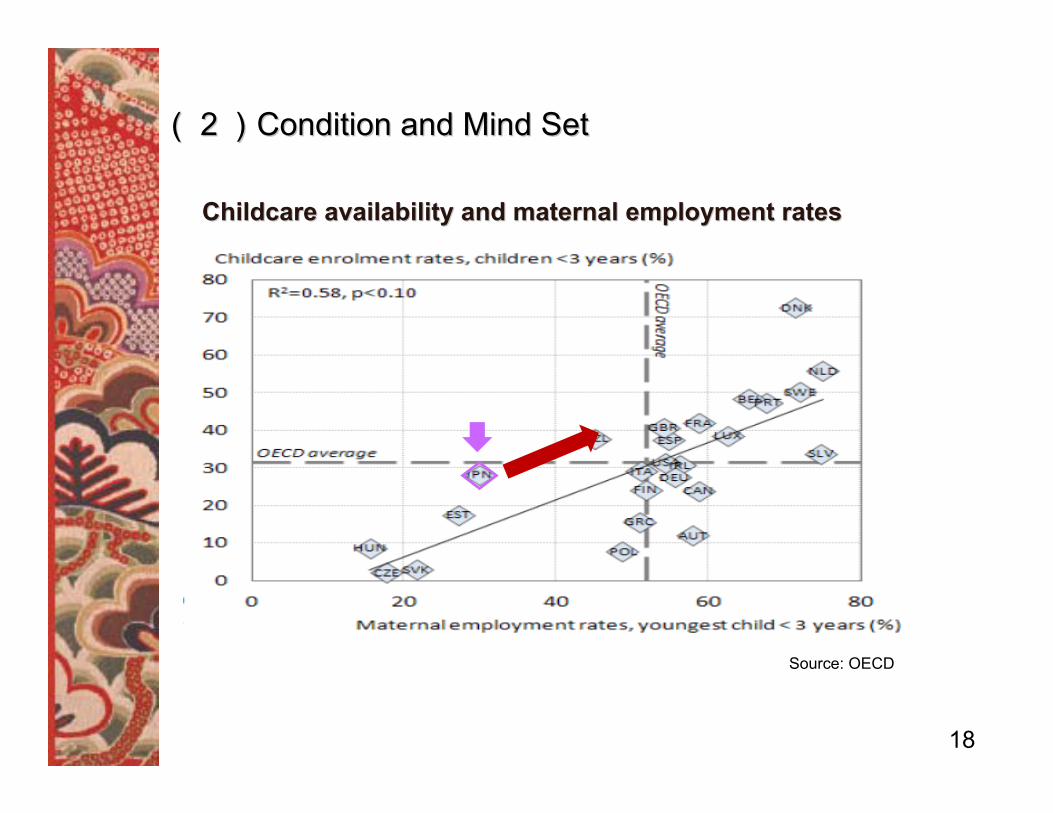
Childcare availability and maternal employment ratesChildcare availability and maternal employment rates
Source: OECD
(2)(2)Condition and Mind SetCondition and Mind Set
19
(published by National Police Agency )
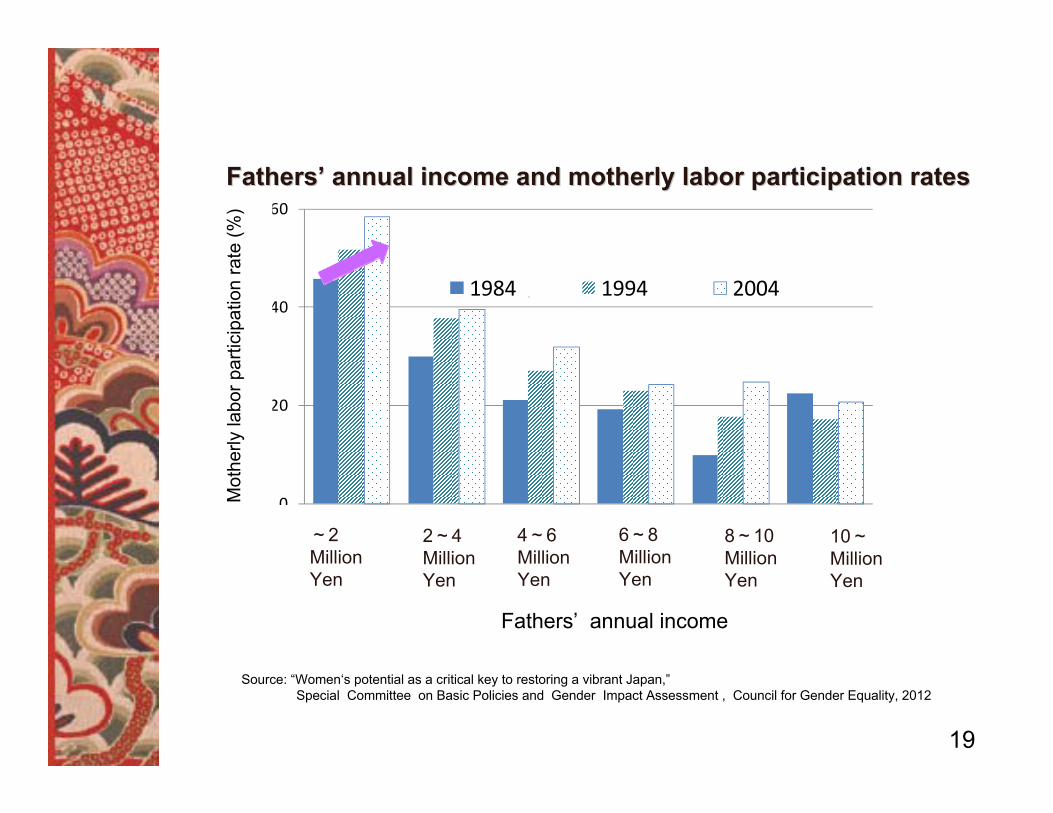
FathersFathers’’ annual income and motherly labor participation ratesannual income and motherly labor participation rates
0
20
40
60
200万円未満
200~399万円
400~599万円
600~799万円
800~999万円
1000万円以上父親の年収
1984年 1994年 2004年母親の就業率
(%)
Fathers’ annual income
Source: “Women‘s potential as a critical key to restoring a vibrant Japan,”Special Committee on Basic Policies and Gender Impact Assessment , Council for Gender Equality, 2012
Mot
herly
labo
r par
ticip
atio
n ra
te (%
)
~2Million Yen
2~4Million Yen
4~6Million Yen
6~8Million Yen
8~10Million Yen
10~Million Yen
20
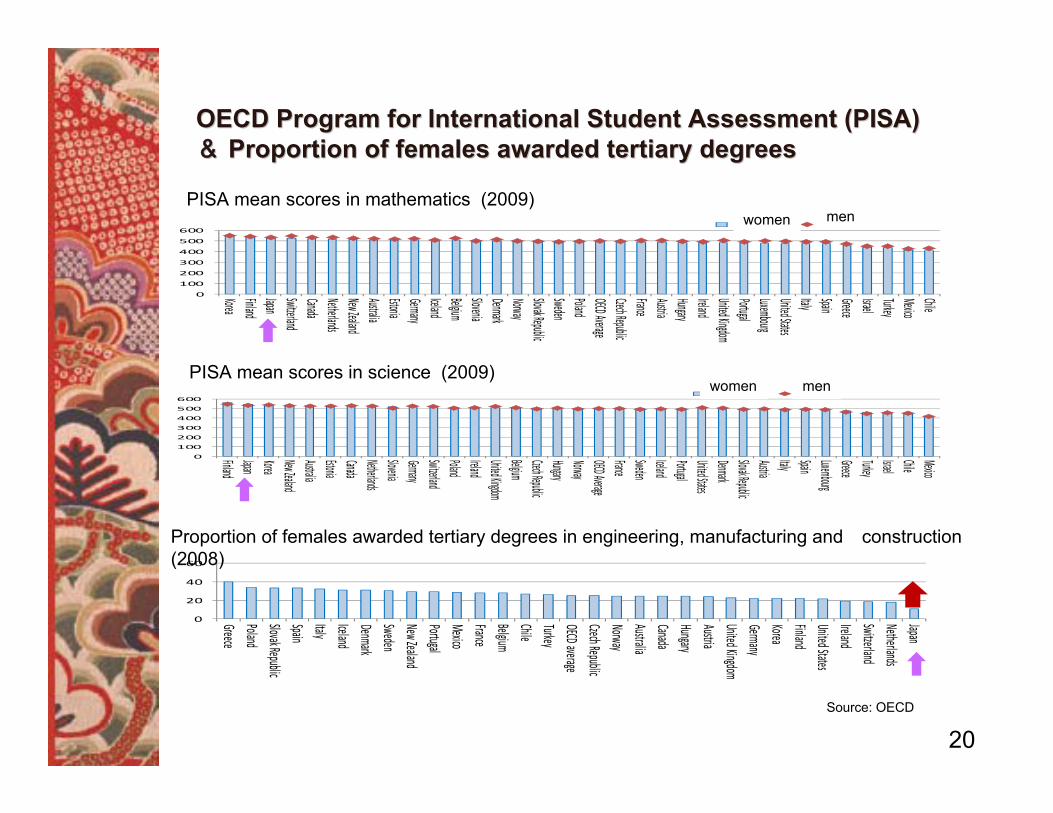
OECD Program for International Student Assessment (PISA)OECD Program for International Student Assessment (PISA)&& Proportion of females awarded tertiary degreesProportion of females awarded tertiary degrees
0
20
40
60
GreecePolandSlovak RepublicSpainItalyIcelandDenmarkSwedenNew ZealandPortugalMexicoFranceBelgiumChileTurkeyOECD averageCzech RepublicNorwayAustraliaCanadaHungaryAustriaUnited KingdomGermanyKoreaFinlandUnited StatesIrelandSwitzerlandNetherlandsJapan
0
100
200
300
400
500
600
KoreaFinlandJapanSwitzerlandCanadaNetherlandsNew ZealandAustraliaEstoniaGermanyIcelandBelgiumSloveniaDenmarkNorwaySlovak RepublicSwedenPolandOECD AverageCzech RepublicFranceAustriaHungaryIrelandUnited KingdomPortugalLuxembourgUnited StatesItaly SpainGreeceIsraelTurkeyMexicoChile
女性 男子
0
100
200
300
400
500
600
FinlandJapanKoreaNew ZealandAustraliaEstoniaCanadaNetherlandsSloveniaGermanySwitzerlandPolandIrelandUnited KingdomBelgiumCzech RepublicHungaryNorwayOECD AverageFranceSwedenIcelandPortugalUnited StatesDenmarkSlovak RepublicAustriaItaly SpainLuxembourgGreeceTurkeyIsraelChile Mexico
女子 男子
PISA mean scores in mathematics (2009)
PISA mean scores in science (2009)
Proportion of females awarded tertiary degrees in engineering, manufacturing and construction (2008)
Source: OECD
women men
women men
21
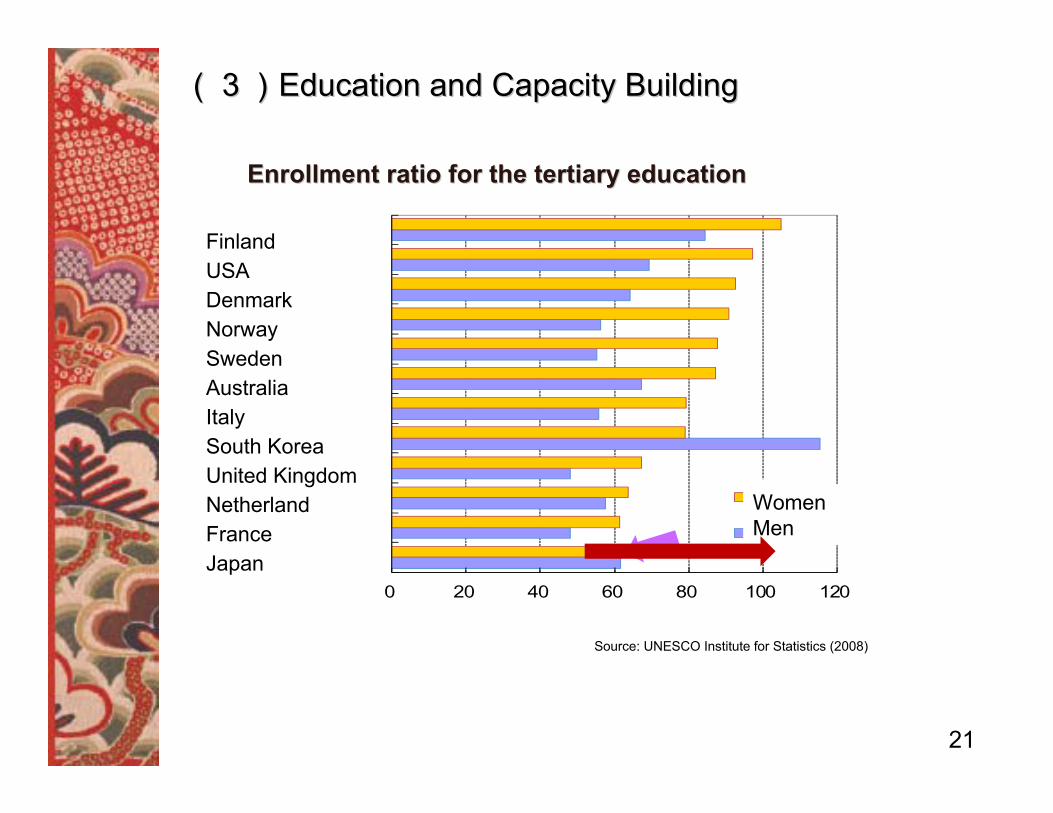
Enrollment ratio for the tertiary educationEnrollment ratio for the tertiary education
0 20 40 60 80 100 120
日本フランスオランダ
英国韓国
イタリアオーストラリアスウェーデン
ノルウェーデンマーク
米国フィンランド
女性
男性
FinlandUSADenmarkNorwaySwedenAustraliaItalySouth KoreaUnited KingdomNetherlandFranceJapan
WomenMen
Source: UNESCO Institute for Statistics (2008)
(3)(3)Education and Capacity BuildingEducation and Capacity Building
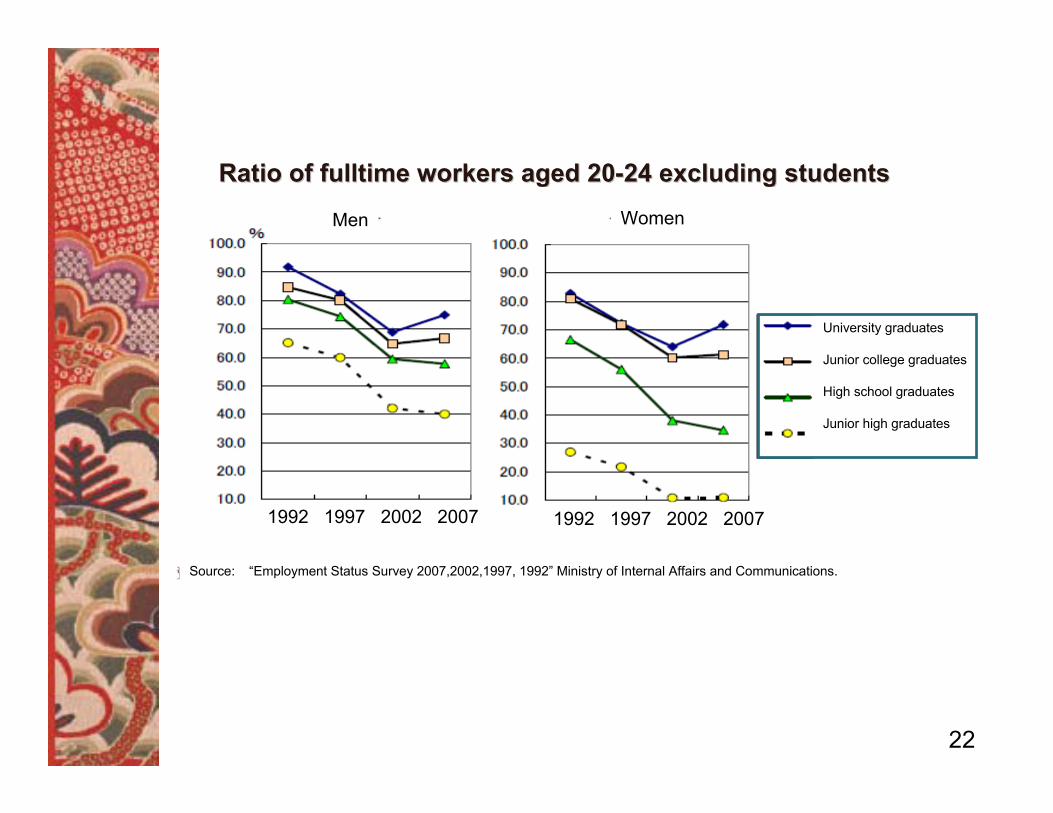
Ratio of fulltime workers aged 20Ratio of fulltime workers aged 20--24 excluding students24 excluding students
22
Men Women
University graduates
Junior college graduates
High school graduates
Junior high graduates
Source: “Employment Status Survey 2007,2002,1997, 1992” Ministry of Internal Affairs and Communications.
1992 1997 2002 2007 1992 1997 2002 2007
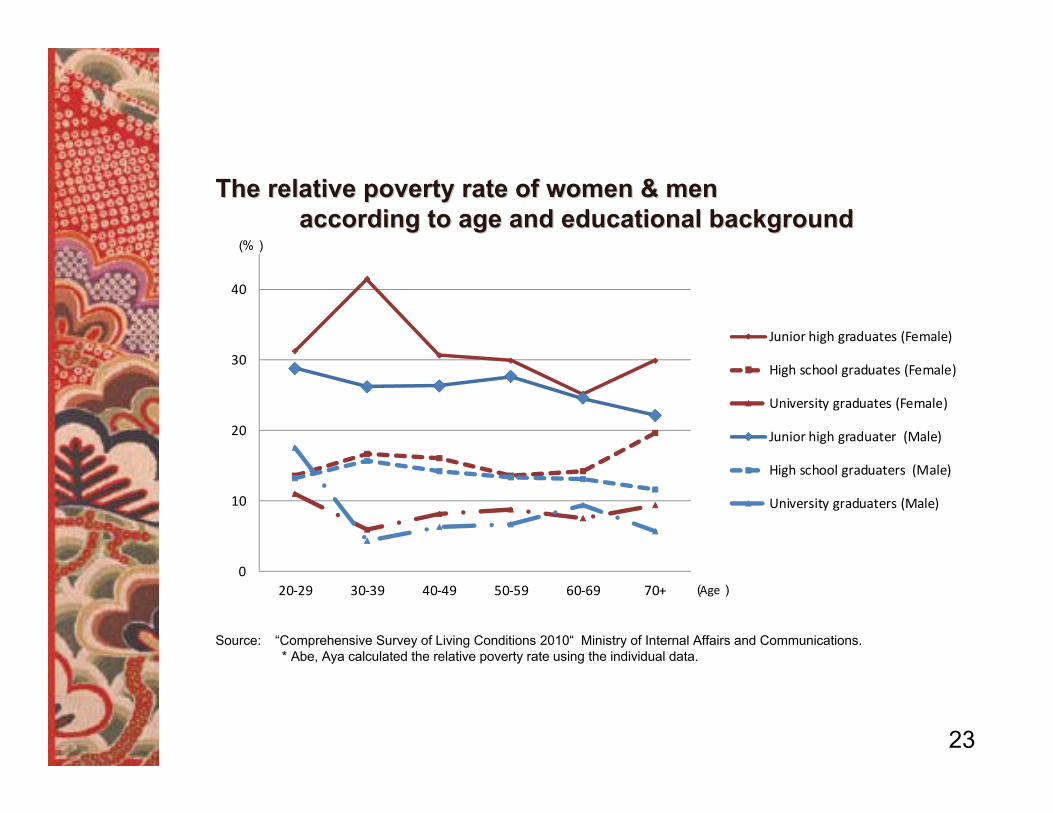
The relative poverty rate of women & men The relative poverty rate of women & men according to age and educational backgroundaccording to age and educational background
23
Source: “Comprehensive Survey of Living Conditions 2010“ Ministry of Internal Affairs and Communications. *Abe, Aya calculated the relative poverty rate using the individual data.
0
10
20
30
40
20‐29 30‐39 40‐49 50‐59 60‐69 70+
Junior high graduates (Female)
High school graduates (Female)
University graduates (Female)
Junior high graduater (Male)
High school graduaters (Male)
University graduaters (Male)
(%)
(Age)
24
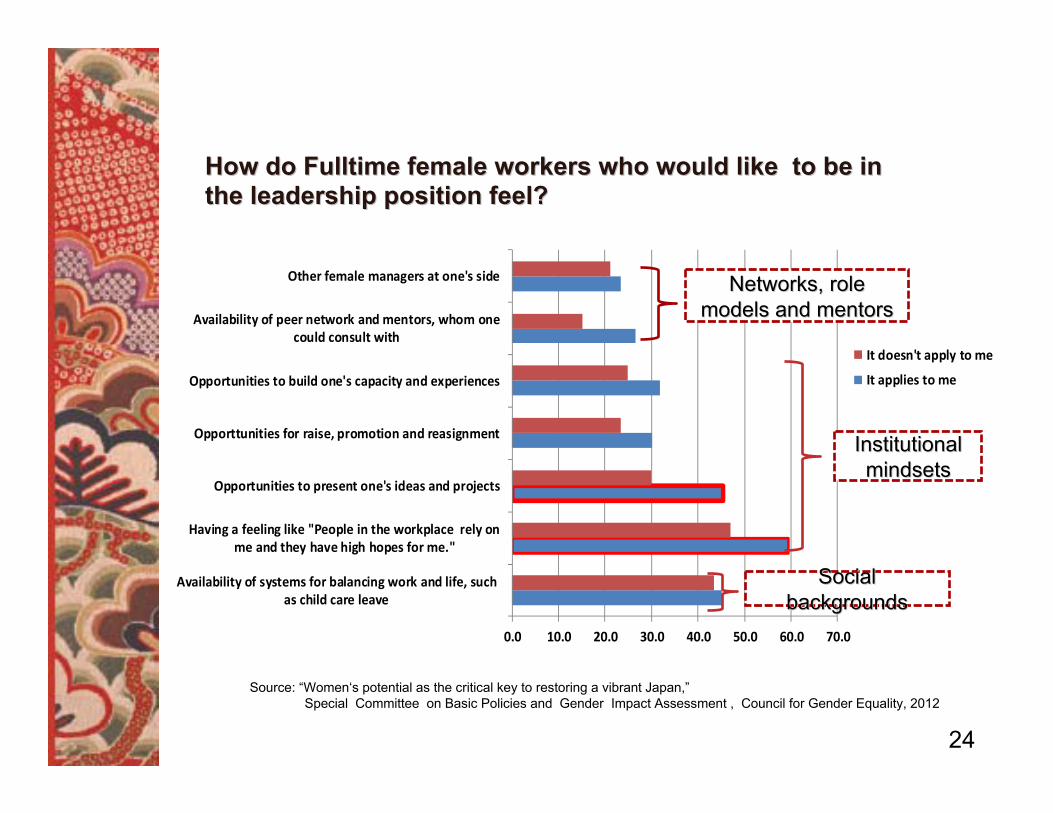
How do Fulltime female workers who would like to be in How do Fulltime female workers who would like to be in the leadership position feel?the leadership position feel?
0.0 10.0 20.0 30.0 40.0 50.0 60.0 70.0
Availability of systems for balancing work and life, suchas child care leave
Having a feeling like "People in the workplace rely onme and they have high hopes for me."
Opportunities to present one's ideas and projects
Opporttunities for raise, promotion and reasignment
Opportunities to build one's capacity and experiences
Availability of peer network and mentors, whom onecould consult with
Other female managers at one's side
It doesn't apply to me
It applies to me
Institutional Institutional mindsetsmindsets
Social Social backgroundsbackgrounds
Networks, role Networks, role models and mentorsmodels and mentors
Source: “Women‘s potential as the critical key to restoring a vibrant Japan,”Special Committee on Basic Policies and Gender Impact Assessment , Council for Gender Equality, 2012
25
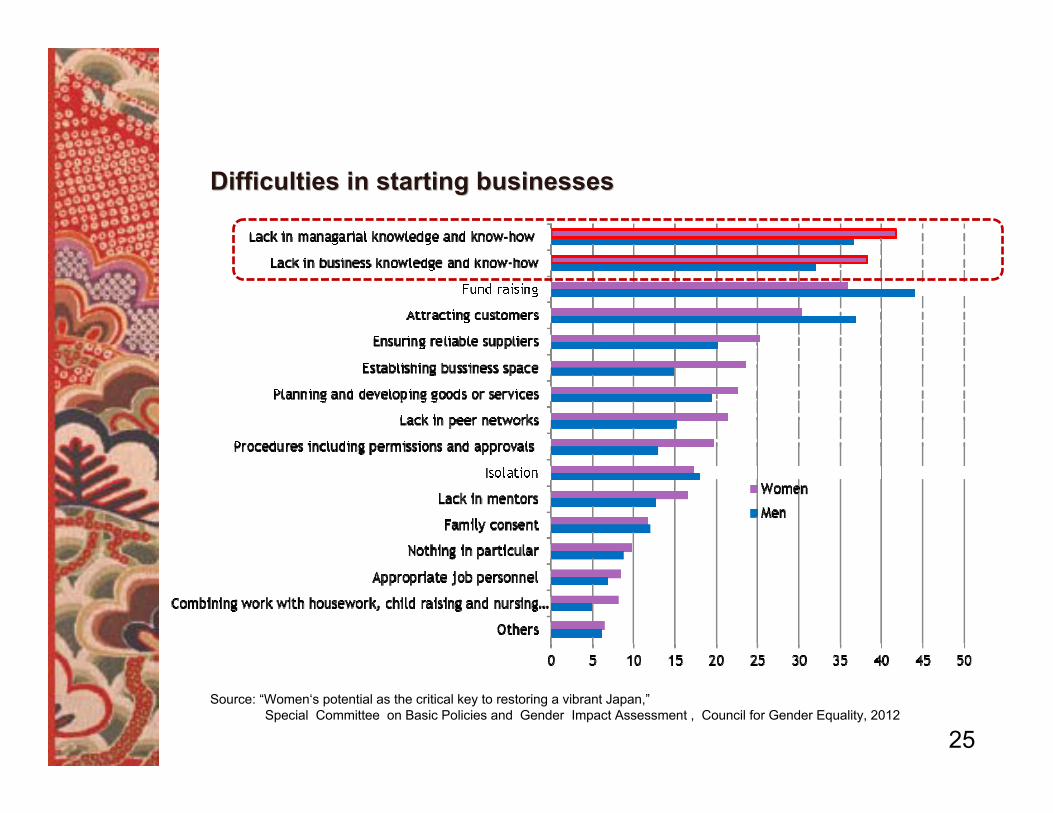
Difficulties in starting businessesDifficulties in starting businesses
Source: “Women‘s potential as the critical key to restoring a vibrant Japan,”Special Committee on Basic Policies and Gender Impact Assessment , Council for Gender Equality, 2012

4.4. The way aheadThe way aheadDeepen public understanding of the favorable effects of gender diversity initiatives on economic growth ◦ Identify and disseminate the evidence based on gender
statistics◦ Identify and disseminate the good practices◦ Collaborate with international movements to pursuing policies
26
Take a proactive approach to increase the existence and representation of women, especially in decision making positions◦ Promote the measures to require participation of women ◦ Promote the efforts to diminish the wage gap and promotion
gap between women and men in companies◦ Provide easy-to-access funding to female entrepreneurs
Disseminate the importance of women’s education and training
Move forward with “Comprehensive Reform of Social Security and Taxation”◦ Introduce “Comprehensive New System for Children and
Child-rearing” to provide sufficient childcare facilities◦ Revise the taxation which restrict female incentive for work