ecompliance, cameron freese_measuring and communicating safety performance
TRANSCRIPT

Safety Matters … Most
AECON OVERVIEW2012
MEASURING & COMMUNICATING WORKPLACE SAFETY PERFORMANCE
1

Safety Matters … Most
Measuring & Communicating
• Two key elements of an H&S Management System
• These elements must be linked, but can be successful or fail on their own
MEASURING AND COMMUNICATING WORKPLACE SAFETY PERFORMANCE
2

Safety Matters … Most
MEASURING WORKPLACE H&S PERFORMANCE
3

Safety Matters … Most
MEASURING PERFORMANCE
• Have a clear view of performance: Past vs Future• Identify strengths and weaknesses in the H&S Management
System• Identify where you can use resources • Measurement can provide an opportunity to prevent future
H&S incidents• Provide comparison to industry performance• Required to track based on jurisdiction• Must provide to clients during prequalification processes
Why measure safety performance?
4

Safety Matters … Most
MEASURING PERFORMANCE
Safety performance is typically measured using two primary categories:
1. Lagging / trailing indicators
2. Leading indicators
5

Safety Matters … Most
LAGGING INDICATORS
6

Safety Matters … Most
LAGGING INDICATORS
• Traditional process of incident counts and frequencies
• Establish KPI’s, targets and a benchmark
• Provide a historical perspective on what HAS happened
• Shows trending of performance over a period of time
00.5
11.5
22.5
33.5
44.5
2006 2007 2008 2009 2010 2011 2012 2013 2014
Industry LTIFrequency(3.02 average)Aecon LTIFrequency(0.00 average)
7

Safety Matters … Most
LAGGING INDICATORS
• What is currently used in the industry?– USA = BLS OSHA 300 log– International = Country
dependent, OSHA 300 log, Britain HSE RIDDOR
– Canada?
What are the best Indicators to use?
8

Safety Matters … Most
LAGGING INDICATORS
Canadian Standards – What are they?• Provincial WCB standards• No national standard used to classify injuries • The standards used to measure will depend on the
company tracking them and the region or industry in which they work
9
Safety Matters … Most
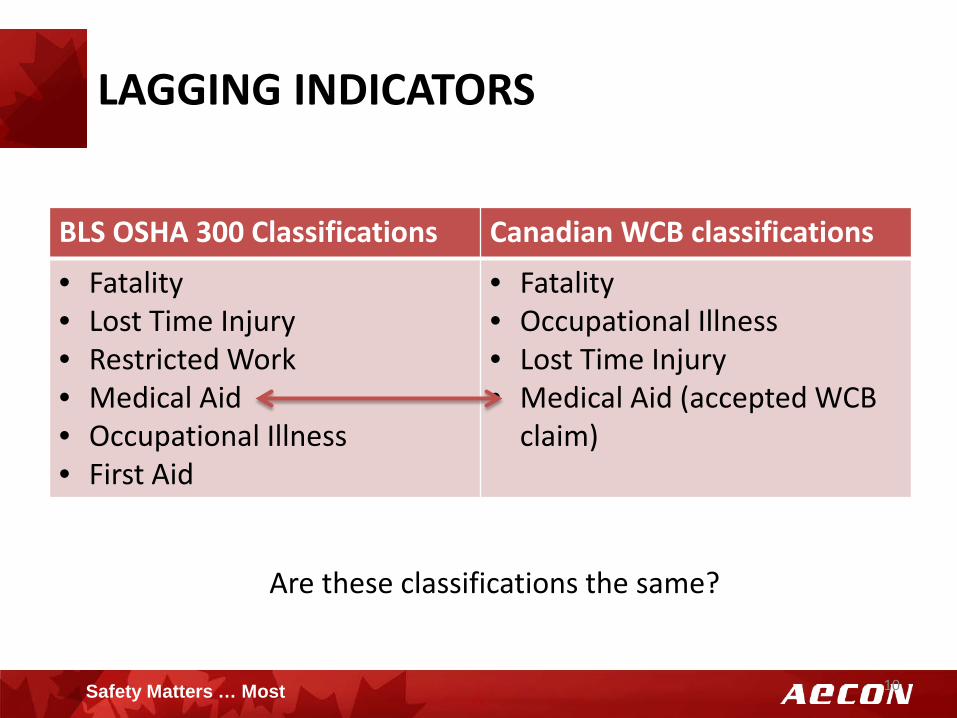
LAGGING INDICATORS
BLS OSHA 300 Classifications Canadian WCB classifications
• Fatality• Lost Time Injury• Restricted Work• Medical Aid• Occupational Illness• First Aid
• Fatality• Occupational Illness• Lost Time Injury• Medical Aid (accepted WCB
claim)
Are these classifications the same?
10

Safety Matters … Most
METRICS BASED ON LAGGING INDICATORS
• Lost Time Injury Frequency (LTIF)• Non-Lost Time Injury Frequency (NLTI)
– Actual vs WCB approach• Total Recordable Injury Frequency / Rate (TRIF / TRIR)• Days Away and Restricted or Transferred (DART)• Severity Rate
11

Safety Matters … Most
METRICS BASED ON LAGGING INDICATORS
• Frequencies are based on hours to provide an “apples to apples” perspective
• Common base frequencies are 200K and 1M hours
• Frequency = # X base / actual hours worked
Common Metrics
LTI Frequency
TRIF / TRIR
NLTI
DART
SEVERITY
12

Safety Matters … Most
Common Classifications
Fatality
Lost Time Injuries (LTI)
Days Lost due to LTI
Restricted Work
Days restricted or transferred
Medical Aid
First Aid
METRICS BASED ON LAGGING INDICATORS
Common Metrics
LTI Frequency
TRIF / TRIR
NLTI
DART
SEVERITY
13

Safety Matters … Most
METRICS BASED ON LAGGING INDICATORS
Which ones are the best to measure?The answer is completely based on your company and will depend on:
– Company size– Risk of work performed– Number and severity of workplace incidents– Industry of work performed– Static vs dynamic work environment
14

Safety Matters … Most
METRICS BASED ON LAGGING INDICATORS
The lagging metrics look at different severity and frequency of events.Eventually one metric will plateau and no longer provide you great value as a measurement for improvement.
00.5
11.5
22.5
33.5
44.5
2006 2007 2008 2009 2010 2011 2012 2013 2014
Industry LTIFrequency(3.02 average)Aecon LTIFrequency(0.00 average)
15

Safety Matters … Most
METRICS BASED ON LAGGING INDICATORS
Focus on the metrics and frequencies that allow you to drive continuous improvement.
NLTI – Includes all First Aids and Medical Aids

Safety Matters … Most
METRICS BASED ON LAGGING INDICATORS
• Lagging metrics are based on outcomes
• Measurement of lagging data should include trends in causal factors based on the incidents that occurred– Example: You may have fifteen Medical Aids, all from different types of
work – you need to make the data relative to your system and H&S elements
– Focus on what is causing these incidents, not the outcome
17

Safety Matters … Most
METRICS BASED ON LAGGING INDICATORS
• Lagging indicators are events that occurred and lessons can be learned
• Your investigation will identify root causes that are the targets for your corrective actions
• Trending the root causes can help identify systemic H&S management concerns vs surface level underlying causes– Example: If you know the root cause is primarily:
• Worker Competency: Focus on training, verification, coaching and monitoring
• Equipment Selection: Procurement practices, selection and availability• Poor planning or hazard identification: Review how hazards are
assessed, controlled and communicated
18

Safety Matters … Most
LEADING INDICATORS
19

Safety Matters … Most
LEADING INDICATORS
• Focused on proactive and preventative indicators• Establishes a true “Leading Indicator” as to future
safety performance• Qualitative data or activities that need
interpretation
20

Safety Matters … Most
LEADING INDICATORS
Examples of Leading Indicators• Training• Inspections • Audits• Behavioural Observation programs• Safety Opportunities – Near Misses reported• Risk / Hazard assessments completed
21

Safety Matters … Most
LEADING INDICATORS
Measure leading indicators by:
• Tracking the activities completed• Reviewing the amount completed vs expected or
required• Examine the details from the completion of those
activities (i.e. inspections results)
22

Safety Matters … Most
LEADING INDICATORS
23

Safety Matters … Most
COMMUNCIATING H&S PERFORMANCE
24

Safety Matters … Most
COMMUNICATING PERFORMANCE
Most organizations are currently communicating H&S performance in one form or another.Common points of communication of H&S performance:• Weekly, monthly, quarterly or annual review
meetings• JHSC meetings• Tool Box Talks• Through the use of KPI reports or dashboards
25

Safety Matters … Most
COMMUNICATING PERFORMANCE
Communicating safety performance must be done to:
• Inform all workplace parties of current success and opportunities for improvement
• Engage those who are responsible and accountable for H&S – Sr. Management
• Engage those who will actually perform the work
26

Safety Matters … Most
COMMUNICATING PERFORMANCE
Communicating performance means communicating:• The company and H&S program expectations• The importance of H&S and how the program
elements contribute to its success• Soliciting input, not just providing the output• Frequent updates to success and opportunities for
improvement
27

Safety Matters … Most
COMMUNICATING PERFORMANCE
Utilize standardized reports that communicate key leading and lagging indicator information.
28
Safety Matters … Most
PROGRAM ALIGNMENT
29

Safety Matters … Most
H&S PROGRAM ALIGNMENT
Aligning the concepts of H&S measurement and communication will build the foundation of continuous improvement.
Focus on consistent concepts and categories through all phases of your program
Planning- Risk /Hazard Assessments
Monitoring- Inspections / Audits
- Behavioural Programs
Investigation- Injury
- Damage- Environmental
Consistent & Measureable indicators at each step to help drive educated H&S improvements
30
Safety Matters … Most
MEASURING THE OUTCOME
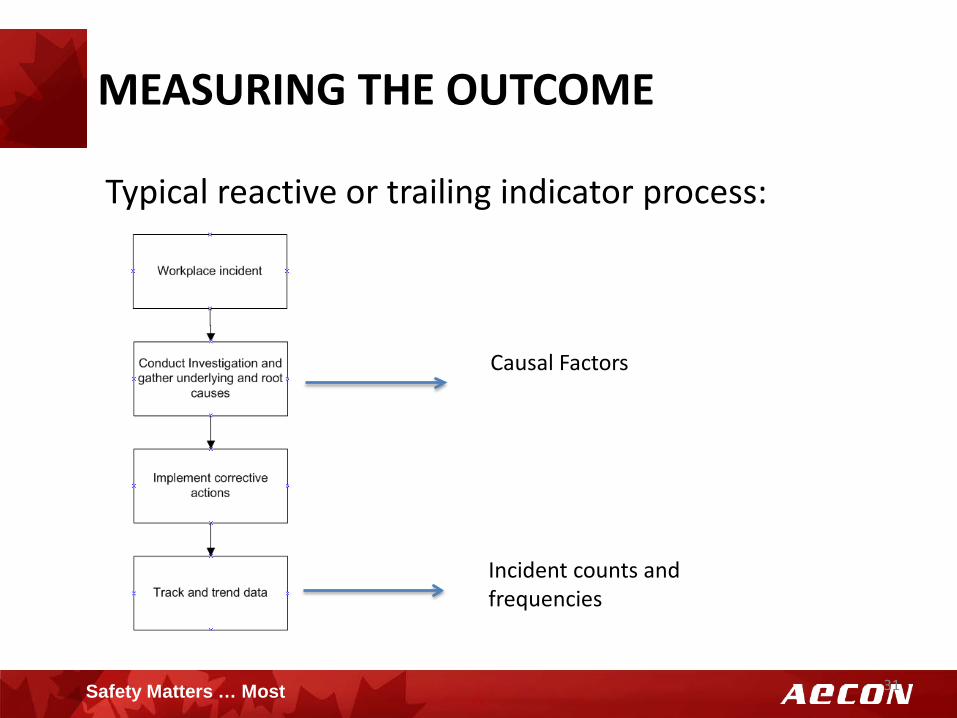
Typical reactive or trailing indicator process:
Incident counts and frequencies
Causal Factors
31

Safety Matters … Most
MEASURING THE OUTCOME
Proactive or leading process:
32

Safety Matters … Most
MEASURING THE OUTCOME
How do you know your proactive or leading activities are working?
If your program is aligned, you can measure consistent and relative information from your leading and trailing indicators to validate your performance.
33

Safety Matters … Most
MEASURING THE OUTCOME
Aecon has focused on engaging our workforce to report all Safety Opportunities (SO); regardless of severity.
Category of Opportunity Most Common Second Most Common
Environment Housekeeping(52%)
Weather - rain, ice, snow(24%)
Hardware / Tools & Equipment
Defective or failed(49%)
Inadequate tool for job(34%)
PeopleFailure to follow practice
/ procedure(50%)
Worker inattention(37%)
Process/ProceduresHazard not identified by
signage or barriers(46%)
Procedure unclear or no instruction
(37%)
Other
Third Party such as public or other
contractor(47%)
Vehicle use – Employee driving error
(12%) Data based on approx 6800 reported SO’s
34
Safety Matters … Most
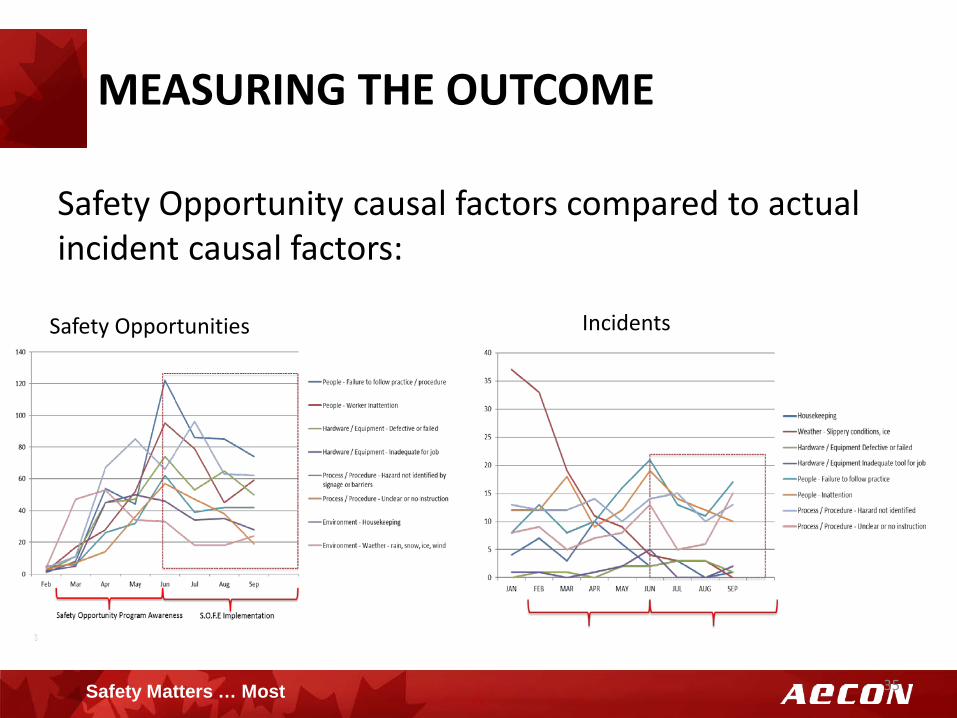
MEASURING THE OUTCOME
Safety Opportunity causal factors compared to actual incident causal factors:
Safety Opportunities Incidents
35

Safety Matters … Most
SUMMARY
36

Safety Matters … Most
SUMMARY
Measurement• Measure what is relative to your company• Measure what can drive continuous improvement• Align you measurement process throughout your entire H&S
Management System
Communication• Communicate your expectations and process during initial training• Use the information you measure frequently and consistently in
meetings, tool box talks, training etc.• Engage and empower the people that will ultimately improve your
safety performance through understanding of your metrics
37

38
THANK YOU