ecolopolis 3 - portland state university · “ecolopolis,” rather than a megalopolis. ... of...
TRANSCRIPT

Ecolopolis 3.0infrastructure!and!sustainability in Cascadia
2008

Table of Contents
Table of Contents 1
Acknowledgements 3
I. Introduction 5
II. Competencies: Sharing a Culture and an Economy 8
What is Cascadia? 8
Culture: Unique Identities 10
Cascadia’s Industry Clusters 12
Green Industries 12
Creative Services 14
Agriculture and Food Production 16
High-Tech 18
Challenges to Planning for Cascadia 20
III. Sustainability: Reducing Cascadia’s Environmental Footprint 23
Greenhouse Gasses and Climate Change 24
Air Quality 27
Energy 30
Natural Hazards 34
Natural Systems 35
Food Systems 38
Urban Infrastructure 40
Solid Waste Management 43
Social Sustainability 44
In Summary 45
IV. Flows: An Infrastructure Inventory for Connecting Cascadia 48
Bicycle and Pedestrian Infrastructure 48
Unified Signage and Wayfinding 50
Land Use and Multi-modal Hubs 51

Reducing Congestion 55
Broadband and Wireless Infrastructure 57
High Speed Rail 57
Airports 59
Ports 61
Short Sea Shipping 62
Truck and Freight Movement 64
Roads 66
Bridges 67
In Summary 68
V. Ecolopolis 3.0: Conclusions and Next Steps 70
Appendix 73
References 79
ECOLOPOLIS 3.0 2 11/17/2008

Acknowledgements This is a working document that is the result of class projects carried out in USP 549: Regional Planning and Metropolitan Growth Management, offered by the Toulan School of Urban Studies and Planning at Portland State University. Version 1.0 was prepared following the Spring 2005 class, and Version 2.0 in Spring 2006. The version you are now reading, 3.0, has been produced by the Spring 2008 class. We expect this series to grow and change with each year and the contributions of each group of students. Students contributing to these documents, to date, include:
Editors, 2005-2006-2008
Sumi Malik
Ethan Seltzer
Lynn Weigand
Max Coffman
Lake McTighe
Sara Wright
Stephen White
Rob Williams
Brandy Steffen
Elizabeth Chapin
Zach Bates
Spring, 2005
Sumi Malik
Tom Moes
Jessica Sladek
Carrie Smith
Meganne Steele
Jon Swae
Brian Vanneman
Teak Wall
Jason Wallace
Lynn Weigand
Alex White
Nicole Wolters
ECOLOPOLIS 3.0 3 11/17/2008

Spring, 2006
Delia Chi
Max Coffman
Steven Gao
Diane Hale
Matt Lustig
Kate Lyman
Lake McTighe
Amanda Owings
Joe Recker
Ted Reid
Kim Voros
Spring, 2008
David Amiton
Laura Spidell
Mallory Atkinson
Erica Timm
Zach Bates
Dyami Valentine
Sara Beddinghaus
Stephanie Van Rheen
Rani Boyle
Stephen White
Elizabeth Chapin
Rob Williams
Beth Cohen
Brandy Steffen
Becky Dann
Sara Wright
Alexis Demersseman
Beth Somerfield
Gesa Geissler
Morgan Masterman
Brendon Haggerty
Simon Klein
Instructor
Ethan Seltzer, [email protected]
ECOLOPOLIS 3.0 4 11/17/2008

I. Introduction
What is an Ecolopolis?
Jean Gottman’s “Megalopolis”, first described in 1964 as the urbanized area stretching from Boston to Washington, DC, has inspired the contemporary use of the term “megaregion” to describe linked cities and the micropolitan areas between them. However, does the East Coast’s Megalopolis provide a model for potential Cascadian-scale urban development and interaction?
The heavily urbanized nature of Megalopolis immediately seems to clash with Cascadian sensibilities. After all, access to the outdoors, open space and preservation of agricultural land provide many residents here with a strong sense of place and pride. People are attracted to the quality of life in our cities. Proximity to pristine mountains, rivers and forests, and the ocean is a top draw for skilled workers and young people. Cascadia’s competitive advantage lies, at least in part, in the fact that it is NOT a continuously urbanized region, yet still provides cosmopolitan amenities like arts and culture, fine food, shopping and sports.
What kind of Pacific Northwest do we want to live in? Can celebrating our uniqueness be the cornerstone for boosting our competitiveness? How can we prosper, accommodate a growing population and remain livable? The answer lies in the commitment of decision makers, developers and citizens to develop the Cascadian megaregion into what we’ve called an “Ecolopolis,” rather than a Megalopolis.
What is an ecolopolis? We have defined it as a networked metropolitan system consisting of the metropolitan areas for Portland, Seattle, and Vancouver, BC, and the vital working and wild landscapes between them. The Cascadian Ecolopolis is, in our view, a continental and global economic subunit that gets its identity and global “brand” identity from the unique Pacific Northwest bioregion and culture.
What have we learned so far?
In “Ecolopolis 1.0: Making the Case for a Cascadian Supercity,” we took up the challenge of investigating the nature and promise of a binational, tristate regional supercity in the territory referred to as Cascadia. For the purposes of this study, we concentrated on the three major metropolitan areas in the Pacific Northwest, namely Portland, Seattle, and Vancouver, BC.
The question we asked ourselves was what, besides location in the northern temperate rainforest and the expectations of national interests outside of the Pacific Northwest did these three metros share? What dynamics linking the three cities pointed to the promise of working toward a unified approach to development? More specifically, what would justify an investment in high(er) speed rail? If this is about economic competitiveness, what about current models of competitiveness suggested that the territory we should care about was Cascadian in scale?
What we found in that first effort was that local concerns trumped megaregional ties. Simply put, Cascadia was not yet at the point where megaregional projects would receive priority over local metropolitan and statewide or provincial concerns. That said, we found strong suggestions for possible economic clusters organized and operating at a Cascadian scale, and
ECOLOPOLIS 3.0 5 11/17/2008

clear allegiance to what can best be described as a Cascadian “brand.” Both of these observations suggested the potential development of a competitiveness strategy for a Cascadian megaregion based on distinctive traits, landscapes, and culture. Further, work done on high and higher speed rail laid the groundwork for imagining a more connected and accessible Cascadian megaregion.
In “Ecolopolis 2.0” we identified a rationale for Cascadian-scale planning within global, national, and regional contexts. Globally, we found that Cascadia done right could become a laboratory and source for innovation in the world-wide search for more sustainable development patterns and life styles. Nationally, Cascadia provides an opportunity for exploring Federal-State and international relations aimed at creating both sustainable urban places and a better future for intervening rural areas and towns. Regionally, imagining Cascadian-scale strategies for global competitiveness, accessibility, and sustainable development opens up new opportunities not immediately apparent in the existing context provided by states and separated metropolitan regions.
Ecolopolis 2.0 began by documenting the history of the idea of Cascadia as a means for better understanding what a unified Cascadian brand might consist of. We analyzed conditions and trends for both rural Cascadia and for its metropolitan centers. Though we found many similarities linking the metropolitan regions of Cascadia, as in Ecolopolis 1.0 we also found many forces working against integration of efforts at a Cascadian scale. Nonetheless, we identified four strategies that could be used to both better integrate the Cascadian megaregion and to prepare Cascadia for engaging future national initiatives directed at megaregions: ! In light of the similar strategies for metropolitan growth management employed in
Cascadian metropolitan regions, create an internationally recognized effort to learn from this experience;
! Save agriculture, and the working landscape more generally, to maintain separation between metropolitan areas;
! Develop industry clusters across Cascadia, particularly in areas like green building and software that are already operating at a Cascadian scale; and
! Increase accessibility through the development of high speed rail and other strategies having demonstrable strategic value at a Cascadian scale.
What is 3.0 about?
With “Ecolopolis 3.0” we are taking the next step towards defining a strategic agenda for Cascadia. Through the efforts of members of Congress and others, and due to the catastrophic collapse of the I-35W Bridge in Minneapolis, new attention is being paid to the condition of the nation’s infrastructure. Calls for a national infrastructure initiative are being made, echoing previous national initiatives in 1808, the Gallatin Plan, and 1908, President Theodore Roosevelt’s plan for national conservation and development.
Whereas the Gallatin plan was about moving the natural resource bounty of the nation to the seaports in the east coast cities, and Roosevelt’s effort focused on mitigating the impacts of rapid urbanization and industrialization on cities and the environment, the focal point for this new effort remains undefined. Many expect that sustainability, energy conservation, and a fundamental response to climate change and uncertainty will emerge as organizing principles, at least in part, for this new endeavor. In addition, given the demands of global competition
ECOLOPOLIS 3.0 6 11/17/2008

and demographic shifts, realizing the promise for innovation emerging from the interaction of people located in cities will likely become part of this new national conversation.
Nonetheless, the lead strategy is likely to be infrastructure planning and finance, with a new role for and sense of urgency on the part of the Federal government. Consequently, with Ecolopolis 3.0 we have attempted to identify an infrastructure agenda for the Cascadian megaregion, one that is attuned to creating an Ecolopolis. To do this, we’ve envisioned a Cascadian Ecolopolis as being defined by three central features: ! Competencies – the things that Cascadian metros and the megaregion itself are distinctly
and perhaps uniquely good at, and which differentiate it from other megaregions in North America.
! Sustainability – patterns of resource use, settlement, and interaction that address core values in Cascadia underlying the turn towards growth management, resource conservation, habitat restoration, green building, energy and water conservation, recycling, local food systems, and other core elements and activities associated with the Cascadian brand.
! Flows – the movement of people, goods, materials, capital, ideas, and information throughout the megaregion.
For each of these elements, we’ve identified issues, trends, and the roles that infrastructure development can play in advancing them. Our intent is to present this Cascadian agenda for infrastructure and sustainability to local, state, and national decision makers engaged in or soon to engage the emerging national dialogue about infrastructure and the role of the Federal government. Our hope is that by doing so, we both advance the idea of a unified and integrated Cascadia, and prepare Cascadian decision makers to be effective on behalf of the megaregion and its evolution into an Ecolopolis as the details get worked out in Washington DC.
As with our previous efforts, we welcome your comments and suggestions. This is a work in progress, just as the very idea of Cascadia and conception of megaregions themselves are works in progress. We are optimistic in our belief that acting on behalf of the megaregion will ultimately prove to be a useful strategy for achieving the kind of future that residents of this megaregion would prefer for Cascadia in the generations to come.
ECOLOPOLIS 3.0 7 11/17/2008

II. Competencies: Sharing a Culture and an Economy
What is Cascadia?
While explicit geographical and political lines that define Cascadia could be debated, it is generally viewed as the stretch of mountainous, temperate rainforest along the Pacific Coast beginning at the northern California border and extending north through Portland, Seattle, and Vancouver, B.C. Rugged beaches, tall stands of timber, fertile farmland, cascading waterfalls, and snow-capped mountain peaks complete the picture.
For our purposes, we’ve focused on that part of Cascadia located along a 300-mile stretch of the I-5/Route 99 corridor. It encompasses 22 U.S. counties1 and is home to approximately nine million people, a large majority (88%) of which live in the Vancouver, Seattle, or Portland metropolitan areas.2 The region includes many other cities and towns of significant size, including Vancouver (WA), Olympia, Tacoma, Everett, and Bellingham.
Figure 2.1 Historic Map of Oregon Territory, 1837
http://iloveoregon.com/images/Oregon_Territory_map.jpg
Table 2.1 Population Figures 3
Region Population
Metropolitan Portland 2,265,223
Metropolitan Seattle 3,554,760
Metropolitan Vancouver, BC 2,116,581
Other counties* 1,040,700
Total 8,977,264
* Washington counties: Clark, Cowlitz, Lewis, Thurston, Pierce, King, Snohomish, Skagit, Whatcom, Mason, Kitsap. Oregon counties: Multnomah, Clackamas, Yamhill, Washington, Columbia, Tillamook, Polk, Marion, Linn, Benton, Lane
History and Borders
The first Europeans to reach Cascadia were most likely Spanish and English explorers, sailing northward along the coast during the 1500’s.4 The geography presented formidable natural barriers to explorers. However, by the early 1800s claims from what is now Alaska to California were placed on the region by the Russians, Americans, Spanish, and British.
ECOLOPOLIS 3.0 8 11/17/2008

Through treaties with the United Kingdom and the United States, Russia and Spain established boundaries to their claims to the north and to the south; the United Kingdom and the United States could not agree on a boundary line. In 1818 a treaty was signed that permitted citizens of both countries to trade and settle in the region, which was called the Oregon Country.5
Through treaties with the United Kingdom and the United States, Russia and Spain established boundaries to their claims to the north and to the south; the United Kingdom and the United States could not agree on a boundary line. In 1818 a treaty was signed that permitted citizens of both countries to trade and settle in the region, which was called the Oregon Country.5
The placement of rail lines influenced and largely determined the success or failure of many early settlements. The towns that sprang up supported resource-based industries such as farming, mining, and logging.6
The placement of rail lines influenced and largely determined the success or failure of many early settlements. The towns that sprang up supported resource-based industries such as farming, mining, and logging.6
Cascadia Timeline to 1900 40,000 to 10,000 BC: 'Native Americans' arrive. ---------------------------------------------------------------------------------------------------------------------------------------------- 1570-1800: European expeditions map the coast. ---------------------------------------------------------------------------------------------------------------------------------------------- 1778: Cpt. Cook first white man in British Columbia. ---------------------------------------------------------------------------------------------------------------------------------------------- 1792: Cpt. Vancouver compiles the first extensive maps of the coastline. ---------------------------------------------------------------------------------------------------------------------------------------------- 1794: First white settlement in British Columbia. ---------------------------------------------------------------------------------------------------------------------------------------------- 1803-1806: Cpts. Lewis and Clark lead the Corps of Discovery's Transcontinental Expedition of lands west of the Missouri River. ---------------------------------------------------------------------------------------------------------------------------------------------- 1811: Pacific Fur Company builds Ft. Astoria at the mouth of the Columbia River. ---------------------------------------------------------------------------------------------------------------------------------------------- 1818: United States and Great Britain agree to joint occupation of the Oregon Territory. ---------------------------------------------------------------------------------------------------------------------------------------------- 1824: Russia sets its southern boundary in the Pacific Northwest at 54 degrees, 40 min. ---------------------------------------------------------------------------------------------------------------------------------------------- 1834: The travel route that becomes the Oregon Trail established.. ---------------------------------------------------------------------------------------------------------------------------------------------- 1846: Oregon Treaty sets the 49th parallel as the northern boundary of the United States. ---------------------------------------------------------------------------------------------------------------------------------------------- 1848: Oregon becomes an official U.S. territory. ---------------------------------------------------------------------------------------------------------------------------------------------- 1853: Washington Territory declared, including land east to the Rocky Mountains. ---------------------------------------------------------------------------------------------------------------------------------------------- 1856: Gold discovered along Fraser River in British Columbia; starts gold rush. ---------------------------------------------------------------------------------------------------------------------------------------------- 1858: First railroad begins operation in the Columbia River Gorge; a large number of railroads established in the 1880s. ---------------------------------------------------------------------------------------------------------------------------------------------- 1859: The colony of British Columbia is formed. ---------------------------------------------------------------------------------------------------------------------------------------------- 1859: Oregon granted statehood. statehood. ---------------------------------------------------------------------------------------------------------------------------------------------- ---------------------------------------------------------------------------------------------------------------------------------------------- 1862: Pacific Railroad Act and Homestead Act pass. 1862: Pacific Railroad Act and Homestead Act pass. ---------------------------------------------------------------------------------------------------------------------------------------------- ---------------------------------------------------------------------------------------------------------------------------------------------- 1871: British Columbia becomes a Province. 1871: British Columbia becomes a Province. ---------------------------------------------------------------------------------------------------------------------------------------------- ---------------------------------------------------------------------------------------------------------------------------------------------- 1889: Washington granted statehood. 1889: Washington granted statehood.
www.britishcolumbia.com/history/history2.html, www.wsulibs.wsu.edu/Holland/masc/PNWTimeline.htm
ECOLOPOLIS 3.0 9 11/17/2008

The first large overland migrations came in the mid-1800s. This put pressure on the United States government to settle the boundary dispute with the British, and in 1846 a treaty was signed fixing the 49th parallel as the chief dividing line between the United States and Canada.7
e a
en
and
8
,
are
l th furs and salmon, then, later on, with timber,
ped a
tination
s
ver, and of these, roughly three-quarters of a 12
With the border between the United States and what would become British Columbia established, Oregon becamterritory in 1848. Oregon’s northern border was established in 1853 whCongress created the Washington Territory, which was expanded to include parts of what are now IdahoMontana. Washington received its current border a decade later in 1863.
Today, Cascadia is divided by multiple jurisdictional boundaries, including citycounty, state, and national boundaries. However, placed in a historical context, these boundaries are a recent condition, while economic ties across the regionlong established. Additionally, these patterns are largely rooted in the natura
resources that characterizGoogle Maps
e the region: first wimining, and agriculture.
Culture: Unique Identities
The wild and rural parts of Cascadia have always been inextricably connected to the region’s burgeoning urban centers. Recognizing and embracing this fact early on has been fundamental in shaping the character of the region. Managing this reality has been a dynamic process. Each of the region’s three metro areas—Vancouver, B.C., Seattle, and Portland—have develodifferent response to this challenge, and their stories, though shared, are not the same.
The essence of Cascadia is very tangible in Vancouver, B.C., described as "a dynamic, multicultural city set in a spectacular natural environment."9 The city has been gearing up for the 2010 Winter Olympics, but even before that this the city prided itself on being a descity. It has earned numerous awards and accolades, including ranking third in the 2007 Worldwide Quality of Living Survey, topped only by the Swiss cities of Zurich and Geneva.10 Additionally, marketed as being green, gay-friendly, and globally-minded, the port city bringin nearly one million visitors each year by cruise ship alone.11 In 2007, just over 8.9 million people were overnight visitors to metro Vancoumillion came from Washington and Oregon.
However, even as the city steps into the world spotlight as host of the 2010 Olympics, it is not just tourists on which Vancouver is focused. The issue of being a metropolitan center in a land of vast natural resources is at the heart of the city's agenda. Currently, EcoDensity, a planning initiative focused on strategic density planning, will be brought before the city council in June,
Figure 2.2 Cascadia
ECOLOPOLIS 3.0 10 11/17/2008

http://www.flickr.com/photos/phillipschip/339086726/
Figure 2.3 Downtown Seattle
2008. The initiative’s Charter states, "EcoDensity recognizes that density—high quality, greein design, strategically loand properly implemented—provides cities with a powerfopportunity to improve environmental sustainability, along with affordability and
n cated,
ul
13
been
f dly
y
t for the establishment of Urban Growth Boundaries. In addition to ambitious licie he envelope when it comes to more routine traditions.
ide,
gly
livability." The ultimate goal is explicit: Vancouver wants tobe the “greenest” city in the world.
Seattle, which has long known at the “Emerald City”, has embraced the idea of balancing the urban and the wildwith its latest citywide marketing campaign, which is wrapped up in the slogan
metronatural.
14 More than just a play on words, the tagline serves the city well. Portraying Seattle as "having the characteristics of a world-class metropolis within wild, beautiful surroundings" it encourages visitors to engage in both worlds. The Greater Seattle Chamber oCommerce addresses this issue with its key polices for 2008 to promote a business frienclimate, improve regional mobility, support urban density and affordable housing, and advancesustainable development policies.15
Portland offers much of the same, although the targeted audience is less the people who visit, and more those who call it home. In the early 1970's, Senate Bill 100 introduced mandatorcomprehensive planning for all jurisdictions according to statewide planning goals, including arequiremenplanning poWilling togo against the tPortlanders are increasinopen to the idea of alternativeapproachesto normal activities,
s, Portland also pushes t
ECOLOPOLIS 3.0 11 11/17/2008
such as transportation and eating. The New York Times has labeled Portland "Bike City U.S.A."16 and the city’s transportation system is considered an international model.17
The Portland Slow Food "convivium" or chapter was founded in 1991; only one year after the movement began in Italy, making it the first and still one of the largest in the US.18 The Slow
Figure 2.4 Downtown Portland
http://www.flickr.com/photos/sicalufakiss/2021033372/

Food movement is based on a food system that is "good, clean and fair" and focuses on qualitsustainable food production methods. Both movements contribute to the balance betweenlife and the natural environment. The Slow Food movement depends on the ric
The cities located in Cascadia are generally regarded as progressive and livable places, due to many factors, some easier to measure
ndards
s
scadia is known for:
! Strong arts scenes
than others. Generally, Cascadian cities are characterized by: ! Leadership in green building technology ! Open to gay and lesbian lifestyles ! Acceptance of free speech laws
-reduction sta! Recycling and wasteabove national averages
! Innovative public transit system! Bicycle advocacy Culturally, Ca
! Outdoor recreation ! Coffee ! Locally-grown food ! Indie rock ! Individualism
! DIY and craft culture
y, urban
h farmland of milar way, Portland’s bike culture thrives because the er-in", in a denser, more urban environment.
arent when "the Northwest" is mentioned. For man , lib e flee
the
and enjoyment of
und
of .
of
blic transportation, crime and safety, jobs, opportunity, a healthy economy, and civic leadership.
Sustainable forestry, lumber, and wood products should be included here ddressed in future documents.
rging der the “green” umbrella: research, design,
urban design, manufacturing and agricultural y
the Willamette Valley, and in a sipopulation is willing to live "clos
External Perceptions of Cascadia
To the rest of the world, this internal struggle to balance wild, rural, and urban is not appy the stereotypical picture of highly-caffeinatedce is what comes to mind. These external perceptions, while generalized and somewhat prejudicial, are not completely untrue. Using underlying values associated with each of those trademarks—namely entrepreneurship, civic engagement, and concern for
eral "tree huggers" wearing North Fac
the natural world—Cascadia can continue to brand itself in a unique way.
A recent publication by Richard Florida19 fothat talent, economic growth, and innovation are gaining importance with the emergence megaregions, and Cascadia is one of the leadersA survey he conducted with the Gallup Organization ranked Portland high in terms“Place and Happiness.” These measurements looked at many factors, including schools, affordable housing, pu
Cascadia’s Industry Clusters
Though many industries have been long established in parts of the region, or are newly identified and are exhibiting recent growth trends, some sectors rise to the top in terms of benefiting the region as a whole. Four industries are particularly notable in this regard: green technology, creative services, agriculture and food production, and high-tech. Note that this list is not exhaustive.as well, and will be a
Green Industries
While green building and technology currently comprise only a small portion of employment in the region, Cascadia is well positioned to take advantage of opportunities in this emeindustry cluster. A wide range of industries fall unarchitecture, construction, city planning,production. Cascadia’s advantage in this industrcluster lies in its strong commitment to environmental protection among contemporary
ECOLOPOLIS 3.0 12 11/17/2008

political leaders, as well as the existing production and manufacturing infrastructure in the region that can support its growth. The region’s green building and energy production networks continue to grow stronger. Building on this foundation, Cascadia is poiseda globally recog
to become nized “green” expert due to the growing worldwide need for more sustainable
,
general, have economic clusters centered on timber and
22
es.
dependency on traditional goods and resource-based manufacturing.
d
s
is
development.
Opportunities in Manufacturing and Green Building
Like most major cities, Portland, Seattle, and Vancouver have long-established goodsproducing and manufacturing industries. For Vancouver, B.C., the goods producingconstruction, and agriculture industries make up 21.2 percent of total employment opportunities in the B.C. region and 27.3 percent of its total regional GDP.20 The Seattle region’s economic infrastructure is rooted in aerospace, military industries and shipbuilding.21
The Portland region, and Oregon inrelated manufacturing industries.
Industry trends, however, point to a decreasing need for these specific good-based industriIn the Vancouver region, recent economic expansion has come more from service-related industries than manufacturing/goods producing industries.23 In the Seattle region, aerospacefaces slow growth and increasing international competition.24 Another longstanding Seattle industry, the boatbuilding industry, is declining.25 Similarly, in the Portland region, the timber industry has entered a steady decline in terms of amount of jobs and local income provided (STATS). While all three places have the infrastructure for manufacturing, economic trends are moving away from
Jobs provided bygreen industries are ideally suitefor individualsdependent on traditional goodproducing and manufacturing industries and “green-collar jobs” tend to paymore than othermanual jobs.26
An example supporting this assertion is recent wind farm development in the Northwest. Between October 2005 andOctober 2006, seven new wind farms were completed in the Northwest, providing 954 megawatts of new wind power capacity. According to the Renewable Northwest Project, thone year span of wind development resulted in nearly 1,400 construction jobs during peak construction periods and approximately 80 new permanent family-wage jobs for operation and maintenance. In addition, the Ports of Vancouver and Longview, Washington have become the major ports of entry for wind turbine components. The ILWU, Local 4, unloads turbines at thePort of Vancouver and reports that the increased volume of turbines arriving through the port
Figure 2.5 Map of British Columbia Public Post-Secondary Institutions
http://www.aved.gov.bc.ca/institutions/colleges.htm
ECOLOPOLIS 3.0 13 11/17/2008

generated mo
National articles have recently highlighted Cascadian cities, including:
• In 2007, Popular Science Magazine ranked Portland (1), Seattle (8), and Eugene (5) in the Top 10 Greenest Cities, which measured electricity, transportation, green living, and recycling/perspective.
• Travel and Leisure Magazine ranked Seattle first in the nation in Intelligent People, Coffee, and Farmers’ Markets. Seattle also received high scores in cityscape, gay-friendliness, environmental awareness, access to outdoors, people (overall), and underground arts scenes. Portland ranked first in the nation in categories of environmental awareness, ease of getting around/public transportation, ease of getting around, cityscape, pedestrian friendliness, and public parks/open spaces. Portland also ranked near the top for athletic/attractive people, cleanliness, and safety.
re than 25,000 labor hours in the past two years and created about 30 new family 27
rd-
o
Olympic and Paralympic Winter 28
ber
e, and Vancouver are regarded by those outside of the region as
ternational
ented at r. The Portland Development Commission offers assistance to sustainable
a’s Favorite Cities” Travel and Leisure Magazine. 2007. http://www.travelandleisure.com/afc/2007 (accessed May 14,
wage jobs.
The Portland region has recently been making headlines for new solar plants and manufacturers like SolarWorld locating in Hillsboro, OR. California-based solar manufacturers Solaicx Inc. and XsunX Inc. are establishing plants in Portland and Wood Village, Oregon respectively. In the Seattle region Horizon Wind Energy, the nation's thilargest wind energy developer, is bringing jobs to Clark County, WA and Global Energy Concepts, headquartered in Seattle, employs an international workforce of engineers and wind power consultants. In British Columbia, firms such as Cloudworks Energy, Inc. are working tuse hydro-power to produce green, renewable electricity. There is an agreement between BC Hydro and the Vancouver Organizing Committee for the 2010 Games to supply clean power for the entire Olympic games.
In all three cities, the fields of green design and construction are growing. In 2007, the numof LEED certified projects in British Columbia increased 28%, Seattle increased 35% and Portland increased 68%.29 Business networks have also formed in Cascadia to support its emerging green building industry. The Cascadia Green Building Council serves the region’sdesigners, builders and operators of environmentally responsible buildings. A survey of itsmembers revealed that information sharing was a high priority for the organization.30 The result is that Portland, Seattlleaders in green building.
The region’s local governments support the green industries. In Vancouver, the Globe Biennial Trade Fair and Conference on Business and the Environment provides an inforum for environmental industries. The Washington Clean Technology Alliance, a
Washington State business network for clean industries, was launched in 2007 and presthe 2008 Faibusinesses. Svoboda, Elizabeth. “America’s 50 Greenest Cities” Popular Science Magazine. 2008. http://www.popsci.com/environment/article/2008-02/americas-50-greenest-cities?page=1 and “Americ2008)
Creative Services
Vancouver, B.C., Seattle, and Portland have individually cultivated national reputations for playing host to specific segments of the creative services industry. Like the green industries
ECOLOPOLIS 3.0 14 11/17/2008

cluster, the creative services industry is multi-faceted. It encompasses the fields of film and music production, advertising, performing arts, architecture, interactive media, photography, design and visual communication, and literary and culinary arts.31 In addition to providing a strong economic base, the creative services industry provides numerous cultural benefits to the community.32
es
ooting
s,
e recent survey found that 10% of these firms have annual
36
s
ustry directly contributed $207 million to the local economy in 2001, as well as 2,266 jobs.39
es
ooting
s,
e recent survey found that 10% of these firms have annual
36
s
ustry directly contributed $207 million to the local economy in 2001, as well as 2,266 jobs.39
In Vancouver, B.C., commonly referred to as “Hollywood North”, the film industry contributover $1 billion annually to the local economy and employs close to 50,000 people.33 Foreign production has driven the growth of the area’s film industry, making it the third-largest center for film and television production in North America.34 In addition, Vancouver has capitalized on its wealth of natural resources and proximity to Los Angeles in order to build an extensive industry infrastructure, including three major film companies, twenty-six studios, fifty shstages, and seventy post-production facilities.35 Vancouver is also considered a “global hotspot” for the new media industry, which includes digital gaming, animation, visual effectand post-production services. While the industry is still in the early stages of development, Vancouver is home to 800 firms that fall into this industry category, one-quarter of which werformed within the last two years. A
over $1 billion annually to the local economy and employs close to 50,000 people.
revenues in excess of $5 million.
Seattle is home to 3,578 arts-related businesses, which employ 18,493 people.37 Because of itsignificant impact of the city’s economy, the Seattle Office of Economic Development has a department dedicated to the city’s film and music industry. Seattle’s music industry alone generates $650 million annually and accounts for nearly 8,700 jobs.38 In addition, Seattle’s film ind
revenues in excess of $5 million.
33 Foreign production has driven the growth of the area’s film industry, making it the third-largest center for film and television production in North America.34 In addition, Vancouver has capitalized on its wealth of natural resources and proximity to Los Angeles in order to build an extensive industry infrastructure, including three major film companies, twenty-six studios, fifty shstages, and seventy post-production facilities.35 Vancouver is also considered a “global hotspot” for the new media industry, which includes digital gaming, animation, visual effectand post-production services. While the industry is still in the early stages of development, Vancouver is home to 800 firms that fall into this industry category, one-quarter of which werformed within the last two years. A
Seattle is home to 3,578 arts-related businesses, which employ 18,493 people.37 Because of itsignificant impact of the city’s economy, the Seattle Office of Economic Development has a department dedicated to the city’s film and music industry. Seattle’s music industry alone generates $650 million annually and accounts for nearly 8,700 jobs.38 In addition, Seattle’s film ind
The Economic Impact of Seattle’s Music Industry, A Report for the City of Seattle's Office of Economic Development. W. Beyers, A. Bonds, A. Wenzl, P. Sommers, University of Washington. February 2004.
Table 2.2 The Economic Impact of Seattle’s Music Industry
ECOLOPOLIS 3.0 15 11/17/2008

Portland’s creative industries are gaining global recognition, specifically in the areas of food, music, and alternative films.40 However, the city’s focus within the creative services industry is in design, technology and communications, including advertising, marketing, strategicommunications, and urban design.
c 41 In 2002 these creative services industries generated jobs
for a total of 14,000 employees and revenues of $2 billion.42
Creative service industries present opportunities for collaboration on a megaregional scale. Maintaining a competitive edge in creative services means recruiting and retaining a creative and educated workforce, providing the physical and information-based infrastructure to make it easy for clients to utilize the services, and providing financial incentives for additional investments in this industry. Each of these cities has traditionally used the idea of proximity to describe intra-city closeness between all facets of their respective creative industry. The next step is to foster inter-city relationships between Portland, Seattle, and Vancouver. This is especially important to consider as the creative service industry can be made up of small specialty firms, focusing on one part of the process, whether it be film, music, or design.43
According to a Portland Development Commission report on creative services, “many firms specialize internally and collaborate with other firms to provide comprehensive products and services to clients. This requires well-connected networks and the ability to rapidly cooperate”.44 Currently, each of the three cities focuses on specific aspects of the creative services industry, so there is a viable argument for increased collaboration and knowledge sharing between these cities and regions, resulting in overall benefit to the industry.
Two universities in Cascadia, U of O and UW, are ranked in the top 100 fine arts graduate programs in the United States by US News & World Report for 2008.45 The U of O also has a unique masters program focusing on fibers. Simon Fraser University (SFU) in Vancouver is home to the non-profit 7th Floor Media center where nationally recognized creative media applications for education and culture are developed.46
Agriculture & Food Production
In Cascadia, agriculture is more than farming. The agriculture industry has long contributed to the region’s quality of life, sense of place, job base, economy, and stewardship of the region’s natural resources.47 The region’s rich soil, varied geography, and climatic conditions allow for a wide range of agricultural activity.
Figure 2.6 Cascadia’s Bounty- A.DeMersseman
Agriculture is British Columbia’s third largest primary industry.48 Wholesale sales of the area’s food products—including domestic sales—amount to more than $33 billion in annual receipts, and an additional $2.4 billion in food products are exported each year.49 In addition, more than 250,000 people in the province are employed in the industry.50 While only 3 percent of total provincial land area is considered “arable or potentially arable,” up to 30 percent of the province has some agriculture potential. More specifically, farm holdings in British Columbia cover 2.6 million hectares, 618,000 hectares of which are in crops, and more than 1.4 million hectares are used for pasture or grazing.51 Further, it is estimated that 10 million hectares—including over 8.5 million hectares of Crown land—are classified as open or forested grazing land used by the ranching
ECOLOPOLIS 3.0 16 11/17/2008

industry.52 Agriculture Land Protection Policies
Vancouver, B.C.: In 1973, the provincial government introduced the Land Commission Act. The Act appointed a commission, which established special land use zone to protect agricultural land called Agricultural Land Reserve (ALR). Currently, approximately 5% of the land area in the province is within the ALR.
Washington: In 1990, the state legislature adopted the Growth Management Act (GMA). The Act requires that local governments manage the state’s growth by “identifying and protecting critical areas and natural resource lands, designating urban growth areas, preparing comprehensive plans and implementing them through capital investments and development regulations.”
Washington currently has approximately 34,000 farms on more than 15 million acres of land. The state produces 300 commercial farm and livestock products valued at $6.4 billion and is the third largest agricultural exporter in the U.S., with $6.7 billion in agriculture exports in 2007. In addition, food processing is a $12 billion industry in the state, and the agriculture industry is the state’s largest employer.53
Oregon: In 1973, Senate Bill 100 created the Land Conservation and Development Commission (LCDC), which established 19 statewide planning goals that are achieved through local comprehensive planning. Goal 3: Agricultural Lands states “agricultural lands shall be preserved and maintained for farm use, consistent with existing and future needs or agricultural products, forest and open space.”
Oregon produces 220 different commercial commodities.54 Agriculture ranks first in the state in terms of volume of products sold, and ranks third in the value of exported products. Moreover, agriculture-related activity represents 10% of Oregon’s gross state product, with total agriculture sales for 2007 equaling $4.9 billion. Many of the state’s top-producing areas are urban counties within the Willamette Valley.55 Multnomah County, with approximately 680,00056 residents, ranks 15th in farm and ranch sales, and Clackamas and Washington Counties are among the top five agriculture-producing counties in the state.57 The industry continues to create new jobs in Oregon, and currently an estimated one in every ten jobs throughout the state is related to agriculture.58 Approximately 28% of Oregon’s land area is in agricultural use59, with about 14.7 million acres in commercial agriculture60 use.61
Growth Management Hearings Boards. (n.d.). Role of the Growth Management Hearings Boards. Retrieved on June 3, 2008, from http://www.gmhb.wa.gov/board_role/index.html
Oregon Department of Land Conservation and Development. (2007, August 10). Statewide Planning Goals. Retrieved June 3, 2008, from http://www.lcd.state.or.us/LCD/goals.shtml
Provincial Agricultural Land Commission. (n.d.). How the ALR was established. Retrieved on June 3, 2008, from http://www.alc.gov.bc.ca/ALR/Establishing_the_ALR.htm
Cascadia’s agriculture industry faces a number of challenges. For example, urban sprawl is increasingly threatening the region’s agricultural lands. Oregon alone has lost close to a half million acres of farmland62 over the last ten years mostly due to development.63 In addition, the efficiency of the region's transportation system plays a major role in the competitiveness of Cascadia's agriculture industry.64 Many U.S. agriculture industry leaders believe that the current national transportation strategy does not sufficiently address industry concerns.65 Another challenge facing the industry is an aging workforce. In 1974 the average age of a farmer in the U.S. was 50 years old, and this number has been increasing every year since 1978.66 Finally, where other states and regions are able to define and market their local agriculture industry by specific products, Cascadia’s agriculture industry is unique because of its diversity. While the region’s ability to produce numerous agricultural products is a benefit for local consumers and helps producers withstand the volatility of the market, it has presented marketing challenges to the industry.67
ECOLOPOLIS 3.0 17 11/17/2008

However, these challenges can serve as a major stimulus for regional collaboration. While Oregon, Washington and Vancouver each have their own government and non-profit groups working toward solutions to these challenges, a regional approach would be more effective. The challenges of urban sprawl cross political boundaries; therefore, the development of regional regulations is critical to the preservation of Cascadia’s agricultural lands. Transportation challenges affect the entire region’s agriculture economy, and proposals to address these challenges at a national level include “improving rail capacity and service, and shifting more of the movement…to rail and barge.”68 Coordinated transportation planning to move both people and products must happen at a regional scale. Solutions dealing with the effects of an aging agriculture workforce must be approached through the coordinated efforts of colleges, universities, and technical schools throughout Cascadia. Finally, an approach to the marketing challenges faced due to the region’s diverse agricultural products may simply be to use “Cascadia” as the marketing strategy—thus, focusing on the region as the brand.
In the 1980’s a farmer in Lake Oswego, OR developed a mechanical harvester for asparagus. Recently, the Washington legislature appropriated millions of dollars toward mechanization to assist the asparagus industry in Washington, which is declining due to cheap imports from other countries. Washington State University has been involved with mechanization evaluation and research. This is a great opportunity for Oregon universities to partner with WSU and the Washington legislature to assist the asparagus industry in the Northwest. Research on mechanization would also be useful for other labor-intensive crops such as strawberries, raspberries, blackberries, and other tree-fruits.
Over 20 agriculture-related degree programs are offered in Oregon colleges and universities. Washington offers 29 such programs. A report published by the Oregon Department of Agriculture, in collaboration with the Oregon University System, discusses ways higher education can partner with natural resource industries to capitalize on Oregon’s land base. Some existing initiatives include the Food Innovation Center (a collaborative process between the Department of Agriculture and OSU) and Clackamas Community College’s outstanding agriculture and nursery program. The Northwest Food Processors Association “has issued a contract for consultant analysis of a Cluster-Based Approach to Promote Innovation, Entrepreneurship and Growth in Food Processing” in Oregon and Washington.69
From Oregon Department of Agriculture. (2007, May 17). Oregon University System Subcommittee. Retrieved May 2008, from http://egov.oregon.gov/ODA/do_reports_higher_ed.shtml
High-Tech
The High-tech cluster in Cascadia is characterized by international trade, growth, high education levels and high wages—especially in research and software development. With high-profile contributions to the field from Silicon Valley, strong domestic competition from Boston and Chicago (among others), and high-tech hubs appearing worldwide from Toronto to Dublin to Bangalore, working to establish an international leadership role in the high-tech industry is challenging.
ECOLOPOLIS 3.0 18 11/17/2008

Table 2.3 Residents of Cascadia earn higher incomes than average 70 Region Income*
Portland $46,090
Seattle $50,733
Vancouver $34,007
U.S. $41,994
Canada $31,757
* U.S. Census measures median household income; Statistics Canada measures average income; Portland and Seattle are measured in U.S. dollars; Vancouver measured in Canadian dollars.
Across Cascadia, the high-tech sector is playing a growing part in the urban workforce. The high-tech sector provided over 90,000 jobs to Puget Sound in 2006, growing 5%71 and exceeding the average U.S. employment concentration ratio by 50 percent.72 The Seattle area is home to the headquarters of Microsoft, RealNetworks and Amazon, and has offices for Google. These firms are large employers in downtown Seattle and the region. These bigger software companies in the Seattle area have spawned a local network of start-up firms lead by former employees, which garner significant venture capital and are noteworthy employers in their own right.73
In metro Portland, the high-tech industry’s revenue was over $16 billion in 2006.74 The area hosts research offices for HP and Intel. Siltronic, a silicon wafer and chip manufacturer, set up their first production facility outside of Germany in Portland and The Dalles is home to a Google Data center. In addition, Oregon’s largest high-tech employer is semiconductor manufacturing.75 Tektronix, headquartered in Beaverton, OR, is a world leader in test, measurement, and monitoring and holds close to 700 patents. The Portland area is also home to leaders in Open Source software, including Linus Tovalds (Linux) and Ward Cunningham (Wiki). Offices of the Linux Foundation are located in Beaverton, Oregon, and OSCON, the international Open Source Convention, is held annually in Portland.
In the Vancouver area, the strength of high-tech industries is not as clearly defined by highly visible industry leaders. However, the industry is growing, and is beginning to establish institutional support. In British Columbia, both high-tech manufacturing and service industries are expanding faster than the overall B.C. economy, and accounted for approximately 5.2% of
the province’s overall economic output in 2006.”76 Over two-thirds of these B.C. high-tech employers were located in the Greater Vancouver area.77 Washington Senator Maria Cantwell, a
former Vice Present of Marketing for RealNetworks, is a vocal advocate for the high-tech sector. She spoke out in defense of Microsoft in the DoJ’s anti-trust case and supported the expansion of the H-1B visa program that admits immigrant workers in specialized fields. Her top campaign contributors in 2006 were Microsoft employees and their families.
www.OpenSecrets.org
Political Leadership
Three factors provide the impetus for Cascadian high-tech collaboration: the global competitiveness of the tech sector, the wide variety in types of high-tech business in the region, and the regional culture of innovation. Individually, Seattle, Portland and Vancouver do not have the population, visibility, or educational infrastructure to compete with Silicon Valley or Bangalore. However, the differences in technical expertise, from Open Source to Microsoft to
ECOLOPOLIS 3.0 19 11/17/2008

manufacturing, reveal an opportunity for information exchange without threatening each city’s competitive edge.
Indications of potential collaborations are already emerging between the cities. A new Microsoft facility, planned for Vancouver, will not only enhance its high-tech sector, but will strengthen its relationship with Seattle and their competitiveness with Silicon Valley. Another opportunity lies in sharing skills for leveraging venture capital. Currently supporting this effort is The Alliance of Angels, based in Seattle, providing mentorship and building connections between startup high-tech companies in the Pacific Northwest and investors.78
Another possible opportunity for collaboration lies in the development of a Knowledge Development Fund (see sidebar). Cascadia could develop such a fund where high-tech companies and universities match federal infrastructure funds allocated at a megaregional scale. The funds would be prioritized for high-tech research and workforce preparation in order to remain competitive against the international and California markets.
Table 1.4 On average, residents of Cascadia’s three major cities have reached levels of education higher than the respective national averages 79
Region Bachelor’s Degree or Higher*
Portland 27.7%
Seattle 32.0%
Vancouver 30.7%
U.S. average 24.4%
Canada average 22.9%
* Cumulative U.S. Census data for “bachelor’s degree” and “graduate/professional degree”; Statistics Canada data for “university certificate, diploma, or degree at bachelor’s level or above”
Challenges to Planning for Cascadia
Recent trends, such as globalization, flexible specialization, deindustrialization, economic integration, and entrepreneurial governance have not yet led to regional cooperative responses by the public sector80; local planning structures still dominate. Nonetheless, aiming for cooperation based on megaregional identity and the recognition of the potential benefits of cooperation may have some promise.
Building on Cascadia’s shared natural environment and history, and the resulting cultural similarities, it is an easy next step to emphasize a megaregional development strategy. There is a sense that the national capitals of Washington, DC and Ottawa are so far away as to not have a great deal of influence over the region and that there is a loosely liberal-libertarian streak running through Cascadian politics on both sides of the border.81 However, all is not as straightforward as it may seem, and many challenges exist for reaching agreement on planning policies at a megaregional level.
The most obvious obstacle to megaregional planning is the international border between the United States and Canada. As recently as January 1, 2008, additional security measures were added to the US-Canada border crossing requirements, resulting in the need for additional preparation and time to cross the border. Concurrently, programs are being developed and
ECOLOPOLIS 3.0 20 11/17/2008

implemented to mitigate some of the effects of heightened security. One such program, NEXUS, allows pre-screened and approved travelers faster processing.82 However, the free flow of people and capital, and one could even say the absence of defined borders that characterized the region for centuries, is a thing of the past. The goal of both the U.S. and Canadian governments is to make the border less permeable in order to maintain security, resulting in added bureaucracy, and moving against the free flow of commerce and people.
Unlike other megaregions, where the defined boundaries are wholly within the United States, the formation of a Cascadian megaregion has significant implications for the two national governments. There is little incentive for the U.S. government to encourage investment north of the 49th parallel, and the same holds for Canada looking south. In other words, “it makes a difference whether a Korean electronics firm decides to invest its $2 billion in Oregon or British Columbia.”83 These difficulties make themselves evident in the small, everyday tasks of those trying to do business across Cascadia. James Phillips, former President and CEO of Can/Am Border Trade alliance, had this to say about Cascadia: “success here is [in] the layering, the cooperation, the open communication: there is none better that I know.” But then he continues: “the most frustrating problem that they all have is … truck size and weights between the provinces and states.”84
In addition to the institutional challenges that face Cascadia, preparation for higher education is another area of infrastructure on which Cascadia needs to focus. According to the National Center for Public Policy and Higher Education, over the past decade the chance of ninth graders enrolling in college anywhere within four years has dropped from 40% to 33% in Oregon, whereas in California, the percent of 18-24 year olds enrolled in college has risen from 32 to 40%. The percentage of annual family income needed to pay net college costs at a four-year institution has risen from 25 to 36% in Oregon and from 20 to 31% in Washington.85
Moving beyond institutional and educational difficulties is the more intangible dilemma of identity and the role it plays in competition as compared to cooperation. The three major cities within the region share a number of common traits including a physical, cultural, and historic foundation, as well as a strong sense of individuality and an entrepreneurial spirit. However, an overall commitment by all parties to look towards the greater good, recognizing that one area’s success will help the whole, needs to be fostered. Therefore, an overall economic development strategy, focused on common but specifically targeted industry clusters, would complement the region’s shared heritage and help build a common identity.
All four of the industry clusters outlined above benefit from and contribute to the Cascadian brand. The role outlined for creative services will foster intra-city cooperation, expanding their current role of inter-city cooperation. Expanding green technology offers an alternative for the declining current manufacturing base. The agriculture and food production strategies outlined will lead to intraregional cooperation. Developing high-tech clusters uses the regional concept of Cascadia as a method for promoting international linkages.
For this to be effective, each city and district within Cascadia must work to identify its own niche within the megaregion’s targeted clusters, based upon the megaregion’s overall strengths and the individual cities’ character and structure. The four industries recommended here combine to support a wide range of development, and build upon the region’s identity, particularly as a pioneer in the sustainability movement, meshing well with its national and
ECOLOPOLIS 3.0 21 11/17/2008

international reputation. Developing and expanding the linkages between industry and the existing educational institutions would encourage strong partnerships across the region and would support these efforts. Adding to and building on this concept is fostering professional networks, supported by improved networks of transportation and communication.
ECOLOPOLIS 3.0 22 11/17/2008

III. Sustainability: Reducing Cascadia’s Environmental Footprint
The 1987 United Nations report Our Common Future defines sustainable development as “development that meets the needs of the present without compromising the ability of future generations to meet their own needs.” Foreshadowing most current thought about what people require to meet their needs, the noted regional planner Benton MacKaye reasoned that communities need to address “three corresponding problems: (a) The conservation of natural resources, (b) the control of commodity flow, (c) the development of environment,” a term he uses to describe a healthy social system able to support the individual and collective pursuit of happiness.86
Today, these three arenas, the natural environment, the economy, and society are referred to as the three legs of sustainability. In order for current and future generations to meet their needs, they need a healthy environment, a stable economy, and an inclusive, dynamic social system. All three areas are profoundly affected by our infrastructure investments and need to be taken into consideration when making decisions about the location, type, and amount of infrastructure in which we are willing to invest.
Over the course of the 20th century, five related challenges to the health of our environment, economy, and society have arisen, and must be addressed by a sustainable infrastructure agenda. First is the heavy dependence on fossil fuels for energy production. The extraction, refinement, and combustion of coal, oil, and to a lesser extent, natural gas, severely damages our land, air, and climate, putting at risk many of our ecosystems, as well as the diverse social and economic systems which they support. This is particularly evident today with respect to the twin challenges of climate instability and sea level rise, both with clear consequences for Cascadia. Second is increasing consumption of material goods. This puts increased pressure on limited supplies of raw materials and energy, and generates increasing amounts of waste entering landfills.
Third are current infrastructure policies that facilitate and reinforce sprawl. This combination not only increases consumption of fossil fuels but also reduces access to community and regional economic and social assets and opportunities for people unable to afford to travel by car. It also consumes open space necessary for a viable agricultural economy, and pushes development into areas not suitable for habitation due to natural hazards such as floods, landslides, and wildfires. Fourth is the severe undervaluing of
Figure 3.1 Wind turbine in Hood River, Oregon
Figure 3.2 Bike commuters in Portland, Oregon
ECOLOPOLIS 3.0 23 11/17/2008

natural infrastructure systems, conceived of here as interconnected networks of waterways, wetlands, woodlands, wildlife habitats, and other natural areas that are essential for a healthy climate, clean air and water resources, improved physical health, and a high quality of life. Our past lack of understanding or acknowledgement of these contributions has resulting in a lack of investment in their preservation and stewardship.
The final challenge is population growth, which amplifies the previous four challenges. In 1900, the U. S. population was just over 76 million people. By 2000, it had increased 245% to almost 273 million people. Current census projections predict that by 2050, the country’s population will reach 419,854,000, a 50% increase from 2000. We not only have plan where these people are going to live, but should do so in a way that addresses the four other challenges to sustainable development described above.
A megaregional infrastructure program, done strategically and right, can help to address these challenges to sustainable development. The following sections outline the problems for Cascadia that have been created in by these challenges and identify opportunities for action based on the region’s current political and institutional arrangements and activities. We end by suggesting criteria to guide future investments in regional infrastructure programs. Taken as a whole, they seek to address the main challenges to sustainability by identifying the ways in which infrastructure can improve Cascadia’s environmental health, limit and mitigate Cascadians’ exposure to natural hazards, and increase everyone’s access to the megaregion’s social and economic assets and opportunities.
Figure 3.3 Sky Train in Vancouver, BC
Greenhouse Gases and Climate Change
Beginning with the Industrial Revolution, human activities have produced increasing amounts of certain greenhouse gases that have upset the planet’s atmospheric chemical balance, which in turn has led to an accelerated warming of the planet. In its fourth assessment report released
in 2007, the Intergovernmental Panel on Climate Change (IPCC) reported that global temperatures had risen 1.3" Fahrenheit between 1906 and 2005, contributing to an 8” rise in average sea levels over a similar period.
Electricity Generation
33%
Transportation28%
Industry19%
Other1%
Agriculture8%
Commercial/ Residential
11%
Figure 3.2 US GHG Emissions by Sector
Source: “Inventory of U.S. Greenhouse Gas Emissions and Sinks:1990-2006,” US EPA (2008)
By the end of this century the IPCC models predict further warming of between 2" and 11.5" F., and attendant sea level increases of 7” to 23”.87 If the current rate of warming goes unchecked, the ability of the planet’s natural and social systems to adapt to rapidly changing weather systems and sea levels will be severely compromised and catastrophic
ECOLOPOLIS 3.0 24 11/17/2008

weather-related changed and events could result.
GHG reductions in Cascadia and elsewhere are particularly difficult to achieve for four related reasons. First, climate change is a global issue that will ultimately have to be addressed at a global scale to be effective. Second, many of the more effective strategies require a level of inter-jurisdictional coordination that has not been attained before. Third, GHG emissions are linked to virtually every sector of the economy, particularly the core areas of transportation and energy production, as indicated by Figures 3.4 through 3.7. Finally, while there is general agreement on the levels to which GHG emissions need to be reduced, it is still not clear that the
strategies being considered will actually achieve the necessary reductions. Because of the newness of the problem few models exist which can guide governments in selecting proposed changes and investments that will actually work.
Commercial/ Residential
9%
Agriculture7%
Other2%
Electricity Generation
16%Transportation
45%
Industry21%
Despite these difficulties, many local jurisdictions in Cascadia and elsewhere in North America have expressed great interest in greatly curbing their GHG emissions. The lack of effective modeling tools and an effective national or international framework for achieving the necessary reductions makes it difficult for localities to individually implement effective policies. To do so under the current structure puts them at a distinct disadvantage in the economic arena and the ultimate environmental benefits would potentially be negligible at a global scale.
Figure 3.3 Washington GHG Emissions by Sector
Source: “Washington’s Greenhouse Gas Emissions: Sources and Trends,” WA Department of community, Trade, & Economic Development (2006)
Figure 3.7 Oregon GHG Emissions by Sector
Figure 3.6 British Columbia GHG Emissions by
Industry28%
Transportation48%
Commercial/ Residential
15%
Electricity Generation
4%
Agriculture5%
Source: “Environmental Trends in British Columbia: 2007” BC Ministry of Environment (2007)
This has led even the most aggressive cities and regions to restrict their efforts to those which do not challenge their local economic development goals. In the Cascadia region, this is perhaps most apparent in the lack of enforcement mechanisms accompanying all of the major climate action plans. As a result, even the most aggressive and effective jurisdictions such as British Columbia have been unable to make the investments and structural changes necessary for lowering their overall GHG emissions, with small but noticeable per capita reductions being
Transportatio33%
Agriculture7%
Industry12%
Other3%
Electricity Generation
36%
Commercial/ Residential
9%
n
Source: “Oregon Strategy for Greenhouse Gas Reductions” OR Department of Energy (2004)
ECOLOPOLIS 3.0 25 11/17/2008

more than offset by population growth. (Figure 3.8).
Opportunity
As Figures 3.4 through 3.7 demonstrate, the bulk of GHG emissions in Cascadia come from the transportation
and electricity generation sectors. These are also the two sectors whose emissions can be most directly affected by targeted infrastructure investments coordinated on a mega-regional scale. All of the major jurisdictions in Cascadia have developed climate action plans that would meet or exceed the benchmarks set by the Kyoto Protocols. They achieve this in large part by reducing vehicle miles traveled (VMT) and by developing renewable energy portfolios to reduce their dependence on fossil fuels.
Figure 3.4 British Columbia Total and Per Capita GHG Emissions
Source: Emissions data from Environment Canada 2007; population data from Statistics Canada
Case Study: LUTRAQ
In what began as a challenge to a proposed new highway in Washington County, Oregon, the public interest group 1,000 Friends of Oregon spearheaded an effort to reconsider how transportation and land use planning were done in Oregon.
The project, Making the Land Use Transportation Air Quality Connection (LUTRAQ), resulted in a comprehensive Smart Growth proposal for improving air quality by designing communities and transit systems that would reduce peoples need for cars, and thus reduce overall VMT and the air pollution that cars generate. In addition to persuading civic leaders to cancel plans for a new highway, the project’s recommendations helped bolster the case for light rail and TOD that some city leaders and activists had begun making in the 1970s in response to concerns about sprawl. As a result, LUTRAQ and its strategies for improving overall regional air quality by reducing VMT, contributed greatly to the development in the mid-1990s of the 2040 Growth Concept by Metro, Portland’s regional government. In large part as a result of these strategies, Portland’s VMT per capita began to drop in 2000, and by 2004 had declined by 12.5%.
However, they lack effective modeling tools for fine tuning their policies. A regionally coordinated, federally subsidized infrastructure program that incorporates an advanced modeling effort linking land use, transportation, and electricity production, would help them overcome the problems outlined above, and enable them to effectively address emissions from transportation and electricity production.
In order to drastically reduce Cascadia’s GHG emissions from transportation, future infrastructure investments must target projects designed to greatly reduce overall VMT. The Portland and Vancouver, B.C. metropolitan regions have already demonstrated that this can begin to be accomplished through a combination of well-designed public transit systems and smart growth strategies that encourage compact mixed-use development. The Seattle region has recently begun to follow suit and has seen their per capita VMT rates first stagnate and then begin to decline.
Federal investments in transportation infrastructure www.onethousandfriendsoforegon.org/resources/lutraq.html
ECOLOPOLIS 3.0 26 11/17/2008

could greatly amplify these reductions by creating incentives to help jurisdictions within Cascadia overcome divisions and competition. Two key solutions would be the development of a regional transit system centered on a high speed rail corridor linked to related smart growth policies designed to integrate communities and their local transit systems with the regional system and second, the implementation of a regional road-pricing strategy that encourages people to make use of their local and regional transit systems.
Figure 3.5 Pounds of CO2 (or equivalents) per mode choice
Source: Sightline Institute
Regarding electricity generation, the bulk of emissions for Cascadia come from the Boardman Coal-fired plant in Oregon and from the Centralia coal-fired plant in Washington. British Columbia has no coal plants and as a result, as indicated in Figure 3.6, energy-related GHG emissions account for only 3% of their total. In order to lower the share of emissions from energy production in Cascadia infrastructure investments must aim not only to preserve, where appropriate, the region’s hydro power infrastructure, but also to encourage and facilitate the establishment of other renewable sources of energy such as wind and sun in order to reduce the region’s reliance on coal. These options are explored in greater detail in the Energy section below.
Investment Criteria
! Reduce VMT ! Rail-based regional transit network coordinated with compact, mixed-use transit and
pedestrian-oriented land use strategies ! Road-pricing strategy ! Reduce dependence on coal-based electricity production
Air Quality
Infrastructure decisions impact the amount of pollutant emissions generated by private vehicles, trains, trucks, construction equipment, marine vessels and port facilities, airplanes, and power plants. Table 1 below shows the portion of criteria pollutant emissions attributable to mobile sources for each of the states/provinces in the Cascadia region.
In addition, coal-fired power plants in Oregon and Washington produce significant NOx and SO2 emissions, as well as some particulates. In Oregon, the PGE plant in eastern Oregon near Boardman (the state’s only coal-fired power plant) contributes 13% of the state’s total NOx and the same fraction of the total SO2.88 It has been singled out as a major contributor to
ECOLOPOLIS 3.0 27 11/17/2008

visibility problems in the Columbia River Gorge.89 Washington’s two coal-fired power plants, the Transalta Centralia plant and the Weyerhaeuser Longview plant, account for 23% of the state’s total NOx emissions, 50% of the state’s SO2 emissions, and 11% of PM10 and 12% of PM2.5 for the state.90 Table 3.1: Mobile Source Contributions to Criteria Pollutant Emissions in Cascadia
Pollutant British Columbia91 Washington92 Oregon93
SO2 13%
(11% marine transportation)
48%
(31% commercial marine vessels)
17%
(11% off-highway, 6% highway vehicles)
NOx 70%
(18% marine transportation, 14% heavy-duty diesel vehicles, 13% off-road diesel)
76%
(48% on-road vehicles)
71%
(22% diesel highway vehicles, 20% light-duty gasoline cars and trucks, 10% non-road diesel)
VOC 37%
(11% light-duty gasoline vehicles, 13% off-road gasoline engines)
16%
(10% on-road vehicles)
30%
(19% highway vehicles, 12% off-highway mobile sources)
CO 60%
(19% off-road gasoline engines, 36% light-duty gasoline trucks and cars)
75%
(52% on-road vehicles, 20% non-road vehicles)
53%
(35% gasoline highway vehicles, 14% non-road gasoline vehicles)
Particulate Matter
PM10: 11%
PM2.5: 14%
PM10: 5%
PM2.5: 12%
PM10: 2%
PM2.5: 4%
Air pollution is not only a local problem; it can also be transported over broad geographic areas with no regard for jurisdictional boundaries. Visibility problems in many scenic areas can be traced to pollution sources that are sometimes hundreds of miles away. This is illustrated in Figure 3.10 showing the trajectories of air masses and pollution reaching Snoqualmie Pass, in
Washington. Figure 3.6 Distribution of autumn trajectories to Snoqualmie Pass, Washington
While air pollution levels in Cascadia are well below levels in the Eastern part of the continent, visibility has degraded at a number of important natural areas, including the Columbia River Gorge, Crater Lake National Park, Olympic National Park, Mount Rainier National Park, and Mount Hood National Forest. Visibility is, in some ways, the canary in the coalmine – pollutants that cause smog and haze also cause impacts on ecosystems and human health as
Source: Characterization of the Georgia Basin/Puget Sound airshed,
ECOLOPOLIS 3.0 28 11/17/2008

concentrations increase. Thus, addressing haze will also reduce impacts on human health and the environment. Figure 3.71 Mandatory Class I Areas where visibility must be protected and/or improved under EPA’s Regional Haze Rule. Of 156 in the county, 12 are in Oregon and 8 in Washington
Source: US EPA (http://www.epa.gov/ttn/oarpg/t1/fr_notices/classimp.gif)
Opportunity
Infrastructure investment throughout the Cascadia region presents an opportunity to shift to more sustainable transportation and power generation technologies that reduce air pollution and that can help shift transportation infrastructure to cleaner energy sources. New infrastructure construction can also be done using equipment retrofitted with advanced pollution controls. In addition, pollution reduction can be achieved by improving existing infrastructure. For example, existing coal-fired power plants can be retrofitted with pollution-control technology.
Air quality is addressed by each of the metropolitan regions and by the two states and one province. All are working to address visibility issues by reducing emissions from transportation and industrial sources. The need for these jurisdictions to work together is highlighted by the 1991 US-Canada Air Quality Agreement, which establishes cross-boundary agreements on air pollution.
In addition, there are a number of organizations and initiatives concerning air quality that cross jurisdictional boundaries. The Georgia Basin/Puget Sound International Airshed Strategy, described in the case study sidebar, provides a model for collaboration and policy coordination.
ECOLOPOLIS 3.0 29 11/17/2008

The West Coast Collaborative, a public-private partnership to reduce diesel emissions along the West Coast, provides a useful model for funding pollution reduction projects. A pilot project of the EPA's National Clean Diesel Campaign, the Collaborative has funded projects including truck stop electrification, marine vessel pollution controls, and education/outreach campaigns.
The Georgia Basin/Puget Sound International Airshed Strategy is an inter-jurisdictional effort to address shared air quality management concerns. The Airshed stretches from the Cascade/Coast Mountains to the east and the Olympic Mountains and Vancouver Island to the west, including Vancouver, B.C., Seattle and Tacoma. Partners include federal, state/provincial, and regional agencies; tribal groups; non-governmental organizations, and academic institutions. The partnership’s efforts include:
! prioritizing air quality issues for action, ! characterizing current air quality and
developing predictive models, ! improving information sharing on air
quality data and pollution sources, ! developing regulations to ensure
cleaner vehicles and fuels, and ! coordination of communications and
outreach activities.
www.pyr.ec.gc.ca/airshed/index_e.htm
Case Study: The Georgia Basin/Puget Sound International Airshed Strategy
Investment Criteria
! Select options with lowest lifecycle emissions of criteria pollutants and hazardous pollutants
! No degradation of visibility at Class I natural areas
Opportunities for Action
! Best Available Retrofit Technology for existing power plants
! Truck stop electrification ! Extend collaborative airshed planning and
visibility management throughout Cascadia
Energy
Demand for energy is growing faster than current population growth. According to the U.S. Energy Information Agency, homes and commercial buildings use 71% of the electricity in the United States and this number will rise to 75% by 2025.94 The growth in the region over the next 50 years, as previously noted, will place a great amount of strain on the energy generation, distribution, and transmission infrastructure, which is currently inflexible and inefficient.95
Concerns regarding climate change, protection of salmon and other wildlife habitat, as well as human health and livability, raise issues with current energy production methods and the prospects for meeting future demand. The Northwest has some of the cheapest electricity in the country, due to its abundant hydrological resources. Although hydro-electricity is often seen as benign, large-scale dams adversely impact the biodiversity of the river habitat by impeding natural migratory patterns of fish species. Resulting sedimentation is often contaminated with high concentrations of agricultural and industrial byproducts. However, what is of greater concern is the 43% of electricity which is produced from the combination of coal (32%), natural gas (8%) and nuclear fuel (3%).96
Both Oregon and Washington have Renewable Portfolio Standards (RPS), which effectively encourages development of renewable energy. An RPS mandates that a certain percentage of a state’s electricity consumption be met by renewable energy sources.97 BC is focusing on conservation by setting a goal of reducing household energy consumption by 50% by 2050. On the energy production end they propose all new capacity to be zero net emissions and to retrofit current systems to reduce emissions by 50% by 2020.
ECOLOPOLIS 3.0 30 11/17/2008
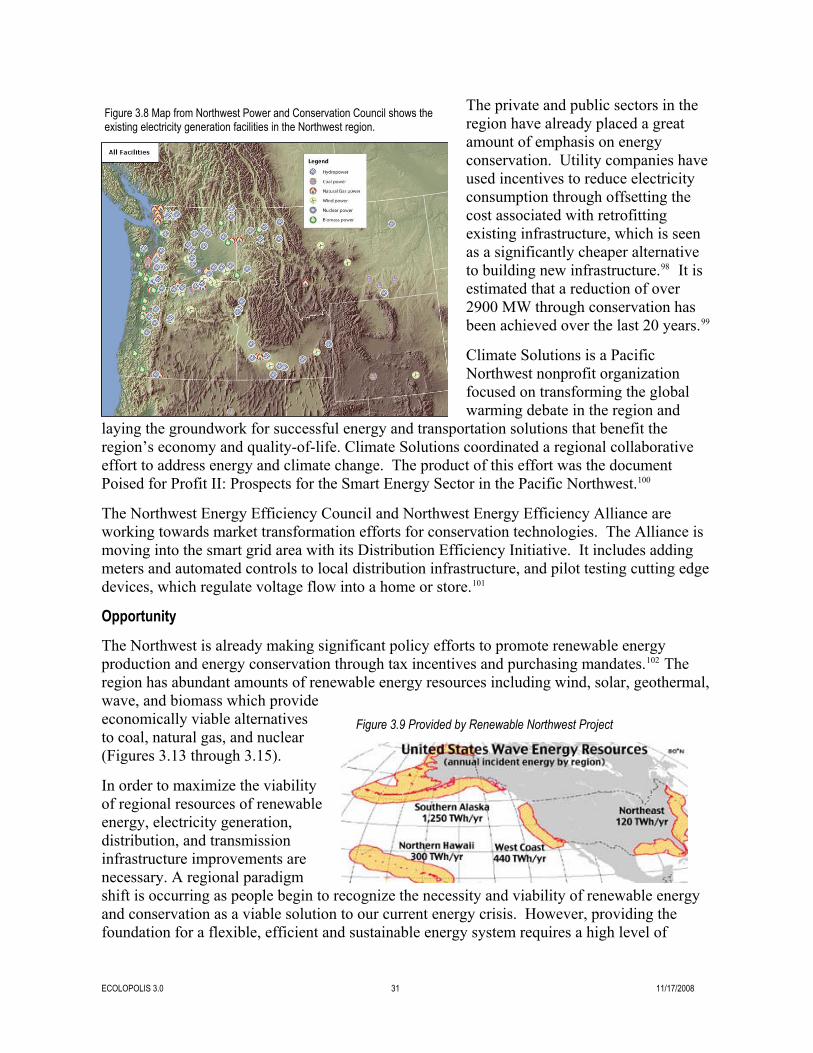
The private and public sectors in the region have already placed a great amount of emphasis on energy conservation. Utility companies have used incentives to reduce electricity consumption through offsetting the cost associated with retrofitting existing infrastructure, which is seen as a significantly cheaper alternative to building new infrastructure.98 It is estimated that a reduction of over 2900 MW through conservation has been achieved over the last 20 years.99
Figure 3.8 Map from Northwest Power and Conservation Council shows theexisting electricity generation facilities in the Northwest region.
Climate Solutions is a Pacific Northwest nonprofit organization focused on transforming the global warming debate in the region and
laying the groundwork for successful energy and transportation solutions that benefit the region’s economy and quality-of-life. Climate Solutions coordinated a regional collaborative effort to address energy and climate change. The product of this effort was the document Poised for Profit II: Prospects for the Smart Energy Sector in the Pacific Northwest.100
The Northwest Energy Efficiency Council and Northwest Energy Efficiency Alliance are working towards market transformation efforts for conservation technologies. The Alliance is moving into the smart grid area with its Distribution Efficiency Initiative. It includes adding meters and automated controls to local distribution infrastructure, and pilot testing cutting edge devices, which regulate voltage flow into a home or store.101
Opportunity
The Northwest is already making significant policy efforts to promote renewable energy production and energy conservation through tax incentives and purchasing mandates.102 The region has abundant amounts of renewable energy resources including wind, solar, geothermal, wave, and biomass which provide economically viable alternatives to coal, natural gas, and nuclear (Figures 3.13 through 3.15).
In order to maximize the viability of regional resources of renewable energy, electricity generation, distribution, and transmission infrastructure improvements are necessary. A regional paradigm shift is occurring as people begin to recognize the necessity and viability of renewable energy and conservation as a viable solution to our current energy crisis. However, providing the foundation for a flexible, efficient and sustainable energy system requires a high level of
Figure 3.9 Provided by Renewable Northwest Project
ECOLOPOLIS 3.0 31 11/17/2008

investment. Electricity supply will play a large role in the region’s economy by providing the resources necessary to attract high energy industries like high-tech to the region as well as support technological advances in our transportation systems like increased mass transit and
electric automobiles. Figure 3.11 Provided by Renewable Northwest Project Public facilities such as roads, sewers
and water lines are regarded as essential services and as such are funded through public-private coordination. The energy infrastructure of the future, which includes distributed energy generation, net-metering systems, and internet-linked (Smart) microgrids should be incorporated and financed through public-private partnerships through new development, which supports long-term regional energy security.103
Figure 3.10 Provided by Renewable Northwest Project
Additionally, identifying areas of critical energy resource significance assures access for long-term utilization. Opportunities exist in the region’s provincial and local jurisdictions to identify areas of regional energy significance and
adopt comprehensive plans to maximize access to those resources. Towards these efforts zoning and building codes should be revised to require developers to assess and mitigate the energy impact of new development either by direct on-site mitigation, through conservation and/or energy generation. An alternative to on-site mitigation, like a fee-in-lieu program, would help support other renewable energy or conservation projects.104
Regional energy compacts already exist. What they lack is the needed support and guidance to facilitate sustainable energy solutions beyond complete regulation or market driven mechanisms. Figure 3.16 shows both the existing and preferred grid and geographically linked grid coordination.
ECOLOPOLIS 3.0 32 11/17/2008

Figure 3.16: Energy Geography of the Pacific North West - Changing Landscapes of Power
Notes for presentation to the Pacific Northwest Regional Economics Conference, Victoria,
17 May, 2001 John Newcomb, Geography Dept, University of Victoria. ([email protected])
Government should lead by example and incorporate net-zero energy systems into all buildings and facilities. Jurisdictions throughout the region are making commitments to building new facilities to LEED or ASHRAE 90.1 standards. The next step is retrofitting existing facilities, examining street lighting and other operational infrastructure, and setting guidelines for energy efficiency.
Investment Criteria
! Maximize energy efficiency ! Mitigate energy demand through renewable energy and conservation ! Rely on regionally available renewable resources ! Incorporate net-metering and micro-grids into new development where feasible Opportunities for Action
! Energy Infrastructure Related Policy: ! Regional Renewable Portfolio Standard ! Regional requirement for renewable energy comprehensive plans ! Updating land use and building codes to adopt energy standards Desired Infrastructure
! Retrofit all government facilities to net-zero energy through conservation and on-site
ECOLOPOLIS 3.0 33 11/17/2008

generation. ! Upgrade distribution and transmission facilities. ! Support transition to distributed energy
generation through improving the grid
Natural Hazards
The Cascadia region is threatened by several kinds of natural hazards. The tectonic geography just off the Cascadian coastline puts the entire region at risk for earthquakes, tsunamis and volcanic activity (Figure 3.17). Scientific evidence shows the potential for a magnitude 9 earthquake in the Pacific Northwest which could have devastating effects.105 Other potential significant natural hazards in the region are wildfires, coastal and riparian floods, and landslides. These natural hazards do not respect national or state borders. An earthquake in Washington, such as the Nisqually Earthquake of February 28, 2001, can be also felt in British Columbia, and depending on its intensity, it can cause destruction in both areas.
As the population of Cascadia increases, so too does the number of people exposed to natural hazards, as well as the potential for natural hazards to occur. With the populations increasing, people are more prone to settle in areas under special risk for natural hazards, such as floodplains, coast lines, seismic zones, or mountain slopes susceptible to landslides which should better be kept free of development. In addition increased development according to current development practices leads to the consumption of
greater amounts of fossil fuels which in turn contribute to an increase in global warming. As the climate warms, current research demonstrates that the potential for flooding and wildfires visiting the area will also increase.
The RACE system was developed to page seismologists when the PNSN automatic system detected earthquakes likely to be felt. With the improvements of the pager technology will in the future allow to provide information about earthquakes in the Cascadia region to the public by the use of a commercial pager system. This system is actually being tested by the Oregon Department of Geology and Mineral Industries (DOGAMI) in Portland.
The RACE system is one part of PNSN’s broader program to provide more and better information about earthquakes and earthquake hazards to experts and the general public.
www.pnsn.org/welcome.html
! monitoring earthquakes and volcanoes in the Pacific Northwest
! the Rapid Alert for Cascadia Earthquakes (RACE) system and
! advanced warning before tsunamis and strong shakings
The Pacific Northwest Seismic Network (PNSN) which is located at the University of Washington's Dept. of Earth and Space Sciences provides services on earthquakes and volcanic activity for the American part of the Cascadia region.
The PNSN is operated jointly by the University of Washington, the University of Oregon, and Oregon State University, and is funded by the U.S. Geological Survey, U.S. Department of Energy, and the State of Washington.
The services provided by the PNSN for the region comprise:
Case Study: Pacific Northwest Seismic Network
Figure 3.12 Pacific Northwest Earthquake Risk.
Opportunities for Action
The primary jurisdictions within Cascadia currently collaborate on efforts to mitigate the effects of natural hazards through the deployment of emergency response systems. This has been accomplished out of the basic recognition that the threats from natural hazards can affect the whole region and do not stop at state or national borders.
ECOLOPOLIS 3.0 34 11/17/2008

A regional infrastructure program for the Cascadia region should be used to enhance and expand the existing cooperate efforts concerned with natural hazard prevention and response systems. The starting point for such efforts would be the Pacific Northwest Emergency Management Compact of 1996, an agreement signed by Washington, Oregon, and British Columbia to provide mutual help in case of natural hazards. It should also be used to make sure that future development within the region is directed away from areas at increased risk of being negatively impacted by natural hazards.
Figure 3.18: Projected sea level rise at the coast of British Columbia
Investment Criteria
! Restrict development in identified natural hazard zones (floodplains, coasts, seismic zones, or mountain slopes susceptible to landslides)
! Build infrastructure that can resist major earthquakes (upgrade or retrofit existing infrastructure)
! Promote development that does not increase the risk of flooding and wildfires – siting and compatibility issues
Opportunities for Action
! Development of a joint emergency response system for natural hazards in Cascadia, ! Joint efforts for a cooperative monitoring system for seismic activity in the Cascadia region ! Flood prevention and protection measures, including structural and non-structural efforts to
adapt to higher risks of flooding due to climate change
Natural Systems
The natural landscape has historically served as a foundation for economic growth through the provision of raw materials, food production, and filtration and sequestration of pollutants. There is mounting evidence, however, both of natural systems under stress and a lack of comprehensive planning for the stewardship and enhancement of ecosystems and ecosystem services.
Opportunity
Ecosystem preservation is critical to sustainable development. Currently there are no megaregional institutions or compacts that can coordinate planning efforts, ranging from integrated water management, to Endangered Species Act (ESA) listing, to strategies for population growth and global climate change.106 Creation of a natural system infrastructure development plan provides an opportunity for business, industry, government and non-profit organizations to develop landscape-scale programs and to coordinate their efforts at the scale
ECOLOPOLIS 3.0 35 11/17/2008
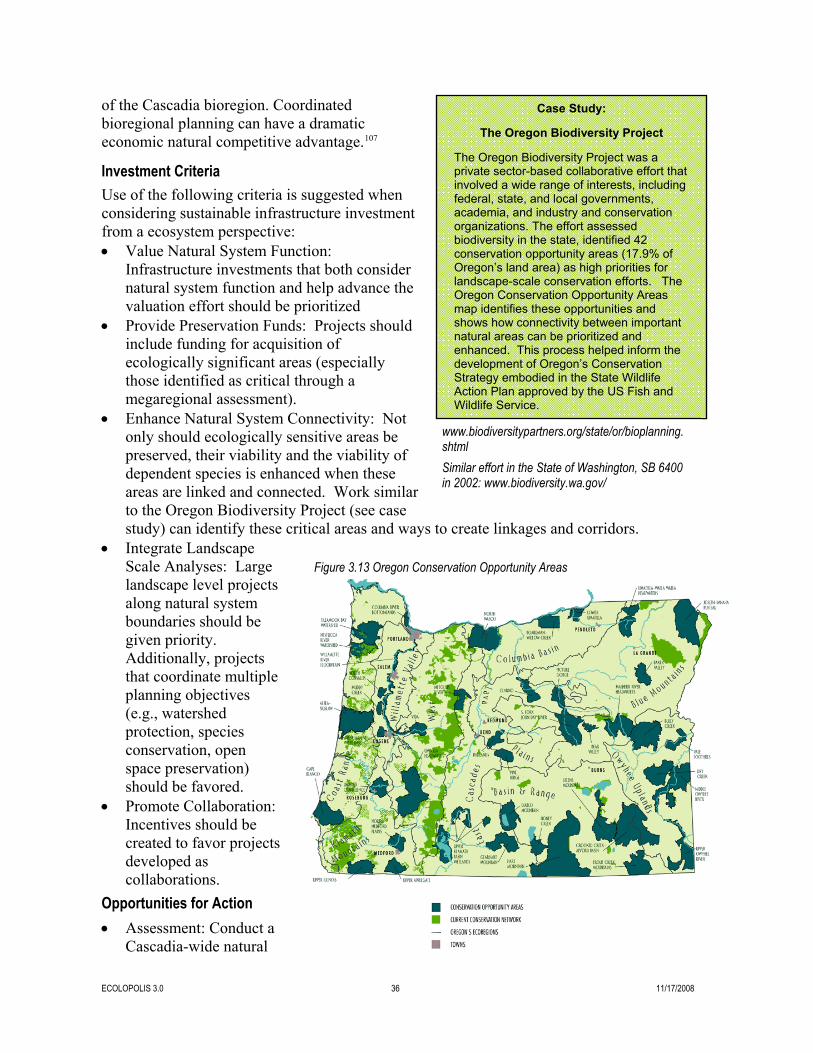
of the Cascadia bioregion. Coordinated bioregional planning can have a dramatic economic natural competitive advantage.107
Investment Criteria
Use of the following criteria is suggested when considering sustainable infrastructure investment from a ecosystem perspective: ! Value Natural System Function:
Infrastructure investments that both consider natural system function and help advance the valuation effort should be prioritized
! Provide Preservation Funds: Projects should include funding for acquisition of ecologically significant areas (especially those identified as critical through a megaregional assessment).
! Enhance Natural System Connectivity: Not only should ecologically sensitive areas be preserved, their viability and the viability of dependent species is enhanced when these areas are linked and connected. Work similar to the Oregon Biodiversity Project (see case study) can identify these critical areas and ways to create linkages and corridors.
Case Study:
The Oregon Biodiversity Project
The Oregon Biodiversity Project was a private sector-based collaborative effort that involved a wide range of interests, including federal, state, and local governments, academia, and industry and conservation organizations. The effort assessed biodiversity in the state, identified 42 conservation opportunity areas (17.9% of Oregon’s land area) as high priorities for landscape-scale conservation efforts. The Oregon Conservation Opportunity Areas map identifies these opportunities and shows how connectivity between important natural areas can be prioritized and enhanced. This process helped inform the development of Oregon’s Conservation Strategy embodied in the State Wildlife Action Plan approved by the US Fish and Wildlife Service.
www.biodiversitypartners.org/state/or/bioplanning.shtml
Similar effort in the State of Washington, SB 6400 in 2002: www.biodiversity.wa.gov/
! Integrate Landscape Scale Analyses: Large landscape level projects along natural system boundaries should be given priority. Additionally, projects that coordinate multiple planning objectives (e.g., watershed protection, species conservation, open space preservation) should be favored.
Figure 3.13 Oregon Conservation Opportunity Areas
! Promote Collaboration: Incentives should be created to favor projects developed as collaborations.
Opportunities for Action
! Assessment: Conduct a Cascadia-wide natural
ECOLOPOLIS 3.0 36 11/17/2008

system infrastructure assessment that identifies green assets, connections, and opportunities for protection/restoration. An integrated water management plan (quantity and quality) should be the foundation of this assessment effort. The following should be considered in the assessment:
! Natural system health and function ! Eco- tourism ! Real estate values ! Public health and quality of life ! Natural System Management Boundaries: Utilize the necessity to address complicated and
integrated ecological challenges to define natural system management regions along more appropriate natural system (e.g., hydrologic) boundaries
! Clearinghouse: Build a natural system information infrastructure and education database for collaborative management purposes.
! Build upon the USGS housed National Biological Information Infrastructure: http://www.nbii.gov/portal/server.pt
Case Study:
Agriculture Land Reserve of B.C. ! Build upon the www.projectdx.com
online tool for educating the public and providing tools for non-points source wastewater management reduction, habitat conservation, and energy efficiency improvements
The Agricultural Land Commission of British Columbia established the Agricultural Land Reserve (ALR) in the 1970’s as a tool to protect potentially productive agricultural land from development.
o an
The ALR is comprised of roughly 4.7 million hectares of private and public land that is currently farmed, forested, or vacant. ! Build up on EPA’s geographically
searchable database that gives water quality facts and maps for each watershed by zip code and provides information for groups active in each area (http://cfpub.epa.gov/surf/locate/index.cfm)
ALR land is subject to special land use policies that take precedent over local plans and zoning regulations. Non-agricultural uses are discouraged, and subject tapplication process.
The Farm Practices Protection (Right to Farm) Act of 1995 reinforces the ARL by explicitly allowing farming practices on ARL land, regardless of local regulations or nearby non-agricultural land-uses. A mediation process has been established to resolve potential nuisance claims, without the need for legal action.
! Each of the universities in the Cascadia region could develop a key competency in the natural system infrastructure project and meetings between these researchers could provide additional coordination opportunities. Together, the Agricultural Land Reserve and
Farm Practices Protection Act ensure that potentially productive land is safe from indiscriminant urbanization, and that agricultural uses are encouraged and protected.
! Leverage Funding: Establish public-private partnerships with non-profit organizations to leverage private funds for the acquisition and management of priority natural system areas.
! Natural System Marketplace: Water banks, conservation and biodiversity banking, and carbon markets are examples of emerging natural system markets that attempt to provide value to ecosystem services and benefits. Integrated development of these natural system marketplaces on the Cascadia megaregional level provides an opportunity to both coordinate and fund desired natural system infrastructure preservation.
www.alc.gov.bc.ca/alr/alr_main.htm
ECOLOPOLIS 3.0 37 11/17/2008

Food Systems
Government policies and infrastructure decisions have encouraged the rapid urbanization of land at a rate outpacing population growth.108 This pattern directly threatens the availability of land for agricultural use, and the habitats of wild species that may also be consumed as food.109 Less directly, these decisions have contributed towards a level of environmental degradation that threatens the viability of the megaregional food system.
policies and infrastructure decisions have encouraged the rapid urbanization of land at a rate outpacing population growth.108 This pattern directly threatens the availability of land for agricultural use, and the habitats of wild species that may also be consumed as food.109 Less directly, these decisions have contributed towards a level of environmental degradation that threatens the viability of the megaregional food system.
Current and potential issues related to infrastructure decisions: Current and potential issues related to infrastructure decisions:
! Deteriorating roads and freight infrastructure inhibit efficient movement of agricultural products, and needed inputs
! Deteriorating roads and freight infrastructure inhibit efficient movement of agricultural products, and needed inputs
! Scarcity of productive land for agricultural use ! Scarcity of productive land for agricultural use ! Scarcity of habitat area for species that are consumed or may be forced to inhabit
agricultural land with negative consequences ! Scarcity of habitat area for species that are consumed or may be forced to inhabit
agricultural land with negative consequences ! Scarcity of energy resources, necessary for every step of the food system ! Scarcity of energy resources, necessary for every step of the food system ! Scarcity of water for agricultural use ! Scarcity of water for agricultural use ! Pollution of water, soil, and air affecting the quality of agricultural products ! Pollution of water, soil, and air affecting the quality of agricultural products ! Increasing global temperature destabilization which affects the success of current crops, the
survival of wild species such as salmon, and the prevalence of destructive pests and diseases
! Increasing global temperature destabilization which affects the success of current crops, the survival of wild species such as salmon, and the prevalence of destructive pests and diseases
Collectively, these issues threaten the food security of Cascadia. Faced with a growing population, it is possible that our ability to produce and distribute food will be diminished to such an extent that it will not be possible to fulfill the region’s demand for food products. Meanwhile, the global food market will face many of the same issues, in addition to likely political changes, potentially placing needed food products out of the
reach of many residents of Cascadia.
Figure 3.14 American Farmland Trust Map of Washington State
http://www.farmland.org/resources/fote/states/
In addition, food products may be available, but of limited quality and variety, and not equally available to everyone within the region. Consumers may be forced to consume lower quality food products of limited nutritional value, further contributing to already widespread equity
In addition, food products may be available, but of limited quality and variety, and not equally available to everyone within the region. Consumers may be forced to consume lower quality food products of limited nutritional value, further contributing to already widespread equity
ECOLOPOLIS 3.0 38 11/17/2008

and public health issues.
Opportunity
Geographically, Cascadia is characterized by fertile soil and a variety of microclimates, facilitating a productive and diverse base of food production. Culturally, the area is characterized by a unique, trend-setting food culture. There is a high demand for organic and
local produce. There is also a developing cuisine culture, contributing to a growing market for specialty foods and artisan production processes. Perhaps most importantly, there is a growing desire on the part of consumers to learn more about the food system, and make direct contact with producers.110 This desire for both quality and transparency suggests that Cascadia is prepared to make the trade-offs necessary for a secure and successful food system.
Figure 3.15 American Farmland Trust Map of Oregon State
http://www.farmland.org/resources/fote/states/
Investment Criteria
! Minimize the conversion of agricultural land ! Avoidance of infrastructure construction on high-value agricultural land ! Avoidance of infrastructure that will encourage the urbanization of agricultural land ! Minimize effect on wild habitat areas, specifically addressing food sources and endangered
species Opportunities for Action
! Preparation of strategies to cope with the effects of global temperature destabilization ! Potential need to transition to other crops compatible with new environmental conditions ! Tools to combat influx of pests and invasive species whose habitats may expand, in
addition to factors contributing to food borne illnesses ! Methods to reduce resource use in food production ! Revision of federal legislation, including the farm aid bill, in order to address the growing
challenges of the food system by proactively preparing for the future. For example, food labeling requirements must be strengthened, to increase transparency and facilitate positive change through consumer empowerment.
ECOLOPOLIS 3.0 39 11/17/2008

Figure 3.16 National Oceanic and Atmospheric Administration Map of Critical Salmon and Steelhead Habitat Areas
http://www.nwr.noaa.gov/Salmon-Habitat/Critical-Habitat/upload/NWR-CH-map.pdf
! Development of a megaregional food security assessment and plan with the goal of moving Cascadia as close as possible to food self-sufficiency.
! Preservation of “Green Infrastructure System” through continued purchase and protection of land by federally funded agencies
! Environmental resources ! Wild habitats
Urban Infrastructure
By 2050, the population of the Pacific Northwest is projected to increase by 83% with the number of urbanized counties growing from 17 to 24.111 How and where this population increase is accommodated will significantly affect Cascadia. Sprawling, low-density development reinforces auto dependency resulting in increased traffic congestion and longer commutes which take a toll on the physical health and social fabric of our communities. Sprawl also destroys agricultural land excessively, encroaches on sensitive habitats and open spaces, and degrades watersheds. Sprawling growth patterns exacerbate the causes and symptoms of climate change and undermine the sustainability of the region for future generations.
The Cascadia region has embraced the notions of growth management and smart growth. Oregon, Washington, and British Columbia all focus development within urban areas. And yet, low-density development is still apparent, especially in the counties around the major cities. In
ECOLOPOLIS 3.0 40 11/17/2008

the Seattle-Tacoma area, 55% of population growth during the 1990s occurred in low-density neighborhoods (defined as having less than 12 people per acre)112 (Figure 3.23). Compact development requires significantly less land, preserving surrounding areas for agriculture and open space while facilitating efficient use of infrastructure.
Case Study:
Portland’s Grey to Green Initiative
The City of Portland’s ‘Grey to Green’ initiative strives to restore urban watersheds and reconnect natural systems disrupted by urban development. The benefits of using green infrastructure for storm water management include reduced flooding, improved water quality, and enhanced fish and wildlife habitat. The initiative demonstrates that green infrastructure can reduce life cycle costs and offset the infrastructure needs of a growing population. For example, green streets and eco-roofs absorb rain reducing the flow of water requiring transport and treatment through the sewer system.
The City has dedicated $50 million over the next five years for the following goals: • Add 43 acres of eco-roofs • Construct 920 Green Street facilities • Plant 33,000 yard trees and 50,000 street
trees • Step up the fight against invasive weeds • Replace 8 culverts that block fish
passage • Purchase 419 acres of high priority
natural areas
www.portlandonline.com/bes/index.cfm?c=47203
Opportunity
Growth patterns and infrastructure decisions are intertwined. Investments in infrastructure influence whether development will sprawl outward or occur in compact centers. And conversely, land use policies influence the need for infrastructure. Infrastructure investments coordinated with smart growth policies would promote sustainable development patterns while supporting efficient use of existing and expanded infrastructure systems. While low-density sprawl requires significant investment in new roads, sewer and water lines, etc, smart growth development
Figure 3.17 Seattle Area Population Density
Source: Si
(compact, mixed-use, infill and reuse) helps minimize the need for costly expanded infrastructure and public services. Green infrastructure and green building standards can further reduce the need for new or expanded physical infrastructure by utilizing natural systems and minimizing resource consumption.
The major metropolitan areas in Cascadia are already known for progressive growth management approaches and are considered models for sustainable land use planning and development. The next step is to coordinate and strengthen existing efforts to ensure that urban infrastructure investment decisions promote sustainable regional growth patterns as Cascadia grapples with future population growth.
ghtline Institute
ECOLOPOLIS 3.0 41 11/17/2008

A coordinated approach is needed to address low-density development sprawling out from the metropolitan areas. Individual areas of compact development are a good start, but smart growth patterns are needed over a larger scale to see meaningful results in transit use, biking, and walking.113 Urban area should be encouraged to establish minimum rather than maximum densities to promote population densities that reduce auto-dependency and therefore greenhouse gas emissions.114 (Figure 3.24) Regional collaboration could help ensure that progress made in one location will not shift sprawl into other areas.
The concept of infrastructure should be expanded to include green infrastructure. Green infrastructure uses natural systems to reduce the need for physical infrastructure and is typically cheaper to install and maintain.115 Small scale urban green infrastructure can promote carbon sequestration (planting trees, providing open spaces,) filter storm water runoff, reduce flooding, and recharge aquifers (bio-swales, green streets, rain gardens.) Green infrastructure maximizes the value of infrastructure investments by serving multiple purposes. For example, greenways help manage storm water runoff and reduce flooding while providing recreational opportunities, improving water quality, and enhancing the appearance of the community.
Figure 3.18 New Residents in Portland Suburbs, 1990-2000, showing benefit of Oregon’s growth management regulations.
Source: Sightline Institute
Investment Criteria
! Promote compact, balanced development by facilitating infill development within urban growth areas.
! Give priority to green infrastructure options. ! Minimize resource consumption and environmental impacts of new development through
green building standards. New buildings should be encouraged to meet LEED standards. Opportunities for Action
! Coordinate local efforts to ensure that urban infrastructure investments are appropriately sized and located to support expected population growth within compact communities and do not facilitate regional sprawl.
ECOLOPOLIS 3.0 42 11/17/2008

! Require minimum densities within urban areas. ! Require minimum densities within urban areas. Case Study: Greater Vancouver Regional District
The GVRD supported and initiated an innovative long-term waste management strategy, the Zero Waste Challenge. The initiative aims to reduce the amount of waste that reaches the landfill by using opportunities to reduce, reuse and recycle. Additionally, the strategy builds off the “Three R’s” by adding two additional elements, Recover and Residuals. The Recovery strategy aims to treat all waste through either material or energy recovery facilities in order to harness benefits from waste. Residual Management aims to pre-treat all waste before sending it to the landfill, thereby reducing the total amount of waste. Infrastructure investments have included recycling, waste-to-energy, recovery and composting facilities. Other innovations include modifying demolition and building permit processes to include waste management plans, wood waste drop-off sites, material disposal bans and an extended producer responsibility program.
The short-term goal of the program is to increase diversion rates from 52% to 70% in the next few years, sending only 30% of the region’s waste to the landfill. Education, outreach, partnerships and regulation are all part of the strategy to reach this goal.
! Explore comprehensive urban green infrastructure options to reduce the need for physical infrastructure.
! Explore comprehensive urban green infrastructure options to reduce the need for physical infrastructure.
Solid Waste Management Solid Waste Management
Programs vary greatly throughout Cascadia, but all contain a common goal of reducing the amount of waste that reaches the landfill. Although the “Three R’s” of waste management (reduce, reuse, recycle) allow us to divert a majority of the waste away from landfills, over 45% of the waste from both Vancouver, B.C.116 and Portland, OR117, is still disposed of in this manner.
Programs vary greatly throughout Cascadia, but all contain a common goal of reducing the amount of waste that reaches the landfill. Although the “Three R’s” of waste management (reduce, reuse, recycle) allow us to divert a majority of the waste away from landfills, over 45% of the waste from both Vancouver, B.C.116 and Portland, OR117, is still disposed of in this manner.
Population growth over the next 20 years will further increase the actual amount of waste that reaches the landfill. Furthermore, if trends such as heightened consumption and the increased amount of product packaging continue into the future, the megaregion may produce increasingly more waste per person. There is also an opportunity cost associated with traditional waste disposal methods, such as landfills and incinerators.
Population growth over the next 20 years will further increase the actual amount of waste that reaches the landfill. Furthermore, if trends such as heightened consumption and the increased amount of product packaging continue into the future, the megaregion may produce increasingly more waste per person. There is also an opportunity cost associated with traditional waste disposal methods, such as landfills and incinerators.
As a megaregion it will be important to determine how to handle waste. Is it fair, or sustainable, to transport the waste of one region or city to another? Should one community take on more of a burden because they have more space to do so? A sustainable waste management plan should not only consider the waste stream, but also the affected parties associated with each plan of action.
As a megaregion it will be important to determine how to handle waste. Is it fair, or sustainable, to transport the waste of one region or city to another? Should one community take on more of a burden because they have more space to do so? A sustainable waste management plan should not only consider the waste stream, but also the affected parties associated with each plan of action.
Opportunity Opportunity
A megaregional waste plan needs to be developed and
embraced by Cascadia as a whole in order to handle solid waste in a sustainable manner. Methods that further reduce landfill waste, encourage local management systems, and recognize the benefits that can be accrued from waste need to be examined.
A megaregional waste plan needs to be developed and
embraced by Cascadia as a whole in order to handle solid waste in a sustainable manner. Methods that further reduce landfill waste, encourage local management systems, and recognize the benefits that can be accrued from waste need to be examined.
Cascadia could seek cyclical waste streams, matching the waste from one user with the input needs of another, and go beyond reducing, reusing and recycling waste to include recovery and residual treatments, as described in the Greater Vancouver Regional District’s “Zero Waste
Challenge” case study. The inverted Waste Hierarchy triangle in Figure 3.25 displays the desirability and effect of each step. Reduction is viewed as the most desirable method and
Figure 3.19 Waste Hierarchy of the Five R's
ECOLOPOLIS 3.0 43 11/17/2008

leads to less waste management in each subsequent step. Residual Management is the least desirable, and the amount of residuals is dependent upon the success of all the other programs.118
While this is the plan of only one region within Cascadia, it could be used to lead Cascadia toward a zero waste future. The infrastructure needs for each region will be different depending upon their current waste management practices, with some being regional while others are more localized. Providing funding for facilities that enable local treatment could decrease the miles waste travels, limit excess burdens on disadvantaged cities or regions, reduce carbon footprints, and promote innovative waste management programs and facilities.
Investment Criteria
! Submittal of a waste management plan, giving preference to those projects aiming to achieve zero or minimal waste.
! An aim to decrease waste by incorporating, but also looking beyond, the traditional methods of reduction, reuse and recycling.
! Use of a cyclical waste cycle at all levels of production: business, community, city, region and megaregion.
! Ensure that all new waste treatment site decisions are equitable and fair by: ! Involving communities in the decision-making process, ! Factoring in historical burdens borne by the community, ! Aim to place the facility in the community that is reaping the benefits. Opportunities for Action
! Develop a “zero waste” plan for Cascadia based upon the work of GVRD, involving stakeholders that represent all regions and interests.
! Create a By-Product Synergy network for the region. ! Strategically site composting facilities between metropolitan areas in order to serve a larger
population. ! Replace traditional waste
incinerators with waste-to-energy facilities as they deteriorate.
Figure 3.26 Single-Family Housing Affordability
! Build localized waste management sites where financially feasible.
! Promote brownfield redevelopment into eco-villages.
Social Sustainability
From a broad perspective, social sustainability is the consideration of how the choices we make affect other people in our community. It relates to both human and
ECOLOPOLIS 3.0 44 11/17/2008

community capacity, and focuses on four guiding principles: equity, security, social inclusion and interaction, and adaptability. Quality infrastructure can assist in reaching these goals, but only if it is allocated equitably and built based upon the principles of sustainability. Underinvestment in sustainable and strategic public infrastructure has led to a disparity between communities and regions.
Historically, the transportation sector has disproportionately invested in highways over mass transit and alternative modes of transportation, leaving many with few options other than driving. At the same time, loose land use laws and high costs of housing in central areas have allowed housing to be built further and further from the central business district and job centers. These public choices have influenced private decisions; people must often choose between affordable housing, far from the city center, with poor mass transit connections, or expensive housing, closer to downtown, and sometimes better connected to public transit. The more people “drive until they qualify” to find affordable housing, the greater the need to extend infrastructure on the urban fringe.
Furthermore, infrastructure investment decisions raise environmental justice considerations: locally unwanted land uses, as well as parks and other amenities, have historically been unequally distributed within cities and regions. For example, communities of color are more likely to house the burdens of society, while higher-income neighborhoods tend to have more public amenities. Future infrastructure investments in Cascadia should address existing disparities and prevent discriminatory distribution of publicly-provided resources.
Opportunity
Cascadia has been a leader in sustainability for many years. In order to maintain that status, we need to begin assessing our decisions from a new perspective that includes all three elements of sustainability. Land use decisions should aim to preserve natural spaces and provide affordable housing for all income levels. Transportation investments should be coordinated with land use decisions to reduce costly infrastructure expansion and minimize combined housing and transportation costs. All decisions should consider the social costs and benefits.
Figure 3.20 Percent Population within ¼ mile of a Natural Habitat
Additionally, all stakeholders should be at the decision-making table, including those that benefit from, pay for, and bear the environmental and social impacts. A Cascadian plan for strategic infrastructure
ECOLOPOLIS 3.0 45 11/17/2008

investment and a conceptual equity atlas could assist in sustainable and equitable funding allocations for new infrastructure. It may also encourage the development of innovative systems and collaborative planning at a regional and megaregional scale. Portland’s Regional Equity Atlas provides a framework for the equity atlas concept.
Investment Criteria
! All stakeholders are represented in the decision-making process and equally informed about the costs and benefits.
! The project is assessed from the triple-bottom line standpoint. ! Infrastructure should be available and accessible to everyone. ! Future environmental and social impacts have been estimated or calculated. Opportunities for Action
! Develop a strategic plan and assessment tool for making infrastructure investments. ! Create a conceptual regional equity atlas. ! Develop a monitoring tool to track infrastructure investments’ impacts on communities and
regions.
In Summary
Cascadians take great pride in their majestic natural environment. Sustainability is a deeply rooted value in this region, where green technology and innovation flourish. The principle of sustainable development needs to be an organizing principle in developing a Cascadian mega-regional infrastructure investment strategy. The complicated and interconnected aspects to sustainable development need to be considered holistically. A sustainable infrastructure investment criteria checklist can help guide future investment in regional infrastructure programs. Key criteria include: ! Process considerations for infrastructure decisions: ! Ensure accessibility to all community members ! Promote local and megaregional collaborative planning ! Utilize comprehensive impact assessment evaluation, including: ! Local and megaregional impacts ! Social and public health impacts ! Economic impacts ! Environmental impacts (giving proper value to ecosystem functions provided by natural
systems and green infrastructure) ! General goals for infrastructure investment: ! Promote compact development and efficient use of existing infrastructure ! Select and site projects to maximize net environmental, economic, and social benefits,
providing triple bottom line returns ! Minimize consumption of non-renewable resources and production of wastes and harmful
by-products (including air, water, and soil pollution; greenhouse gases; etc.) ! Encourage the use of regional and local resources and talent ! Provide infrastructure (broadly defined) to meet the needs of a growing region and to
maintain economic competitiveness ! Reduce vulnerability to natural hazards, climate change, and security threats by directing
ECOLOPOLIS 3.0 46 11/17/2008

growth away from vulnerable locations and enhancing protections in existing areas
ECOLOPOLIS 3.0 47 11/17/2008

IV. Flows: An Infrastructure Inventory for Connecting Cascadia
Choosing where and how to invest in infrastructure is critical for the success of the megaregion as a whole. The vision is a Cascadia with dedicated open spaces, dense urban centers, vibrant rural communities, and bustling ports. The connections between these critical parts of the whole must be strong, efficient, and sustainable to keep Cascadia thriving into the future. In order to achieve this, the following goals must be met: ! Reduce dependence on the private automobile by providing a greater variety of mode
choices ! Provide equitable transportation to a diverse population ! Reduce sprawl, land consumption, congestion, and air and noise pollution while preserving
identified greenspaces and maintaining the livability of the overall environment Today, there is an opportunity to realize Cascadia's role as a sustainable megaregion, with equitable transportation, increased economic efficiency and a greater international presence. We must seize this opportunity to move forward by increasing the flow of and access to information, making strategic physical infrastructure investments, and enhancing the efficient movement of people and goods, all while making Cascadia more sustainable.
Bicycle and Pedestrian Infrastructure
Bicycle- and pedestrian-specific infrastructures are critical components of the multi-modal transportation systems towards which Metro Vancouver, Seattle-Puget Sound, and Portland Metro are striving. Each of these regions has crafted strong identities as epicenters of bicycle and pedestrian activity in recent years. Portland ranks as the second U.S. city to receive the League of American Bicyclists coveted Platinum designation. Eugene, Corvallis, and Beaverton currently hold Silver, Gold, and Bronze designations, respectively. Similarly, Vancouver, Washington has achieved Bronze status, as have communities in the Seattle-Puget Sound Region like Bainbridge and Port Townsend.119
In building upon these and other achievements, the regions have identified – or are in the process of doing so – targeted trail and urban infrastructure investments for improving connectivity and creating more comprehensive and accessible networks in the near term. It is recommended that the three regions develop individual plans for realizing maximum bicycle and pedestrian mode splits in their urban areas and to supplement regional trail endeavors through targeted infrastructure investments. Accordingly, these plans should emphasize safety, connectivity, and convenience of the existing network, as well as future expansions.
Metro Vancouver, British Columbia
In the Metro Vancouver region, TransLink is in the process of developing a Regional Bicycle Plan to “guide regional bicycle investment and programming across Metro Vancouver through 2020 and beyond.” As part of this process, TransLink has identified capacity expansion and improvements to the BC Parkway as its top priority, both for bicycle and pedestrian infrastructure investments.120 The 26 km multi-use trail parallels the Expo SkyTrain Line in connecting 6 Regional Town Centres, 16 SkyTrain Stations, 25-plus bus routes, 15 cycling routes, and eight regional parks, including Surrey City Center, New Westminster, South Burnaby, and East Vancouver.
ECOLOPOLIS 3.0 48 11/17/2008

In addition to the BC Parkway, Metro Vancouver is actively developing a Regional Greenway Network that integrates existing and planned development in providing approximately 100 km of regional trails. Table 4.1 Greenway Prioritized for Development and Improvement by Metro Vancouver
Project Impact
Brunette-Fraser Regional Greenway
Connect Vancouver to New Westminster following the Burnaby Mountain Urban Trail
Delta-South Surrey Regional Greenway
Connect Delta’s Nature Reserve and Watershed Park, Surrey’s Joe Brown Park and Mud Bay Park, the Serpentine Greenway and Boundary Bay Regional Park
Pitt River Regional Greenway Connect Grant narrows Regional Park with municipal trails, the Trans Canada Trail, and Allouette River dyke trail
Seymour River Greenway Connect Lower Seymour Conservation Reserve to Burrard Inlet
Seattle-Puget Sound, Washington
The Puget Sound Regional Council’s Bicycle/Pedestrian Advisory Committee, various non-profit, and community-based organizations have identified priority improvements for the area.121 Table 4.2 Priority Improvements for the Seattle-Puget Sound Area
Project Impact
Marymoor Connector Trail Regional trail linking the Sammamish River Trail and East Lake Sammamish Trail
Centennial Trail Extension Connects Arlington to Skagit County
Interurban Trail Incremental improvements to complete the connection between Ballard and Everett
Burlington Northern Santa Fe Eastside Corridor
Develop a 42-mile regional trail connecting Renton, North Bellevue, Snohomish, Redmond, and Woodinville
Wayfinding System Improve navigation around the Lake Washington Loop, I-90 Corridor, and SR 520 Trail
Mountains to Sound Greenway/I-90 Greenway Regional Trail System
Continue to fill in trail gaps
Metro, Oregon
Metro recently launched its groundbreaking Connecting Green initiative, an unparalleled collaboration of regional non-profits, businesses, citizens, and state and local agencies to identify prioritized park, trail, and natural area investments.122 These include addressing the following bicycle and pedestrian improvements and developments:! 40 Mile Loop Gaps ! Columbia Slough Trail ! East Buttes Loop ! Fanno Creek Greenway ! Gresham/Fairview Trail
! Hillsdale to Lake Oswego Trail ! Mount Hood Connections ! Oregon City Loop ! Path to the Pacific – Council Creek
and Banks to Vernonia
ECOLOPOLIS 3.0 49 11/17/2008

! Rock Creek Greenway ! Trolley Trail & 17th Avenue Connection ! Sandy River Connections
! Tualatin River Greenway ! Scouter Mountain/Mount Scott Loop ! Westside Trail
! Sullivan’s Gulch Corridor Trail ! Willamette Greenway ! Tonquin Trail
Figure 4.1 Maximum Mode Shift Packages, Portland, OR (Draft Plan)
Metro’s vision for a “regional, multi-modal, off-road trail system,” embodied in Connecting Green, comprises an eventual 315 miles of trail network, with the goal of providing half of the region’s population with ½-mile access to a regional trail. Funding for Connecting Green is dependent upon federal approval of a Rails-to-Trails Conservancy application to expand SAFETEA-LU’s Non-Motorized Transportation Pilot Program. The proposed expansion would allocate $50 million funding packages to communities nationwide for investments in pedestrian and bicycle infrastructure.
In addition to regional trails investments, the City of Portland has also identified a series of coordinated urban investments in bicycle and pedestrian infrastructure as part of the Maximum Mode Shift package (Figure 4.1), designed to shift the greatest number of automobile users to bicycle and pedestrian modes.123
Among the projects in the Maximum Mode Shift package are the Sullivan’s Gulch Corridor Trail, North Portland Greenway, and others also identified in Metro’s Connecting Green.
Unified Signage and Wayfinding
The distinct nature of a city’s signage contributes to its imageability and sense of place. A
ECOLOPOLIS 3.0 50 11/17/2008

unified signage system for Cascadia’s major urban areas would provide for essential wayfinding assistance for residents and tourists. The expansion and standardization of signage may become a more important issue as the flow of people and goods within the region increases and Cascadian cities become increasingly interdependent. Signage for bicyclists and pedestrians will aid in the promotion of those modes, by making it easy to navigate within urban and rural areas of Cascadia.
The cities of Portland, Seattle, and Vancouver all feature distinctive signage systems and wayfinding aids (Figure 4.2). The design and implementation of these aids are created by the local jurisdiction in accordance with any locally imposed standards. The Pedestrian
Wayfinding Signage System in the Portland Central City is an example of pedestrian-oriented signage and directional guides. Developed in 2003, the project has installed 102 signs to provide orientation and directions for residents and visitors to the downtown area.
Figure 4.2 Portland Pedestrian Wayfinding Signage System
In addition to pedestrian-oriented signage, Seattle utilizes a dozen information kiosks to assist in wayfinding throughout heavily trafficked downtown areas. The city of Vancouver, BC is in the process of updating their signage in preparations for the 2010 Winter Olympic Games, and a grassroots organization called the Vancouver Public Space Network (VPSN) is hoping to assist residents and visitors by designing creative wayfinding aids in neighborhoods and at SkyTrain stations.
To maximize the potential benefit of pedestrian signage systems, the number of wayfinding aids should be increased in each of the central cities. Additionally, these systems should be coordinated
in terms of function and design. To expand and improve upon their existing signage systems, we recommend a dedicated funding source for Cascadian pedestrian planning agencies.
Land Use and Multi-Modal Hubs
Land use is an important aspect of creating dense urban areas that can support multi-modal transportation. Cascadia needs to develop a compatible set of land use plans. While not expected to be uniform across each jurisdiction, land use plans throughout Cascadia should be similar enough to create a cohesive built environment throughout the region.
These regions can also be thought of as containing multi-modal hubs defined by intense transportation and land use activities (Seattle Department of Transportation, 2005). These are regional growth centers and hubs to which individuals will travel, either as destinations in and of themselves, or as important connecting nodes to their eventual final destinations. As such, high capacity transportation infrastructure must be identified to serve them. In addition to multi-modal hubs and their associated infrastructure, regional airports play a significant role in
ECOLOPOLIS 3.0 51 11/17/2008

ECOLOPOLIS 3.0 52 11/17/2008
moving people between the Puget Sound region and the rest of Cascadia, as well as to other national and international destinations.
Metro Vancouver, British Columbia
Figure 4.3 Vancouver Regional Growth Map
Like its Cascadian neighbors to the south, Metro Vancouver is determined to concentrate growth and transportation services in targeted growth centers (Figure 4.3). As identified in the Livable Region Strategic Plan, these are divided into the Metropolitan Core, Regional Town Centres, and Municipal Town Centres.124 As with the Seattle-Puget Sound and Portland-Metro regions, Metro Vancouver’s Metropolitan Core and Regional Town Centres provide the greatest opportunity for developing multi-modal hubs (although this term is not explicitly used in Metro Vancouver planning, growth management, or transportation system documents).
Figure 4.4 Vancouver Rapid Transit Expansions
Figure 4.5 Vancouver Rapid Bus Network Expansions
In addition to the existing rapid transit lines (Figure 4.4) connecting the Metropolitan Core with Metrotown, New Westminster, Surrey Centre, Coquitlam Town Centre, and Maple Ridge Town Centre, British Columbia’s new Provincial Transit Plan calls for expanded high capacity transit and rapid bus (Figure 4.5) extensions that further connect Regional Centres with Town Centres and the Downtown Vancouver/Metropolitan Core area.125

Of major significance, Metro Vancouver’s planned rapid transit and bus expansions would provide connections between the University of British Columbia, Vancouver Station, and Vancouver International Airport via the new Canada Line, as well as additional rapid bus transit between the aforementioned destinations and numerous Regional and Town Centres located along existing major arterials. Linking Vancouver Station, Vancouver International Airport, and Regional Town Centres via rapid transit would provide an excellent opportunity for developing a multi-modal hub in the Metropolitan Core that could catalyze development of high speed rail connecting to the Seattle-Puget Sound and Portland-Metro regions, as described in the high speed rail section below.
Seattle-Puget Sound, Washington
In the Seattle Transit Plan, the Seattle Department of Transportation has identified five multi-modal hubs within the Puget Sound region. These multi-modal hubs are located at King Street Station, Ferry Terminal, Westlake, University District, and Northgate (Figure 4.6).
Located in “urban centers” where multiple modes intersect, Seattle will work to invest in these multi-modal hubs to develop them as “great public spaces that provide seamless connections between modes.” As in the Portland-Metro region and the Metro Vancouver region, the Seattle-Puget Sound multi-modal hubs are closely linked with regional growth centers (“urban centers”), identified in the Puget Sound Regional Council’s (PSRC) Urban Centers in the Central Puget Sound region plan, as relatively small areas in which regional jobs and housing growth will increasingly be concentrated and which will therefore necessitate additional transportation infrastructure.126 Regional growth centers “are not intended to capture the
majority of the region’s growth, but rather to be easily accessible areas of focused growth offering a wide variety of jobs, services, and important civic and cultural resources.”
Figure 4.6 Seattle Multimodal Hubs (shown by purple dots)
As part of the Sound Transit 2 Plan, a transit investment plan that voters denied in Proposition 1 (the Roads & Transit Measure), Sound Transit identified a number of projects and investment priorities linking the multi-modal hubs identified in the Seattle Transit Plan.127 Responding to projected 40% regional growth by 2040, the Sound Transit 2 Plan identified a variety of light rail, commuter rail, streetcar, station development, bus rapid transit, and planning studies to propel the development of multi-modal hubs and improve the overall capacity of the region’s transit system.128 While voters rejected the Plan in 2007, a number of projects, particularly those connecting to andlinking multi-modal hubs, are relevant when considering transit investments in Cascadia’s future. Only projects linking directly to multi-modal hubs identified in the Seattle Transit Plan are recommended below:
! Linking Light Rail North from University of Washington to Northgate - A 4.3-mile extension linking The University of Washington to Northgate,
ECOLOPOLIS 3.0 53 11/17/2008

this project would expand the regional light rail system at a cost of $1.24 billion (2006 dollars). This link was identified as a top priority by the Sound Transit Board in their 1996 Sound Move Plan and has the highest projected ridership of any project in the Sound Transit 2 Plan.
! Linking Light Rail East from Seattle to Downtown Bellevue - An 11.4-mile link that would provide HCT from Seattle to downtown Bellevue, the two densest employment centers in the region.
! Streetcar: International District to Capitol Hill via First Hill - Provide transit from downtown Seattle to Capitol Hill and catalyze corridor development. The extension to John Street would link to North Capitol Hill, with available connections via the University Link Station at John Street.
! Sounder North: Parking Garage at Mukilteo Station - Provide park and ride infrastructure for Sounder Transit demand, in conjunction with multi-modal ferry projects.
! High Capacity Transit West - Connect Burien to Downtown Seattle via West Seattle, the U. District to Downtown Seattle via Ballard, and I-90 from South Bellevue to Issaquah.
Metro’s Primary Land-Use Target Areas include:
! Central Cities ! Regional and Town Centers
Metro, Oregon ! Passenger Inter-modal Facilities
Unlike the Seattle-Puget Sound region, the Portland Metro region has not applied the term “multi-modal hubs” to target areas in which intense passenger transportation and land uses will be concentrated. Rather, Metro, has identified “Freight and Passenger Inter-modal Facilities” connecting to the Central City, Regional Centers, Town Centers, and other passenger inter-modal facilities via high capacity transit. To the extent that multi-modal hubs are located within a particular combination of land use and transportation, the Portland-Metro region has succeeded in establishing Regional 2040 Target Areas characterized by compact urban forms supportive of transportation options, as articulated in Metro’s 2035 Regional Transportation Plan Update.129 While Metro includes “Passenger Facilities” in their inter-modal designations, Union Station is the only passenger-intensive inter-modal hub identified on the 2040 Growth Concept Map (Portland International Airport retains a distinct “International Airport” status).
Consistent with the previous goal, Metro’s Regional Transportation Plan, and the 2040 Growth Concept, TriMet – in their 2008 Transit Investment Plan (TIP) – has identified projects of regional significance that are to be targeted for investment when developing multi-modal hubs. Recognizing an expected one million new residents over the next 25 years, TriMet’s TIP emphasizes a “Total Transit System” providing a high-capacity transit network that connects Regional and Town Centers along regional routes and arterials. In addition to projects that are currently underway, including the Washington County Commuter Rail, South Corridor/I-205/Portland Mall, etc., the following TriMet projects are recommended as contributing to the creation of regional multi-modal hubs: ! Willamette River Crossing - facilitate pedestrian, bicycle, streetcar, and/or bus connections
between the Portland Central City and Milwaukie Town Center. ! Columbia River Crossing: facilitate pedestrian/bicycle, as well as Bus Rapid Transit and
express bus, and/or Light Rail and express bus connections between 1) the confluence of I-205 and I-5 (Regional Center) and 2) southerly destinations including MAX Yellow Line
ECOLOPOLIS 3.0 54 11/17/2008

Expo Station, Hayden Island, Downtown Vancouver, Clark County, Union Station, and the Portland Central City.
! Lake Oswego to Portland rail along Highway 43 - facilitate connections to Johns Landing, South Waterfront District, North Macadam District, and PSU using streetcar and/or Bus Rapid Transit.
! Bus Rapid Transit between Milwaukie (Town Center) and Oregon City (Regional Center) ! Bus Rapid Transit connecting Powell Blvd and Foster Rd with Damascus and Pleasant
Valley (Town Centers) ! High Capacity Transit connecting 2040 Town Centers - connect Sherwood, King City,
Tigard, and Burlingame via Bus Rapid Transit and/or Light Rail along Barbur Boulevard/Highway 99W.
In addition to projects recognizing TriMet’s status as the dominant transit operator and authority, the City of Portland is also pursuing development of potential Streetcar Corridors and is in the process of developing a Streetcar System Plan.130 While the City recognizes that different types of streetcar (loop, express, etc.) lend themselves to varied and flexible service, Streetcar investments, as they contribute to the development of multi-modal hubs, might best be targeted within Regional and Town Centers for the purpose of catalyzing high-density development supportive of High Capacity Transit linking Regional, Town, and Central City Centers.
Reducing Congestion
Congestion is a serious problem in Cascadia; resulting in slower traffic speeds, longer commutes and substantial delays for private and commercial travel. These impacts of congestion are felt most intensely along the freeways and major roadways in the vicinity of Seattle, Portland and Vancouver. According to the most current estimates from the Texas Transportation Institute (TTI), congestion costs the Portland urban area an estimated $625 million dollars per year in delays and excess fuel use.131 The Puget Sound area is also severely congested, costing the urban area of Seattle-Tacoma over $1.4 billion dollars annually.
Transportation Demand Management (TDM) techniques:
! ramp metering ! transit traffic signal priority ! Green Light’s weigh-in-motion program ! regional signal timing coordination ! carpool and vanpool programs ! telecommuting ! congestion pricing ! High Occupant Vehicle (HOV) lanes ! High Occupant Toll (HOT) lanes
Several strategies are being used to combat congestion in Cascadia. The Portland Metro region uses Transportation Demand Management (TDM) techniques including the Oregon Department of Transportation’s (ODOT’s) advanced incident response, ramp metering, transit traffic signal priority, Green Light’s weigh-in-motion program, regional signal timing coordination, and the Metro VanPool program. Congestion mitigation in Oregon may soon take the form of congestion pricing. Oregon Governor Ted Kulongoski recently announced that congestion pricing is part of a transportation planning package he will introduce during the 2009 legislative session, citing the Columbia River Crossing as a likely candidate.132
Seattle is already implementing congestion pricing to address its congestion problems. Through the US Department of Transportation’s (USDOT’s) Urban Partnership Agreement
ECOLOPOLIS 3.0 55 11/17/2008

program, Seattle plans to implement electronic tolling on SR-520, a severely congested east-west corridor that connects I-5 with I-405. Variable tolls will be responsive to demand, using transponders and license plate photos to collect tolls; revenue from these tolls will finance the replacement of SR-520’s floating bridge over Lake Washington. Other TDM techniques will also be implemented, including incident detection and removal, variable messaging, and variable speed limit signs to ease traffic flow during peak hours. Additional bus service, ferry service, and park and ride lots are also expected to improve congested conditions throughout the corridor.
Federal policy currently views congestion as a problem more appropriately addressed at the local level, where congestion is the most concentrated. Accordingly, SAFETEA-LU currently apportions funding to address congestion to states and Metropolitan Planning Organizations (MPOs) through the Congestion Mitigation and Air Quality (CMAQ) Improvement Program.
The United State Department of Transportation (USDOT) also has established the Urban Partnership Program to distribute up to $1.2 billion dollars of federal discretionary funds for congestion mitigation pilot projects in five urban areas. Seattle was selected as one of the Urban Partners; its congestion program is discussed in detail.
Elsewhere in Seattle, additional congestion mitigation strategies have already been employed. Over 300 miles of high occupant vehicle (HOV) lanes are in use in the central Puget Sound region, and tolling is used on the Tacoma Narrows Bridge and SR-167 (a High Occupant Toll lane variable tolling pilot project). Other congestion tools include 55 incident response vehicles, seven traffic management centers, 169 variable message boards, ramp metering, 294 park-and ride lots providing over 35,000 spaces, 1,928 vanpools, and 1,100 worksites participating in a telecommuting program.133
Information on congestion mitigation strategies in the Vancouver region is limited. In 2003 the Gateway Program was established to address the impact of growing congestion in Vancouver. The program coordinates road and bridge projects with current transit or planned transit improvements by TransLink. The Gateway Program also has plans to implement a bus rapid transit line on the Port Mann Bridge, opening in 2013, and on Highway 1 after its upcoming expansion. Highway 1 will also feature a new HOV lane, which is already an existing strategy in the Vancouver area.
As evidenced above, major urban areas in Cascadia have already adopted a variety of complementary congestion mitigation strategies. However, congestion will worsen in the future as population, VMT, and economic integration of Cascadia continues to grow. As major hubs of freight and human transport, Portland, Seattle, and Vancouver stand to benefit significantly in terms of economic competitiveness from improvements in congestion.
With the reauthorization of SAFTEA-LU in 2009, increased funding is recommended to be given to all states and MPO’s to develop innovative solutions to congestion on a local level. Congestion pricing, tolls, public transportation, TDM, Intelligent Transportation Systems, and carpools/vanpools are all possible strategies that require additional attention and funding. Federal congestion programs, such as the Urban Partnerships, should also be expanded to provide assistance to more urban areas within Cascadia. In addition, federal discretionary funds for congestion reduction should be apportioned to the Portland region, in order to effectively address congestion before it becomes debilitating. Finally, although Vancouver lies outside of U.S. jurisdiction, congestion reduction programs along the border should be promoted and coordinated with Canadian governments to improve the economic vitality and
ECOLOPOLIS 3.0 56 11/17/2008

transportation flows throughout Cascadia.
Carpool and Vanpool Programs
Carpooling and vanpooling programs are increasingly popular as the price of fuel rises, and may be the most cost-effective way to make immediate progress toward many of Cascadia's goals related to transportation and congestion.
There are several public carpool and vanpool coordination programs in Oregon and Washington States. The “Drive Less - Save More” website, sponsored by public and private entities, provides education and resources to help people in Oregon and southwestern Washington identify ways to reduce their single occupant vehicles (SOV) travel including links to local and regional car- and vanpool programs.134 For example, “Carpool Match NW,” a program sponsored by several local and regional governments, coordinates carpooling in Oregon and southwest Washington and claims to have over 9,000 participants registered.135 Metro also offers a vanpool coordination service, with 19 existing routes and 50% of the rental cost of the van subsidized.136
Washington maintains a publicly-supported carpool coordination program. The “Rideshare Online” website coordinates carpools and vanpools in Washington and Idaho that are supported by local transit agencies (Rideshare online, 2008). The Jack Bell Rideshare program, sponsored by TransLink, provides free carpool and vanpool coordination in the Greater Vancouver area. The program handles logistics and owns a number of vehicles which it provides to vanpoolers for a fee (Jack Bell Ride-Share, 2008).
Broadband and Wireless Infrastructure
As more information is transmitted electronically, businesses need to have reliable and inexpensive internet access to remain competitive and efficient. Residents and tourists also benefit from this infrastructure, opening entire cities to the same sources of information. Additionally, creating flexible work hours and improving telecommute options through wireless communication can help decrease congestion as Cascadia grows. Investing in this infrastructure would improve the competency of the region as an educated, forward thinking region in the US.
Figure 4.7 Pacific Northwest Rail Corridor
Cascadia as a whole would benefit from investing in internet and broadband infrastructure. Not only would this distinguish the region as a whole, it would allow great flexibility for both creative and traditional workforces.
High Speed Rail
Improving passenger rail service and investing in high speed rail (HSR) would create many benefits for Cascadia. According to the National Surface Transportation Policy and Revenue Study Commission’s Passenger Rail Working Group, improving intercity passenger rail creates benefits in
ECOLOPOLIS 3.0 57 11/17/2008
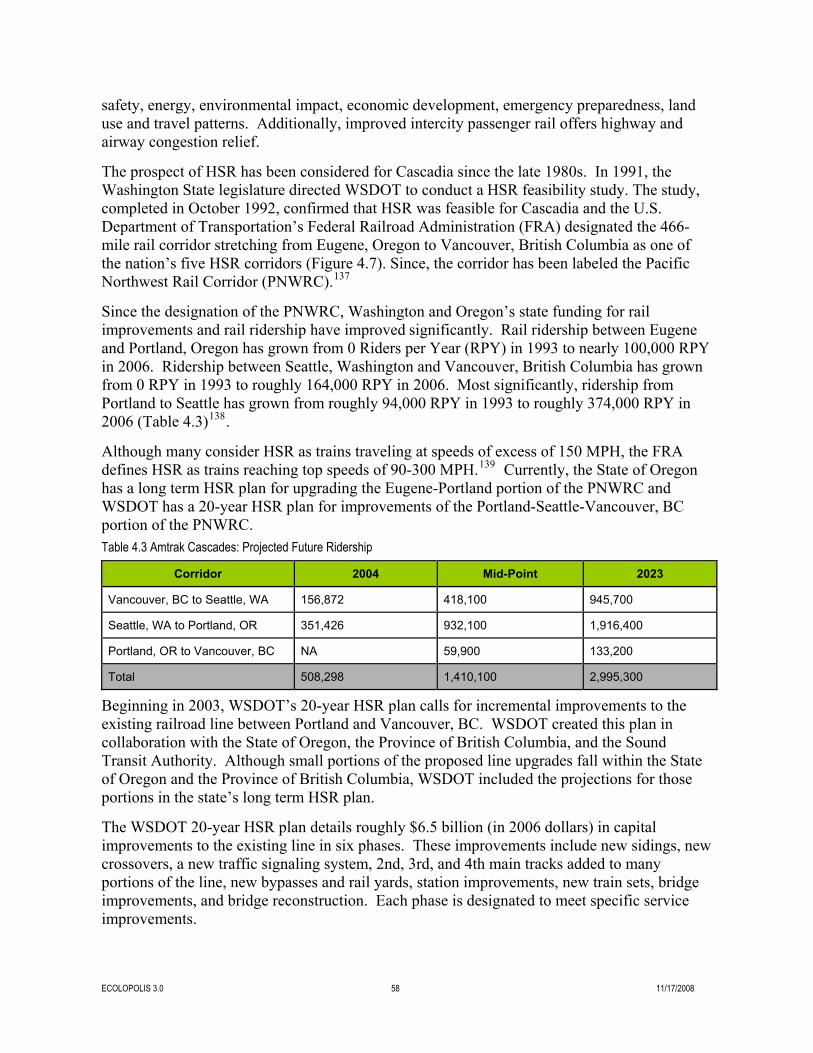
safety, energy, environmental impact, economic development, emergency preparedness, land use and travel patterns. Additionally, improved intercity passenger rail offers highway and airway congestion relief.
The prospect of HSR has been considered for Cascadia since the late 1980s. In 1991, the Washington State legislature directed WSDOT to conduct a HSR feasibility study. The study, completed in October 1992, confirmed that HSR was feasible for Cascadia and the U.S. Department of Transportation’s Federal Railroad Administration (FRA) designated the 466-mile rail corridor stretching from Eugene, Oregon to Vancouver, British Columbia as one of the nation’s five HSR corridors (Figure 4.7). Since, the corridor has been labeled the Pacific Northwest Rail Corridor (PNWRC).137
Since the designation of the PNWRC, Washington and Oregon’s state funding for rail improvements and rail ridership have improved significantly. Rail ridership between Eugene and Portland, Oregon has grown from 0 Riders per Year (RPY) in 1993 to nearly 100,000 RPY in 2006. Ridership between Seattle, Washington and Vancouver, British Columbia has grown from 0 RPY in 1993 to roughly 164,000 RPY in 2006. Most significantly, ridership from Portland to Seattle has grown from roughly 94,000 RPY in 1993 to roughly 374,000 RPY in 2006 (Table 4.3)138.
Although many consider HSR as trains traveling at speeds of excess of 150 MPH, the FRA defines HSR as trains reaching top speeds of 90-300 MPH.139 Currently, the State of Oregon has a long term HSR plan for upgrading the Eugene-Portland portion of the PNWRC and WSDOT has a 20-year HSR plan for improvements of the Portland-Seattle-Vancouver, BC portion of the PNWRC. Table 4.3 Amtrak Cascades: Projected Future Ridership
Corridor 2004 Mid-Point 2023
Vancouver, BC to Seattle, WA 156,872 418,100 945,700
Seattle, WA to Portland, OR 351,426 932,100 1,916,400
Portland, OR to Vancouver, BC NA 59,900 133,200
Total 508,298 1,410,100 2,995,300
Beginning in 2003, WSDOT’s 20-year HSR plan calls for incremental improvements to the existing railroad line between Portland and Vancouver, BC. WSDOT created this plan in collaboration with the State of Oregon, the Province of British Columbia, and the Sound Transit Authority. Although small portions of the proposed line upgrades fall within the State of Oregon and the Province of British Columbia, WSDOT included the projections for those portions in the state’s long term HSR plan.
The WSDOT 20-year HSR plan details roughly $6.5 billion (in 2006 dollars) in capital improvements to the existing line in six phases. These improvements include new sidings, new crossovers, a new traffic signaling system, 2nd, 3rd, and 4th main tracks added to many portions of the line, new bypasses and rail yards, station improvements, new train sets, bridge improvements, and bridge reconstruction. Each phase is designated to meet specific service improvements.
ECOLOPOLIS 3.0 58 11/17/2008

The plan seeks to improve transit time between Portland, Seattle, and Vancouver, BC (Table 4.4). By improving transit time, the plan also proposes to increase the number of daily trips between Portland and Seattle from three to 13 and to increase trips between Seattle and Vancouver, BC from two to four at completion. Overall ridership is estimated to increase from 538,000 RPY in 2006 to nearly 3,000,000 RPY at completion (Table 4.3). Table 4.4 Amtrak Cascades Travel Times (Amtrak Cascades Operating and Infrastructure Plan, 2004)
Corridor 1994 2003 2023
Vancouver, BC to Seattle, WA n/a 3:55 2:37
Seattle, WA to Portland, OR 3:55 3:30 2:30
Portland, OR to Vancouver, BC n/a n/a 5:22
The increased ridership, even if passenger fares remain the same, is projected to result in a 99% farebox recovery. This is a substantial improvement, as in 2002 farebox recovery was at only 45%, requiring an $11,1 million net operating subsidy (Table 4.5), and coincides with federal and state efforts to eliminate railroad operating subsidies. Table 4.5 Operating Revenue, Costs, and Subsidy (in millions of dollars)
2002 Mid-Point 2023
Annual Operating Revenue $9.2 $36.5 $82.3
Annual Operating Costs $20.3 $51.5 $83.4
Net Operating Revenues (Subsidies)
- $11.1 - $15.1 - $1.1
Farebox Recovery 45% 71% 99%
The state of Oregon’s 2001 Rail Plan estimates the improvements needed for HSR between Eugene and Portland. The 20-year plan, with projections beginning in 1998, proposes $375 million in improvements, resulting in a transit time reduction from 2:35 hours to 1:45 at completion. Roundtrips would increase to eight per day and ridership is projected at roughly 750,000 RPY. The increase in ridership would yield 100% farebox recovery and a net operating gain.
Like highway and air travel capital improvements, railways require heavy federal investment to extract the multitude of benefits HSR and improved intercity passenger rail travel has to offer.
Airports
Regional airports play a significant role in moving people between the regions of Cascadia, as well as to other national and international destinations. It should be a goal of Cascadia to provide links between airports, HSR, transit, and other transportation modes.
Vancouver International Airport (YVR) connects the Metro Vancouver region with destinations of regional, national, and international significance. Serving a record 17.5 million passengers in 2007, YVR is a major hub of passenger and freight activity within the region, and increasing demand for access and use necessitate considerations of connections with existing and future growth and transportation hubs.140 YVR’s primary focus is in developing the proposed Canada Line connecting Richmond Center and Downtown Vancouver via 16 new
ECOLOPOLIS 3.0 59 11/17/2008

station connections, with an approximate 25-minute travel time. Importantly, the Canada Line calls for improvements to station line areas, including housing and commercial development, as well as improved pedestrian access.
Both Oregon and Washington’s rail capital improvement plans recognize the sometimes adverse relationship between passenger and freight rail. Currently the freight rail lines, which passenger services share with freight carriers, are nearing full capacity. While both states’ plans have tailored future capital improvements for increased freight capacity in addition to increased passenger service, future federal investment in capital improvements is necessary to insure freight rail system capacity keeps pace with the growth in the regions freight movement needs.
In determining how the Puget Sound Region (PSRC) should address regional airport access for passengers in a manner consistent with the region’s Metropolitan Transportation Plan, the PSRC drafted the Regional Airport Ground Access Plan.141 To limit the scope of analysis, this recommendation focuses on Sea-Tac Airport, the largest of 26 regional airports.
Sea-Tac International Airport had 347,046 flights in 2007 serving 31,296,628 passengers (Table 4.6). This represented a 4.3% passenger increase over 2006 levels and makes Sea-Tac the 18th busiest passenger airport in the U.S. 39% percent of all passenger trips leaving Sea-Tac in 2007 began in Seattle, with Portland, OR ranking as the 3rd most traveled to domestic destination (9% - 13,589 – of all domestic passenger trips) and Vancouver, BC & Victoria, BC ranking 1st and 2nd among international destinations (32.5% - 5,180 - and 14.1% - 2,243 - of all, respectively) based on number of flight departures. Table 4.6 Trips Originating from the Sea-Tac Airport
Destination Flight Departures Passengers Ranking
Vancouver, BC 32.5% 5180 1st international destination from Seattle
Portland 9% 13589 3rd domestic destination from Seattle
Sea-Tac’s five Interstate road access points are supplemented by an additional five transit routes as well as shuttle vans, buses, taxis, and passenger cars. Planned projects, as identified in the Regional Airport Ground Access Plan, call for expanded bicycle access and pedestrian amenities, development of HOV lanes along existing interstates, bus rapid transit, and light rail. Most projects have a 2010 deadline, with a small number expected to be completed by 2020 or 2030.
Portland International Airport served 12,395,938 passengers in 2003, of which 61% arrived by private vehicle, 6% by TriMet, and the remainder by rental car, taxi/limo, shuttles, and bicycle. Projected long-term capacity, as identified in Phase 1 of the Decentralized Alternative Master Plan, is 23 million annual passengers.142 To meet projected demand, the Port of Portland is working to expand parking, as well as provide transit, bicycle, and pedestrian access improvements. High capacity transit access is currently limited to TriMet’s Red Line MAX, which delivers passengers along an east-west alignment. The future Green Line, with connections to the Red Line at Gateway Transit Center, should increase demand and be met with incremental improvements, as necessary.
The Port has recently completed construction of a new multi-use path connecting the Marine Drive Multi-Use Path to pedestrian/bicycle improvements along Frontage Road, and has
ECOLOPOLIS 3.0 60 11/17/2008

identified areas for future pedestrian and bicycle multi-use path access, parallel to the existing Light Rail alignment. Potential also exists for future bicycle and pedestrian access through the Cully neighborhood, southwest of the airport. Because of its direct alignment for human-powered modes, we recommend investing in bicycle and pedestrian access to the airport following Cully northeast to Columbia Blvd. and continuing north on Alderwood Rd. to NE 82nd Ave. This alignment currently lacks high-quality bicycle and pedestrian infrastructure, and would require improvements – particularly at the crossing intersection of Cully/Columbia/Alderwood – to become a truly viable route option.
Ports
There are four main ports that serve the region of Cascadia; Ports of Portland, Tacoma, Seattle, and Vancouver. The basic measure of traffic for a port is calculated in Twenty Foot Equivalent Units (TEUs). One TEU represents approximately one bulk-shipping container (Table 4.7). Table 4.7 Cascadian Port Volume Compared to Other West Coast and International Shipping Centers
Ports Port volume in TEU
Vancouver 2.3 million TEUs
Seattle 2.2 million TEUs
Tacoma 2.3 million TEUs
Portland 168,000 TEUs
Los Angeles 4.7 million TEUs
Long Beach 5.2 million TEUs
Singapore 21.3 million TEUs
Hong Kong 21.9 million TEUs
Intermodal Association of North America
In fact, while the ports of Cascadia do not have the capacity of Hong Kong or Singapore, their combined volume would place them 8th in the world.143 Vancouver is the regional leader in terms of overall growth, but each port is growing at a relatively rapid pace. From a regional perspective, it is important to look at the feasibility of cooperation between the ports in the interests of improving international competitiveness.
Cooperation and Competition
The key issue limiting cooperation between ports is that they provide the same basic services and are looking to increase revenue by competing with each other for business share. However, small steps have been made toward regional cooperation. Recently the Vancouver Port Authority merged with the Fraser River and North Fraser Port Authorities to form a collective for the area.144 There have been two failed legislative attempts to merge the ports of Seattle and Tacoma, which led to meetings between the two management groups and an agreement to begin working cooperatively on small issues.145
The ideal regional concept would involve a unified system of ports. Each port would have a specific focus in relation to the market, thereby improving efficiency. This focus would reduce overall operating costs, as money would not have to be spent catering to underutilized
ECOLOPOLIS 3.0 61 11/17/2008

secondary sources of traffic. The ports would ship goods both inter and intra-regionally and cooperative decisions would be made at a regional level.
To create regional port cooperation, a regional port authority needs to be established. This management group would facilitate conversation between the various port authorities. Initial steps would involve voluntary emissions agreements and the funding of port cooperation studies.
Taxing Efficiency
There are some regional differences in the taxation structures that would need to be addressed for a unified Cascadian port system. US ports charge a harbor maintenance fee to shipping lines, which has led to rapid growth of the Port of Vancouver/Fraser as an alternative destination.146 In addition to its negative effect on business traffic, a General Accounting Office study found that the majority of the money collected by the harbor maintenance tax has not been used for the maintenance projects for which it was intended.147
The means for replacing some of the revenue lost in this tax cut can be created through an efficiency tax on shipping lines that will be a feature of the region and a model for other port systems. Fuel costs are rising rapidly and climate change is an obvious global concern, so taxing shipping lines based on their emissions and use of sustainable technology fulfills the goals for the Cascadian region. The use of biodiesel and ultra low-sulfur fuels are two means of achieving this. An even more innovative technology has recently gone into its pilot phase; Skysails is a Danish company that originally started making parasails to increase fuel efficiency on luxury yachts, and has begun using the same technology for container ships. So far, studies have shown a fuel efficiency increase of 30% to 50% through the use of this technology.148
It is doubtful that the revenue gained from the efficiency tax can completely replace the harbor maintenance tax receipts. This underscores the need for greater overall investment in the infrastructure of the regional port system. Due to fuel costs, air shipping may soon become prohibitively expensive and in an increasingly globalized world, the ports will only continue to grow. Logistics and International Trade (LIT) is a rapidly expanding job sector for the region, helping to replace lost blue-collar manufacturing employment.149 Focused investment in the regional port system can contribute to both international competitiveness and the growth of local jobs.
Short Sea Shipping
Short sea shipping is a concept pioneered by a number of European cities that substitutes water transport for the traditional surface modes of truck and rail. Goods are moved on inland and coastal waterways by tugs and barges to a series of nodes and other ports. Short sea shipping has the potential to reduce emissions, congestion and other issues associated with traditional methods of overland transport.150 Studies have shown that this method is approximately six times more fuel efficient than trucking and at least twice as efficient as rail.151 In the region of Cascadia, this would be a two-part system. Goods would be moved on coastal waterways among the four main ports. This is known as a coastal feeder system. The second part of the plan involves movement of goods on the Columbia/Snake River system in Oregon, Washington and Idaho and the Fraser River system in Vancouver.
ECOLOPOLIS 3.0 62 11/17/2008

! Columbia/Snake System Currently, short sea shipping on the Columbia/Snake system has been limited to low value cargo that is non-time sensitive. The Columbia is the number one wheat export gateway in the US.152 It is estimated that this traffic alone keeps approximately 700,000 trucks off the highways annually, primarily I-84.153 The limiting factors to an expansion of short sea shipping on the Columbia have been the competitive rates from trucking companies, the lack of nodal infrastructure along the river, and issues with delivery times. However, concerns about emissions and rising fuel prices are starting to negate some of these issues. The future plan would be to have a system of nodes along the Columbia that can quickly and efficiently deal with the next step in cargo movement. Increasing the already established short sea infrastructure is a logical next step for expanding the capacity and infrastructure in anticipation of growing demand.
! Fraser River System There is no current short sea shipping occurring on the Fraser River, but the GVRD has been studying the possibility. Currently 65% of the containers leaving or arriving at the port terminals are transported via rail and the other 35% are transported by truck.154 It would be possible to begin phasing out much of the truck transport and replacing it with a reliable short sea system.155 The key is to begin finding prospective sites upriver that can reliably support short sea terminals and investing enough in the infrastructure to make it attractive to businesses. Traffic at the Port of Vancouver is expected to triple within the next 20 years, making the rapid implementation of this system a necessity.156
Coastal Feeder System
In conjunction with the inland systems, goods can then be moved along the coast through the region as well. Approximately 500,000 TEUs in the Columbia/Snake area are moved overland to the ports of Seattle and Tacoma annually.157 This is due to shipping line requirements and the lack of capacity at the Port of Portland. This shows that there is already enough demand to begin further investigating a shift from an overburdened highway system to a coastal feeder system.
Issues remain with service from Portland to Seattle due to the fact that ships are forced to travel west over the Columbia River Bar before heading north. This increases the length of the trip and negates some of the fuel efficiency gains. A feeder service from Seattle/Tacoma to BC and possibly Alaska would involve fewer logistical issues. Ideally, as the ports begin to work together, the efficiency of this system can be improved upon and a regional coastal feeder system can be established. The viability of a coastal short sea feeder system should be investigated further. Demand for alternative modes of freight movement will grow with the regional economy, making the establishment of a pilot feeder program an important first step.
An agreement on a regional efficiency tax, innovative green shipping technologies and the development of both inland and coastal short sea shipping can make Cascadia a worldwide model for sustainability. It is also a means to alleviate some of the pressure from overburdened truck and freight rail services. These recommendations for the future of freight movement in
ECOLOPOLIS 3.0 63 11/17/2008

Cascadia will increase efficiency and promote cooperation among the various port authorities.
Truck Freight Movement
Despite a large percent of goods that are moved into the regional ports, the vast majority of those goods still travel by truck and train routes to local distribution sites. In order to ensure that businesses can rely on the fastest and most predictable transfer of goods, it is essential to keep the flow of goods into, out of, and within Cascadia moving smoothly and efficiently. We recommend the funding of pilot projects and increased infrastructure for intelligent freight systems, including electronic manifests, electronic logs, weigh-in-motion systems, electronic container seals, carrier scheduling, and more to assist in achieving this efficiency.
There is significant interest in this issue at the federal level. The Federal Motor Carrier Safety Administration's Commercial Vehicle Information Systems and Networks (CVISN) is working toward streamlining and connecting the many elements of intelligent transportation systems around the country, includes a number of elements related to freight.158
Weigh-in-motion Systems
Figure 4.8 Pacific Northwest Weigh-in-motion Systems
While there are a number of ways that ITS could facilitate the secure and efficient movement of freight across Cascadia, the most feasible, politically palatable, and well-developed program is weigh-in-motion systems.159 Weigh-in-motion systems use transponders to allow trucks to pass through weigh stations without stopping while a reader at the weigh station registers and records information from the transponder and a plate in the roadways collects the weight of the truck (Figure 4.8).
WSDOT is already using in-vehicle transponders, for which they charge $30, for both electronic credentialing and weigh-in-motion programs for carriers on a voluntary, word-of-mouth basis. In 2007, trucks were pre-cleared 896,000 times in Washington weigh stations. WSDOT estimates that these pre-clearances saved the carriers approximately 79,000 hours of travel time and $5 million.160
ODOT also already uses transponders, and uses the weigh-in-motion system at 22 stations, including five on the I-5 corridor. ODOT expects to have 2.4 million pre-clearances in 2008, saving an estimated $23.5 million and almost 200,000 hours of travel time.161 Oregon offers transponders for free to carriers that stop regularly in Oregon.
ECOLOPOLIS 3.0 64 11/17/2008

The Province of British Columbia accepts all transponders at its two weigh-in-motion stations (including one near the Washington border), but has not developed as far as Oregon and Washington. While it would not be appropriate to spend federal money to enhance Canadian infrastructure, we recommend increased efforts to communicate and coordinate all intelligent transportation system development. This is particularly an issue at the US-Canada border, where congestion is increasingly hampering traffic flows.
Other Intelligent Freight Transportation Applications
The Northwest International Trade Corridor and Border Crossing program has worked on a number of efforts to make freight transportation across the region and borders more efficient and predictable. Programs have included electronic credentialing of trucks, cargos, and drivers, electronic data interchange, and electronic pre-clearances.162 A recent pilot project funded by the US Department of Transportation, installed electronic in-bond seals on cargo, facilitating the border crossings for high-value cargo.163 Results are positive thus far, indicating that the expansion of intelligent transportation systems in truck freight can be implemented
to reduce border congestion and increase security.
28 other states: PrePass
NORPASS !" Green Light PrePass !/" NORPASS and Green Light (PrePass transponders can NOT be used with NORPASS or Green Light stations)
US Weigh Station Pre-Clearance Transponders
Washington: NORPASS
Oregon: Green Light
The truck transponders in use for the pre-clearance systems can also be used for border pre-clearance and for reading electronic seals. The existing Free and Secure Trade (FAST) border program allows drivers, carriers (trucks), and importer (cargo) to be pre-cleared for expedited border crossing if they meet criteria for records of safety and compliance. This program is under-enrolled, due to lack of capacity for outreach.164 We recommend funding increases to coordinate and expand intelligent pre-clearance systems for drivers, carriers, and importers, using existing coordination and pilot efforts as a starting point.
A major issue with the transponders is the lack of interoperability. The three transponder systems used in the United States for weigh station pre-clearance are PrePass, NORPASS, and Green Light. Washington State uses NORPASS, and Oregon uses Green Light. NORPASS and Green Light transponders can be used in NORPASS and Green Light systems, though the carriers must enroll for each system individually. They can also use the same transponder in PrePass systems for an additional fee. PrePass transponders cannot be used in the NORPASS or Green Light systems.
For example, a carrier who gets a free Green Light transponder in Oregon must enroll (for free) in the NORPASS system in order to get pre-clearance in Washington, and must enroll in the PrePass system and pay a fee to get pre-clearance in the 28 states that use that system. ODOT warns that drivers in trucks carrying both a PrePass transponder and a Green Light transponder will find that neither works, as the signals interfere. It would be extremely helpful to Cascadia, and to the country, to have complete interoperability between the pre-clearance systems. While a single system may not be desirable, due to the lack of incentive for development of the
ECOLOPOLIS 3.0 65 11/17/2008

technology, interoperability is essential, and we urge investment in exploring the possibility.
The weigh-in-motion and border pre-clearance systems are highly successful, with proven savings in money and time. Transponder technology can and should be used in the future for vehicle tracking, safety monitoring, and other IT applications. We recommend investment in the building of more weigh-in-motion and border pre-clearance infrastructure, including sensors and internet-based tracking systems, as well as expanded education and outreach to carriers, importers, and drivers. This investment must be supported by funding for greater regional coordination and planning to increase the efficiency of truck freight movement across Cascadia.
Roads
The transportation backbone of Cascadia is Interstate 5 (I-5), though the highway itself does not fully define the corridor. The I-5 corridor, which is served by both rail and automobile facilities, contains 69% of the Washington population and 71% of the Oregon population, and is expected to absorb most of the anticipated growth in the coming decades. Within Cascadia, I-5 is the connecting interstate for nine major ports, two major airports, and a major military base in Washington.165 In Oregon, it connects deep-water ports, up-river barging, and two transcontinental rail lines. It is also the primary freight and passenger connection to Vancouver, B.C. to the north and to California and Mexico to the south.
Washington has 83,256 of public roadway and Oregon has 87,096 miles.166 Of particular relevance to Cascadia, there are 1,350 lane miles of I-5 in Oregon, and 1,578 in Washington, which continues for approximately 40 centerline miles as Highway 99 to Vancouver.167 The I-5 corridor is certainly the most significant in Cascadia, and is in need of attention. Variousreports have identified the need for increased maintenance, summarized in the Table 4.8 by The American Society of Civil Engineers.
168 Table 4.8 Cascadia Roadway and Bridge Inventory
Washington Oregon
Major Roads in Poor or Mediocre Condition 28% 38%
Bridges that are structurally deficient or functionally obsolete 26% 38%
Auto-oriented infrastructure investment should be fully integrated with multi-modal infrastructure funding. However, in contrast with the historic outright dominance of the car, new investments should discourage SOV use while maintaining safe, quality roads. It is also important to recognize the importance of maintaining highways for freight movement. As described below, maintenance and upgrades should be fully funded concurrent with other transportation system improvements.
High-speed rail may be the new big-ticket, sustainable investment, but the road network must not be neglected. In many ways, these systems complement each other by adding capacity that can flexibly relieve congestion for both freight and passenger service. Creating multi-modal corridor systems will contribute to a robust and efficient transportation network. Efforts to increase vehicle efficiency must be consistent with sustainability goals listed in the previous section. Roadway improvements must emphasize cleaner, multi-modal forms of transportation and focus land use in compact areas. Washington State’s Improvement Prioritization System
ECOLOPOLIS 3.0 66 11/17/2008

serves as a good starting point.169 The three-tiered system prioritizes projects as follows: ! Tier 1: Intelligent Transportation System (ITS) improvements and increasing efficiency of
systems operations are inexpensive and quick to construct, with minimal environmental impacts.
! Tier 2: Addressing chokepoints and bottlenecks by augmenting access ramps or improving arterials. These projects are of moderate cost and construction time, with some environmental impact.
! Tier 3: Once the above options have been exhausted, capacity expansion projects may be necessary. These projects are costly, require lengthy construction periods, and inflict significant environmental impacts.
Potential elaborations on this prioritization system would include the regulation and reduction of GHG emission controls and VMT. GHG emissions should be taken into account, inventoried, and where possible, automobile surface transportation should be integrated with multi-modal hubs to decrease these emissions. There are existing policies throughout the region aimed at reducing VMT, therefore any capacity expansion that might induce or encourage travel by automobile should be avoided. Making the current roadway system high-quality and efficient, within the current capacity, is therefore the preferred way to invest infrastructure dollars.
Within the I-5 corridor, fully funded roadway improvements are recommended to be implemented concurrent with passenger and freight rail upgrades. Maintain world-class quality and safety of highways by prioritizing efficiency and bottleneck relief before adding capacity.
Bridges
In Cascadia, and throughout the country, bridges are critical to the flow of people and goods. The sections below outline the number and conditions of bridges in Cascadia.
British Columbia – Several bridges within British Columbia connect I-5 to the Vancouver area. While federal funding will not directly impact bridge conditions within the Vancouver region, these bridges remain of critical importance to Cascadia, as they provide essential links for the flow of people and goods within the megaregion. Table 4.9 Cascadia Bridge Inventory
Number of Bridges Structurally deficient
Washington 7717 415 (5%)
Oregon 7261 560 (8%)
Washington – Of Washington’s 7,717 bridges 5% are classified as structurally deficient in 2007 (Table 4.9).170 Washington’s bridges also benefit from over 75% of their structures being composed of concrete, which require less maintenance and repairs than steel bridges, which require frequent, expensive repainting.171 Washington State Department of Transportation (WSDOT) estimates $18 million dollars will be required between 2009-2011 for repainting and an additional $38 million to repaint the 58 high priority steel structures (of 317 total).172
Oregon – Of Oregon’s 7,261 bridges, 8% are classified as structurally deficient (Table 4.9).173
ECOLOPOLIS 3.0 67 11/17/2008

This is an improvement from 2004, when 33% were classified as deficient (ODOT, 2007). Conditions are expected to continue to improve through 2013 with funding from the State Bridge Program. However, by 2013, the State Bridge Program’s budget will be severely reduced in order to begin the payback period for OTIA III bonds. In addition, by 2011, budget shortfalls leading to deferred maintenance coupled with an additional 12 bridges expected to be newly classified as structurally deficient will keep overall bridge conditions relatively stable. Without a new, stable source of funding, bridge conditions are expected to deteriorate dramatically within the following decade, with an anticipated 30% of bridges classified as deficient by 2017.174
Given the likelihood of bridge maintenance funding becoming a major political issue in the near future and the critical role bridges play in the transportation flows within Cascadia, it is important that the condition of Cascadia’s bridges be further examined. Increased, dedicated funding for bridge maintenance, repairs, and safety inspection are necessary for Oregon and Washington. Bridging the gap between structural conditions of bridges and funding is undoubtedly critical to maintaining and improving upon the existing transportation flows within Cascadia.
In Summary
Based on the desire to create an infrastructure system that is efficient and completely integrated, we suggested the establishment of the following regional goals: ! Reduce dependence on the private automobile by providing greater mode choices ! Provide equitable transportation to a diverse population ! Reduce sprawl, land consumption, congestion, and air and noise pollution while preserving
greenspaces and the natural environment ! We must seize this opportunity to move forward with thoughtful infrastructure investment
with these recommended infrastructure improvements. ! Make the area attractive to workers by investing in higher education systems, the formation
of a megaregional housing policy institution, reducing VMT, and adding highway capacity as a last resort.
! Invest in multi-modal transportation, including transit, walking, biking, and auto. Have the three regions develop individual plans for bicycle and pedestrian mode in urban areas to compliment regional trail improvements. Increase wayfinding aids in central cities and the possible development of Cascadian pedestrian planning agencies. High capacity transportation infrastructure must be identified to serve multi-modal hubs.
! Use TDM methods for solving congestion first, then if necessary, invest in roadway improvements. Maintenance of the existing bridges and roadways, however, should be a high priority.
! Expansion of government coordination efforts in order to enhance the efficiency of the infrastructure system, reduce congestion, and reduce air pollution and climate change impacts. However, funding should be directed to expansion of individual regional efforts and then to the development of regional cooperation for congestion mitigation measures.
! A comprehensive feasibility study should be funded to determine if the development of a true high speed passenger rail line in Cascadia is a reasonable and responsible target for the future.
! Increasing alternative access modes to the airports in Cascadia to cope with expected
ECOLOPOLIS 3.0 68 11/17/2008

increases in passenger demand. Develop effective, regional port cooperation through a regional port authority that could facilitate conversations between various port authorities. It is also recommended that the maintenance tax be rescinded, as regional port cooperation cannot proceed with an unbalanced tax structure. The ports should also establish a pilot program with Skysails and one of the local shipping lines to increase the sustainability of Cascadia’s ports. Phasing out much of the truck transport and replacing it with a reliable short sea system, beginning with a study to find prospective terminal sites will help move freight off congested roadways.
! Funding of pilot projects and increasing infrastructure for intelligent freight systems to assist in achieving freight efficiency within Cascadia. Coordination and expansion of intelligent pre-clearance systems for truck freight will increase efficiency; as will the building of more weigh-in-motion and border pre-clearance infrastructure. It is recommended that passenger and freight rail upgrades take place concurrently to maintain world-class quality and safety of highways by prioritizing efficiency and bottleneck relief before adding capacity.
! It is important that the conditions of Cascadia’s bridges be further examined and that increased, dedicated funding for bridge maintenance, repairs, and safety inspection is secured.
ECOLOPOLIS 3.0 69 11/17/2008

V. Ecolopolis 3.0: Conclusions and Next Steps
In 1928, Benton MacKaye asked an insightful question with enduring relevance; “Can we make of this time and century something better than a chaos of industrial cross-purposes.”175 A planned effort will be necessary to address the many infrastructure challenges we face today.
Proposed legislation to create a Commission on Rebuilding America for the 21st Century 176 cites a number of concerns: ! The National Surface Transportation Policy and Revenue Study Commission calculates
that maintaining the Nation's existing transportation system over the next 50 years will require $225 billion annually.
! The American Society of Civil Engineers has given the Nation's public infrastructure, consisting of water, sewer, and transportation systems, a grade of D-minus, estimating that it will cost $1.6 trillion over the next 5 years for initial repairs.
! The Nation's wastewater infrastructure poses a serious threat to water quality with over 72,000 miles of municipal water and sewer pipe more than 80 years old; from 1999 to 2009 the Nation's electricity demand rose by nearly 20 percent while transmission capacity grew by only 3.5 percent; and significant under-investment in public lands infrastructure jeopardizes the tremendous conservation, environmental, and mixed use benefits that these lands provide the public.
! These challenges are magnified by projections that United States population is expected to expand 420 million by 2050, a nearly 50 percent increase.177
Societal problems have always been complicated and efforts to manage complex natural systems in the face of incomplete scientific knowledge are not new. Scientists, practitioners, and policy makers have wrestled with the implementation of adaptive management for years.178 Incomplete scientific understanding combined with conflicting values and an inability to clearly agree upon problems are the hallmark of “wicked problems.”179
One of the major tensions in developing an infrastructure investment plan is not just the location of projects or distribution of funds but the project type. Will the plan feature traditional infrastructure investments to reinforce roads, bridges, and pipes, or will the plan feature alternative investments in natural system capital that enhance ecosystem function and provide societal benefits by purifying air, water, and sequestering carbon? The answer is surely both, but the difficulty comparing the costs and benefits of both types has led to a historical undervaluation of the latter.
The result has been a loss of topsoil, wetlands, groundwater, forest health deterioration, species extinction and the like. A raft of environmental legislation in the 1970s made significant progress in halting environmentally destructive behavior. The siloed bureaucratic structures created by this legislation were efficient at addressing the major emissions from point sources such as smokestacks and factory wastewater pipes. These structures, however, have been insufficient to address complicated, interconnected, value-laden “wicked problems” that confront us today.180 It is the overlay of complex natural processes with complicated social systems that necessitates a new approach and
ECOLOPOLIS 3.0 70 11/17/2008
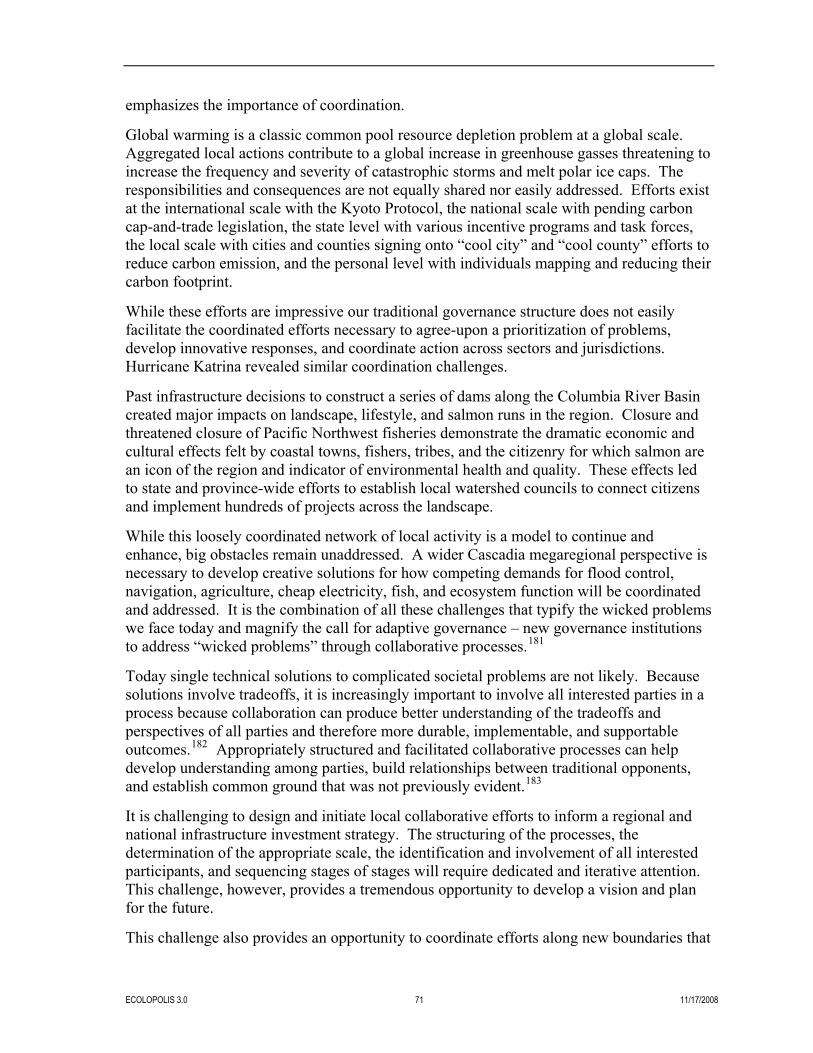
emphasizes the importance of coordination.
Global warming is a classic common pool resource depletion problem at a global scale. Aggregated local actions contribute to a global increase in greenhouse gasses threatening to increase the frequency and severity of catastrophic storms and melt polar ice caps. The responsibilities and consequences are not equally shared nor easily addressed. Efforts exist at the international scale with the Kyoto Protocol, the national scale with pending carbon cap-and-trade legislation, the state level with various incentive programs and task forces, the local scale with cities and counties signing onto “cool city” and “cool county” efforts to reduce carbon emission, and the personal level with individuals mapping and reducing their carbon footprint.
While these efforts are impressive our traditional governance structure does not easily facilitate the coordinated efforts necessary to agree-upon a prioritization of problems, develop innovative responses, and coordinate action across sectors and jurisdictions. Hurricane Katrina revealed similar coordination challenges.
Past infrastructure decisions to construct a series of dams along the Columbia River Basin created major impacts on landscape, lifestyle, and salmon runs in the region. Closure and threatened closure of Pacific Northwest fisheries demonstrate the dramatic economic and cultural effects felt by coastal towns, fishers, tribes, and the citizenry for which salmon are an icon of the region and indicator of environmental health and quality. These effects led to state and province-wide efforts to establish local watershed councils to connect citizens and implement hundreds of projects across the landscape.
While this loosely coordinated network of local activity is a model to continue and enhance, big obstacles remain unaddressed. A wider Cascadia megaregional perspective is necessary to develop creative solutions for how competing demands for flood control, navigation, agriculture, cheap electricity, fish, and ecosystem function will be coordinated and addressed. It is the combination of all these challenges that typify the wicked problems we face today and magnify the call for adaptive governance – new governance institutions to address “wicked problems” through collaborative processes.181
Today single technical solutions to complicated societal problems are not likely. Because solutions involve tradeoffs, it is increasingly important to involve all interested parties in a process because collaboration can produce better understanding of the tradeoffs and perspectives of all parties and therefore more durable, implementable, and supportable outcomes.182 Appropriately structured and facilitated collaborative processes can help develop understanding among parties, build relationships between traditional opponents, and establish common ground that was not previously evident.183
It is challenging to design and initiate local collaborative efforts to inform a regional and national infrastructure investment strategy. The structuring of the processes, the determination of the appropriate scale, the identification and involvement of all interested participants, and sequencing stages of stages will require dedicated and iterative attention. This challenge, however, provides a tremendous opportunity to develop a vision and plan for the future.
This challenge also provides an opportunity to coordinate efforts along new boundaries that
ECOLOPOLIS 3.0 71 11/17/2008

are appropriate for the issues being considered, frequently natural system boundaries. Currently there is no mega-regional structure that can coordinate planning efforts ranging from integrated water management, to Endangered Species Act (ESA) listing, to strategies for population growth and global climate change.184 Creation of a natural system infrastructure development plan provides an opportunity for business, industry, government and non-profit organizations to develop landscape-scale programs.
Plans related to water management could be based along common sense hydrologic units in the landmark manner John Wesley Powell recommended in 1879 with “A Report on the Lands of the Arid Region of the United States.” Local jurisdictions would still retain their authorities, but they would benefit from the ability to address many issues holistically and collaboratively with their neighbors. The creation of this new spatial coordinating unit along natural system boundaries is symbolically important to indicate a shift embodied by this “new vision” away from siloed regulatory control to flexible, holistic, collaborative planning.
ECOLOPOLIS 3.0 72 11/17/2008
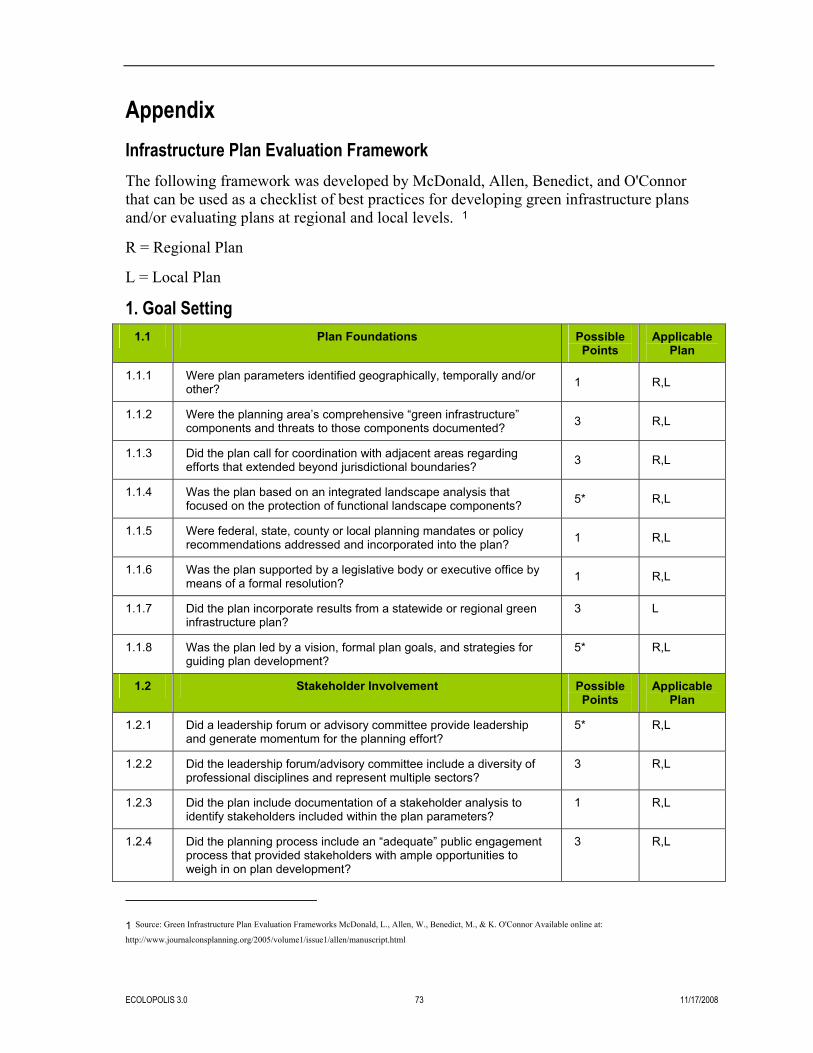
Appendix
Infrastructure Plan Evaluation Framework
The following framework was developed by McDonald, Allen, Benedict, and O'Connor that can be used as a checklist of best practices for developing green infrastructure plans and/or evaluating plans at regional and local levels. 1
R = Regional Plan
L = Local Plan
1. Goal Setting 1.1 Plan Foundations Possible
Points Applicable
Plan
1.1.1 Were plan parameters identified geographically, temporally and/or other? 1 R,L
1.1.2 Were the planning area’s comprehensive “green infrastructure” components and threats to those components documented? 3 R,L
1.1.3 Did the plan call for coordination with adjacent areas regarding efforts that extended beyond jurisdictional boundaries? 3 R,L
1.1.4 Was the plan based on an integrated landscape analysis that focused on the protection of functional landscape components? 5* R,L
1.1.5 Were federal, state, county or local planning mandates or policy recommendations addressed and incorporated into the plan? 1 R,L
1.1.6 Was the plan supported by a legislative body or executive office by means of a formal resolution? 1 R,L
1.1.7 Did the plan incorporate results from a statewide or regional green infrastructure plan?
3 L
1.1.8 Was the plan led by a vision, formal plan goals, and strategies for guiding plan development?
5* R,L
1.2 Stakeholder Involvement Possible Points
Applicable Plan
1.2.1 Did a leadership forum or advisory committee provide leadership and generate momentum for the planning effort?
5* R,L
1.2.2 Did the leadership forum/advisory committee include a diversity of professional disciplines and represent multiple sectors?
3 R,L
1.2.3 Did the plan include documentation of a stakeholder analysis to identify stakeholders included within the plan parameters?
1 R,L
1.2.4 Did the planning process include an “adequate” public engagement process that provided stakeholders with ample opportunities to weigh in on plan development?
3 R,L
1 Source: Green Infrastructure Plan Evaluation Frameworks McDonald, L., Allen, W., Benedict, M., & K. O'Connor Available online at:
http://www.journalconsplanning.org/2005/volume1/issue1/allen/manuscript.html
ECOLOPOLIS 3.0 73 11/17/2008

1.2.5 Were county and local governments engaged in plan development? 1 R,L
1.2.6 Were federal or state agencies engaged in plan development? 1 R,L
1.2.7 Were area non-governmental organizations, land trusts or other conservation organizations engaged in plan development?
1 R,L
1.3 Conservation Vision Possible Points
Applicable Plan
1.3.1 Was plan development led by goal(s) to protect ecological processes and functions?
5* R,L
1.3.2 Did the plan include goal(s) for working lands protection (i.e. farming, forestry, ranching)?
3 R,L
1.3.3 Did the plan include goal(s) for hazard mitigation? 3 R,L
1.3.4 Did the plan include goal(s) for watershed protection? 3 R,L
1.3.5 Did the plan include goal(s) for open space and its associated human benefits (i.e. passive recreation, aesthetic quality)?
3 R,L
1.3.6 Did the plan include goal(s) for the preservation of cultural and historic resources?
1 R,L
1.3.7 Did the plan include goal(s) for eco-tourism and other economic development activities that utilize conservation lands?
1 R,L
1.3.8 Did the plan include goal(s) for growth management? 1 R,L
1.3.9 Did the plan include other conservation-related goals? 1 R,L
*Denotes required criteria that plans must include.
2. Plan Analysis 2.1 Network Design Criteria Possible
Points Applicable
Plan
2.1.1 Did the plan include a comprehensive assessment of landscapes and landscape features within plan parameters? (e.g. biological, hydrological, geological, human-dominated)
3 R,L
2.1.2 Were spatially explicit data sets that contain attribute information for landscape features, gathered and compiled? 3 R,L
2.1.3 Did data sets include information for human-dominated landscape features (agriculture, development, etc.), as well as natural landscape features?
1 R,L
2.1.4 Were baseline maps prepared to identify individual green infrastructure components (i.e. forestlands, working lands, wildlife habitat, parklands, etc.)
1 R,L
2.1.5 Did network design criteria for hubs and corridors incorporate ecological thresholds and other conservation parameters? (ex. minimum dynamic areas, size of migration corridors, natural disturbance regimes, edge effects, important riparian zones, etc.)
5* R,L
2.1.6 Were corridors identified using least-cost path analysis or a similar methodology? 3 R,L
ECOLOPOLIS 3.0 74 11/17/2008

2.1.7 Were network design criteria documented? 1 R,L
2.1.8 Were ecologists and other natural areas specialists involved in producing the network design criteria and weighting systems? 3 R,L
2.1.9 Were network design criteria based on current biological and ecological theories and best practices? (i.e. hubs/corridors, contiguous lands, connectivity, etc.)
5* R,L
2.1.10 Do the network design criteria incorporate all of the plan’s goals? 3 R,L
2.2 Network Suitability Analysis Possible Points
Applicable Plan
2.2.1 Was a suitability analysis or similar land suitability method (that incorporated the network design criteria) utilized to calculate and classify the range of conservation values for the study area?
5* R,L
2.2.2 Were conservation values assessed for a range of spatial scales, including smaller parcel-level analysis? 1 R,L
2.2.3 Did the final network design (i.e. results from suitability analysis) result in an ecologically connected framework? 5* R,L
2.2.4 Did the network design incorporate a diversity of land uses (i.e. working lands, open space, parklands, habitat)? 5* R,L
2.2.5 Are specific hubs and corridors delineated in the plan? 3 R,L
2.2.6 If a regional plan was developed, were new target hubs and corridors revealed at the local-scale analysis? 1 L
2.2.7 Were gaps in the network (both in hubs and corridors) identified? 5* R,L
2.2.8 Did the plan include a clear and coherent graphic representation of the final network design? 5* R,L
2.2.9 Was the suitability analysis model (or similar model) replicable? 1 R,L
*Denotes required criteria that plans must include.
3. Plan Synthesis 3.1 Network Design Model Enhancements Possible
Points Applicable
Plan
3.1.1 Was feedback from a stakeholder assessment of the network design incorporated into the model? 1 R,L
3.1.2 Was an ecological “ground-truthing” assessment of the network design incorporated into the model? 3 R,L
3.1.3 Were risk and vulnerability factors (i.e. risk for development or fragmentation) for network segments assessed and incorporated into the model?
3 R,L
3.1.4 Was the protection status of green infrastructure network lands identified and incorporated into the model? 5* R,L
3.1.5 If it is not feasible to connect hubs using the corridors identified in the original network design, are alternative corridors identified? 3 L
3.2 Identifying Priorities Possible Applicable
ECOLOPOLIS 3.0 75 11/17/2008

Points Plan
3.2.1 Were the systems for prioritizing and ranking hubs and corridors based on the results of the suitability analysis, vulnerability factors and status of land protection?
5* R,L
3.2.2 Were hubs and corridors ranked within each different type of landscape? 1 R,L
3.2.3 Were hubs and corridors ranked at a coarse, regional scale? 1 R
3.2.4 Were hubs and corridors ranked at a finer, local scale? 1 R,L
3.2.5 Was a system for prioritizing restoration and enhancement opportunities developed? 3 R,L
3.2.6 Were specific priorities identified in this plan? 5* R,L
3.2.7 Were ranking systems combined to create a comprehensive system for ranking lands within the green infrastructure network? 3 R,L
3.3 Relationship to Plan Goals Possible Points
Applicable Plan
3.3.1 Were the final conservation priorities evaluated against the original design criteria? 1 R,L
3.3.2 Did the final conservation priorities meet plan goals? 1 R,L
3.3.3 Does the local plan integrate the network design into a larger, regional network design? 3 L
*Denotes required criteria that plans must include.
4. Implementation 4.1 Decision-Support Tool Potential
Points Applicable
Plan
4.1.1 Did the plan include a decision-support tool (i.e. mechanism for quantitatively ranking conservation opportunities based on the network design and other important factors)?
5* R,L
4.1.2 Does the decision-support tool allow for the incorporation of new data as it becomes available? 3 R,L
4.1.3 Can the decision-support tool help guide local and site-level implementation efforts? 5* R,L
4.1.4 Was the methodology for developing the decision-support tool documented? 1 R,L
4.2 Implementation Tools Potential Points
Applicable Plan
4.2.1 Does the plan identify available mechanisms and tools for land protection (i.e. acquisition, easement, TDR, other)?
5* R,L
4.2.2 Does the plan assess the feasibility and effectiveness of utilizing available tools for land protection?
1 R,L
4.2.3 Does the plan recommend new conservation tools? 1 R,L
4.2.4 Were implementation tools matched with sites based on their ability 3 R,L
ECOLOPOLIS 3.0 76 11/17/2008

to handle the threats that were identified in those areas?
4.2.5 Did the plan provide useful and effective ways to integrate the green infrastructure network implementation efforts into county/city regulation, planning, capital improvement programs, and/or development review procedures?
1 L
4.2.6 Did the plan call for specific “small area plans” or similar small-scale plans to guide the conservation of target areas?
1 L
4.3 Conservation Funding Potential Points
Applicable Plan
4.3.1 Does the plan identify federal, state, local and/or private conservation funding opportunities?
5* R,L
4.3.2 Did the plan document strategies for leveraging existing funding sources to generate new sources?
1 R,L
4.3.3 Does the plan document the need for a recurring or revolving funding source?
1 R,L
4.4 Conservation Strategies Potential Points
Applicable Plan
4.4.1 Was information pertaining to related environmental protection, natural resource conservation, green space planning and other similar efforts assessed in terms of implementation opportunities?
3 R,L
4.4.2 Does the plan outline specific implementation strategies for state and regional agencies?
5* R
4.4.3 Does the plan outline specific implementation strategies for county, local governments and private landowners?
3 R,L
4.4.4 Does the plan identify relative priorities for implementation strategies?
3 R,L
4.4.5 Does the combination of all identified implementation strategies encompass a diversity of land uses?
5* R,L
4.4.6 Are implementation strategies spatially matched to create an “implementation quilt” across the network?
3 R,L
4.4.7 Was a coordinating body or task force established to oversee and coordinate implementation efforts?
1 R,L
4.4.8 Does the plan identify necessary stewardship and management activities to restore, monitor and maintain green infrastructure network resources over time?
3 R,L
4.4.9 Does the plan outline a marketing and public outreach strategy to garner further support for plan goals?
1 R,L
4.5 Defining Development Opportunities Potential Points
Applicable Plan
4.5.1 Did the plan discuss opportunities for development within the context of the green infrastructure network?
1 R,L
4.5.2 Did the plan identify a range of land uses to buffer priority protection areas from current or future development?
1 R,L
4.5.3 Did the plan recommend the use of conservation development or limited development for developing lands within the context of the
1 R,L
ECOLOPOLIS 3.0 77 11/17/2008

green infrastructure network?
4.5.4 Were implementation strategies coordinated with state or local growth management efforts?
3 R,L
*Denotes required criteria that plans must include.
ECOLOPOLIS 3.0 78 11/17/2008

References
1 Counties that touch I-5 were included in this count
2 CMSA’s
3 U.S. Census Bureau, Statistics Canada
4 Carriker, Robert C. & Ronald Reed Boyce. (2008). Washington. Retrieved May 2008, from http://www.worldbookonline.com/advanced/article?id=ar592860.
5 Barber, Katrine & Thomas Harvery. (2008). Oregon. Retrieved May 2008, from http://www.worldbookonline.com/advanced/article?id=ar405160.
6 McDonald, Robert A.J. & Graeme Wynn. (2008). British Columbia. Retrieved May 2008, from http://www.worldbookonline.com/advanced/article?id=ar77240.
7 Destination360. (2008). Oregon History. Retrieved May 2008, from http://www.destination360.com/north-american/us/oregon/history.php
8 Carriker, Robert C. & Ronald Reed Boyce. (2008). Washington. Retrieved May 2008, from http://www.worldbookonline.com/advanced/article?id=ar592860.
9 Tourism Vancouver. (2008). Why Visit Vancouver ? Retrieved May 2008, from http://www.tourismvancouver.com/visitors/about_vancouver/why_vancouver#4
10 Mercer. (2008). Highlights from the 2007 Quality of Living Survey. Retrieved May 2008, from http://www.mercer.com/referencecontent.jhtml?idContent=1128060
11 Tourism Vancouver. (2007). Cruise Ship Data For Metro Vancouver 1986-2007. Retrieved May 2008, from
http://www.tourismvancouver.com/pdf/research/cruise_volume_1986_2007.pdf
12 Tourism Vancouver. (2007). Market Origin of Overnight Visitors to Metro Vancouver 1994-2007. Retrieved May 2008, from
http://www.tourismvancouver.com/pdf/research/annual_geographic_market_origin_1994_2007.pdf
13 Vancouver EcoDensity Initiative. (2007). Online consultation of the Vancouver EcoDensity Planning Initiative. Retrieved May 2008, from http://www.vancouver-
ecodensity.ca/index.php
14 Seattle Convention and Visitors Bureau. (2008). Seattle metronatural. Retrieved May 2008, from http://www.visitseattle.org/visitors/brand.asp
15 Greater Seattle Chamber of Commerce. (2007). Key Issues and Reports. Retrieved May 2008, from
http://www.seattlechamber.com/portal/page?_pageid=33,2959&_dad=portal&_schema=PORTAL&p_menu_id=953
16 Yardley, William. (2007, November 5). In Portland, Cultivating a Culture of Two Wheels. The New York Times. Retrieved May 2008, from
http://www.nytimes.com/2007/11/05/us/05bike.html
17 TriMet. (2007, September). TriMet Review of ‘Debunking Portland: The Public Transit Myth’. Retrieved June 2008 , from
http://trimet.org/pdfs/publications/review_debunking_portland.pdf
18 Slow Food Portland. (n.d.). Joining. Retrieved May 2008, from http://slowfoodportland.com/
19 Florida, Richard. "Place + Happiness = Portland Prosperity" The Oregonian, April 27, 2008. p E1
20 Province of British Columbia. (2007). Guide to the BC Economy and Labour Market. Retrieved May 2008, from http://www.guidetobceconomy.org/
21 Prosperity Partnerhip. (n.d.). Retrieved May 2008, from www.prosperitypartnership.org
22 Oregon Business Plan.org. (2007, December 3). Cluster Resource Guide : Oregon Cluster Alignment. Retrieved May 2008, from
http://www.oregonbusinessplan.org/pdf/2008%20Cluster%20Resource%20Guide.pdf
23 Province of British Columbia. (2007). Guide to the BC Economy and Labour Market. Retrieved May 2008, from http://www.guidetobceconomy.org
24 Prosperity Partnership. ( 2005, September 27). Regional Economic Strategy for the Central Puget Sound Region. Retrieved May 2008, from
http://www.prosperitypartnership.org/strategy/index.htm#two
25 Ibid.
26 Sightline Institute. (n.d.) Green-Collar Jobs: Path out of poverty? Retrieved May 2008, from http://www.sightline.org/research/economy/res_pubs/green-collar-jobs
27 3E Strategies. (2008 May). Sustainable Oregon Workforce Initiative, Building the Clean Energy Workforce in Oregon: Analysis of Clean Energy Workforce Needs
and Programs in Oregon. Retrieved May 2008, from http://www.3estrategies.org/BASE/SustainableOregonWorkforce.asp
28 Vancouver 2010. (2008, March 18). 2010 Winter Games to source clean power from BC Hydro and promote energy conservation. Retrieved May 2008, from
http://www.vancouver2010.com/en/OrganizingCommittee/MediaCentre/NewsReleases/2008/03/18/76537_0803181055-685
29 Cascadia Region Green Building Council. (2007). Making Change in the Built Environment : 2007 Annual Report. Retrieved May 2008, from
http://www.cascadiagbc.org/about-us/2007-annual-report.pdf/
30 Cascadia Region Green Building Council. (2006). Cascadia Strategic Collaboration Initiative. Retrieved May 2008, from
http://www.cascadiagbc.org/resources/cascadia-strategic-collaboration-initiative/csci
31 Oregon Business Plan.org. (2007, December 3). Cluster Resource Guide : Oregon Cluster Alignment. Retrieved May 2008, from
http://www.oregonbusinessplan.org/pdf/2008%20Cluster%20Resource%20Guide.pdf
32 Portland Development Commission. (n.d.) Target Industry Development: Creative Services. Retrieved May 2008, from
http://www.pdc.us/bus_serv/target_industries/creative_services.asp
33 Vancouver.com. (n.d.). Vancouver Film Industry Overview & Links. Retrieved from
http://www1.vancouver.com/movies/hollywood_north/vancouver_film_industry_overview/index.htm
34 Vancouver Economic Development Commission. (2005). Key Sectors : Film & TV. Retrieved from http://www.vancouvereconomic.com/key_sectors/film_tv.htm
35 Ibid.
36 Vancouver Economic Development Commission. (2005). Key Sectors : New Media. http://www.vancouvereconomic.com/key_sectors/new_media.htm
ECOLOPOLIS 3.0 79 11/17/2008

37 Americans for the Arts. (2007). The Creative Industries in Seattle. Retrieved from http://www.seattle.gov/arts/_downloads/research/CreativeIndustriesReport.pdf
38 Stout, Gene. (2004, February 9). Sound of music ... ka-ching. Seattle Post Intelligencer. Retrieved from http://seattlepi.nwsource.com/business/159878_music09.html
39 Mayors Office of Film + Music. (n.d.). Seatle’s Film & Video Industry’s Economic Impact. Retrieved from http://www.seattle.gov/filmandmusic/
40 Oregon Business Plan.org. (2007, December 3). Cluster Resource Guide : Oregon Cluster Alignment. Retrieved May 2008, from
http://www.oregonbusinessplan.org/pdf/2008%20Cluster%20Resource%20Guide.pdf
41 Scruggs, Patricia C, Joseph Cortright & Marcia Douglas. (1999 June). Designing Portland’s Future: The Role of the Creative Services Industry. Retrieved from
http://www.pdc.us/pdf/bus_serv/creative-svcs-report.pdf
42 Portland Development Commission. (n.d.) Target Industry Development: Creative Services. Retrieved May 2008, from
http://www.pdc.us/bus_serv/target_industries/creative_services.asp
43 Scruggs, Patricia C, Joseph Cortright & Marcia Douglas. (1999 June). Designing Portland’s Future: The Role of the Creative Services Industry. Retrieved from
http://www.pdc.us/pdf/bus_serv/creative-svcs-report.pdf
44 Ibid.
45 U.S. News & World Report. (2008). Best Graduate Schools. Retrieved May 2008, from http://grad-schools.usnews.rankingsandreviews.com/grad/art/search
46 Simon Fraser University. (n.d.). 7th Floor Media. Retrieved May 2008, from http://www.7thfloormedia.com/whatwedo.php
47 Oregon Department of Agriculture. (2008, Spring). The economic footprint of Oregon agriculture. The Agriculture Quarterly, Issue 369. Retrieved from
http://www.oregon.gov/ODA/news/pub_0804aq.shtml
48 British Columbia Ministry of Agriculture and Lands. (2004, November). Agriculture Industry Profile. Retrieved from http://www.agf.gov.bc.ca/aboutind/profile.htm
49 Canadian dollars
50 British Columbia Ministry of Agriculture and Lands. (2006). Fasts Stats : Agriculture, Aquaculture and Food. Retrieved May 2008, from
http://www.agf.gov.bc.ca/stats/faststats/FastStats_2006.pdf
51 20,290 farms in 2001
52 British Columbia Ministry of Agriculture and Lands. (2004, November). Agriculture Industry Profile. Retrieved from http://www.agf.gov.bc.ca/aboutind/profile.htm
53 Washington State Department of Agriculture. (2008, April 24). About WSDA. Retrieved May 2008, from http://agr.wa.gov/AboutWSDA/default.htm
54 Oregon Department of Agriculture. (2007). State of Oregon Agriculture . Retrieved May 2008, from http://www.oregon.gov/ODA/bd_rpt_toc.shtml
55 Oregon Department of Agriculture. (2007). State of Oregon Agriculture . Retrieved May 2008, from http://www.oregon.gov/ODA/bd_rpt_toc.shtml
56 US Census Bureau estimate for 2006
57 The Agri-Business Council of Oregon. (2007). Ag Facts & Figures. Retrieved May 2008, from www.oregonfresh.net/education/agfacts.php
58 Oregon Department of Agriculture. (2008, Spring). The economic footprint of Oregon agriculture. The Agriculture Quarterly, Issue 369. Retrieved from
http://www.oregon.gov/ODA/news/pub_0804aq.shtml
59 17.1 million acres
60 Farms with over $10,000 in annual sales
61 Oregon Department of Agriculture. (2007). State of Oregon Agriculture. Retrieved May 2008, from http://www.oregon.gov/ODA/bd_rpt_toc.shtml
62 From 17.6 million to 17.1 million acres
63 Oregon Department of Agriculture. (2008, Spring). The economic footprint of Oregon agriculture. The Agriculture Quarterly, Issue 369. Retrieved from
http://www.oregon.gov/ODA/news/pub_0804aq.shtml
64 U.S. Chamber of Commerce. (2008, April). The Transportation Challenge: Moving the U.S. Economy. Retrieved May 2008 from
http://www.uschamber.com/publications/reports/0804transportationchallenge
65 Ibid.
66 Institute of Portland Metropolitan Studies. (2008, April). Draft: Planting Prosperity and Harvesting Health. Retrieved June 2008, from
http://www.pdx.edu/media/i/m/ims_foodsystemsdraftmay08.pdf
67 Oregon Business Plan.org. (2007, December 3). Cluster Resource Guide: Oregon Cluster Alignment. Retrieved May 2008, from
http://www.oregonbusinessplan.org/pdf/2008%20Cluster%20Resource%20Guide.pdf
68 U.S. Chamber of Commerce. (2008, April). The Transportation Challenge : Moving the U.S. Economy. Retrieved May 2008 from
http://www.uschamber.com/publications/reports/0804transportationchallenge
69 Oregon Department of Agriculture. (2007, May 17). Oregon University System Subcommittee. Retrieved May 2008, from
http://egov.oregon.gov/ODA/do_reports_higher_ed.shtml
70 U.S. Census Bureau, Statistics Canada
71 Prosperity Partnership. ( 2007, November 1). Puget Sound Competitiveness Indicators. Retrieved May 20, 2008, from
http://prosperitypartnership.org/indicators/FINALIndicators11.01.07.pdf
72 Prosperity Partnership. (n.d.). Information Technology Cluster. Retrieved May 20, 2008, from http://prosperitypartnership.org/clusters/it/index.htm (accessed
5/20/08)
73 Prosperity Partnership. ( 2007, November 1). Puget Sound Competitiveness Indicators. Retrieved May 20, 2008, from
http://prosperitypartnership.org/indicators/FINALIndicators11.01.07.pdf
74 Portland Development Commission. (n.d.). High-Tech. Retrieved May 2008, fromhttp://www.pdc.us/pdf/bus_serv/target_industry/high-tech-final-7-07.pdf
ECOLOPOLIS 3.0 80 11/17/2008

75 Oregon Business Plan.org. (2007, December 3). Cluster Resource Guide : Oregon Cluster Alignment. Retrieved May 2008, from
http://www.oregonbusinessplan.org/pdf/2008%20Cluster%20Resource%20Guide.pdf
76 British Columbia Ministry of Economic Development and the Ministry of Advanced Education. (2007). Profile of the British Columbia High Technology Sector.
Retrieved May 2008, from http://www.bcstats.gov.bc.ca/data/bus_stat/busind/hi_tech/HTPcurr.pdf
77 Ibid.
78 Alliance of Angels. (2008). Retrieved from http://www.allianceofangels.com
79 U.S. Census Bureau, Statistics Canada
80 McCarthy, Linda, The Good of the Many Outweighs the Good of the One – Regional Cooperation instead of Individual Competition in the United States and
Western Europe? Journal of Planning Education and Research, 23:140-152, 2003.
81 Todd, Douglas. (2008, May 6-8). Cascadia Series. The Vancouver Sun. Retrieved May 14, 2008 , from
http://communities.canada.com/vancouversun/blogs/thesearch/archive/2008/05/06/cascadia-series-1-the-dream.aspx
82 US Department of Homeland Security. Retrieved May 2008 from http://www.cbp.gov/xp/cgov/travel/trusted_traveler/nexus_prog/
83 Abbott, Carl, Crossing the Long Northern Border: Rhetoric and Reality in the Cascadian Region of Western North American, Retrieved May 2008 from
http://cascadiacommons.org/pdf/Abbott1.pdf.
84 Fraser, Paul, Canada-United States Law Journal; 2004, vol. 30, p321-324.
85 National Center for Public Policy and Higher Education. (2008). A National Overview : Improvements, Declines, and Disparities. Retrieved May 2008, from
http://measuringup.highereducation.org/nationalpicture/
86 Benton MacKaye, The New Exploration: A Philosophy of Regional Planning(Harcourt Brace and Co., 1928), p. 30.
87 Intergovernmental Panel on Climate Change (IPCC). Climate Change 2007: Scientific Assessment of Climate Change—Report of Working Group I. (Cambridge:
Cambridge University Press, 2007).
88 US EPA, Air Data, Emissions by Category Report. Data from 2001; extracted from EPA's Final 1999 National Emission Inventory (NEI) version 3 database in
August 2005. Available online: http://www.epa.gov/air/data/reports.html.
89 Mark Green, et al. Causes of Haze in the Gorge: Final Report. Vancouver, WA: Southwest Clean Air Agency; July 31, 2006. Available online:
http://www.swcleanair.org/pdf/FinalCoHaGoReport.pdf.
90 US EPA, Air Data, Emissions by Category Report. Data from 2001; extracted from EPA's Final 1999 National Emission Inventory (NEI) version 3 database in
August 2005. Available online: http://www.epa.gov/air/data/reports.html.
91 British Columbia Ministry of Water, Land and Air Protection: Water, Air and Climate Change Branch. 2000 British Columbia Emissions Inventory of Criteria Air
Contaminants: Result Highlights. Victoria, B.C.: February 2005; Revised June 2005.
92 Washington State Department of Ecology, Comprehensive three-year emissions inventory, 2005. Available online at
http://www.ecy.wa.gov/programs/air/EmissionInventory/EmInvSummary_2005.xls.
93 US EPA, Air Data, Emissions by Category Report. Data from 2001; extracted from EPA's Final 1999 National Emission Inventory (NEI) version 3 database in
August 2005. Available online: http://www.epa.gov/air/data/reports.html.
94 Available online at: http://www.nrel.gov/buildings/
95 Barnett, Jonathon. Smart Growth in a Changing World. (p. 9), 2007.
96 Information compiled from the following sources: Oregon Office of Energy, Portland General Electric, Northwest Power Planning Council, Renewable Northwest
Project, and other interested parties. Online at http://www.rnp.org/renewtech/RTsources.html
97 SB 838 established a mandate for electricity providers with a customer base serving more than 3% of the Oregon market, to purchase a minimum of 25% of the
electricity from renewable resources by 2025. WA also passed a Renewable Portfolio Standard, which requires a 15% mix of renewables by 2020.
98 Energy Trust of Oregon online at http://www.energytrust.org/. The Energy Trust is a public-purpose organization dedicated to energy efficiency and renewable
energy generation, offering rebate and incentive programs for commercial and residential development within Oregon.
99 Northwest Power and Conservation Council: http://www.nwcouncil.org/maps/power/overview.htm. The goal of the Northwest Power and Conservation Council is
to develop a 20-year electric power plan that will guarantee adequate and reliable energy at the lowest economic and environmental cost to the Northwest
and Columbia River Basin.
100 The report is the product of a partnership joining Bonneville Power Administration, City of Portland, Leading Edge British Columbia, NW Energy Technology
Collaborative, PNNL, Oregon Institute of Technology, Portland Development Commission, Portland Business Alliance, Portland General Electric, Seattle
Office of Economic Development, and Washington Office of Trade and Economic Development. Available online http://www.climatesolutions.org/
101 The Northwest Energy Efficiency Council online at http://www.neec.net/. Northwest Energy Efficiency Alliance online at http://www.nwalliance.org/. The goal of
the Northwest Energy Efficiency Alliance (NEEA) is a unique partnership between our region's utilities with the mission to drive the development and
adoption of energy-efficient products and services.
102 See State Programs table, below.
103 Microgrids are more efficient in that there is less energy loss in transmission due to the proximity of electricity generation and consumption, is more flexible as it
allows for easy tie-in by distributed energy systems, and allows for a greater level of security.
104 Energy Efficiency and Buildings: A Resource for BC’s Local Governments. Available online at http://www.bcclimateexchange.ca/index.php?p=caee
105 Press, F. 1996: Mitigating Natural Hazards. Online at: http://www.nwpublichealth.org/docs/wph/hazard.html (accessed 5/11/2008).
ECOLOPOLIS 3.0 81 11/17/2008

106 Hamlet 2001, p.6: http://cses.washington.edu/db/pdf/hamletprepforcc37.pdf
107 Ecotrust: http://www.ecotrust.org/news/natural-competitive-advantage-bioregions_20070606.html
108 Barnett, Jonathon. Smart Growth in a Changing World. (p. 18), 2007.
109 Barnett, Jonathon. Smart Growth in a Changing World. (p. 31), 2007.
110 Sightline Institute. “Community Supported Agriculture – Share and Share Alike.” June 2005.
http://www.sightline.org/publications/enewsletters/CSNews/CS_6_05_csa/
111 Barnett, Jonathan, 2007. Smart Growth in a Changing World.
112 Northwest Environment Watch, 2002. Sprawl and Smart Growth in Greater Seattle-Tacoma
113 Ibid
114 Porter, Douglas R., 2008. Managing Growth in America’s Communities
115 Center for Neighborhood Technology (2008) “Green Values Stormwater Toolbox” Available online: http://greenvalues.cnt.org/
116 Greater Vancouver Regional District. Garbage and Recycling: Zero Waste Challenge. Available online: http://www.gvrd.bc.ca/ZeroWaste/index.htm
117 Metro. Solid Waste and Recycling: 2006 – 07 Year in Review. Available online: http://www.oregonmetro.gov/files/planning/06-07_swr_annual_report_w.pdf
118 Greater Vancouver Regional District. Strategy for Updating the Solid Waste Management Plan: Discussion Document. March 15, 2008. Available online:
http://www.gvrd.bc.ca/managementplans/pdfs/Strategy_updatingSWMP.pdf
119 League of American Bicyclists, 2008. “Bicycle Friendly America.” Available online: http://www.bikeleague.org/programs/bicyclefriendlyamerica/
120 Ibid
121 Puget Sound Regional Council (2002). Central Puget Sound Regional Growth Centers. Available online: http://psrc.org/projects/monitoring/profiles/kent.pdf
122 Connecting Green Summary Sheet for Blue Ribbon Meeting (2008). [online] Available: ftp://metrotrails:[email protected] Connecting Green (April
2008). DRAFT Trail Statistics.
123 City of Portland (2008) “Maximum Mode Shift Packages” Available online: http://www.portlandonline.com/transportation/index.cfm?c=32360&a=195669
124 Greater Vancouver Regional Council (1999). Livable Region Strategic Plan.
125 British Columbia’s new Provincial Transit Plan Available online: http://www.th.gov.bc.ca/transit_plan/index.html
126 Puget Sound Regional Council’s (PSRC) Urban Centers in the Central Puget Sound region plan Available online: http://psrc.org/publications/index.htm
127 Seattle Transit Plan (2007) Available online: http://future.soundtransit.org/
128 Ibid.
129 Metro’s 2035 Regional Transportation Plan Update Metro (2008) “Regional Transportation Plan Update.” Available online:
http://www.oregonmetro.gov/index.cfm/go/by.web/id=25038
130 City of Portland (2008) “Streetcar System Plan” Available online: http://www.portlandonline.com/Transportation/index.cfm?c=46134
131 Schrank, David and Tim Lomax. Texas Transportation Institute. 2007 Urban Mobility Report. http://tti.tamu.edu/documents/mobility_report_2007_wappx.pdf
132 Kulongoski, T. (2008). Remarks prepared for the Forum for Business and the Environment. Available online:
http://governor.oregon.gov/Gov/speech/speech_041108.shtml
133 Washington State Department of Transportation (2007). Performance Audit Report: Managing and Reducing Congestion in Puget Sound. [online] Available:
http://www.sao.wa.gov/reports/auditreports/auditreportfiles/ar1000006.pdf
134 DriveLessSaveMore. Ridesharing. [online] Available: http://www.drivelesssavemore.com/travel/ride_sharing/ [May 24, 2008].
135 CarpoolMatchNW. About CarpoolMatchNW. [online] Available: http://www.carpoolmatchnw.org/ [May 23, 2008].
136 Metro (2008). “Metro Vanpool.” Available online: http://www.oregonmetro.gov/index.cfm/go/by.web/id=23773 [May 21, 2008].
137 WSDOT (February 2006). “Long Range Plan for Amtrak Cascades” Available online: http://www.wsdot.wa.gov/Freight/Rail/RideTrain.htm
138 Ibid.
139 Ibid.
140 Vancouver Airport Authority (2008). Passenger Statistics. Available online: http://www.yvr.ca/authority/facts/
141 PSRC (2008) “Regional Airport Ground Access Plan.” Available online: http://psrc.org/projects/air/pubs/groundaccess.htm
142 Portland International Airport (2000), “Decentralized Alternative Master Plan” Available online: http://www.portofportland.com/PDX_MP_plan_dev.aspx
143 Intermodal Association of North America, 2007 “Facts and figures.” Available online: http://www.intermodal.org/statistics_files/index.shtml
144 Vancouver Port Authority (2006) Available online: http://www.portvancouver.com/media/news_20061006-3.html
145 Young, Kristen Millares (2008) “Puget Sound ports take steps toward cooperation” Seattle Post-Intelligencer 4/28/2008. Available online:
http://seattlepi.nwsource.com/local/357383_port02.html
146 Newman, D. and J.H. Walder (2003), “Federal ports policy”, Maritime Policy & Management 30 pp. 151-163.
147 Young (2008).
148 Skysails (2008) “Using Wind Power Profitably” Available online: http://www.skysails.info/index.php?id=472&L=2
149 Miller, Paige, et al (2006) “Logistics and international trade: the global race to the top” The Seattle Times 4/20/2006
150 Pacific Northwest Waterways Association (2005) Columbia Snake River System and Oregon Coastal Cargo Ports Marine Transportation System Study Appendix C
Short Sea Shipping in the Columbia/Snake River System. Available online:
http://www.pnwa.net/ceder/Appendix%20C%20CEDER%20Short%20Sea%20Shipping.pdf
ECOLOPOLIS 3.0 82 11/17/2008

151 Ronald J. Silva (2006) “Short sea Shipping: the Next Mode of Transportation” Available online: http://www.calregions.org/pdf/bln/fresno/short_sea_shipping.pdf
152 National Ports and Waterways Institute (2004) Available online: http://members.tripod.com/~npwi/research1.html
153 Pacific Northwest Waterways Association, 2005
154 Vancouver Port Authority (2005) “VPA Introduces the Supply Chain Strategy Program: A Program to Improve the Efficiency of the Vancouver Gateway” Available
online: http://www.portvancouver.com/shipping_trade/docs/Issue%201%20-%20Intro%20to%20Supply%20Chain%20posted%20May%2030%2006.pdf
155 Brian Lewis, (2008) “Fraser River Works as Transport route” The Vancouver Province 8/12/2008. Available online:
http://www.canada.com/theprovince/columnists/story.html?id=321596e2-b1a7-4877-aa80-c622fb725b71
156 Brooks, Mary R. and Jim Frost (2004), “Short Sea Shipping: A Canadian Perspective” Maritime Policy and Management, 31:4 pp. 393-407.
157 Pacific Northwest Waterways Association, 2005
158 Richeson, K. (2000). Introductory Guide to CIVSN. PO)-99-7186. Available online:
http://cvisn.fmcsa.dot.gov/downdocs/cvisndocs/guides/intro_p2/pdf_all1/intro_p2full.pdf"ttp://cvisn.fmcsa.dot.gov/downdocs/cvisndocs/guides/intro_p2/pdf_
all1/intro_p2full.pdf
159 U.S. Department of Transportation, Research and Innovative Technology Administration, Bureau of Transportation Statistics (2007). “National Bridge Inventory,
Deficient Bridges by State and Highway System, special tabulation.” Available online:
http://www.bts.gov/current_topics/2007_08_02_bridge_data/html/bridges_by_state.html
160 Washington State Department of Transportation (2008) Commercial Vehicle Information Systems and Networks. Available online:
http://www.wsdot.wa.gov/CommercialVehicle/CVISN/
161 ODOT (2008). Green Light Weigh Station Preclearance. Available online:
http://www.oregon.gov/ODOT/MCT/GREEN.shtml"http://www.oregon.gov/ODOT/MCT/GREEN.shtml
162 Transcore (2003). Northwest International Trade Corridor Program Phase Three: Electronic Container Seals Field Operational Test Project, Task #3, Operational
Requirements Concept Paper. Available online:
http://depts.washington.edu/trac/freight/pdf/eseal/NWITCPhase3OperationalRequirementsConceptPaper_F.pdf
163 Washington State Department of Transportation (2007). Annual Mileage and Travel Information. Available online:
www.wsdot.wa.gov/mapsdata/tdo/annualmileage.htm
164 Whatcom Council of Governments (2008). Free and Secure Trade Promotion Program. Available online: http://www.wcog.org/Border/IMTC-Projects/Border/IMTC-
Projects/FAST-Promotion/70.aspx
165 CalTrans, Oregon Department of Transportation, and Washington State Department of Transportation (2007). Corridors of the Future, Interstate 5, a Roadmap for
Mobility.
166 WSDOT, 2007
167 CalTrans, Oregon Department of Transportation, and Washington State Department of Transportation (2007). Corridors of the Future, Interstate 5, a Roadmap for
Mobility.
168 American Society of Civil Engineers (2005). Report Card for America’s Infrastructure. [online] Available: http://www.asce.org/reportcard/2005/index.cfm [May 21,
2008].
169 Washington State’s Improvement Prioritization System
170 USDOT (2007)
171 Washington State Department of Transportation (2007). “Key Facts.” Available online: http://www.wsdot.wa.gov/publications/manuals/fulltext/M0000/KeyFacts.pdf
172 Washington State Department of Transportation, Bridges and Structures Office (2008). Washington State Bridge Preservation Program Report Available online:
http://www.wsdot.wa.gov/NR/rdonlyres/55B20E76-CD8B-43F7-A157-BD977E90065A/0/04BridgesandStructures.pdf
173 USDOT, 2007
174 ODOT, Engineering Section (2007). Bridge Condition Report. Available online: http://www.oregon.gov/ODOT/HWY/BRIDGE/
175 MacKaye, B. (1990). The new exploration: A philosophy of regional planning. Harpers Ferry, WV, The Appalachian Trail Conference.
176 H. R. 5976 United States Commission on Rebuilding America for the 21st Century Act
177 Regional Plan Association, “America 2050: A Prospectus,” New York: September 2006.
178 Lee, K.I. 1993. Compass and Gyroscope: Integrating Science and Politics for the Environment. Washington, DC: Island Press.
179 Rittel, H. and M. Webber. 1973. Dilemmas in a General Theory of Planning. Policy Sciences 4: 155-169. Horn, R.E. 2001. “Knowledge Mapping for Complex
Social Messes,” a presentation to the "Foundations in the Knowledge Economy" conference at the David and Lucile Packard Foundation, July 16, 2001.
Conklin, J. 2005. Dialogue Mapping: Building Shared Understanding of Wicked Problems. San Francisco, CA: John Wiley and Sons.
180 Wilkinson, C. 1992. Crossing the Next Meridian: Land, Water, and the Future of the West. Washington, DC: Island Press Knight, R. and P. Landres. 1998.
Stewardship Across Boundaries. Washington, DC: Island Press. Cortner, H.J. and M.A. Moote. 1999. The Politics of Ecosystem Management. Washington,
DC: Island Press.
181 Scholz, J. and B. Stiftel. 2005. “The Challenges of Adaptive Governanace.” In Adaptive Governance and Water Conflict: New Institutions for Collaborative
Planning. Edited by J. Scholz and B. Stiftel, Washington, DC: Resources for the Future, 1-11.
182 Daniels, S. and G. Walker (1996). "Collaborative learning: Improving public deliberation in ecosystem-based management." Environmental Impact Assessment
Review16: 71-102. Cortner, H.J. and M.A. Moote. 1999. The Politics of Ecosystem Management. Washington, DC: Island Press. Margerum, R. D. (2002).
ECOLOPOLIS 3.0 83 11/17/2008

"Collaborative planning: Building consensus and building a distinct model for practice." Journal of Planning Education and Research21: 237-253.
183 Innes, J. E. (1996). "Planning through consensus building: A new view of the comprehensive planning ideal." Journal of the American Planning Association 62(4):
460-472. Healey, P. (1997). Collaborative planning. Vancouver, Canada, University of British Columbia Press. Forester, J. (1999). The deliberative
practitioner: Encouraging participatory planning processes. Cambridge, The MIT Press. Bingham, Nabatchi et al. 2005 “The New Governance: Practices
and Processes for Stakeholder and Citizen Participation in the Work of Government” Public Administration Review 65:5 pp 547-558.
184 Nijssen, B., O'Donnell G.M, Hamlet, A.F., Lettenmaier, D.P., 2001, Hydrologic Sensitivity of Global Rivers to Climate Change, Climatic Change, 50, pp 143-145
ECOLOPOLIS 3.0 84 11/17/2008