echogenic biomaterials for medical ultrasound tracking
TRANSCRIPT

Echogenic Biomaterials for Medical Ultrasound Tracking
Jerry Contreras
Dissertation submitted to the faculty of the Virginia Polytechnic Institute and State
University in partial fulfillment of the requirements for the degree of
Doctor of Philosophy
in
Materials Science and Engineering
Abby R. Whittington
Alexander O. Aning
Carlos T. A. Suchicital
Derek Irvine
22nd May 2020
Blacksburg, VA
Keywords: Ultrasound, Composite, Polymer, Microparticles

Echogenic Biomaterials for Medical Ultrasound Tracking
Jerry Contreras
Abstract
As the world population ages, hospital discharges of geriatric patients to nursing
homes have increased. Patients with peripherally inserted central catheters (PICCs)
are routinely discharged with the catheters in place. PICCs, only capable of being
tracked through x-ray imaging, will routinely experience complications due to
thrombosis or accidental dislodgement from poor at-home care. Routinely, elderly
patients will be forced to revisit the hospital to have the catheter replaced using x-ray
imaging, exposing them to hospital borne illness. Catheters with the capability to be
tracked without the need of x-ray imaging would greatly benefit the ill and elderly,
providing decreased stress to the patients and increase nursing home capabilities.
This project seeks to develop the field of real-time ultrasound tracking of polymeric
medical devices, through fabrication of ultrasound responsive polymer-glass
composites. Optimal composition will be researched through three complimentary
approaches. The first approach seeks to develop a polyurethane-glass microparticle
composite to understand the relationship between microparticle loading and
ultrasound imaging. In the second approach, manufacturing and end-use
complications will be simulated to evaluate the effects on mechanical and ultrasonic
properties. Furthermore, impacts from in-vitro long term catheterization to the sample
mechanical and ultrasound morphologies would be analyzed. In the third approach,
optimization from the previous approaches would assist in the replacement of medical
grade polyurethane with medical grade thermoset silicone in hopes to prove the
ability for the research to be transferable to other medical polymeric devices. The
stated approaches will be useful for setting a path towards the development of
ultrasonic imaging as the standard for medical device tracking.

Echogenic Biomaterials for Medical Ultrasound Tracking
Jerry Contreras
General Abstract
As the world population ages, hospital discharges of geriatric patients to nursing
homes have increased. Patients with peripherally inserted central catheters (PICCs)
are routinely discharged with the catheters in place. PICCs, only capable of being
tracked through x-ray imaging, will routinely experience complications due to poor
at-home care. Routinely, elderly patients will be forced to revisit the hospital to have
the catheter replaced using x-ray imaging, exposing them to hospital borne illness.
Catheters with the capability to be tracked without the need of x-ray imaging would
greatly benefit the ill and elderly, providing decreased stress to the patients and
increase nursing home capabilities. We hope to develop the field of real-time
ultrasound tracking of plastic medical devices, through production of ultrasound
activated plastic devices.

I
Acknowledgements
I would like to thank my advisor Dr. Abby Whittington for her support over the last
four years. I as well would like to gratefully give thanks for the contribution from the
following people towards obtaining data for this proposal:
• Amy Stimpson (Chemical Engineering, University of Nottingham)
• Dr. Ifty Ahmed (Materials and Mechanical Engineering, U. of Nottingham)
• Dr. Martha M. Larson (Small Animal Clinical Sciences, Virginia-Maryland)
• Dr. Thomas Staley (Materials Science and Engineering, Virginia Tech)
• Stephen McCartney (NCFL, Virginia Tech)

II
Table of Contents
Chapter 1: Introduction 1
1.1 Motivation 1
1.2 Hypotheses 2
1.3 Approaches 5
1.3.1 Approach 1 5
1.3.2 Approach 2 6
1.3.3 Approach 3 7
Chapter 2: Background Literature Review 9
2.1 Medical Catheter Tracking 9
2.1.1 Catheter complications 11
2.1.2 Alternative research 12
2.1.3 Ultrasound application and complications 13
2.2 Medical Ultrasound Imaging Background 15
2.2.1 B-Mode imaging 17
2.2.2 Doppler imaging 18
2.2.3 Shear-Wave Elastography 18
2.2.4 Microparticle Twinkle Theory 19
2.3 Filler Particle Application on Polymers 21
2.4 Biocompatible Glass Particles 22
2.5 Soft Tissue Ultrasound Phantoms 23

III
Chapter 3: Fabrication and Characterization of Polyurethane &
Microparticle Composites 25
3.1 Abstract 25
3.2 Background 26
3.3 Materials and Methods 29
3.3.1 Materials 29
3.3.2 Gas pycnometer (density) testing 30
3.3.3 Polyurethane preparation 30
3.3.4 Particle measurements (ESEM) 30
3.3.5 Twin screw extrusion procedure 31
3.3.6 Dynamic mechanical analysis (DMA) of films 32
3.3.7 Soft tissue phantom production 33
3.3.8 Ultrasound imaging procedure 34
3.3.9 Statistical analysis 35
3.4 Results and Discussion 35
3.4.1 Particle characterization 36
3.4.2 Twin screw extrusion procedure 38
3.4.3 Tensile testing of films 41
3.4.4 Microscopy before and after tensile test 42
3.4.5 Ultrasound imaging procedure 43
3.4.6 Ultrasound analysis 46
3.4.7 B-Mode 48
3.5 Conclusion 49
Chapter 4: Fabrication & Characterization of Silicone Composites 51
4.1 Background 51

IV
4.2 Materials and Methods 52
4.2.1 Materials 52
4.2.2 General Procedure used for fabrication 53
4.2.3 General Procedure used for sample density and tensile testing 53
4.2.4 General Procedure used for Soft tissue phantom, Ultrasound Imaging,
and Signal-to-Noise analysis 54
4.2.5 Statistical analysis 55
4.3 Results 55
4.3.1 Assessment of sample density and tensile properties 55
4.3.2 Ultrasound Signal-to-Noise analysis 56
4.4 Discussion 58
4.5 Conclusion 60
4.6 Appendix 61
Chapter 5: Degradation Impacts to Echogenic Properties of Polymer &
Microparticle Composites ……..62
5.1 Introduction 62
5.2 Materials and Methods 63
5.2.1 Materials 63
5.2.2 General Procedure used for fabrication 64
5.2.3 General Procedure used for Soft tissue phantom, Ultrasound Imaging,
and Signal-to-Noise analysis 65
5.2.4 General Procedure used for Sample Degradation Study 66
5.2.5 Cytotoxicity sample preparation 67
5.2.6 Cytotoxicity testing 67
5.2.7 Statistical analysis 68
5.3 Results 68
5.3.1 Sample Fabrication 68

V
5.3.2 Tensile Sample Ultrasound Analysis 70
5.3.3 Sample Degradation 72
5.3.3 Cytotoxicity Testing 74
5.4 Discussion 75
5.5 Conclusion 77
Chapter 6: Overall Conclusions & Future Work 79
6.1 Overall Conclusions 78
6.2 Specific Project Conclusions 80
6.2.1 Polyurethane Response to Ultrasound Enhancement 81
6.2.2 Silicone Response to Ultrasound Enhancement 82
6.2.3 Polymer Ultrasound Response to Degradation 83
6.3 Future Work 84
References 86
Appendix A 91
A.1 Fluorescent Coated Particle Fabrication 91

VI
List of Figures
Figure 2.1 Peripherally Inserted Central Catheter 11
Figure 2.2 Longitudinal ultrasound image showing a thrombosed vein with a
PICC seen as parallel bright reflective lines within it 15
Figure 2.3 B-Mode Ultrasound Image at 20-6 MHz range 19
Figure 2.4 Schematic showing axial resolution and its dependence on
particle distance 20
Figure 3.1 Gelatin-Metamucil soft tissue phantom 33
Figure 3.2 Scanning electron microscope image used for particle sizing 36
Figure 3.3 Thermal gravimetric analysis of glass particle degradation over
temperature up to 450 ˚C 37
Figure 3.4 Backscatter ESEM images of common extrusion defects 39
Figure 3.5 Backscatter ESEM images of an optimal extrusion sample 40
Figure 3.6 Representative stress-strain plot of pure polyurethane 42
Figure 3.7 Representative thin film composite sample of 10wt% loading at
5x magnification 43
Figure 3.8 B-Mode images of composite extrusions within Penrose drain’s
filled with DI water 44
Figure 3.9 B-Mode images of composite extrusions within Penrose drain’s
filled with DI water 45
Figure 3.10 B-Mode images of composite extrusions within Penrose drain’s
filled with DI water 46
Figure 3.11 Example ultrasound image under B-mode 47
Figure 3.12 Signal to Noise ratios for Red Rubber catheter 48
Figure 3.13 B-Mode image of a 5wt% composite sample 49
Figure 4.1 B-Mode images of composite samples within Penrose drains 57
Figure 4.2 Signal to Noise ratios for soft tissue phantom 58
Figure 4.3 B-mode image of 5 wt% P40 sample 60

VII
Figure 5.1 Representative polyurethane thin film composite sample of
10wt% loading at 5x magnification 69
Figure 5.2 Representative silicone composite of 5wt% Silica under
secondary electron scanning microscopy 70
Figure 5.3 B-Mode images of composite samples within Penrose drains 71
Figure 5.4 Signal to Noise ratios for soft tissue phantom 72
Figure 5.5 Polyurethane (A) and 5wt% P40 (B) samples after 4 weeks of PBS
submersion 73
Figure 5.6 Cell count values (n=4) of polyurethane control 74
Figure 5.7 Signal to Noise ratios for soft tissue phantom 76
Figure 5.8 Ultrasound comparison of Pre-Tensile tested samples 77
Figure A.1 Fluorescent coated particles within an extruded polyurethane
catheter under blacklight 91
List of Tables
Table 2.1 Common types of medical ultrasound transducers provided by
Philips Healthcare and Supersonic Imagine 17
Table 3.1 Elemental composition of glass-ceramic particle 37
Table 3.2 Theoretical bulk density of composite samples as filler loading
increased 38
Table 3.3 Elastic Modulus determined by DMA 41
Table 4.1 Density and Young’s modulus determined by Archimedes
density kit and Instron tensile testing respectively 56
Table 5.1 Total mass change (%) of samples after a four-week period 73

VIII

1
Chapter 1
Introduction
1.1 Motivation
Current medical devices fabricated entirely from polymers require the addition of a
radio-opaque coating in order to track the devices once within the body through x-
ray imaging. Patients with long-term medical devices implanted, such as peripherally
inserted central catheters (PICCs) inserted through a peripheral vein and guided to
the right atrium of the heart, are routinely sent home the same day as the procedure
due to the device’s relative safeness. Most often, patients undergoing PICC
implantation are geriatric patients in whom intravenous access has become difficult.
PICC’s offer a long-term method for drug and nutrient delivery in these patients [1,
2]. In a hospital setting, the success rates for dedicated nursing teams positioning
PICCs without the use of x-ray imaging range from 15% to 90% [3-7]. Malposition
incidence rates, requiring repositioning of the catheter, were found to range from 1.1
to 5.6% when using fluoroscopic imaging during insertion [4]. PICC line infection was
found to prolong patient hospital stays by 4.6 days and cost $15,973 [8]. For geriatric
patients, the use of x-rays to reposition their catheters translates to additional time
spent in the hospital, potentially increasing the risk of contracting nosocomial
diseases. Replacing ultrasound as the standard for catheter tracking within the body
would greatly benefit patients through minimizing x-ray exposure and costs to
patients because the procedure could be done bedside instead of in an interventional

2
radiology room. A current obstacle to this approach is the polymers of which devices
like PICCs are composed have lower densities than that of soft tissue. Under
ultrasound imaging, which uses the reflection and refraction interactions of sound
waves through tissues of varying density and stiffness in order to form an image, a
device with similar density to soft tissue could not be differentiated from its
surroundings [9]. Increasing the devices echogenic properties would require the
increase of density or stiffness of the device, which in turn would negatively affect
their primary functions as flexible catheters. Any modifications to the material would
need to minimally impact flexibility, density, and cytotoxicity. Therefore, I anticipate
the use of microparticles, holding echogenic characteristics, as a filler material will
create devices with bulk echogenicity.
1.2 Hypotheses
The overall goal of this project is to research the compatibility between ultrasound
imaging theory and filler particle materials in order to produce echogenic reactions
in medical devices without significant impact to mechanical properties. These critical
properties vary between medical devices, and thus the devices will be limited to
catheters for this proposal. Peripheral catheters, whose use is to be inserted into a
peripheral artery and reach the heart, have the critical property to remain flexible;
While urinary catheters are designed as rigid, therefore, decreased flexibility would
have minimal impact on its function. Thus, the goal will be for the composite tensile
strength, elastic modulus, density, and flexibility to be minimally impacted by particle
3
loading. The body of the research was divided into three hypotheses with approaches
for proving each one:
Hypothesis 1: Microparticles may be added to thermoplastic polyurethane, inducing
significant ultrasound response without significant impact to mechanical properties.
Hypothesis 2: Microparticles may be added to thermoset silicone, inducing
significant ultrasound response without impact to mechanical properties.
Hypothesis 3: Composites of microparticles and polymer undergoing long term
simulated body fluid and mechanical degradation, will produce insignificant impacts
to ultrasound response.
In regards to Hypothesis 1, the focus will be on varying the loading amount of filler
particles in polymers while keeping the density and particle size consistent.
Background on ultrasound imaging shows a requirement for interaction to be between
different density materials, with particle size larger than micron scale, in order for a
reflection to occur at medical wavelengths [10, 11]. Our first approach would be to
use particles, matching the minimal requirements for ultrasound interactions, and
introduce them into a polymer matrix until an echogenic effect is produced. Testing
of multiple loading amounts will allow for narrowing down of the optimal weight
percent (wt%) loading, as well as the impacts of overloading or underloading
samples. Too many particles, and the samples may become too stiff and produce
entire reflection of ultrasound. Inversely, too little particles, and the samples may be
indifferentiable from soft tissue.

4
For Hypothesis 2, we would substitute stiff polyurethane for softer silicone in order to
improve echogenicity. As ultrasound relies on stiffness and density, reducing the
stiffness of the polymer surrounding each particle should allow for increased
harmonic vibrations of particles, and potential increase in Signal to Noise ratio. As the
difference in density of polyurethane and silicone are insignificant (1.13 g/cm3 to 1.12
g/cm3), in samples with identical geometry, changes in echogenicity would rely
solely on stiffness alterations. Inversely, varying the filler particle density, while
keeping loading amount and particle size consistent should produce a similar effect.
If higher density (>p40) particles are used, this would result in increased reflection
intensity, while interaction amounts would stay constant, and thus producing a
brighter ultrasound signal [10]. In exchange, the samples bulk density may increase.
If lower density (tissue<<p40) particles are substituted, a decrease in reflection
intensity would be seen and result in lower signal. In exchange, the samples bulk
density may decrease.
For Hypothesis 3, possible impacts from common processing issues and normal
medical use to the echogenicity of samples will be examined. Catheters created from
extrusion may have air pockets trapped within the sample walls, posing little risk to
radiopaque catheters, but significantly modifying ultrasound interactions.
Interactions between ultrasound waves and air result in 99% reflection of waves,
substantially decreasing imaging depth during procedures[10, 11]. Furthermore, the
risk of particle fracture during the extrusion process is significantly higher due to the
particles’ glassy nature, potentially decreasing the echogenicity of samples as the
possible ultrasound interactions are decreased in number. Conditions faced in

5
medical settings may further affect echogenicity as catheters spend an average of 43
days in geriatric patients and 15 days in hospital patients [2, 12]. Studies of the
samples’ echogenicity and tensile properties after being submerged in body
temperature simulated body fluid (Phosphate Buffered Saline at 37 ˚C) for long
periods of time, will allow for a thorough understanding of expected issues in-vivo.
Lastly, accidental removal of catheters is a rare but real possibility for geriatric
patients (12%), leading to possible detachment between particle-polymer interfaces,
producing voids [1]. Study into the possible echogenic ramifications will be examined
through image analysis and mechanical testing.
1.3 Approaches
The project involved the following approaches:
1.3.1 Approach 1: Fabricate polyurethane samples producing significant
ultrasound contrast inside a soft tissue phantom, while minimally
impacting its mechanical properties.
This approach would target Hypothesis 1, and have the following structure (See
Chapter 3):
1. Fabricate composite samples, composed of a thermoplastic polyurethane
matrix (TPU), and biocompatible phosphate microspheres (P40) as the filler.
2. Filler loading amounts will be based off weight%, ranging from 1 wt%, 3
wt%, 5 wt%, and 10 wt%.

6
3. Particle distribution will be confirmed through environmental scanning
electron microscopy (ESEM), while density would be analyzed through gas
pycnometer. Impact to mechanical properties would be seen through
dynamic mechanical analysis (DMA) tensile testing.
4. Ultrasound contrast capabilities will be derived from sample insertion into
soft tissue mimicking phantoms, and contrast statistics derived through use
of B-mode imaging with pediatric and linear array wands.
1.3.2 Approach 2: Fabricate samples with silicone as the primary polymer,
holding greater echogenic capabilities and decreased thickness
This approach will target Hypothesis 2, and will be tested with the following structure
(See Chapter 4):
1. Fabricate composite samples, composed of thermoset silicone elastomer
and phosphate glass microparticles with differing densities.
2. Particle loading amounts will begin with the optimal loading found from Aim
1 and modify accordingly.
3. Filler distribution will be confirmed through environmental scanning
electron microscopy (ESEM), while density would be analyzed through gas
pycnometer. Impact to mechanical properties would be seen through
dynamic mechanical analysis (DMA); tensile testing.

7
4. Ultrasound contrast capabilities will be derived from sample insertion into
soft tissue mimicking phantoms, and contrast statistics derived through use
of B-mode imaging with pediatric and linear array wands.
1.3.3 Approach 3: Characterize processing and degradation issues, and their
potential impacts to echogenic properties in the final extrusions.
Targeting Hypothesis 3, this approach would have the following structure (See
Chapter 5):
1. Fabricate composite samples, composed of RxT90a polyurethane and P40
glass microspheres with defects of air bubbles, fracturing of particles, and
internal stresses.
2. Cytotoxicity of composites will be tested through MTS analysis of seeded
3T3 Mouse Fibroblast cells below extruded composite samples for 24-hour
incubation.
3. Simulated exposure to inner body environments will be studied through
soaking of samples in phosphate buffered saline (PBS) solution for weeks.
Seeking to replicate exposure time seen in current catheters, averaging 15
days in hospital patients, and 43 days in nursing facility patients [1, 12].
4. Simulated exposure to possible pulling of samples during medical
procedures will be studied through exposing of samples to increased
mechanical stress conditions.

8
5. Filler distribution and defects will be confirmed through environmental
scanning electron microscopy (ESEM). Impact to mechanical properties
would be seen through dynamic mechanical analysis (DMA); tensile testing.
6. Ultrasound contrast capabilities will be derived from sample insertion into
soft tissue mimicking phantoms, and contrast statistics derived through use
of B-mode imaging with pediatric and linear array wands.

9
Chapter 2
Background
2.1 Medical Catheter Tracking
Through use of x-ray imaging, known as Fluoroscopy, polymeric medical devices
have the capacity to be tracked through the body. Capable of real time imaging,
fluoroscopy is seen as the golden standard for catheter placement, but, limits
visualization of the device to decrease the patient’s exposure of ionizing radiation and
requires medical staff to wear heavy lead garments to protect against ionizing
radiation [13, 14]. Today, the Seldinger technique is recommended to be combined
with ultrasound imaging to quickly and carefully insert catheters[15]. The technique
involves the use of ultrasound to locate a viable insertion vessel, for peripherally
inserted central catheters (PICCs), this is commonly the basilic or cephalic vein in the
upper arm (Figure 2.1)[16, 17]. Once the chosen vein is located, ultrasound is
continued to guide a large bore needle to accurately puncture the vein. Next, a thin
flexible guidewire is inserted through the needle and into the vein, followed by
removal of the needle. A polymer catheter is then threaded around the guidewire and
into the vein, being slowly advanced through the length of the vein until reaching its
intended destination in the superior vena cava or right atrium, as seen in Figure
2.1[18]. Guiding the catheter to this location is commonly achieved through either of
two methods, the most likely is the use of continuous fluoroscopy to guide the catheter
10
in real time, if in the radiology department; while the second relies on experienced
nurses to blindly maneuver the device into the approximate area at bedside, without
the use of any imaging, and confirm position through fluoroscopy at a later time[5].
Movement of catheters can lead to malposition of the device which then leads to
complications[19]. Malposition of catheters placed without the assistance of imaging,
are reported anywhere from 10% to 85% of insertions, requiring repositioning or
replacement of the catheters, leading to increased x-ray exposure and cost to patients
[3, 4, 6, 7]. With a significant factor for success being the experience of the one
inserting the device. This increased exposure to x-ray could lead to detrimental
effects later in life for those undergoing catheter placements at an early age,
increasing their risks to cancer [20, 21]. Inability of bedside nurses to track catheters
introduces human error, thus there is a need for a secondary imaging modality, which
would be able to effectively track devices at bedside, without the need for x-ray
fluoroscopy confirmation.

11
Figure 2.1: Peripherally Inserted Central Catheter[22].
2.1.1 Catheter complications
For those in geriatric practices, where patients may be sent home with an in-place
catheter, and be taken care of by at home nurses, the use of fluoroscopy becomes a
hindrance. Patients with long-term catheters have a significant possibility of
complications over time, as bacteria may build up or the catheter may change
positions. Recent studies in nursing facilities have shown an overall 46% of patients
reported other problems with their lines including: 12% of patients undergoing
accidental dislodgement of their PICC lines, and 15.8% suffering from line thrombosis
[1, 2]. Complications in position would require for patients to visit a hospital to have
the catheter be repositioned through fluoroscopy, an all-day expensive affair.
Alternatively, there has been a recent push toward bedside ultrasounds for improved

12
diagnosis of health issues, as well as outreach toward rural areas[23]. Ultrasound
diagnostic training has evolved to meet demands, such that in-person live model
training may be replaced by simulation training, boosting reach to rural
communities[24].
2.1.2 Alternative research
Reducing replacement rates for fluoroscopy tracking of catheters is a current focus of
research [25-29], with several papers being published in the last five years. In 2014,
research into the use of near-infrared imaging for tracking of catheters was published,
showing promise in the possibility of mixing fluorescent dye with catheter materials
[25]. Another study showed the possibility of using electrocardiograms to
demonstrate position of a catheter tip inside the heart [26]. Both methods would
require purchase of new imaging systems and extensive training of medical staff,
making them poorly transferable to geriatric patients in nursing facilities. Most
recently, use of deposited micro-shells on device surfaces has shown promise. Hollow
micro-particles filled with gases would be deposited as coatings and be detectable
under doppler ultrasound imaging[27-29]. The concept uses a similar mechanism as
current commercial ultrasound contrast agents, relying on the harmonic oscillations
of encapsulated gases when exposed to ultrasound frequencies to be detected [30].
While promising, the coating has a limited lifetime, as the shells pop during imaging,
and would not be feasible for long term implantation. Proposed alternatives have the
further challenge of competing against cost benefits, as X-ray tracking additives of
13
polymer devices are cheap, requiring the minute addition of additives to the
formulation to make them radiopaque[31]. This feature makes fluoroscopy attractive
towards manufacturers of devices, as most hospitals would be expected to include a
fluoroscopy room.
2.1.3 Ultrasound application and complications
Ultrasound imaging is widely known to be used for imaging of unborn fetuses and
other solid organs, while also being commonly used for introductory tracking of
inserted medical devices. Used at higher frequencies, shallow imaging of artery and
veins allows for facilitated puncturing and insertion of venous catheters[32]. While
resolution is hindered, the imaging is widely used due to its real time tracking, and
ability to be performed at bedside. Therapeutic range of frequencies and depths are
shown in Table 2.1. Ultrasound alone has shown promise in tracking capabilities.
During catheter placement, experienced nurses may even position a catheter without
use of fluoroscopy at bedside, only verifying correct positioning until reaching a
fluoroscopy room [33, 34]. As mentioned above, this practice has shown to have a
varying success rate, with 10% to 85% of PICC’s being reported as malpositioned and
requiring repositioning through fluoroscopy [3-7]. It is important to note that in this
method, ultrasound is used to guide needle insertion into the vein and is not continued
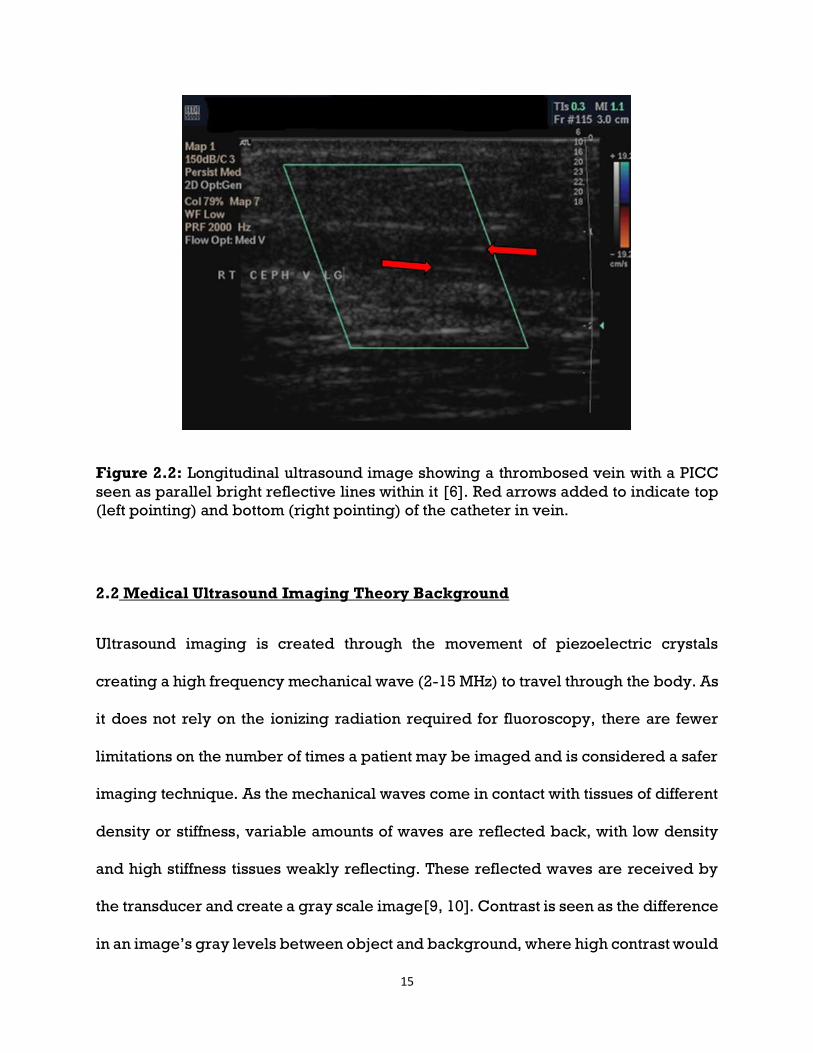
after vein puncture. As shown in Figure 2.2, continuous tracking of catheters is not
currently possible, as catheters are not significantly different then the soft tissue
around it. This in turn makes the success of bedside insertion of catheters reliant on

14
the experience of the person performing the procedure, introducing significant
human error [4]. Recent studies have shown promise in using echocardiograms of the
heart to confirm position of PICCs once inside the heart [35-37]. Current limitations in
full implementation of ultrasound for catheter confirmation may lie in the recency of
the practice in neonates, as well as the significantly low success of these studies. With
a 25% and 59% accuracy reported in recent studies using neonates, full
implementation of ultrasound echocardiograms as a replacement for fluoroscopy is
far away [35, 36]. Interestingly, a 2017 study found 96.55% accuracy by pushing saline
through the catheter, and using bubbling produced at the tip of the catheter as an
ultrasound contrast agent [37].
Microbubbles filled with bioinert gas have proven to be an effective contrast agent in
ultrasound, though there are currently only one FDA approved brands. Known as
LumasonTM, they consist of Sulphur Hexafluoride (SF6) inert gas encapsulated by a
phospholipid shell, ranging from 1.5 to 2.5 µm[30]. Relying on the interaction between
encapsulated gas with harmonic ultrasound imaging, their cost is estimated at $153.28
per dose, making them a potential alternative for initial catheter insertion, but
unattractive for daily inspection of catheter positioning[38]. A device which could be
detected throughout the average 43 days of regular catheter implantation, would not
only reduce exposure to ionizing radiation and increase safety of patients, but could
also be cost-effective and improve the quality of life for those in geriatric care.
15
Figure 2.2: Longitudinal ultrasound image showing a thrombosed vein with a PICC
seen as parallel bright reflective lines within it [6]. Red arrows added to indicate top
(left pointing) and bottom (right pointing) of the catheter in vein.
2.2 Medical Ultrasound Imaging Theory Background
Ultrasound imaging is created through the movement of piezoelectric crystals
creating a high frequency mechanical wave (2-15 MHz) to travel through the body. As
it does not rely on the ionizing radiation required for fluoroscopy, there are fewer
limitations on the number of times a patient may be imaged and is considered a safer
imaging technique. As the mechanical waves come in contact with tissues of different
density or stiffness, variable amounts of waves are reflected back, with low density
and high stiffness tissues weakly reflecting. These reflected waves are received by
the transducer and create a gray scale image[9, 10]. Contrast is seen as the difference
in an image’s gray levels between object and background, where high contrast would

16
refer to an object having significantly higher gray level than the background[11]. The
transmittance of this mechanical wave from one tissue to another, may be reflected
due to the difference between tissues. Soft tissues, such as liver, kidneys, spleen,
blood, and others, are shown to have similar properties in response to ultrasound
waves[39]. In contrast, the transmittance of ultrasound through air is extremely low,
causing complete reflection. Due to its stiffness and density, bone tends to be the
strongest reflector produced by the body, causing a shadow effect, and restricting the
imaging of features behind it.
Different transducer wands (Table 2.1) are available for medical use, with higher
frequency wands producing higher resolution images, down to a fraction of a
millimeter, but limiting depth in response. With respect to current catheter insertion
techniques, the highest frequency wand would be used, limiting depth to below a few
centimeters, and allowing high resolution targeting of veins and arteries.

17
Table 2.1: Common types of medical ultrasound transducers provided by Philips
Healthcare and Supersonic Imagine.
2.2.1 B-Mode imaging
B-mode imaging is the most common form of ultrasound, producing real time images
of the body. Produced by the application of a piezoelectric transducer onto the
patient’s skin, in order to generate pulsed ultrasound waves. These mechanical waves
will then travel through the body, reflecting and scattering along the way, generating
echoes that are then picked up by the same transducer. These echoes are then

18
reconverted into energy by the piezoelectric and form a digital image of the tissues
affected [10].
2.2.2 Doppler imaging
Doppler imaging adds calculations onto B-mode, tracking particle movement during
imaging, and allowing for the false coloring of blood flow in real time. This imaging
takes into the account the shift in frequency generated by moving blood cells, known
as the Doppler effect, and calculates the velocity of the cells[11]. Results are helpful
for imaging blood flow rate and determining pressure as seen in Figure 2.3.
2.2.3 Shear-Wave Elastography
Shear-Wave is an analytical form of B-mode, using calculation software to track
twinkle artifacts in tissue as ultrasound waves attenuate. Stiffer tissues will be false
colored red due to increased shear-wave travel, while softer tissue is colored blue.
Due to its computational nature, this type of imaging requires increased scanning
times, as the software needs time to adjust to the region being imaged[40]. An
emerging technique, that is not currently available to all hospitals, due to requiring
newer ultrasound machines, this form of imaging has shown promise for increased
characterization of tissues but is not yet fully used in practice [41, 42].

19
Figure 2.3: B-Mode Ultrasound Image at 20-6 MHz range, representing the various
layers of tissue within an arm, with red arrows marking the vein walls (A). Doppler
image accurately represents the blood flow inside the vein (B).
2.2.4 Microparticle Twinkle Theory
Early research into ultrasound detection techniques for microcalcifications formed by
the early stages of breast cancer have shown promise. Microcalcifications below 200
µm have been shown to produce micro-oscillation when subjected to medical
ultrasound frequencies (2-15MHz), making them trackable under doppler
imaging[43, 44]. Recent work into these interactions showed a more comprehensive
study of properties that cause the oscillation. The dominant factor for oscillation was
found to be the viscoelasticity of tissue surrounding the particles, as the lower
viscoelastic tissue mimic showed increased signal intensity from the particles[45].
While further studies showed increased twinkle artifact due to microbubbles attached
to microparticle surfaces. This phenomenon proved difficult to track as the bubbles
would disappear after ultrasound was applied[46].

20
While research into twinkle artifacts from microparticles has been researched,
particles were designed to be widely spaced from each other, and only individual
harmonic vibrations were researched, echoes due to multiple microparticles may
further impact signal to noise ratio, if distances between particles meet certain
criteria. 1. If particle distance is smaller than a transducer’s beam width, echoes
created by individual particles will be indistinguishable, and the generated image
will show the particles as a single entity[10, 47]. 2. The entity’s generated contrast will
be calculated by the distance between the particles, as produced echoes interfere
with each other either constructively or destructively (Figure 2.4).
Figure 2.4: Schematic showing axial resolution and its dependence on particle
distance[47].

21
2.3 Filler Particle Application on Polymers
While adding microparticles into a polymer is experimentally simple, the effect of
adding these particles must be thoroughly researched. Due to the intended
application being catheters, composites must remain flexible and conserve their high
tensile strength. Microparticle addition into polymers has been widely researched,
up to 30 wt% addition of particles is common practice in industry, in order to reduce
costs while significantly increasing mechanical properties[48]. The main factors to
consider for the impact towards composite properties are the filler’s size and shape,
concentration, and dispersion within the matrix[49].
Most notably, research into the mechanical effect of inclusion of glass microparticles
into a polypropylene composite showed increased effects due to poor coupling
between filler and matrix. Spherical glass microparticles were found to be the least
effective reinforcement, as their overall surface area contact with the matrix was
minimal[49]. Poor adhesion was theorized to lead to the matrix being unable to
effectively transfer stress onto the particle, leading to ineffective strengthening of the
composite. Adding a coupling agent to the surface of the glass particles increased
attachment, leading to an increase in tensile strength[50]. Likewise, microparticles
with roughened surfaces would have increased surface area, thus increasing surface
area interaction to the polymer, resulting in increased attachment and tensile
strength. In regard to ultrasound, poor attachment between materials may lead to void
space between the interphases, leading to decreased ultrasound travel efficiency,
ultimately resulting in a shadow effect as ultrasounds are attenuated.

22
Young’s modulus has been shown to increase with addition of glass particles, while
tensile, yield strength and stress decreased as filler concentration increased [51]. This
was seen as being due to the poor adhesion between filler and matrix causing a
phenomena in which the polymer is seen as being filled with voids[51]. Increased
filler loading led to increased stiffness. In addition, particles <1 µm have been shown
to increase mechanical properties, as distance between particles decreased or
concentration increased[52].
2.4 Biocompatible Glass Particles
Biocompatible glass ceramics have been widely researched for their possible use as
bone replacements or dental replacements[53-55]. Due to their compositions, these
composites have the ability to stimulate bone regeneration, as cells attach to their
surface and absorb their components. Depending on the composition, glass ceramics
could be considered bioactive, bioinert, or bioresorbable[56]. Poor attachment of
particles in the polymer matrix may cause the release of surface particles into the
bloodstream thus leading to complications, however, particles may be designed to
dissolve over time to avoid these complications. Particles with primary makeup of
phosphorus have been used in order to ensure degradation inside the body over time
if dislodged[57, 58]. While primarily designed to act as a bone scaffold, researchers
found that a high composition of phosphorous would form particles with rapid
degradation [57]. On the other hand, increase in the titanium content would
exponentially decrease their degradation rate [57]. Particles surrounded by polymer

23
material would be safeguarded from degradation, while those exposed to body fluids
would dissolve
2.5 Soft Tissue Ultrasound Phantoms
Accurate testing of microparticle effects under ultrasound comes with some
challenges. Twinkle artifact studies have used microparticles suspended in a block of
dissolved poly(vinyl alcohol) hydrogel (PVA-H) [43]. This medium is a poor
representation of what would be seen for PICC insertion, as it lacks the interface
interactions between skin, fat, muscle, connective tissues, vein, and blood (Figure
2.3). These types of materials, lacking echogenic interactions, are known as
echolucent [59]. Testing of samples would therefore require customized body
phantoms, in order to provide the most accurate representation of particle effects
towards a sample’s echogenicity. Samples are required to be tested inside a medium,
such as gelatin or PVA-H, as the ultrasound must be done in depths above 10 mm. Use
of phantoms made solely of echolucent material would give an inaccurate image, as
the natural attenuation of soft tissue would be missing, thus a secondary additive must
be included. Furthermore, a commercial grade phantom that could be reusable would
prove to be quite expensive in the long run, as the insertion and removal of samples
would cause wear and over time make the phantom inaccurate due trapped air. While
commercial grade phantoms are sold, they are mainly for use in ultrasound trainings,
and not fit for ultrasound research. Instead, various phantom recipes have been
published and shared by those performing ultrasound research [60-63].

24
Homemade phantoms are easily customizable by using both echogenic and
echolucent materials to create a simulated scenario, such as mimicking cysts, bones,
or arteries[63]. Fabricated mainly from food-grade materials, homemade phantoms
are intended for short term use, making them optimal for testing of samples that are
intended to be characterized before and after ultrasound testing. Time consuming,
standardizing a method for replicate fabrication of samples would assist in decreasing
sample variation for ultrasound signal to noise ratio analysis. A popular option, a
gelatin-psyllium husk model has been preferred, as it may approximate the
echogenic attenuation in real life environments, as opposed to commercial phantoms
with low echogenicity[64, 65].
25
Chapter 3
Fabrication and Characterization of Polyurethane &
Microparticle Composites
3.1 Abstract
Patients with peripherally inserted central catheters (PICCs) are routinely
discharged with the catheters in place. PICCs, only capable of being tracked
through X-ray imaging, will routinely experience complications due to thrombosis
or accidental dislodgement from poor at-home care. Catheters with the capability to
be tracked without the need of X-ray imaging would greatly benefit the ill and
elderly, providing decreased stress to the patients and increased nursing home
capabilities. This project seeks to develop the field of real-time ultrasound tracking
of polymeric medical devices, through incorporation of echogenic microparticles
into a catheter, to produce bulk echogenic effects. We analyzed the impact to elastic
modulus, ultrasound contrast, and biocompatible properties of the polymer as
increased amounts of glass microparticles were incorporated. The elastic modulus
was found to remain constant, up to a 10 wt% loading of particles. Ultrasound
imaging of samples embedded in a soft tissue mimic revealed a significant increase
in signal to noise ratio at 5 wt% loading compared to polymer alone. Cytotoxicity
studies demonstrated insignificant impact from the raw material’s biocompatibility
post extrusion. Preliminary results have shown successful increase in a polymer’s
echogenic properties, without undermining its mechanical and biocompatible
properties.

26
3.2 Background
Peripherally Inserted Central Catheters (PICC) are thin, flexible tubes that are
inserted into a vein in the upper arm and, typically, guided (or threaded) into a large
vein above the right side of the heart called the superior vena cava. They are normally
used to give intravenous fluids, blood transfusions, chemotherapy, and other drugs.
The patients most likely to be selected for PICC implantation are those whose
intravenous access has become difficult, such as geriatric patients discharged to
nursing facilities, and where the placement would offer a long-term method for
continuous drug and nutrient delivery [1, 2]. Today, in clinical practice, it is
recommended that the Seldinger placement technique should be combined with
ultrasound imaging to quickly insert catheters and ensure correct anatomical
placement [15]. The Seldinger technique involves locating a viable insertion blood
vessel for the PICC, and slowly advancing the device through the length of the vein
until reaching its intended destination in the superior vena cava or right atrium. If the
patient is in the radiology department, the most common approach is to guide the
catheter in real time with continuous fluoroscopy. If not in radiology, an experienced
nurse blindly maneuvers the device into the approximate area at bedside, without the
use of any imaging, followed by confirming the position through fluoroscopy or X-ray
at a later time [5]. Therefore, a significant factor that dictates the success of the
placement is the experience of those inserting the device. However, as
malpositioning is reported in 10% to 85% of insertions [3, 4, 6, 7], there has been a
push towards establishing specialized catheter placement teams for bedside
insertions [66]. Additionally, movement of catheters can lead to malposition of the

27
device during treatment, which then leads to further complications [19]. Any
malposition of catheters, either on insertion or during use, requires either
repositioning through radiology or replacement of the catheters, leading to increased
patients X-ray exposure and cost to the healthcare provider. This increased exposure
to X-ray radiation could lead to detrimental effects later in life for those undergoing
catheter placements at an early age, increasing their risks to cancer whilst it places
additional stress on the systems of geriatric patients [20, 21]. Thus there is a real need
for a secondary imaging modality, which would offer the ability to effectively track
devices at bedside, without the need for X-ray fluoroscopy confirmation.
Consequently, reducing replacement rates for fluoroscopy tracking of catheters is
a current focus of much research across a number of disciplines [25-29], with several
papers being published in the last five years detailing the methods to fabricate or
modify catheters for various imaging modalities. One such method relies on the
attachment of gas filled microparticles onto the surface of catheters, the resulting
composite material relies on the interaction of such voided particles with the incident
ultrasound energy to produce ultrasound contrast [27, 28]. Contrast is seen as the
difference in an image’s gray levels between object and background, where high
contrast would refer to an object having significantly higher gray level than the
background[11]. Similarly, early research into using ultrasound detection techniques
to detect microcalcifications by Liu et al., formed by the early stages of breast cancer,
have shown promise [43, 45]. This work builds upon Liu et al’s research, which
demonstrated that microcalcifications’ (Ø<200 µm) had the capability to produce
micro-oscillations when subjected to medical ultrasound frequencies (2-15 MHz),

28
making them trackable under doppler imaging [43, 44]. Typically, devices such as
PICCs, are composed of silicone or polyurethane, which are polymers exhibiting
lower densities than those of human soft tissue. Under B-mode ultrasound imaging,
which uses the reflection and refraction interactions of sound waves through tissues
of varying density and stiffness in order to form an image, a device with similar density
to soft tissue would be un-differentiable from its surroundings [9]. Therefore,
increasing the device’s echogenic properties by altering the material properties of
the catheter’s matrix material, would require the increase of density or stiffness of the
device, which would negatively affect their primary function as flexible catheters. For
ultrasound, a common artifact occurs when imaging bone, with a high stiffness,
resulting in complete reflection of the ultrasound signal, causing a shadow effect
below the bone. This shadow prevents imaging of the tissue lying behind the
bone[10]. Any modifications to the material would need to have minimal impact upon
the flexibility, overall density, and cytocompatibility of the overall composite.
Therefore, we proposed the use of microparticles that are already known to be
echogenic, where they would be introduced into the composite as a filler material that
will create devices with bulk echogenicity, whilst minimizing any deleterious
mechanical properties. It has been reported that, in order for a successful reflection
to occur at medical wavelengths between different density materials in ultrasound
imaging, the particle sizes must be larger than micron scale [10, 11]. Thus, our
approach proposed to use particles, matching the minimal requirements for
ultrasound interactions, and introduce them into a polymer matrix until an echogenic
effect was produced.

29
3.3 Materials and Methods
3.3.1 Materials
Texin RxT90A Polyurethane, a previously studied bioinert thermoplastic (TPU) with
softening point of 180 ˚C and degradation point around 283 ˚C[25], was purchased
from Covestro (Pittsburgh, PA), and used as the preliminary polymer. Glass ceramic
microparticles composed mainly of phosphate were provided by collaborators at the
University of Nottingham[57]. NIH mouse 3T3 fibroblast cells, purchased from ATCC
(Manassas, VA), were used for biocompatibility studies. Minimum essential media
(Gibco™ MEM α) and Dubelcco’s phosphate buffered saline 1x (PBS, pH 7.4) were
purchased from Fischer Scientific (Pittsburgh, PA). CellTiter 96® AQueous One
Solution (MTS Assay) was purchased from Promega Corporation (Madison, WI).
Reagent Gelatin 175 Bloom was provided as a gift from Vyse Gelatin Company
(Schiller Park, IL), while psyllium husk (Sugar free Metamucil™) and latex Penrose
drains were purchased from Amazon. Red Rubber Latex Intermittent 10French
Catheter was purchased from Teleflex Incorporated (Wayne, PA).

30
3.3.2 Gas pycnometer (density) testing
Bulk density of particles and polyurethane were tested using a gas pycnometer[67].
Theoretical density of composites was determined through the density equation (Eq
1)[68].
Eq 1. Where 𝑊𝑓 is the weight fraction of each component, while 𝜌 corresponds to the
component’s density[68].
3.3.3 Polyurethane preparation
Pellet polyurethane was cryoground in order to further reduce the size of the
polyurethane. Pellets were melt pressed at 190 ˚C with 15-ton force for two minutes
using a 20-ton hot press (PHI Manual Compression Press), resulting in a 1 mm thick
thin film, which was then sectioned into 5 mm squares and cryoground for three five-
minute segments, with a two-minute cool down in-between.
3.3.4 Particle Measurements (ESEM)
Glass particle sizes were determined under environmental scanning electron
microscopy (FEI Quanta 600 FEG, Hillsboro, OR). Particles were attached to carbon
𝝆theoretical = 1 (𝑊𝑓1𝜌1
+𝑊𝑓2𝜌2
)⁄

31
tape while loose particles were removed by compressed air, and sputter coated with
5 nm of iridium (LEICA EM ACE600). Secondary emission imaging was used to study
the surface and morphology of particles, while backscatter imaging allowed for ease
of tracking of particles. Sizing of particles was determined using two backscatter and
secondary emission images processed through ImageJ software, with particle counts
of 248 and 629.
3.3.5 Twin-screw extrusion procedure
Extrusion of hollow tube samples was achieved through use of a Haake Minilab Micro
Compounder and custom 3 mm die as described [25]. Ground polyurethane and
particles were weighed and premixed before being introduced to the extruder. The
extruder was preheated to 195 ˚C and screw speed set to 40 rpm. Polyurethane
powder was slowly poured in, allowing for slow melt of the powder at low speeds,
while keeping pressure low. Screw speed was steadily increased up to 100 rpm,
commencing the extrusion of material. A heat gun was used to apply heat to the exit
point, delaying polymer solidification as it was exposed to room temperature. A
continuous hollow tube was extruded, allowed to reach 10 cm in length, before rpm
was decreased and the polyurethane-glass mixture was introduced into the extruder.
Screw speed and sample loading was kept around 40 rpm, during composite sample
extrusion, to give the polyurethane time to melt and avoid crushing the particles.
Polyurethane without particles was used as a control throughout the experiments.

32
Extruded composites with and without particles were sectioned into 1 cm lengths, and
then freeze-fractured, to avoid breaking of particles. Fractured sections were allowed
to warm to room temperature, before being attached to carbon tape and sputter
coated with 7 nm iridium. Backscatter imaging allowed for analysis of particle
distribution in the polyurethane, while secondary emission imaging showed surface
morphology of samples. Fluorescent coated particles served as early confirmation for
particle distribution post extrusion (Appendix).
Composite thin films were produced from extruded samples, to test accurate
representation of particle distribution in extrusions. A 20-ton hot press was used in
order to hot melt and flatten extrusion pieces into films. The press was preheated to
195 ˚C, before extrusions were loaded, allowed to heat slowly, and then slowly
pressed to 1-ton force. Flattened, films were removed and slowly cooled to room
temperature. Films were then sectioned into dog bone shapes for use in dynamic
mechanical analysis (DMA).
3.3.6 Dynamic mechanical analysis (DMA) of films
DMA was conducted at room temperature, through use of a TA Instruments Dynamic
Mechanical Analyzer Q800. Thin films were tested in tension, at a ramp rate of 3
N/min, to a maximum load of 18 N. Samples (n = 3) of pure TPU, 3wt% loading, 5wt%
loading, and 10wt% loading underwent testing. Dog bone shaped films were imaged
before and after tensile testing, using an inverted microscope (Olympus IX71), to
study the impact toward matrix-filler morphology that may occur due to applied
33
stresses. Young’s modulus was obtained through plotting of tensile test stress/strain
data, limiting plotting to 10% strain. The young’s modulus was determined as the rate
of change of the plots best fit line.
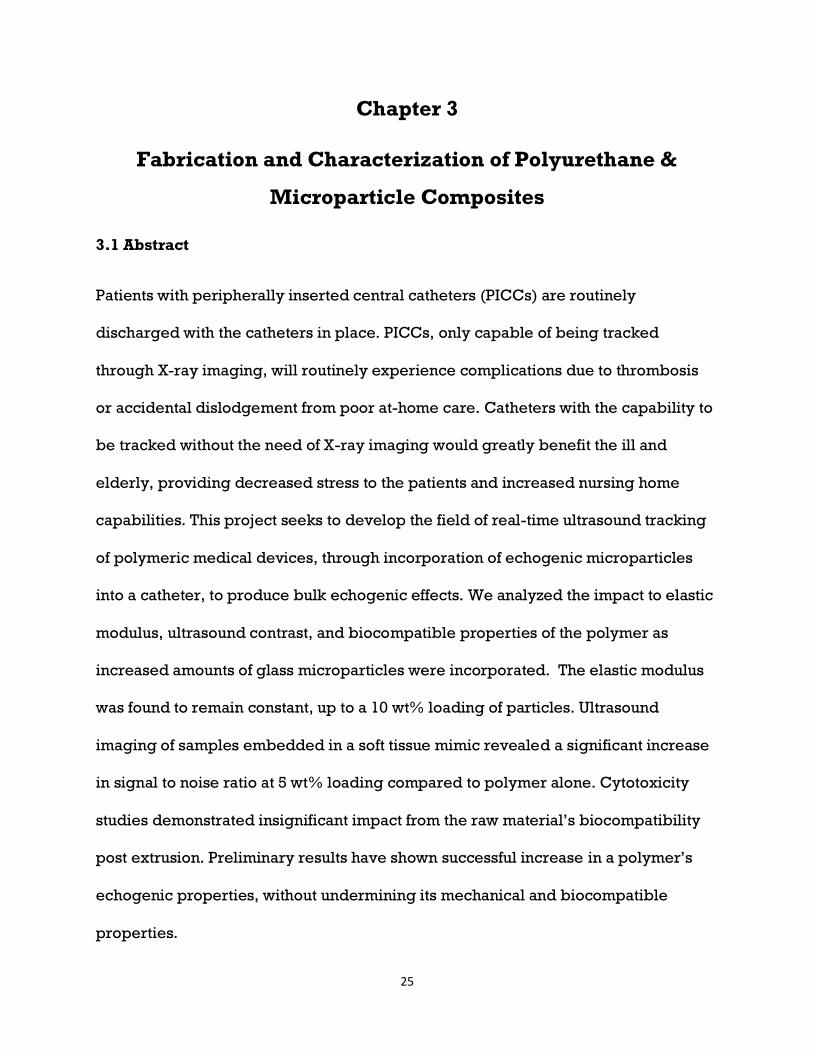
Figure 3.1: (A) Gelatin-Metamucil soft tissue phantom, 9 cm in width, 11 cm in length,
5 cm in height. (B) Representation of sample placements inside soft tissue phantom.
Gelatin-Psyllium mix colored in orange, Penrose drains colored white, and extrusions
colored blue. (C) Cross section view, showing the expected ultrasound image.
3.3.7 Soft tissue phantom production
Soft tissue phantoms (Figure 3.1) were fabricated the day before ultrasound sessions,
relying on a common phantom recipe with slight modifications, while using penrose
drains as artery mimics [62]. Extruded samples were placed inside the tubing, room
temperature deionized (dI) water was added, with any bubbles being removed
before tubing was tied. Metal wire was attached to the knotted ends of the artery

34
mimics, allowing for samples to be held in place inside a rectangular mold. Psyllium
husk was sieved through a 212 µm filter and lightly ground with a pestle and mortar,
to remove any clumps of powder. Gelatin was weighed out at a ratio of 1 g gelatin per
10 mL of 50 ˚C dI water, while psyllium husk was weighed at a ratio of 1 g per 20 g
water and gelatin. Weighed powders were homogeneously mixed before mixing into
a beaker of preheated dI water at 50 ˚C, and the solution filtered through wire mesh
to remove clumping. The mixture was placed into a preheated 50 ˚C vacuum oven
(Isotemp Vacuum Oven 280A, Fisher Scientific) and vacuumed at -25 Hg for 20 minutes
to remove large air bubbles. Once bubbles were no longer noticeable below the
surface, pressure was released, and the mixture poured into the rectangular mold.
The filled mold was vacuumed once more, before being covered with parafilm and
placed inside a refrigerator to set overnight. After refrigeration, samples would be
located between 2 to 3cm in depth.
3.3.8 Ultrasound imaging procedure
Ultrasound imaging was conducted with use of two medical ultrasound machines
(Philips iU22 Ultrasound and Aixplorer Multiwave Supersonic Imagine) and four
ultrasound transducers. Three different transducers were investigated: 1. broadband
wand (Philips C8-5 Broadband), for deep abdominal imaging capabilities but low
resolution; 2. linear array wands (Philips L12-5 Linear array and SL18-5), for shallow
imaging but high resolution; and 3. SuperLinear array (SLH20-6) for vascular imaging.
35
A commercial body phantom was imaged first, in order to calibrate the transducers to
appropriate gain settings, before imaging the samples.
Once captured, ultrasound images were analyzed using Andor Solis (Oxford
Instruments) imaging software. Regions of interest were defined inside the artery
mimic, kept at a constant size throughout all samples, and the Signal to Noise ratio
calculated as the average of three defined regions.
3.3.9 Statistical analysis
Each test described were repeated multiple times and the data reported as the mean
± standard deviation. Statistical analysis was done through single factor Anova, with
a defined alpha value of 0.05.
3.4 Results and Discussion
Three studies have been conducted to obtain preliminary data for this project. The
first study involved the fabrication and characterization of extruded samples with
varying weight% loadings. Specifically, loadings of 1wt%, 3wt%, and 5wt% were
used to contrast against a pure polyurethane control. Extrusions were characterized
for their particle distribution, tensile properties, and echogenic properties. While
particle and polyurethane biocompatibility have been tested previously[25, 57], a
secondary analysis was used to test for impacts to properties due to the extrusion

36
process. These results would encompass our goals for Aim 1 (Section 1.3.1). The next
set of studies would center around fabrication of
3.4.1 Particle characterization
Fabricated by the University of Nottingham, phosphate particles were characterized
before usage. Preliminary scanning electron microscopy (Figure 3.2) showed
average particle morphology to be spherical, while further energy dispersive X-ray
spectroscopy (EDS) showed the chemical makeup of the particles to be composed of
phosphorus, magnesium, sodium, calcium, and oxygen (Table 3.1). Thermal
gravimetric analysis (TGA) (Figure 3.3) demonstrated no signs of thermal
degradation up to 450 ˚C, matching similar results shown in literature [57].
Figure 3.2: Scanning electron microscope image used for particle sizing, as well as
to determine chemical composition through energy dispersive X-ray spectroscopy.
Secondary electron imaging done under 5 kV and 200x magnification. Scale bar
represents 200 m.
37
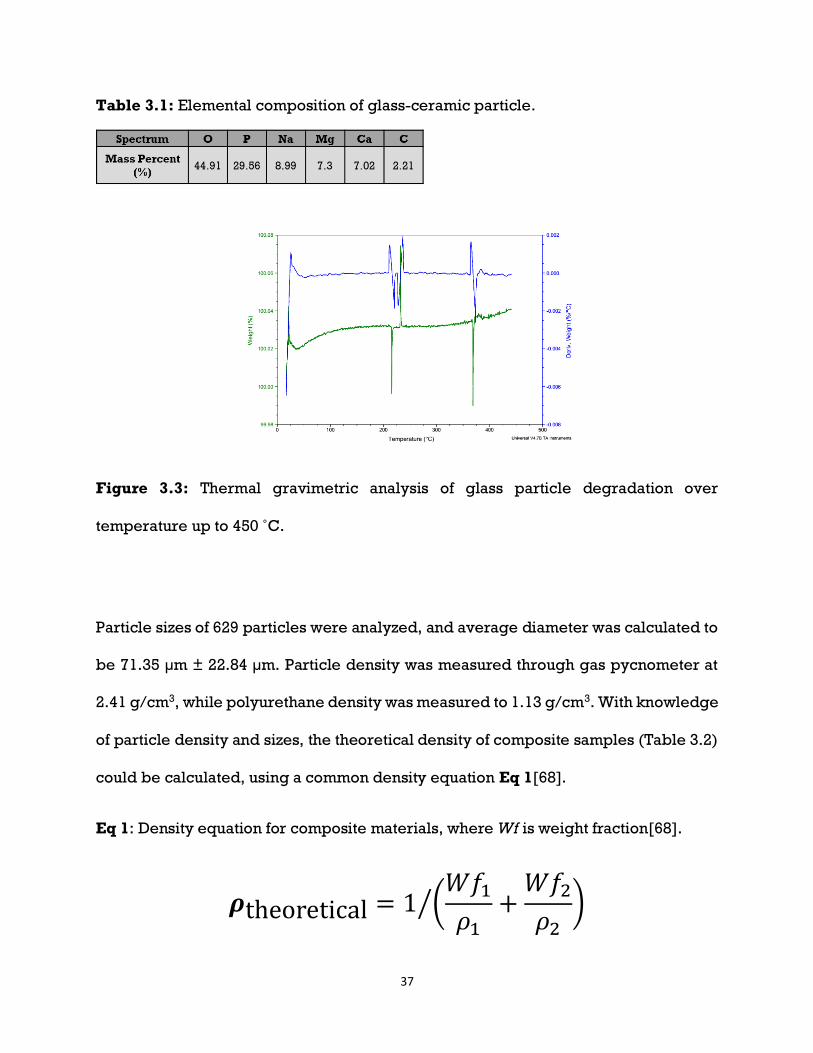
Table 3.1: Elemental composition of glass-ceramic particle.
Figure 3.3: Thermal gravimetric analysis of glass particle degradation over
temperature up to 450 ˚C.
Particle sizes of 629 particles were analyzed, and average diameter was calculated to
be 71.35 µm ± 22.84 µm. Particle density was measured through gas pycnometer at
2.41 g/cm3, while polyurethane density was measured to 1.13 g/cm3. With knowledge
of particle density and sizes, the theoretical density of composite samples (Table 3.2)
could be calculated, using a common density equation Eq 1[68].
Eq 1: Density equation for composite materials, where Wf is weight fraction[68].
𝝆theoretical = 1 (𝑊𝑓1𝜌1
+𝑊𝑓2𝜌2
)⁄

38
Table 3.2: Theoretical bulk density of composite samples as filler loading
increased. Significant increase (*, α<0.05) in density is seen at 10wt% loading of
particles.
3.4.2 Twin Screw Extrusion Procedure
Various issues arose in preliminary extrusion procedures for composites. As our
thermoplastic polyurethane is sold in pellet form, initial procedures would rely on
mixing pellets with microparticles and pouring directly into the preheated extruder.
Force from the twin-screws would force pellets to crush glass particles before melting
could commence (Figure 3.4 A). Switching from pellet polyurethane to ground
powder allowed for effective premixing of polyurethane and particles, and decreased
particle breakage.

39
Figure 3.4: Backscatter ESEM images of common extrusion defects. (A) Cross section
of an extruded sample after cryofracture, showing fractured particles. (B) Inner lumen
of an extrusion after blade sectioning, showing shear marks. (C) Extrusion sample
after sectioning, showing air pockets within the wall.
Attempts to fabricate thinner extrusions through the common procedure of simply
adding a secondary force, converting the procedure into pultrusion, led to further
issues [69]. Simply forcing premixed powders too quickly through the extruder would
trap air within the molten polymer, producing voids within the extrusion walls (Figure
3.4 B). Next, in the case of premixed compound that had been correctly loaded into
the extruder, a pulling force could be added after extrusion, to decrease the diameter
of still molten extrusion. Issues arose when the extruded part was not completely
molten, and the force caused shearing of the polymer to occur, producing shear marks
in the inner layer of the extrusion (Figure 3.4 C). Of these three possible defects, two
of them are prone to cause critical failure for our purposes. The first, shattering of the
particles before extrusion, would lead to decreased dense targets for the ultrasound
to interact with; while the second, production of voids within the extrusion walls, could
lead to complete reflection of the ultrasound waves by the extrusion. Shear marks
(yellow rectangle) within the inner lumen would pose issues to overall extrusion

40
biocompatibility, as the rough surface would be prone to bacterial attachment,
ultimately leading to catheter clogging. Optimal samples would show minimal signs
of particle fracture, have no voids between particles and polymer, and no shear marks
(Figure 3.5).
Abandoning the use of pultrusion, extrusions were limited to a maximum of 20 cm in
length, in order to minimize change in sample diameter; screw rotation speed
reduced to 40 rpm during powder loading, to further decrease possibility of particle
breakage and assure complete polymer melting; and machine pressure monitored
for changes in order to seize loading if a change was noticed, to decrease possibility
of trapped air by overloading of powder.
Figure 3.5: Backscatter ESEM images of an optimal extrusion sample. (A) Cross
section and (B) lengthwise views of the sample after cryofracture, showing intact
particles without agglomeration.

41
3.4.3 Tensile testing of films
Due to their spherical nature minimizing surface area, particles were not hypothesized
to contribute to the composite’s tensile strength, while their smooth surface was
hypothesized to create poor adhesion to the matrix (Section 2.4). Results showed no
significant differences between elastic modulus’s up to 10% strain (alpha = 0.05)
(Table 3.3). Ultimate tensile strength could not be found, as the films did not reach
fracture point (Figure 3.6).
Table 3.3: Elastic Modulus determined by DMA. Average reported with ± standard
deviation (n=3).
Sample AVG Elastic Modulus (MPa)
Polyurethane 0.21 ± 0.02
5wt% P40 0.22 ± 0.01
10wt% P40 0.22 ± 0.01

42
Figure 3.6: Representative stress-strain plot of pure polyurethane, 5wt%, and 10%
composite films.
3.4.4 Microscopy before and after tensile test
Films imaged before tensile testing showed no distinguishing features between
particles and polymer (Figure 3.7 A). Films imaged after tensile testing exhibited
noticeable fracture (Figure 3.7 B C) and de-adhesion points (Figure 3.7 D) around
particles. While elastic modulus and tensile strength were not significantly altered,
creation of voids within the composite would lead to critical issues with sample
echogenicity.

43
Figure 3.7: Representative thin film composite sample of 10wt% loading at 5x
magnification, before (A) and after (B) DMA testing. (C) Close up view of polymer
fracture around particle at 20x magnification. (D) Detachment of polymer from
particle surface.
3.4.5 Ultrasound imaging procedure
Use of a 12 MHz transistor gave accurate representation of samples under clinical
settings, allowing for direct comparison between each sample. Ultrasounds of
extrusions under 12 MHz imaging, comparing between the expected image (Figure

44
3.1 B), Red RubberTM control (Figure 3.8 A), and polyurethane control (Figure 3.8
B). Both controls showed similar morphologies, where white lines appeared for each
lumen wall, with a black interior. White lines were expected, as the ultrasound
signal moved from soft tissue to the less dense dI H2O, and back to the greater
density polyurethane. Samples with 1wt% loading (Figure 3.9 A-C), showed signs of
bright points appearing within the lumen walls. Samples with 3wt% loading showed
further coverage of bright spots within the extrusions (Figure 3.9 D-F). Samples
with 5wt% loading showed almost complete coverage of white spots, leading to the
conclusion of the white spots being a direct result from introduction of particles into
the polymer (Figure 3.9 G-I). Similar results were found with use of an 8 MHz
transducer, primarily used for deeper abdominal imaging, with low image
resolution (Figure 3.10).
Figure 3.8: B-Mode images of composite extrusions within Penrose drain’s filled with
DI water, submerged in soft tissue phantom. (A) Red RubberTM catheter and (B) pure
polyurethane extrusion acting as control samples. Scale bar represents 10 mm.
Frequency 42Hz, Gain 94%.

45
Figure 3.9: B-Mode images of composite extrusions within Penrose drain’s filled with
DI water, submerged in soft tissue phantom. 1wt% Loading samples of p40 particles
(A,B,C), 3wt% loading samples (D,E,F), and 5wt% loading samples (G,H,I) under 12
MHz Transducer. Scale bar represents 10 mm. Frequency 42Hz, Gain 84%.

46
Figure 3.10: B-Mode images of composite extrusions within Penrose drain’s filled
with DI water, submerged in soft tissue phantom. 1wt% Loading samples of P40
particles (A,B,C), 3wt% loading samples (D,E,F), and 5wt% loading samples (G,H,I)
under 8 MHz Transducer. Scale bar represents 10 mm. Frequency 59Hz, Gain 54%.
3.4.6 Ultrasound analysis
Three regions of interests were chosen inside each sample (Figure 3.11), and their
Signal to Noise ratios (SNR) calculated (Figure 3.12). Results showed significant
increase in SNR comparing between PU and 5wt% samples, while both 3wt% and
5wt% SNR were significantly increased when compared to Red RubberTM catheter.

47
Figure 3.11: Example ultrasound image under B-mode, showing the regions of
interests defined in the Andor Solis program. Three regions of interests (1, 2, 3) were
used for Signal to Noise analysis.

48
Figure 3.12: Signal to Noise ratios for Red Rubber catheter, pure polyurethane, 1wt%,
3wt%, and 5wt% composites (n=3). Significant differences were found between 5wt%
and Red rubber, Polyurethane, and 1wt% samples. While 3wt% samples were found
to be significantly different to only Red rubber.
3.4.7 B-Mode
Comparisons between optimal samples and defective samples containing similar
particle loadings brought forth critical issues from processing mistakes. An extruded
sample of 5wt% loading, containing voids inside the extrusion walls (Figure 3.13 B),
showed similar echogenicity when compared to an optimal sample (Figure 3.13 A),
but had added effect of complete reflection of ultrasound signal, creating a shadow
below itself. Theoretically, tracking of such a catheter would be trivial, as the dark
shadow would be a clear sign. In exchange for improved tracking, body morphology

49
that may lie below the sample would be shadowed and become unimageable, posing
the risk of unseen complications. As these catheters require imaging under depth, this
type of defect would only be noticed after catheter insertion, and would need possible
replacement of the catheter, leading to increased discomfort to the patient as they are
re-catheterized.
Figure 3.13: B-Mode image of a 5wt% composite sample (A), compared to a 5wt%
sample with void defects (B). Frequency 42Hz, Gain 84% (A) & 54% (B).
3.5 Conclusion
Preliminary results demonstrate the viability of introducing echogenic filler particles
into current polyurethane catheters, in order to increase the devices bulk echogenic
capabilities. Loadings of 5 wt% microparticles, with an average diameter of 71.35 µm,
resulted in the largest increase to the sample’s signal to noise ratio, with a 21%
increase when compared to the polyurethane control. This was demonstrated to

50
provide a significant impact to levels of contrast achieved between soft tissue mimic
and the catheter. This difference can be detected during real-time imaging, and with
relatively low intensities of ultrasound so improving a health professional’s chances
of successfully placing a catheter without the use of X-ray imaging and using point of
care devices.

51
Chapter 4
Fabrication & Characterization of Silicone Composites
4.1 Background
There is often a need to visualize medical devices in-situ through ultrasound.
However, some devices prove to be a challenge in visualizing both the device and
surrounding anatomy. Specifically, peripherally inserted central catheters are not
easily imaged in neonatal patients which often requires the use of hand-held or
bedside ultrasound devices[5, 32]. These venous catheters are typically made from
either thermoplastic polyurethane or silicone. We seek to prove our theory that thinly
walled medical devices, such as catheters, may be made echogenic by the addition
of denser microparticles through use of Dow Corning’s C6-135 thermoset Silicone [70,
71]. In our previous study, a thermoplastic polyurethane was used as the matrix
polymer, with a durometer hardness rating of 90A and specific gravity of 1.13 g/cm3
[72]. Results demonstrated significant increase in signal-to-noise ratio as
microparticle loading increased, with 5wt% loading found to be the optimal. A recent
study has pointed toward tissue movement as being the dominant factor for
microparticle vibration in phantoms [45], thus, by reducing the hardness of our
material, we theorized greater flexibility for microparticles to interact with the
ultrasound waves, theoretically allowing particles greater freedom of movement,
increasing the sample’s ultrasound signal-to-noise ratio.
52
The aim for this study was to demonstrate transfer of our ultrasound enhancement
work, from thermoplastic polyurethane to thermoset silicone, thus increasing its
potential application and implementation. Employing the same phosphate based
microparticles (d = 71.4 ± 22.8 µm) as previously used, samples of 1 wt%, 3 wt%, 5
wt%, and 10 wt% were tested. Additionally, silica microparticles of similar size (d =
59.5 ±10.6 µm) were used to create a 5 wt% sample, as a means of comparing results
between custom fabricated particles to the smaller particles available in the market.
4.2 Materials and Methods
4.2.1 Materials
C6-135 Silicone two-part elastomer was purchased from DOW Corning (Cerritos, CA)
with a durometer hardness rating of 50A. Glass ceramic microparticles composed
mainly of phosphate (P40), with average diameters of 71.4 ± 22.8 µm, were custom
made as previously described [57]. Reagent Gelatin 175 Bloom was provided as a gift
from Vyse Gelatin Company (Schiller Park, IL), while psyllium husk (Proctor &
Gamble, Cincinnati, OH) and latex Penrose drains were purchased from Amazon.
Pediatric 4 Vessel Ultrasound Training Block Model (Blue Phantom) was purchased
from CAE Healthcare (Sarasota, FL). Silica microparticles, with average diameters of
59.5 ±10.6 µm, were purchased from Sigma Aldrich (St. Louis, MO).

53
4.2.2 General Procedure used for fabrication
Silicone part A and B were measured out separately, at a 1:1 ratio for a total mass of
five grams. Phosphate particles were weighed and introduced to Silicone part A,
achieving mixing through repeated folding and pressing, before being mixed with
Part B. The final mixture was sectioned, pressed into a steel sample mold, and cured
inside a 120 °C furnace for 1 hr. Resultant samples measured 2.75 mm in thickness.
4.2.3 General Procedure used for sample density and tensile testing
Sample densities were determined through use of an Archimedes density kit (Mettler
Toledo), employing 200 proof ethanol as the submersion liquid. Samples of 3 mm
width, 2.75 mm thickness, and 30 mm length, composed of pure Silicone, 1 wt%, 3
wt%, 5 wt%, and 10 wt% with phosphate glass and 5 wt % silica (n = 3 each) underwent
testing.
Dog bone shaped samples (30 mm length) were produced from compression molding
and used for both density and tensile testing. Young’s modulus was analyzed through
tensile testing of samples in an Instron ElectroPulsTM E1000 (Norwood, MA), at a ramp
rate of 5 mm/sec until failure. Samples of pure Silicone, 1 wt%, 3 wt%, 5 wt%, and 10
wt% with phosphate glass and 5 wt % silica underwent testing in duplicate. Young’s
modulus was obtained through plotting of tensile stress/strain data, up to 40% strain.
The Young’s modulus was determined as the rate of change of the plots best fit line.

54
4.2.4 General Procedure used for Soft tissue phantom, Ultrasound Imaging, and
Signal-to-Noise analysis
Gelatin soft tissue mimics were fabricated the day before ultrasound sessions, relying
on a common phantom recipe with slight modifications, using Penrose drains as artery
mimics [62]. Molded samples were placed inside tubing and deionized (dI) water was
added inside the tubing, being careful to remove any bubbles before tying the ends.
Tied artery mimics were held in place by metal wire inside a rectangular mold.
Resulting phantoms were 9 cm in width, 12 cm in length, and 4 cm in height, with six
samples evenly dispersed within each mimic.
Ultrasound imaging was conducted under clinical settings as previously described
[Chapter 3], using a clinically active medical ultrasound machine (Philips iU22
Ultrasound) and licensed ultrasound technician. Two different transducers were
investigated: 1. broadband wand (Philips C8-5 Broadband), for deep abdominal
imaging capabilities but low resolution; 2. linear array wand (Philips L12-5 Linear
array) for shallow imaging but high-resolution imaging. A commercial body phantom
(Blue phantom) was imaged first, in order to calibrate the transducers to appropriate
gain settings, before imaging the samples. After calibration, clinical settings for the
linear array transducer were set to a gain of 65%, frequency of 45 Hz, with samples
submerged 2 cm inside the mimic, and shadow correction enabled.
Once captured, ultrasound images were analyzed using Andor Solis (Oxford
Instruments) imaging software. Regions of interest were defined inside the artery

55
mimic, kept at a constant size throughout all samples, and the Signal to Noise ratio
(SNR) calculated as the average of four defined regions (Figure S1).
4.2.5 Statistical analysis
The tests described were repeated multiple times and the data reported as the mean
± standard deviation. Statistical analysis was done through single factor ANOVA,
with a defined alpha value of 0.05.
4.3 Results
4.3.1 Assessment of sample density and tensile properties
Similar to previous polyurethane results, we did not expect for density and tensile
properties to be impacted significantly due to the particle’s rounded nature [50].
Addition of particles did significantly increase the density (Table 4.1), from the virgin
silicone of 1.115 ± 0.003 g/cm3 to 1.176 ± 0.003 g/cm3 for the highest loading
investigated at 10 wt%. This difference was considered a minimal change, amounting
to a small increase of 5.5% at 10 wt% particle loading. No significant impact from
microparticle loadings was observed with the Young’s modulus (alpha = 0.05) (Table
4.1) at 40% Strain. The particles are smooth in nature, decreasing the surface areal
attachment between the particles and the matrix thus minimizing impact on the
modulus [49]. Ultimate tensile strength could not be determined, as the films did not
reach fracture point.

56
Table 4.1: Density and Young’s modulus determined by Archimedes density kit and
Instron tensile testing respectively. In density, significant difference (*) was observed
between Silicone and all other samples, with exception for 1wt%. In Young’s modulus,
significant difference was observed between Silicone and 3wt%. Average reported
with ± standard deviation (n = 2~3).
4.3.2 Ultrasound Signal-to-Noise analysis
As described in the materials section, a 12 MHz linear array transducer and the soft
tissue mimetic, were used to give an accurate representation of samples under clinical
settings, allowing for direct comparison between each composite sample. Differing
from the previous polyurethane study, sample morphology was converted from
hollow tubes to solid strips, while retaining the 2.75 mm thickness of the previous
study. Removing the lumen aspect, reflection from changing interfaces could be
ignored, minimizing variability in signal-to-noise ratios within a sample as these
reflections would cause a spike in signal. When examining the Ultrasound images the
following general observations can be made for all sample similar to the silicone
controls (Figure 4.1A), samples were embedded under 2 cm of soft tissue mimic, then
a slight reflection from the Penrose drain artery mimic can be seen, before the dark
region of dI water, and another reflection from the interface of the silicone surface.

57
Ultrasound traveled through the silicone mostly unreflected for the control, before
producing another reflection as it met the silicone to Penrose drain interface.
Figure 4.1: B-Mode images of composite samples within Penrose drains, filled with
dI water, suspended in soft tissue mimic. Silicone control (A), 1 wt% P40 particles (B),
3 wt% (C), 5 wt% (D), 10 wt% (E), and 5 wt% Silica (F) under 12 MHz Transducer
Frequency 42 Hz, Gain 65% (1) or Gain 68% (2).
Regions of interest (n=4) were spread across the sample length, with region heights
and widths equivalent to the measured sample thickness of 2.75 mm (Figure S1).
Signal-to-noise ratios were graphed as the average of these regions (Figure 4.2).
Samples of 1 wt% P40 (Figure 4.1B) demonstrated increased signal-to-noise but
were visually comparable to the soft tissue mimic. Samples of 3 wt% (Figure 4.1C),
5 wt% (Figure 4.1D), 10 wt% P40 (Figure 4.1E), and 5 wt% Silica (Figure 4.1F) had
visually increased signal when compared to 1 wt% P40 but were not visually
discernible from one another. Silicone samples with loadings of 3 wt% were
calculated to have increased their signal-to-noise ratios by 344% when compared to

58
pure silicone. Samples of 1wt% had their SNR increase by 268%, while 5wt% P40
samples increased by 354%, 10wt% P40 increased by 344%, and 5wt% Silica
increased by 308%. Calculated results demonstrated that even a slight addition of 1
wt% particles would result in significant increase in SNR, while addition of particles
further than 3 wt% would result in insignificant SNR gain.
Figure 4.2: Signal to Noise ratios for soft tissue phantom (BluePhan), Silicone, 1 wt%
P40, 3 wt% P40, 5 wt% P40, 10 wt% P40, and 5 wt% Si composites (n=2). Significant
differences (*p < 0.05) were found when comparing phantom and Silicone to all other
samples. No significant difference was found between 5 wt% P40 and 5 wt% Si.
4.4 Discussion
Our overall aim for this study was to demonstrate transfer of our theory from a
thermoplastic to thermoset polymer, in order to prove possibility of implementation
to all catheters without significant changes. The results have shown significant
improvement in echogenic properties of silicone samples, without significant impact

59
to mechanical properties, with particle loadings up to 10 wt%. Furthermore, 3 wt%
addition of microparticles has demonstrated to have the greatest impact to SNR
while requiring the least amount of extra material, as 5 wt% and 10 wt% were shown
to not have significantly increased SNR when compared to 3 wt%.
As sample morphologies differ from the silicone and polyurethane samples, direct
comparison of SNR would not be possible without variability being introduced by the
reflections caused by the double interfaces of the lumen. Differentiating from the
previous results, where 5 wt% was concluded to be the optimal loading for the
thermoplastic polyurethane, the difference in results may be due to the increased
thickness of samples. While maintaining similar sample thickness as the previous
study, the removal of a sample lumen increased the overall ultrasound thickness from
1.5 mm to 2.75 mm. This increase in thickness could have led to compounding
echogenicity, causing the insignificant difference between 3 wt% and 5 wt% samples.
Furthermore, when analyzing SNR and graphing regions of interest, it was found that
sample thickness was visually larger than when measured, with samples appearing to
breach beyond the artery mimic wall. This notable increase in size may be due to an
ultrasound artifact known as ultrasound reverberation, where the presence of strong
reflectors causes the ultrasound wave to take longer to return to the transducer, and
is incorrectly calculated as a deeper structure[73]. The strongest evidence for this
artifact to the present is seen in the 5 wt% P40 sample (Figure 4.3), in which the
sample thickness is calculated to be 4 mm, and a parallel line (yellow arrow) is seen
below the sample. This parallel line is most likely the reflection from the artery mimic,
demonstrating the perceived change in depth common in reverberation artifacts.

60
Figure 4.3: B-mode image of 5 wt% P40 sample, demonstrating an artifact in which
the artery mimic reflection (yellow arrow) is seen as being deeper when below the
sample than when not (red arrow).
4.5 Conclusion
This work successfully demonstrated the viability of transferring our composite
approach from a thermoplastic polyurethane to a thermoset silicone, thus,
increasing the materials’ bulk echogenicity, without significantly impacting
mechanical properties. Loadings of 3 wt% microparticles, with an average diameter
71.35 µm, resulted in the best results, as the lower number of particles used would
decrease the amount of extra material needed while still enhancing the SNR
compared to silicone alone. Silicone samples with loadings of 3wt% were calculated
to have increased their signal-to-noise ratios by over 340% when compared to pure
silicone. Future work will entail the reimplementation of a lumen, as well as the study
of the correlation between actual sample thickness and imaged thickness.

61
4.6 Appendix
Figure S1: B-Mode images of a 3 wt%P40 Sample under 12MHz ultrasound imaging,
analyzed for Signal-to-Noise ratio, using Andor Solis software, and containing four
areas of interest defined throughout the sample (1-4). Box 5 & 6 were used to
compare Signal-to-noise of the gelatin mimic, while box 7 compared dI water SNR
(Data not shown).

62
Chapter 5
Degradation Impacts to Echogenic Properties of Polymer &
Microparticle Composites
5.1 Introduction
Conditions faced in medical settings may further affect echogenicity as catheters
spend an average of 43 days in geriatric patients and 15 days in hospital patients [2,
12]. Studies of the samples’ echogenicity and tensile properties after being
submerged in body temperature simulated body fluid (Phosphate Buffered Saline at
37 ˚C) for long periods of time, will allow for a thorough understanding of expected
issues in-vivo. Lastly, accidental removal of catheters is a rare but real possibility for
geriatric patients (12%), leading to possible detachment between particle-polymer
interfaces, producing voids [1]. Study into the possible echogenic ramifications will
be examined through image analysis and mechanical testing.
Mistakes during fabrication, such as extrusion below optimal temperature would
cause issues in polymer melt and mixing, as unmelted polymer applies force to glass
particles, leading to particle fracture and entrapment of microbubbles. While
fractured particles would have their size decreased and thus decrease their
interaction with ultrasound waves, microbubbles would radically increase reflection
and essentially block any imaging of the anatomy below the catheter. Above optimal
screw rotation speed may cause the polymer to not have adequate amount of time to

63
melt, and lead to particle fracture and polymer shear. Polymer shear would cause
uneven surfaces in the sample, allowing for cell attachment, increasing the possibility
for catheter thrombosis. Furthermore, submersion of samples in simulated in-vivo
conditions may cause rapid degradation of our composite samples, decreasing the
amount of ultrasound interactions, and thus decreasing echogenicity. Lastly,
accidental pulling of samples during use could lead to possible detachment between
particle-polymer interfaces, causing voids. Voids in the matrix may lead to rapid
increase in reflection properties, as the ultrasound waves interact with the extremely
low-density interphase. As our microparticles are smooth, we expect minimal surface
attachment between particle and polymer [49]. This low attachment would assist in
minimizing effects from 3-point bending but may decrease the ultimate tensile
strength of the samples.
The aim of this study was to investigate the impacts to ultrasound response of
microparticle composites, after undergoing tensile forces, as well as study the
impact to biocompatibility of composites as more filler is added.
5.2 Materials and Methods
5.2.1 Materials
C6-135 Silicone two-part elastomer was purchased from DOW Corning (Cerritos, CA).
Texin RxT90A Polyurethane, a previously studied bioinert thermoplastic (TPU) with
softening point of 180 ˚C and degradation point around 283 ˚C[25], was purchased
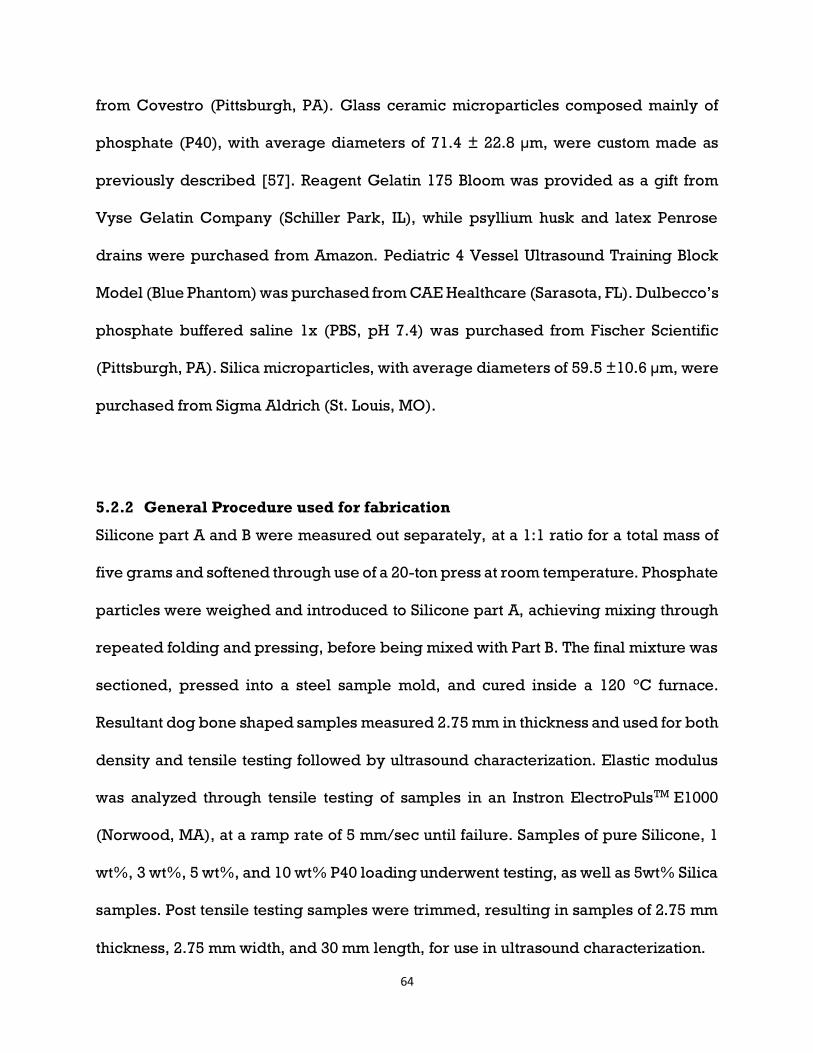
64
from Covestro (Pittsburgh, PA). Glass ceramic microparticles composed mainly of
phosphate (P40), with average diameters of 71.4 ± 22.8 µm, were custom made as
previously described [57]. Reagent Gelatin 175 Bloom was provided as a gift from
Vyse Gelatin Company (Schiller Park, IL), while psyllium husk and latex Penrose
drains were purchased from Amazon. Pediatric 4 Vessel Ultrasound Training Block
Model (Blue Phantom) was purchased from CAE Healthcare (Sarasota, FL). Dulbecco’s
phosphate buffered saline 1x (PBS, pH 7.4) was purchased from Fischer Scientific
(Pittsburgh, PA). Silica microparticles, with average diameters of 59.5 ±10.6 µm, were
purchased from Sigma Aldrich (St. Louis, MO).
5.2.2 General Procedure used for fabrication
Silicone part A and B were measured out separately, at a 1:1 ratio for a total mass of
five grams and softened through use of a 20-ton press at room temperature. Phosphate
particles were weighed and introduced to Silicone part A, achieving mixing through
repeated folding and pressing, before being mixed with Part B. The final mixture was
sectioned, pressed into a steel sample mold, and cured inside a 120 °C furnace.
Resultant dog bone shaped samples measured 2.75 mm in thickness and used for both
density and tensile testing followed by ultrasound characterization. Elastic modulus
was analyzed through tensile testing of samples in an Instron ElectroPulsTM E1000
(Norwood, MA), at a ramp rate of 5 mm/sec until failure. Samples of pure Silicone, 1
wt%, 3 wt%, 5 wt%, and 10 wt% P40 loading underwent testing, as well as 5wt% Silica
samples. Post tensile testing samples were trimmed, resulting in samples of 2.75 mm
thickness, 2.75 mm width, and 30 mm length, for use in ultrasound characterization.

65
5.2.3 General Procedure for Microscopy
Polyurethane samples were imaged under optical microscopy before and after tensile
testing. Environmental scanning electron microscopy (FEI Quanta 600 FEG, Hillsboro,
OR) was used for accurate analysis of particle detachment for polyurethane and
silicone samples. Sectioned samples were attached to carbon tape while loose
particles were removed by compressed air, and sputter coated with 5 nm of iridium
(LEICA EM ACE600). Secondary emission imaging was used to study the surface and
morphology of particles, while backscatter imaging allowed for ease of tracking of
particles.
5.2.3 General Procedure used for Soft tissue phantom, Ultrasound Imaging, and
Signal-to-Noise analysis
Gelatin soft tissue mimics were fabricated the day before ultrasound sessions, relying
on a common phantom recipe with slight modifications, using Penrose drains as artery
mimics[62]. Post tensile testing samples were placed inside tubing and deionized (dI)
water was added, being careful to remove any bubbles before tying the tubing. Tied
artery mimics were held in place by metal wire inside a rectangular mold. Resulting
phantoms were 9 cm in width, 12 cm in length, and 4 cm in height, with six samples
evenly dispersed within each mimic.
Ultrasound imaging was conducted under clinical settings, employing the use of a
clinically active medical ultrasound machine (Philips iU22 Ultrasound) and licensed
ultrasound technician. Two different transducers were investigated: 1. broadband

66
wand (Philips C8-5 Broadband), for deep abdominal imaging capabilities but low
resolution; 2. linear array wand (Philips L12-5 Linear array) for shallow imaging but
high-resolution imaging. A commercial body phantom (Blue phantom) was imaged
first, in order to calibrate the transducers to appropriate gain settings, before imaging
the samples. After calibration, clinical settings for the linear array transducer were set
to a gain of 57%, frequency of 45 Hz, with samples submerged 2 cm inside the mimic,
and shadow correction enabled.
Once captured, ultrasound images were analyzed using Andor Solis (Oxford
Instruments) imaging software. Regions of interest were defined inside the artery
mimic, kept at a constant size throughout all samples, and the Signal to Noise ratio
(SNR) calculated as the average of four defined regions.
5.2.4 General Procedure used for Sample Degradation Study
Extruded samples of polyurethane, 1wt%, 3wt%, and 5wt% were fabricated as
described in Chapter 3 were used for this study. Samples of varying diameters (2.0 –
2.8 mm) were sectioned into 10 mm lengths (n = 10) and weighed. Sectioned samples
were placed into individual glass vials, filled with 10 mL of PBS, and placed in an
incubator set to 37 °C. Once per week, samples were removed, Kimwipe dried, and
weighed, with PBS replaced weekly for 4 weeks. Pure Polyurethane samples were
used as the control and the samples’ total % mass change was compared to the
polyurethane to test for significant difference.

67
5.2.5 Cytotoxicity sample preparation
Extruded polyurethane samples with and without P40 particles (d = 3 mm) were
sectioned, organized in a row of three, and mounted to a bioinert glass ring through
melting. Careful preparation ensured the bottom surface of the extrusions was
unaffected by the mounting procedure, while having direct contact with cells.
Samples were sterilized in 1X PBS for 24 hours, agitated continuously (Innova 2000
platform shaker), before soaking in 70% ethanol for 30 min, and then rinsed with
sterile PBS, finally being kept in nonadditive minimum essential media.
5.2.6 Cytotoxicity testing
Mouse 3T3 fibroblast cells were seeded in 12-well plates for 24 hr at 20,000 cells per
well, before extrusion samples were laid over them. Cells were incubated and
exposed to samples for 24 hrs (37 ˚C, 5% CO2) before extrusions (13mm) were
removed[25]. Media was replaced with serum-free media and allowed to sit for 1.5
hrs, before MTS solution was added at 50 µL per well. Plates gently stirred, wrapped
in aluminum foil, and replaced in incubator for an hour. One hundred µL’s were
extracted from each well and added to 96-well plate before analyzing at 490 nm
wavelength in a Synergy Mx microplate reader (Biotek. Winooski, VT).

68
5.2.7 Statistical analysis
The tests described were repeated multiple times and the data reported as the mean
± standard deviation. Statistical analysis was done through single factor ANOVA,
with a defined alpha value of 0.05.
5.3 Results
5.3.1 Sample Fabrication
Polyurethane samples imaged under optical microscopy before tensile testing
exhibited no remarkable contrast between microparticles and polymers (Figure
5.1A). After tensile testing, clear separation between polymer and particles was
detected (Figure 5.1B), with closer imaging revealing obvious polymer fracture at
the center of microparticles (Figure 5.1C,D).
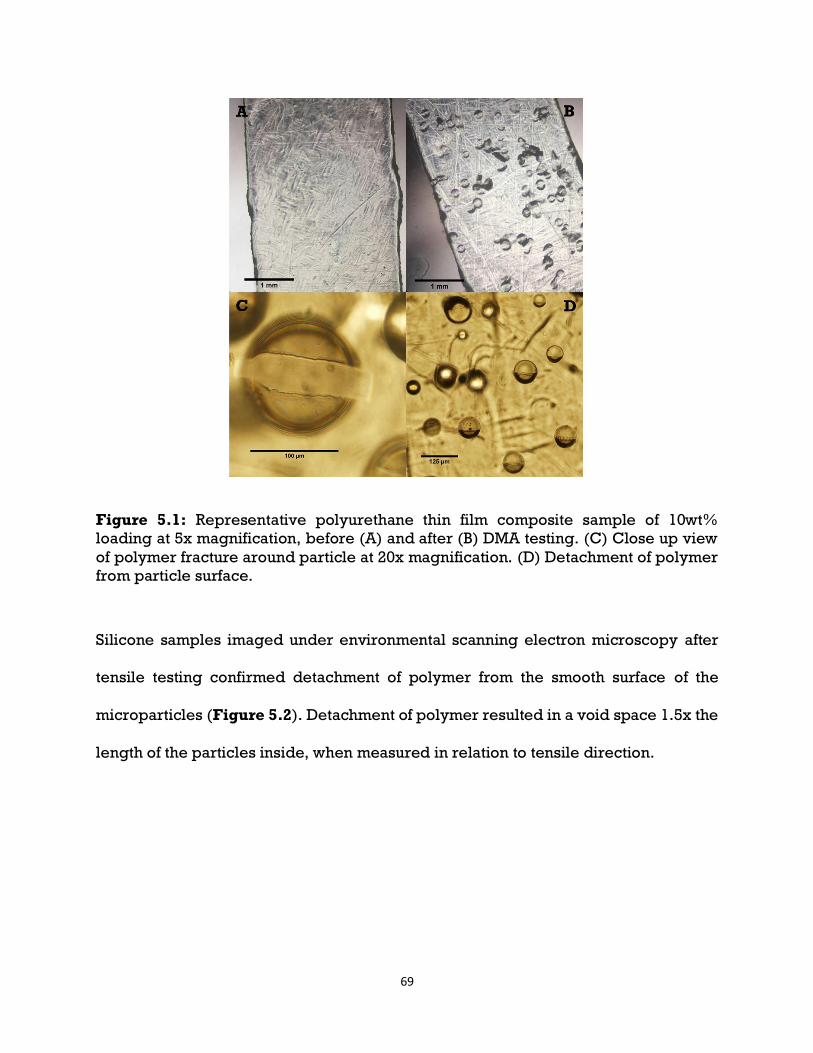
69
Figure 5.1: Representative polyurethane thin film composite sample of 10wt%
loading at 5x magnification, before (A) and after (B) DMA testing. (C) Close up view
of polymer fracture around particle at 20x magnification. (D) Detachment of polymer
from particle surface.
Silicone samples imaged under environmental scanning electron microscopy after
tensile testing confirmed detachment of polymer from the smooth surface of the
microparticles (Figure 5.2). Detachment of polymer resulted in a void space 1.5x the
length of the particles inside, when measured in relation to tensile direction.

70
Figure 5.2: Representative silicone composite of 5wt% Silica under secondary
electron scanning microscopy, exhibiting detachment of microparticles from silicone
polymer after tensile testing.
5.3.2 Tensile Sample Ultrasound Analysis
As described in the materials section, a 12 MHz linear array transducer and the soft
tissue mimetic, were used to give an accurate representation of samples under clinical
settings, allowing for direct comparison between each composite sample (Figure
5.3). When examining the Ultrasound images the following general observations can
be made for all sample similar to the silicone controls (Figure 5.3A), samples were
embedded under 2 cm of soft tissue mimic, then a slight reflection from the Penrose
drain artery mimic can be seen, before the dark region of dI water, and another
reflection from the interface of the silicone surface. Ultrasound traveled through the
silicone mostly unreflected for the control, before producing another reflection as it
met the silicone to Penrose drain interface.

71
Figure 5.3: B-Mode images of composite samples within Penrose drains, filled with
dI water, suspended in soft tissue mimic. Silicone control (A), 1 wt% P40 particles (B),
3 wt% (C), 5 wt% (D), 10 wt% (E), and 5 wt% Silica (F) under 12 MHz Transducer
Frequency 45 Hz, Gain 57%.
Regions of interest (n=4) were spread across the sample length, with region heights
and widths equivalent to the measured sample thickness of 2.75 mm. Signal-to-noise
ratios were graphed as the average of these regions (Figure 5.4). Silicone samples
with loadings of 3 wt% exhibited the highest increase in Signal-to-Noise ratio,
calculated to have increased by 513% when compared to pure silicone. Composite
samples of 1wt% P40 had an increase of 326%, while 5 wt% P40 increased by 456%;
10wt% P40 increased by 431%; and 5wt% Silica increase by 435%. Calculated
results demonstrated that even a slight addition of 1 wt% particles would result in
significant increase in SNR, while addition of particles further than 3 wt% would
result in insignificant SNR gain.

72
Figure 5.4: Signal to Noise ratios for soft tissue phantom (Phantom), Silicone, 1 wt%
P40, 3 wt% P40, 5 wt% P40, 10 wt% P40, and 5 wt% Si composites (n=2) after tensile
testing. Significant differences (*p < 0.05) were found when comparing phantom and
Silicone to all other samples. No significant difference was found between 5 wt% P40
and 5 wt% Si.
5.3.3 Sample degradation
After four weeks of sample immersion in simulated body fluid, polyurethane samples
exhibited an overall increase in mass (Table 5.1). Significant mass increase was found
when comparing composite samples to the polyurethane control. Environmental
scanning electron microscopy of samples after the four-week immersion study
revealed the drying of simulated body fluid onto the sample surfaces (Figure 5.5).
Samples with significant surface roughness (Figure 5.5B) exhibited increased

73
buildup of foreign matter coverage, posing risks for bacteria attachment while inside
the body.
Table 5.1: Total mass change (%) of samples after a four-week period. Average
reported with ± standard deviation (n = 3). In density, significant difference was
observed between Silicone and all other samples, with exception for 1wt%.
Figure 5.5: Polyurethane (A) and 5wt% P40 (B) samples after 4 weeks of PBS
submersion, under secondary environmental scanning electron microscopy (ESEM),
showing PBS drying onto the sample surface.

74
5.3.4 Cytotoxicity testing
Cytotoxicity testing reaffirmed previous biocompatibility results showing both the
polyurethane and glass particles being biocompatible [25, 57]. There were no
significant differences in measured cell counts between PU, 1wt%, 3wt%, and 5wt%
samples (Figure 5.6). Fabrication and processing of both components can be said to
not have impacted the noncytotoxic nature of the materials.
Figure 5.6: Cell count values (n=4) of polyurethane control, 1wt%, 3wt%, and 5wt%
microparticle loading composites after 24 hrs of exposure. No significant differences
found between samples.
75
5.4 Discussion
Comparison of pre-tensile tested samples and post-tensile tested samples required
normalization of data, as the Gain % and Frequency of images was not constant
between ultrasound sessions. By normalizing post tensile tested Signal-to-Noise
based off of the Blue phantom SNR, which remained constant between studies, a
comparison could be made. Comparison of normalized Signal-to-Noise revealed no
significant difference between pre and post tensile tested Silicone, as well as 5wt%
P40, 10WT% P40, and 5wt% Silica (Figure 5.7). Significant difference was found
between pre and post tested 1wt%, and 3wt% P40 samples. From ESEM imaging, we
found the detachment of polymer from particle, resulting in the creation of void space
between both interfaces. These void spaces were 1.5x the length of the particles
within, thus increasing the ultrasound reflection of the samples and shadowing
underneath.

76
Figure 5.7: Signal to Noise ratios for soft tissue phantom (Phantom), Silicone, 1 wt%
P40, 3 wt% P40, 5 wt% P40, 10 wt% P40, and 5 wt% Si composites (n=2). With the right
bar referring to the normalized data of post tensile tested samples.
Direct comparison of ultrasound images, without editing for contrast matching, pre-
tensile tested samples (Figure 5.8B0-F0) exhibited increased size when compared to
actual size, while post-tensile tested samples (Figure 5.8B1-F1) do not. This may be
due to a common ultrasound artifact known as ultrasound reverberation[74]. Caused
when ultrasound signal meets strong parallel reflectors, the signal may become
trapped, causing a calculation error in the ultrasound machine, as the trapped signal
is released late and calculated as a sample of deeper depth then in actuality. A form
of reverberation artifact is the comet-tail artifact, produced when small calcific,
crystalline, or highly reflective particles are ultrasound imaged[73].Preliminary
studies into the ultrasound imaging of microcalcifications referred to the artifact

77
produced as the twinkle effect, produced under doppler imaging, but the effect would
be known as the comet-tail artifact under B-mode imaging[43, 75]. In theory, our
microparticles act as strong reflectors due to their density and size, coupling their
proximity to one another, ultrasound signal may become trapped within our sample,
causing late return of ultrasound signal and resulting in a visual increase in size. This
is backed by the lack of size increase in the control samples (Figure 5.8A0,A1).
Furthermore, as the comet-tail effect relies on particle vibration due to ultrasound
interaction, post-tensile tested samples, with detached particles, would be unable to
produce the artifact, as the ultrasound interacts with the larger void than the particle
within.
Figure 5.8: Ultrasound comparison of Pre-Tensile tested samples (A0-F0), and post-
tensile tested samples (A1-F1). Gain 65% (Pre) and Gain 57% (Post).
5.5 Conclusion
Results demonstrate the lack of impact from multiple weeks of submersion in
simulated body fluid. Sample weights increased over time due to drying of PBS onto
samples, and the increased roughness of samples as more microparticles were added
may be the cause for 5wt% samples’ mass increasing the most. Comparison of pre

78
and post tensile tested samples showed no significant impact from excessive pulling
and relaxing of polymer, this may be due to the microparticles’ current size. Unlike
early studies, where microparticles used were 200 µm in diameter, our particles are
smaller than 100 µm, thus, detachment and production of a void space 1.5x the length
of the particles would still result in an echogenic composite[43]. Future work would
focus on the increasing of particle sizes, decreasing of sample thickness, and
implementation of a thin protective layer on top of the composite surface, in order to
decrease surface roughness.

79
Chapter 6
Overall Conclusions & Future Work
6.1 Overall Conclusions
This research provides contributions towards the future of medical device design. The
first is the addition of known echogenic microparticles to echolucent polymer,
producing a composite with bulk echogenic response. Through use of both
thermoplastic and thermoset polymers, with similar densities but differing stiffness,
results have demonstrated the transferability of this concept to various medical
polymers. Further research is needed to determine if results seen in this study extend
to ex vivo and in vivo animal studies.
Overall, all the hypotheses of this research were backed by the produced results.
Addition of echogenic microparticles into echolucent polyurethane produced an
echogenic composite, with optimal loading of 5wt% in a hollow tube sample with
polymer thickness of 1.3 mm. Young’s modulus was overall unaffected by the addition
of particles, up to 5wt%. Addition of echogenic microparticles into echolucent silicone
produced an echogenic composite, with optimal loading of 3wt% in a solid sample
with polymer thickness of 2.75 mm. Young’s modulus was overall unaffected by the
addition of particles, up to 10wt%. Addition of degradation parameters, such as
exposure to simulated body conditions, as well as simulated excessive pulling of
samples, did not significantly affect the echogenicity of samples.

80
6.2 Specific Project Conclusions
Results from this research revealed the capability to fabricate polymeric composite
extrusions that possess echogenic properties, through the addition of biodegradable
glass particles, without sacrifice of mechanical properties or need for complex
fabrication procedures. I have demonstrated the use of both established extrusion and
molding procedures in order to create composites of biocompatible polymers and
biodegradable echogenic glass microparticles, that will combine into a single
echogenic sample. Through use of known echogenic dense microparticles,
ultrasound response of non-echogenic polymer were improved, up to a point, based
on polymer thickness, density, and viscoelasticity[45]. Dense microparticles are
known to be echogenic under medical ultrasound wavelengths, due to their size and
density, while their surface roughness produces negligible response[43-45]. Through
uniform spacing of particles, controllable through weight percentage addition into
polymer, the echogenic response of a single microparticle was constructively
enhanced and further increased the sample’s bulk ultrasound response.
6.2.1 Polyurethane Response to Ultrasound Enhancement
I hypothesized that composite extrusions could be fabricated through mixing of
ground polyurethane and glass microparticles. My findings show a direct relationship
81
from increased loading percentages leading to increased echogenic signal (Figure
3.12). I have also demonstrated the insignificant impact to elastic modulus with
increased filler loading (Table 3.3), as the spherical morphology of particles allowed
for minimal impact to the polymer matrix[52]. Bulk density and cytocompatibility
were also shown to be insignificantly impacted (Table 3.2, Figure 5.6).
I anticipated and observed a linear increase in Signal-to-Noise ratios (SNR) as
microparticle loading increased, up to a 5wt% load, before plateauing. After this
point, increase in particle loading above 10 wt% would significantly affect mechanical
properties, and negatively affect the intended purpose. Microcalcifications with
similar size range as the P40 have shown to poses echogenic properties while
surrounded by soft tissue[43, 44]. As our primary polymer holds similar echogenic
properties as soft tissue, I expected glass particles to act in the same manner as
microcalcifications in soft tissue and increase the bulk echogenicity of composite
samples. Choosing to keep particle loading below 10wt%, sample density was
minimally impacted, while their spherical structure decreased impact to polymer
properties. As each microparticle is capable of ultrasound reflection, increasing
particle loading in the polymer would directly increase the sample’s Signal-to-Noise
ratio, to the point where particles are indiscernible in the image, and the entire
sample is seen as echogenic.

82
6.2.2 Silicone Response to Ultrasound Enhancement
Transferability of the proposed application is theoretically possible, as many
polymeric medical devices are composed of silicone or polyurethane, holding similar
densities. Foley catheters, feeding tubes, nasogastric tubes [34, 76, 77] are all
comprised of either polyurethane or silicone, requiring fluoroscopy in order to track.
I hypothesized an increased echogenicity from composites composed of silicone and
optimal loading of microparticles found from Hypothesis 1. As silicone’s stiffness is
significantly lower than our primary polyurethane’s, we expect echogenic effects to
increase, as the microparticles are able to harmonically vibrate within the polymer.
Distances between particles were hypothesized to not differ between polymers, thus
ultrasound interactions and resolution should not deviate from what was shown in
polyurethane. Harmonic interactions can then be altered through swapping of
particles between low density and higher density, in order to optimize echogenicity.
As silicone contains increased flexibility, we expected and observed an increase in
axial movement of particles inside the polymer (Figure 5.2). Insert a sentence about
the SNR enhancement with the lower P40 loading. Ultrasound generated movement of
microparticles has previously been demonstrated and studied while microparticles
were within PVA-H[43, 44]. Produced harmonics were then able to be detected under
Doppler imaging, increasing the detectability of the particles under ultrasound. By
swapping to a more flexible polymer, I anticipated possible usability of Doppler
imaging to detect samples, or at least increased SNR as the increased axial movement
of particles increases reflected ultrasound waves.

83
6.2.3 Polymer Ultrasound Response to Degradation
Common extrusion issues arise from pressure, screw rotation speed, temperature,
and sample collection force; I hypothesize for microbubble extrusion defects to be
the primary obstacle in implementation of this research. Fabrication complications
were confirmed when imaged under ESEM, resulting in fractured particles and
captured air pockets (Figure 3.4). Addition of air pockets due to fabrication issues
were shown to increase echogenicity in preliminary results (Figure 3.13). As the
addition of air pocket size was uncontrollable, their use as the primary echogenic
source was not viable. Furthermore, as air results in a 99% reflection of ultrasound
waves, the shadow effect would forever be present during imaging, possibly
impeding the imaging of important tissue morphology. Addition of tensile force past
polymer yield point allowed for detachment of particle-polymer adhesion, resulting
in remaining voids after strain was removed and samples were allowed to relax
(Figure 5.2). Degradation of particles on the outer surfaces of the samples due to
exposure to simulated body conditions were expected to occur, while those with
complete encapsulation within the polymer should remain undegraded. Results
demonstrated an opposite effect from the expected, as samples increased in mass
throughout the degradation study (Table 5.1), and ESEM imaging revealed the drying
of PBS onto the sample surfaces (Figure 5.5). No noticeable degradation of particles
was seen. Post-tensile tested samples exhibited no significant impact to SNR (Figure
5.7), as detachment resulted in a 1.5x increase in reflective particle length, resulting
in larger ultrasound reflection possibility, but keeping within the size acceptable for
twinkle artifact[44].

84
Three-point bending of samples was expected to result in insignificant impact to
echogenicity, as silicone has considerably low flexural modulus, and microparticles
are common fillers for the reinforcement of polymers at loads over 10wt%[51]. Post-
3point bended samples are expected to resemble pre-3point bended samples, as the
silicone would be expected to flex before particle fracture or detachment could occur.
6.3 Future Work
Future steps to this research would focus on the variability of thickness of silicone
samples, as well as the application of Doppler and shear-wave elasticity imaging. As
medical catheters vary in thickness depending on the intended patients, research into
the impact to echogenic response of thin walled catheters must be conducted. Our
current theory relies on the proximity of highly reflective microparticles in order to
produce bulk echogenicity through the twinkle effect. Decreasing sample thickness
would in turn decrease the area available for ultrasound reflection, causing decrease
in echogenic response. Both Doppler and shear-wave elasticity imaging would allow
for clear identification of the sample inside the body, as they produce color
identification of moving and dense particles. Furthermore, the effects of 3-point
bending to our samples are yet to be determined, and future work would seek to
prove insignificant impact from this flexural stress. As catheter’s are packaged as coils
before use, exposure to flexing is unavoidable and any impact to the echogenicity of
the composites must be determined. Lastly, overall concept success would rely on

85
successful imaging through ex vivo and in vivo studies, as they accurately represent
the multiple layers present during human ultrasound imaging.
86
References
[1] V. Chopra et al., "Peripherally Inserted Central Catheter Use in Skilled Nursing Facilities: A Pilot Study," Journal of the American Geriatrics Society, vol. 63, no. 9, pp. 1894-1899, 2015, doi: 10.1111/jgs.13600.
[2] M. Harrod, A. Montoya, L. Mody, H. McGuirk, S. Winter, and V. Chopra, "Challenges for Nurses Caring for Individuals with Peripherally Inserted Central Catheters in Skilled Nursing Facilities," Journal of the American Geriatrics Society, vol. 64, no. 10, pp. 2059-2064, 2016, doi: 10.1111/jgs.14341.
[3] S. O. Trerotola, S. Thompson, J. Chittams, and K. S. Vierregger, "Analysis of Tip Malposition and Correction in Peripherally Inserted Central Catheters Placed at Bedside by a Dedicated Nursing Team," Journal of Vascular and Interventional Radiology, vol. 18, no. 4, pp. 513-518, 2007/04/01/ 2007, doi: https://doi.org/10.1016/j.jvir.2007.01.020.
[4] F. Glauser, S. Breault, F. Rigamonti, C. Sotiriadis, A.-M. Jouannic, and S. D. Qanadli, "Tip malposition of peripherally inserted central catheters: a prospective randomized controlled trial to compare bedside insertion to fluoroscopically guided placement," European Radiology, journal article vol. 27, no. 7, pp. 2843-2849, July 01 2017, doi: 10.1007/s00330-016-4666-y.
[5] B. L. Fricke, J. M. Racadio, T. Duckworth, L. F. Donnelly, R. M. Tamer, and N. D. Johnson, "Placement of Peripherally Inserted Central Catheters without Fluoroscopy in Children: Initial Catheter Tip Position," Radiology, vol. 234, no. 3, pp. 887-892, 2005, doi: 10.1148/radiol.2343031823.
[6] S. S. H. Amerasekera, C. M. Jones, R. Patel, and M. J. Cleasby, "Imaging of the complications of peripherally inserted central venous catheters," Clinical Radiology, vol. 64, no. 8, pp. 832-840, 2009/08/01/ 2009, doi: https://doi.org/10.1016/j.crad.2009.02.021.
[7] V. Zochios, "Peripherally inserted central catheter (PICC)-related thrombosis in critically ill patients," The Journal of Vascular Access, vol. 15, no. 5, p. 9, 2014, doi: 10.5301/jva.5000239.
[8] R. S. Evans et al., "Risk of Symptomatic DVT Associated With Peripherally Inserted Central Catheters," Chest, vol. 138, no. 4, pp. 803-810, 2010/10/01/ 2010, doi: https://doi.org/10.1378/chest.10-0154.
[9] F. Abu-Zidan, A. Hefny, and P. Corr, "Clinical ultrasound physics," (in English), Journal of Emergencies, Trauma, and Shock, Article vol. 4, p. 501, 2011 October-December
// 2011. [Online]. Available: https://link.galegroup.com/apps/doc/A272133898/HRCA?u=viva_vpi&sid=HRCA&xid=9c7264ca.
[10] K. M. Peter R. Hoskins, Abigail Thrush, Diagnostic Ultrasound: Physics and Equipment, Second ed. Cambridge University Press, 2010.
[11] K. K. Shung, Diagnostic Ultrasound, 2nd ed. Boca Raton: CRC Press, 2015.
[12] V. Chopra et al., "Variations in Peripherally Inserted Central Catheter Use and Outcomes in Michigan HospitalsPeripherally Inserted Catheter Use and Outcomes in Michigan HospitalsLetters," JAMA Internal Medicine, vol. 176, no. 4, pp. 548-551, 2016, doi: 10.1001/jamainternmed.2015.8402.
[13] R. Parkinson, M. Gandhi, J. Harper, and C. Archibald, "Establishing an ultrasound guided peripherally inserted central catheter (PICC) insertion service," Clinical Radiology, vol. 53, no. 1, pp. 33-36, 1998/01/01/ 1998, doi: https://doi.org/10.1016/S0009-9260(98)80031-7.
[14] M. Mahesh, "Fluoroscopy: patient radiation exposure issues," Radiographics, vol. 21, no. 4, pp. 1033-1045, 2001.
[15] Z. C. J. Higgs, D. A. L. Macafee, B. D. Braithwaite, and C. A. Maxwell-Armstrong, "The Seldinger technique: 50 years on," The Lancet, vol. 366, no. 9494, pp. 1407-1409, 2005/10/15/ 2005, doi: https://doi.org/10.1016/S0140-6736(05)66878-X.
87
[16] A. W. Allen et al., "Venous Thrombosis Associated with the Placement of Peripherally Inserted Central Catheters," Journal of Vascular and Interventional Radiology, vol. 11, no. 10, pp. 1309-1314, 2000/11/01/ 2000, doi: https://doi.org/10.1016/S1051-0443(07)61307-4.
[17] B. Delarbre et al., "Introduction of the use of a pediatric PICC line in a French University Hospital: Review of the first 91 procedures," Diagnostic and Interventional Imaging, vol. 95, no. 3, pp. 277-281, 2014/03/01/ 2014, doi: https://doi.org/10.1016/j.diii.2013.05.004.
[18] R. C. Gonzalez, S. "Percutaneous Central Catheter (PICC)." StatPearl. https://www.ncbi.nlm.nih.gov/books/NBK459338/ (accessed.
[19] N. Sneath, "Are Supine Chest and Abdominal Radiographs the Best Way to Confirm PICC Placement in Neonates?," (in eng), Neonatal Network, no. 1, pp. 23-35, doi: 10.1891/0730-0832.29.1.23.
[20] R. A. Kleinerman, "Cancer risks following diagnostic and therapeutic radiation exposure in children," Pediatric Radiology, journal article vol. 36, no. 2, pp. 121-125, September 01 2006, doi: 10.1007/s00247-006-0191-5.
[21] R. Wakeford, "The risk of childhood leukaemia following exposure to ionising radiation--a review," (in eng), Journal of radiological protection : official journal of the Society for Radiological Protection, vol. 33, no. 1, pp. 1-25, Mar 2013, doi: 10.1088/0952-4746/33/1/1.
[22] V. Chopra et al., "The Michigan Appropriateness Guide for Intravenous Catheters (MAGIC): results from a multispecialty panel using the RAND/UCLA appropriateness method," Annals of internal medicine, vol. 163, no. 6_Supplement, pp. S1-S40, 2015.
[23] S. Sippel, K. Muruganandan, A. Levine, and S. Shah, "Review article: Use of ultrasound in the developing world," International Journal of Emergency Medicine, vol. 4, no. 1, p. 72, 2011/12/07 2011, doi: 10.1186/1865-1380-4-72.
[24] J. P. Silva, T. Plescia, N. Molina, A. C. d. O. Tonelli, M. Langdorf, and J. C. Fox, "Randomized study of effectiveness of computerized ultrasound simulators for an introductory course for residents in Brazil," J Educ Eval Health Prof, vol. 13, no. 0, pp. 16-0, 2016, doi: 10.3352/jeehp.2016.13.16.
[25] L. R. AT. Stevenson, TK. Hill, J. Mcguire, AM. Mohs, R. Shekhar, LR. Bickford, AR. Whittington, "Fabrication and characterization of medical grade polyurethane composite catheters for near-infrared imaging," Biomaterials, vol. 54, p. 9, 2015 2014, doi: 10.1016/j.biomaterials.2015.03.020.
[26] L. Yuan, "Superior success rate of intracavitary electrocardiogram guidance for peripherally inserted central catheter placement in patients with cancer: A randomized openlabel controlled multicenter study," Plos One, vol. 12, no. 3, p. 12, 2017, doi: 10.1371/journal.pone.0171630.
[27] J. Yang, "Silica Shells/Adhesive Composite Film for Color Doppler Ultrasound Guided Needle Placement," ACS Biomaterials Science & Engineering, vol. 3, no. 8, p. 8, 2017, doi: 10.1021/acsbiomaterials.7b00223.
[28] J. Yang, "Ultrasound Responsive Macrophase-Segregated Microcomposite Films for in Vivo Biosensing," ACS Applied Materials & Interfaces, vol. 9, no. 2, p. 9, 2017, doi: 10.1021/acsami.6b10728.
[29] W. C. Culp et al., "Relative Ultrasonographic Echogenicity of Standard, Dimpled, and Polymeric-coated Needles," Journal of Vascular and Interventional Radiology, vol. 11, no. 3, pp. 351-358, 2000/03/01/ 2000, doi: https://doi.org/10.1016/S1051-0443(07)61429-8.
[30] B. D. Inc., "Lumason Formulary Kit," Monroe Township, NJ, 2015.
[31] T. M. Shah. "Radiopaque Polymer Formulations for Medical Devices." https://www.mddionline.com/radiopaque-polymer-formulations-medical-devices (accessed.
[32] M. Aouad-Maroun, C. K. Raphael, S. K. Sayyid, F. Farah, and E. A. Akl, "Ultrasound-guided arterial cannulation for paediatrics," (in eng), Cochrane Database Syst Rev, vol. 9, no. 9, pp. CD011364-CD011364, 2016, doi: 10.1002/14651858.CD011364.pub2.
[33] G. A. Schmidt et al., "Ultrasound-guided vascular access in critical illness," Intensive Care Medicine, journal article vol. 45, no. 4, pp. 434-446, April 01 2019, doi: 10.1007/s00134-019-05564-7.

88
[34] H. M. Kim, B. H. So, W. J. Jeong, S. M. Choi, and K. N. Park, "The effectiveness of ultrasonography in verifying the placement of a nasogastric tube in patients with low consciousness at an emergency center," (in eng), Scandinavian journal of trauma, resuscitation and emergency medicine, vol. 20, p. 38, Jun 12 2012, doi: 10.1186/1757-7241-20-38.
[35] A. Jain, P. J. McNamara, E. Ng, and A. El-Khuffash, "The use of targeted neonatal echocardiography to confirm placement of peripherally inserted central catheters in neonates," (in eng), American journal of perinatology, vol. 29, no. 2, pp. 101-6, Feb 2012, doi: 10.1055/s-0031-1295649.
[36] L. Tauzin, N. Sigur, C. Joubert, J. Parra, S. Hassid, and M. E. Moulies, "Echocardiography allows more accurate placement of peripherally inserted central catheters in low birthweight infants," Acta Paediatrica, vol. 102, no. 7, pp. 703-706, 2013, doi: 10.1111/apa.12245.
[37] N. Telang, D. Sharma, O. T. Pratap, H. Kandraju, and S. Murki, "Use of real-time ultrasound for locating tip position in neonates undergoing peripherally inserted central catheter insertion: A pilot study," (in eng), The Indian journal of medical research, vol. 145, no. 3, pp. 373-376, Mar 2017, doi: 10.4103/ijmr.IJMR_1542_14.
[38] Drugs.com. "Lumason Prices, Coupons and Patient Assistance Programs." https://www.drugs.com/price-guide/lumason (accessed.
[39] T. D. Mast, "Empirical relationships between acoustic parameters in human soft tissues," Acoustics Research Letters Online, vol. 1, no. 2, pp. 37-42, 2000, doi: 10.1121/1.1336896.
[40] M. S. Taljanovic et al., "Shear-Wave Elastography: Basic Physics and Musculoskeletal Applications," RadioGraphics, vol. 37, no. 3, pp. 855-870, 2017, doi: 10.1148/rg.2017160116.
[41] W. A. Berg et al., "Shear-wave Elastography Improves the Specificity of Breast US: The BE1 Multinational Study of 939 Masses," Radiology, vol. 262, no. 2, pp. 435-449, 2012, doi: 10.1148/radiol.11110640.
[42] G. Ferraioli et al., "Accuracy of real-time shear wave elastography for assessing liver fibrosis in chronic hepatitis C: A pilot study," Hepatology, vol. 56, no. 6, pp. 2125-2133, 2012, doi: 10.1002/hep.25936.
[43] L. Liu, "In vitro study of ultrasound radiation force-driven twinkling sign using PVA-H gel and glass beads tissue-mimicking phantom," (in
), Journal of Medical Ultrasonics, vol. 40, no. 3, p. 8, 2013, doi: 10.1007/s10396-012-0429-9.
[44] L. Liu, "Microscopic observation of glass bead movement in soft tissue-mimicking phantom under ultrasound PW mode scanning," Journal of Medical Ultrasonics, vol. 42, no. 1, p. 5, 2014, doi: 10.1007/s10396-014-0565-5.
[45] W. Lu, "Dominant factor analysis of B-flow twinkling sign with phantom and simulation data," Journal of Medical Ultrasonics, vol. 44, no. 1, p. 14, 2017, doi: 10.1007/s10396-016-0745-6.
[46] J. C. Simon, O. A. Sapozhnikov, W. Kreider, M. Breshock, J. C. Williams, and M. R. Bailey, "The role of trapped bubbles in kidney stone detection with the color Doppler ultrasound twinkling artifact," Physics in Medicine & Biology, vol. 63, no. 2, p. 025011, 2018/01/09 2018, doi: 10.1088/1361-6560/aa9a2f.
[47] M. H. Katharine E. Alter, Barbara Karp, Codrin Lungu, Ultrasound-Guided Chemodenervation Procedures: . Demos Medical Publishing, 2012, p. 224.
[48] D. Gan, S. Lu, C. Song, and Z. Wang, "Physical properties of poly(ether ketone ketone)/mica composites: effect of filler content," Materials Letters, vol. 48, no. 5, pp. 299-302, 2001/04/01/ 2001, doi: https://doi.org/10.1016/S0167-577X(00)00318-9.
[49] J.-Z. Liang, "Reinforcement and quantitative description of inorganic particulate-filled polymer composites," Composites Part B: Engineering, vol. 51, pp. 224-232, 2013/08/01/ 2013, doi: https://doi.org/10.1016/j.compositesb.2013.03.019.

89
[50] J. Z. Liang and R. K. Y. Li, "Effect of filler content and surface treatment on the tensile properties of glass-bead-filled polypropylene composites," Polymer International, vol. 49, no. 2, pp. 170-174, 2000, doi: 10.1002/(sici)1097-0126(200002)49:2<170::Aid-pi322>3.0.Co;2-u.
[51] L. Nicolais and L. Nicodemo, "The Effect of Particles Shape on Tensile Properties of Glassy Thermoplastic Composites," International Journal of Polymeric Materials and Polymeric Biomaterials, vol. 3, no. 3, pp. 229-243, 1974/10/01 1974, doi: 10.1080/00914037408072354.
[52] H. Alter, "Filler particle size and mechanical properties of polymers," Journal of Applied Polymer Science, vol. 9, no. 4, pp. 1525-1531, 1965, doi: 10.1002/app.1965.070090427.
[53] W. Höland, "Biocompatible and bioactive glass-ceramics — state of the art and new directions," Journal of Non-Crystalline Solids, vol. 219, pp. 192-197, 1997/10/01/ 1997, doi: https://doi.org/10.1016/S0022-3093(97)00329-3.
[54] S. Srinivasan, R. Jayasree, K. P. Chennazhi, S. V. Nair, and R. Jayakumar, "Biocompatible alginate/nano bioactive glass ceramic composite scaffolds for periodontal tissue regeneration," Carbohydrate Polymers, vol. 87, no. 1, pp. 274-283, 2012/01/04/ 2012, doi: https://doi.org/10.1016/j.carbpol.2011.07.058.
[55] H. Broemer, H.-H. Kaes, and E. Pfeil, "Biocompatible glass ceramic material," ed: Google Patents, 1976.
[56] V. Krishnan and T. Lakshmi, "Bioglass: A novel biocompatible innovation," Journal of advanced pharmaceutical technology & research, vol. 4, no. 2, p. 78, 2013.
[57] I. Ahmed, "Cytocompatibility and Effect of Increasing MgO Content in a Range of Quaternary Invert Phosphate-based Glasses," Journal of Biomaterials Applications, vol. 24, no. 6, p. 21, 2009, doi: 10.1177/0885328209102761.
[58] K. M. Z. Hossain, "Development of microspheres for biomedical applications: a review," Progress in Biomaterials, vol. 4, no. 1, p. 19, 2015, doi: 10.1007/s40204-014-0033-8.
[59] "echolucent," in Miller-Keane Encyclopedia and Dictionary of Medicine, Nursing, and Allied Health, Seventh ed. https://medical-dictionary.thefreedictionary.com/echolucent, 2003.
[60] K. Funamoto, "Poly(vinyl alcohol) gel ultrasound phantom with durability
and visibility of internal flow," Journal of Medical Ultrasonics, vol. 42, no. 1, p. 7, 2014, doi: 10.1007/s10396-014-0560-x.
[61] U. Hamhaber, F. A. Grieshaber, J. H. Nagel, and U. Klose, "Comparison of quantitative shear wave MR-elastography with mechanical compression tests," Magnetic Resonance in Medicine, vol. 49, no. 1, pp. 71-77, 2003, doi: 10.1002/mrm.10343.
[62] J. L. Kendall and J. P. Faragher, "Ultrasound-guided central venous access: a homemade phantom for simulation," Canadian Journal of Emergency Medicine, vol. 9, no. 5, pp. 371-373, 2007, doi: 10.1017/S1481803500015335.
[63] R. O. Bude and R. S. Adler, "An easily made, low-cost, tissue-like ultrasound phantom material," (in eng), Journal of clinical ultrasound : JCU, vol. 23, no. 4, pp. 271-3, May 1995.
[64] Y. H. Kim, "Ultrasound Phantoms to Protect Patients from Novices," (in eng), Korean J Pain, vol. 29, no. 2, pp. 73-77, 2016, doi: 10.3344/kjp.2016.29.2.73.
[65] C. Richardson, S. Bernard, and V. A. Dinh, "A Cost-effective, Gelatin-Based Phantom Model for Learning Ultrasound-Guided Fine-Needle Aspiration Procedures of the Head and Neck," Journal of Ultrasound in Medicine, vol. 34, no. 8, pp. 1479-1484, 2015, doi: 10.7863/ultra.34.8.1479.
[66] R. R. Thiagarajan, "Stop Wasting Time: Organize a Bedside Peripherally Inserted Central Venous Catheter Placement Team for Your PICU," Pediatric Critical Care Medicine, vol. 20, no. 1, pp. 86-87, 2019.
[67] C. Chang, "Measuring density and porosity of grain kernels using a gas pycnometer," Cereal Chem, vol. 65, no. 1, pp. 13-15, 1988.

90
[68] S. D. Salman and Z. B. Leman, "13 - Physical, Mechanical and Ballistic Properties of Kenaf Fiber Reinforced Poly Vinyl Butyral and Its Hybrid Composites," in Natural Fibre Reinforced Vinyl Ester and Vinyl Polymer Composites, S. M. Sapuan, H. Ismail, and E. S. Zainudin Eds.: Woodhead Publishing, 2018, pp. 249-263.
[69] T. Starr, Pultrusion for engineers. Elsevier, 2000.
[70] D. Corning, "Dow Corning Class VI Elastomers (C6-135, C6-150, C6-165, C6-180) Parts A & B," Dow Corning, 51-0998D-01, 2005.
[71] T. Seckold, S. Walker, and T. Dwyer, "A Comparison of Silicone and Polyurethane PICC Lines and Postinsertion Complication Rates: A Systematic Review," The Journal of Vascular Access, vol. 16, no. 3, pp. 167-177, 2015, doi: 10.5301/jva.5000330.
[72] C. LLC, "Texin RxT90A Technical Data Sheet," 2017.
[73] A. Murphy and M. A. Morgan. "Comet-tail artifact." https://radiopaedia.org/articles/comet-tail-artifact-3?lang=us (accessed.
[74] A. Murphy and M. A. Morgan. "Reverberation artifact." https://radiopaedia.org/articles/reverberation-artifact?lang=us (accessed.
[75] A. Murphy and M. A. Morgan. "Twinkling artifact." https://radiopaedia.org/articles/twinkling-artifact?lang=us (accessed.
[76] J. N. NACEY, A. G. S. TULLOCH, and A. F. FERGUSON, "Catheter-induced Urethritis: a Comparison Between Latex and Silicone Catheters in a Prospective Clinical Trial," British Journal of Urology, vol. 57, no. 3, pp. 325-328, 1985, doi: 10.1111/j.1464-410X.1985.tb06354.x.
[77] M. Borow and J. G. Crowley, "Evaluation of Central Venous Catheter Thrombogenicity," Acta Anaesthesiologica Scandinavica, vol. 29, no. s81, pp. 59-64, 1985, doi: 10.1111/j.1399-6576.1985.tb02329.x.

91
Appendix A
A.1 Fluorescent Coated Particle Fabrication
As glass microparticles would prove difficult to directly image under light
microscopy, due to their translucent nature, a fluorescent coating was used for early
development of extrusion parameters. Fluorescent powdered dye was dissolved in
acetone at a 1mg per mL ratio. Five milliliters of solution were added to a glass vial,
and a gram of microparticles added in, before being stirred at low speed for ten
minutes. The mixture was then poured through a 2.7µm pore size filter (Whatman),
and particles washed with dI water to separate them from the filter and back into a
vial. Particles were dried at room temperature, and the coating and filtering
procedure repeated two to three more times, or until fluorescent response reached
desired intensity.
Figure A.1: Fluorescent coated particles within an extruded polyurethane catheter
under blacklight.