echoes - illinois institute of technology
TRANSCRIPT

euantitative grain size evaluation using ultrasonic backscattered
echoesJafar SaniieDepartment of Electrical and Computer Engineering, Illinois Institute of Technologt, Chicago, Illinob
60616
Nihat M. BilgutaYDepartment of Elecirical and Computer Engineering, Drexel Uniuercity, Philadelphia' Pennsyluania 19104
(Received l1 August 1985; accepted for publication 2 september 1986)
Grain size characteizztion using ultrasonic backscattered signals is an important problem in
nondestructive testing of materials. In this paper, a heuristic model which relates the statistical
characteristics of the-measured signal to the mean ultrasonic wavelet and attenuation
coefrcient in diferent regions of the sample is investigated' The losses in the backscattered
signal are examined .rrit! tr-poral averaging, correlation,-and probability distribution
functions of the segmentJa aata. Furthermore, homomorphic processing is used in a novel
application to estiiate the mean ultrasonic wavelet (as it propagates through the sample) and
the frequency-dependerrt attenuation. In the work presented, heat-treated stainless steel
samples with various grain sizes are examined. The processed experimental results support the
feasibility ofthe grairisize evaluation techniques presented here using the backscattered grain
signal.
PACS numbers: 43.20.Fn, 43'35'Cg, 43'35'7x'
INTRODUCTION
The importance of grain size estimation T s a means of
determining the structural and mechanical properties of ma'
terials, as well as for controlling the manufacturing toler-
ances during fabrication ofmetal and ceramic parts, has long
been recognizedby industry' The literature survey indicates
that ultrasonic evaluation of grain size is the most practical
and widely used nondestructive technique in current manu-
facturing applications. Two major ultrasonic grain size esti-
mation techniques have been developed in recent years
which have met with a reasonable degree of successr-ro: (i)
techniques based on attenuation measurements; and (ii)
techniques based on scattering measurements'Attenuation measurements led the way in the develop-
ment of ultrasonic grain size estimation techniques early on'
The scattering measurement techniques, which require con-
siderable signal processing, have only appeared in recent
years. HowJver, with the increasing availability of powerful
and cost-efective data acquisition and computing capabili-
ties, scattering measurements are fast becoming the trend in
ultrasonic grain size estimation.Most siudies dealing with nondestructive grain size esti
mation have been based on attenuation measurement tech-
niques using a transmission or reflection mode testing' A
number of early studies examined the correlation between
attenuation and material characteristics based on the decay
of the pulse amplitude using reflections received from the
back surface of a sample consisting of two parallel sur-
faces.r-3 Grain size estimation techniques based on attenu-
ation measurements have several limitationsa: (i) Flat and
parallel surfaces are essential for accurate measurements in
order to avoid complex corrections; (ii) since the attenu-
ation coefficient represents an average value over the total
sound path, local variations which can greatly alter the at-
tenuation coefficient cannot be evaluated; and (iii) attenu-
ation measwements are sensitive to the coupling between
the transducer and sample, which can lead to losses even
greater than the attenuation in the material.Despite the above factors, attenuation measurement
techniques find wide use in practical applications since they
provide an integrated estimate for the grain size in a relative-
iy simple fashion. These techniques allow samples with dif-
flrent microstructure to be quickly analyzed and qualitative'
ly characterizeil when experimental conditions are carefully
maintained.More recently, * alternative approach using back-
scattered echoes from grain measurements (i.e', scattering
measurements) hff been utilized to determine the attenu-
ation in materials with respect to depth or frequency' The
direct characterization ofthe backscattered signal yields in-
formation pertaining to variations in the scattered energy as
a function ofdepth and, hence, the grain size distribution'These techniques can be applied to samples which result in
grain boundary echoes that are visible above the received
ioise level (i.e., for large grained samples and/or for high
SNR systems).Some of the earlier work in grain size estimation using
ultrasonic scattering measurements was performed by
Beechmans and Fay.6'7 Based on the principle that ultra'
sonic waves traveling in solids are subject to scattering and
absorption losses, Fay was able to demonstrate that the at'
tenuation ofbackscattered echoes with depth is related to the
average grain size of the specimen. Goebbels er c/'a'8'e altered
and refined Fay's technique to more accurately determine
the amplitude of the backscattered echoes with respect to
d6pth by utilizing various averaging techniques, namely,
1816 J. Acoust. soc. Am.80 (6), December 1986 oool-4966/86/121816-09$00.80 O 1986 Acoustical society of America 1816

spatial, directional, and frequency averaging.In the previous work summarized above, the most
promising grain size characteization techniques have beenbased on information obtained from a relatively large regionof the sample as necessitated by ensemble averaging. Ourobjective is to evaluate grain echoes using a single l-scanrather than to average multiple measurements obtained bychanging the position, orientation, or frequency ofthe trans-ducer.s'e The singlel-scan is more practical and efficient forultrasonic testing. In fact, in some sjtuations, the geometry
of the object interferes with or prohibits the use of multiplemeasurements. Furthermore, if the penetration of the ultra-sonic energy is position or orientation dependent, an assess-ment of this variation is necessary and musi be compensatedprior to averaging. Finally, and most importantly, the use ofa single measurement reveals information confined to asmaller region of the sample relative to the average of muiti-ple measurements, which displays integrated informationpertaining to a broader region of the sample. With this inmind, the paper focuses on the methods for evaluating grainsize by coupling a mathematical model ofbackscattered ech-oes with suitable digttal signal processing techniques. Thebackscattered grain signal is represented by a heuristic mod-el based on the mean ultrasonic wavelet and the grain char-acteristic function. Various methods have been applied inorder to assess losses in the backscattered signal. The grain
signals were evaluated quantitatively using both time andfrequency domain processing techniques. In particular, ahomomorphic processing technique was used in a novel ap-plication to estimate frequency-dependent attenuation.
I. GRAIN BACKSCATTERING COEFFICIENTS
The ultrasonic wave traveling through solids is subjectto scattering and absorption which results in energy losses asthe wave advances. The intensity of scattering is a nonexpli-cit function of the average grain diameter, ultrasonic wave-length, inherent anisotropic character of the individualgrains, and the random orientation of the crystallites.rr-raThe overall frequency-dependent attenuation coefficienta(l) is defined as
a ( . f ) : a " A + d , A , ( l )
where a"(fl is the scattering coefficient and ao(fl is theabsorption coefficient. The scattering formulas have beenstudied and classified into distinct scattering regionsr'rr-rraccording to the ratio of the sound wavelengthZ to the meangrain diameter D. These scattering regions include: the Ray-leigh region, where the sound wavelength is large comparedto the mean grain diameter; the stochastic region, where thewavelength is comparable to the mean grain diameter; andthe ditrusion region, where the mean grain diameter isgreater than the wavelength.
In the Rayleigh region, the scattering coefficient varieswith the average volume of the grain and the fourth power ofthe wave frequency, while the absorption coefficient in-creases linearly with the frequency. r'-t3 Therefore, the totalattenuation coefficient of ultrasound in the Rayleigh regionis expressed as
a( - f ) : a r f l a rD3f , A22r rD, Q)
1817 J. Acoust. Soc. Am., Vol.80, No.6, December 1986
where a, is the absorption constant, d. is the scattering con-stant, and/is the transmitted frequency. In the stochasticregion, where the wavelength is approximately equal to themean grain diameter, the scattering coefficient varies linear-ly with the mean grain diameter and, as the square of thefrequency,
a(J) : brf + b2Df2, D <1<2trD, (3)
where b, represents the absorption constant due to the elas-tic hysteresis loss, and 6. is the scattering constant. When thewavelength is smaller than the average grain diameter, thescattering coefficient is independent of the frequency andvaries inversely with the average grain diameter:
a (h : c r f + c r /D, 1<D, (4 )
where c, is the absorption constant and c, is the scatteringconstant. In the difusion region, where the average grainsize is large compared to the wavelength, the attenuationcoefficient becomes
a(J) : @rf * dr-f') + dr/D, )'<D, (5)
where d, and d, represent the absorption constants due tothe elastic hysteresis and the thermoelastic losses, respec-tively, and d, is the scattering constant.
The Rayleigh scattering region, where multiple reflec-tions between the grain boundaries are negligible, is of pri-mary concern in the present experimental applications. Forthis region, Papadakisr3'ra presents scattering coefficient for-mulas for both cubic and hexagonal crystals, relating thescattering coefficient to the acoustical properties of the ma-terial.
II. HEURISTIC MODEL OF BACKSCATTERED SIGNAL
The attenuation of the ultrasonic wave is caused in partby the scattering characteristics ofgrains. This scattered en-ergy propagates in all directions in a random fashion. In thepulse-echo mode operation used here, we are interested inevaluating the backscattered signal (scattering of 180'rela-tive to the direction of transmission ) . The received signal attime z is due to scatterers in the material at a distance ofCr/2,where Cis the propagation velocity of sound (shear orlongitudind) in the medium. Since the scatterers (i.e.,grains) are stationaiy, the amplitude of a detected signal at afixed time after transmission of a pulse will be constant forfixed transducer position and frequency.
Let us assume that the received signal is due to alargenumber of statistically independent scattering centers inwhich the sound wavelength is significantly larger than thesize of the scatterers (i.e., Rayleigh region). Furthermore, itis assumed that the scatterers (i.e., grains) are located in thefarfield ofthe transducer, and the incident wave is a pulsedplane wave propagating into the bulk material. The beamspreading over a small range within the material is consid-ered to be insignificant, and the beamwidth is assumed to bemuch larger than the grain size. Under these assumptions,the backscattered sigaal is dominated by the sum of echoesreflected from randomly distributed incoherent scat-terers. l5't6
The measured signal r(t) c n be segmented into fixedtime intervals, r, (l) corresponding to fixed spatial intervals
J. Saniie and N. M. Bilgutay: Grain size €valuation 1817

lo,II
. 2. l
S R O A O - S A N Of R A N S D U C E R
r r r ' ( t )
FIG. l. A sample under ultrasonic testing for grain size estimation using
backscattered echoes. (a) A typical backscattercd grain sigaal correspond-
ing to regionT andj + l; (b) segmented model of the backscattered grain
signal.
( i . e . , A d : d i * t - d i )
Fig. l ) :q
r ( t ) : 11( t ) ,; - t
within the sample (for claritY see
where rr(r) represents the signal corresponding to thelh
region and g is the number of regions. RegionT should typi-
cally correspond to a segment of the sample which does not
exhibit strong isolated reflectors nor show any influence by
the front and back surfaces. In addition; the segment size
should be much larger than the average grain size D. For a
given regiony, the measured backscattered echoes form a
composite signal which may be modeled as r7'r8
Nt
r,(t) : 2rno,@,(t
- r*)l; i :0,1,2,.--,4' Q)
where r*, is a random variable representing the detectiontime of random echoes such that
Mr/C <ru, <2di*t /C. (8)
The term (ut (t)l represents the mean shape of the echo ( i.e.,impulse response or wavelet) within thelh region of the5ample. The shape of this function is governed by the trans-fer functions of the ultrasonic pulser, transmitting and re-ceiving transducers, amplifier, and the variable propagationpath characteristics. Since tle measuring system character-istics are fixed, any change in the ultrasonic wavelet is indic-ative of the acoustical properties of the propagation path.The amplitud e A, in\. ( 7 ) is a random variable represent'ing the average reflection coefficient ofscatterers in a regionfrom which echoes are detected after a d elay of r *t , Hete, A ptis dependent on the scattering cross section, elastic constant,ultrasonic velocity, and the density of the adjacentgrains. r I'rs'r6 The term .ff, is a random variable representingthe total number of scatterers in regioni. The minor interfer-ence effect from the grains in the adjacent segments is con-sidered to be negligible. Furthermore, due to the effect offrequency-dependent attentuation, the relationship amongthe mean wavelet in different regions can be represented asrT
1 8'l I J. Acoust. Soc. Am., Vol. 80, No. 6, Oscember 1986
(u i * r (a r ) ) : e - 2 l4 r (@) - 6@' �1^d
$ I r (o t ) ) ,
where
a : 2 r f , A d : d i * , - d j ,
F(a) : oi lC, t : l f :T.
( l0)
The term a, (ot) is the attenuation coefficient due to scatter-ing and absorption, and (U, (ar ) ) is the Fourier transform ofthe mean ultrasonic wavdet.
It is appropriate to point outthat Eq' (7) by no meanscorresponds to the individual grain size or its exact positionin the propagatibn path. However, this is a heuristic model ofthe composite characteristics of the received signal whichinherently contains information related to the acousticalcharacteristics ofthat given region. Therefore, it can serve asa source for the systematic investigation of grain size distri-bution. The variation in the backscattered signal is partiallyrelated to the grain size. Hence, the interference pattern ofEq. (7) contains information which yields the average grain
size and possibly the grain size distribution. Furthennore,(u,(t)) differs from one segment of data to another as thewave travels through the sample, since the high'frequencycomponents attenuate at a faster rate than the lower frequen-cy components [for clarification of this statement, see Eqs.(2) and (9) l. Therefore, determination of (2, (r) ) by meansof signal processing has the potential of providing a measureof the mean grain size distribution. In general, the echo(ur(t)) can be approximated as a timelimited rf echo withGaussian envelope:
(u, (t)l =Pie "/'4 cos(art) .
The frequency spectrum of (2, (t) ) is
(U,(a) l nP,e-4@-' '>" ' ' a)0'
where the conditions
ai loi i Pi lPi ; wheni>7>1
(e)
( 6 )
( 1 1 )
(12)
( 13 )
generally hold. The aszumption that (ut(t) ) is Gaussian inshape for allT is too restrictive and may not be precise. Evenso, an optimal Gaussian model can always be fitted to theecho shape if no strict limit on the error function is enforced.Inspection of Eq. (9) reveals that materials act like a low-pass filter and their transform functions are inversely pro-portional to frequency. Therefore, it is more appropriate torewrite the conditions given in Eq. ( 13 ) in terms of the meanfrequency (a,)'ard the wavelet power (P, ) as follows:
(atl>(a,); P1)P'; when i>71 l. ( 14)
Upon estimation of the mean ultrasonic wavelet, it is possi'ble to find the frequency-dependent attenuation coefficient.The magnitude spectrum of Eq. (9) can be defined as
l (u i * r (ar) ) | : " -2e,(otLd | ( u , (ar) ) | ( 1 5 )
From above, the attenuation function ai(a) can be ex-pressed as
ai tut) : I logl ( U; (ar ) ) | - loel ( 4 *, (ar ) ) | ] /2Ld'( 16 )
J. Saniie and N. M. Bilgutay: Grain size evaluation 181 I

III. DIGITAL PROCESSING OFTHE BACKSCATTERED
SIGNAL
The primary objective of this work is to develop appro-
priate aigital processing techniques to evaluate materials of
different grain sizes. The principle for the various methods
d i scussed i sbasedonEqs . (2 ) , ( 7 ) , ( 9 ) , ( l l ) , and (16 ) 'The
signal processing techniques are categorized within three
aiitinci groups: time domain analysis, frequency domain
analysis, and homomorphic processing'r7
A. Time domain analYsis
Time domain analysis consists of the following tech-
niques: the smoothing process, constructing the histogram
ofthe backscattered signal, and estimating the autocorrela'
tion function.The smoothing process is a simple and practically effi-
cient technique for characteizing random signals such as
the backscattered echoes from large grained materials' In
fact, for homogeneous and isotropic materials, the concept
of ensemble averaging has been used earliera'5'ro to obtain
similar results. The grain signal is a stochastic process in
which randomness is inherent to any single measurement'
Consequently, temporal fluctuations contain equivalent in-
formation to the random spatial fluctuations. Therefore, it is
appropriate to determine the statistical parameters (e'g''
mean and variance) of the process from a single measure-
ment, which is far more practical than using multiple mea'
surements. In general, this is a valid approach for stationary
random processes for which time averages are identical to
their ensemble averages (i.e., ergodic processes).te
Temporal averaging is a linear operation and can be rep-
resented as
function can be obtained by constructing the histogram ofthe rectified instantaneous signal amplitude from a giventime segment. In the histogram analysis, parameters such asmean, mode, standard deviation, and skewness are consid-ered.
Finally, for the purpose of completeness, the autocorre'lation function of the measured grain signal was investigat.ed. The autocorrelation function is defined as
7 ( t ) : 7 ( t ) * h ( t ) , ( l 7 )
where 7 ( r ) is the measured signal after rectification and & ( t )is the smoothing function defined as
R-(t) : L[" ' r {r)r(r - t )dr ,
R, (ar) : Gi (a) (Ut(at ) | ,
whereNj
G,(ot) - lAore-t"*t
is the Fourier transfonn of the grain characteristic functionfor regionT. The magnitude of (Ut(a)) is a smooth Gaus-sian shaped function. However, the term lGt(ot) | containsmany peaks and valleys which are random. This term modu-lates and distorts the magaitude spectrum of (U1@)),
which also bears features related to frequency-dependent at-
tenuation characteristics of the material. Recovery of the
true ( U, (ar) ) from the measured R,(ot) is difficult, and thepossibliiy of larg6 error in its estimation cannot be ruled out(the technique of echo recovery and its evaluation is thesubject ofSec. III C). Therefore, one needs to characterizethe sample b y R, (ot) without having to determine (U, (a)) -
Partial identification of l.R, (ar) | can be obtained by mo-ments. In this study, for the purpose of emphasizing ordeemphasizing certain behavior of the magnitude sPectrum,the following generalized definition for momentsrT is given:
Mxr: Io-
r*lR1itat) lLda,
(2r)
(221
(23)
when Z : I and K is a positive integer, then M r* is the K thmoment of the magnitude spectrum according to the com-mon definition of moments. In general, K urd L can be anyreal number. The usefulness of the above equation becomesapparent only if it shows enough sensitivity to an unknownphysical characteristic such as the grain size. The larger the
J. Saniie and ru. M. Bilgutay: Grain size evaluation 1819
(20)
where Al is the duration of correlation. In general, this func-tion responds to any possible periodicity in a structure bydisplaying strong peaks. However, it is necessary to pointout that the autocorrelation function was found to be oflittlevalue since grains exhibit no periodicity.
B. SpectralanalYsis
Spectral analysis is a useful technique in which certainfeatures hidden in the time domain can be displayed. Thesefeatures are basically related to the presence or absence ofenergy in specific bands. In this section, the spectral methodbased on the magnitude spectra of grain characteristic func-tions is discussed.
The spectrum of the measured data corresponding to agiven segment can be obtained by Fourier transformingEq. (7):
I r /e l t l<e/2,l ( t ) :
lo ehewhere.
The smoothed output is then defined as. . t + E / 2
7gy: |
| lG)dr.€ J t - e r z
( l 8 )
( 1e)
Determination of an appropriate e is quite important in theperformance of a smoothing operation' The results of thisstudy show that e on the order of l0.0ps (which is equiva-lent to 50 wavelengths for a 5-MHz transducer) provides anexponentially decaying function which is sensitive to grain
size variations.Constructing the probability density function of the rec-
tifed received signal amplitude, which is inherently relatedto the distribution of grains in a given region, is a usefulmethod for evaluating materials of different grain sizes. Themost appropriate method for accomplishing this task is touse many statistically independent measurements. This canbe achieved by changing the orientation ofthe transducer foreach measurement. From these measurements, the probabil-ity distribution function can be constructed at each time in-stant. Alternatively, if we assume ergodicity, the distribution
'1819 J. Acoust. Soc. Am., Vol. 80, No. 6' December 1986
K, the more weight is given to the higher frequencies of themagnitude spectrum. On the other hand, for smaller r( val-ues, the contribution of low-frequency components to thevalue of M *, is significant relative to higher frequency com-ponents.
The index .L acts quite differently from index r(. Forlarge values ofZ, peaks of l.R, (ar ) | will have a greater contri-bution to the value of M*r.In contrast, if Z becomes verysmall, there will be minimum variation in the moment valuesdue to variation ofpeaks. It is necessary to point out that, forrandom peaks such as those in the case ofgrain signals, theexact usefulness of generalized moments is not clear. How-ever, empirical evaluations will be the basis for determiningits capability.
Equation (23) must be normalized in order to be inde-pendent of amplitude variations in the measurements. Thiscan be achieved bv
(24)
w h e n K : I a n d L : 2 ,
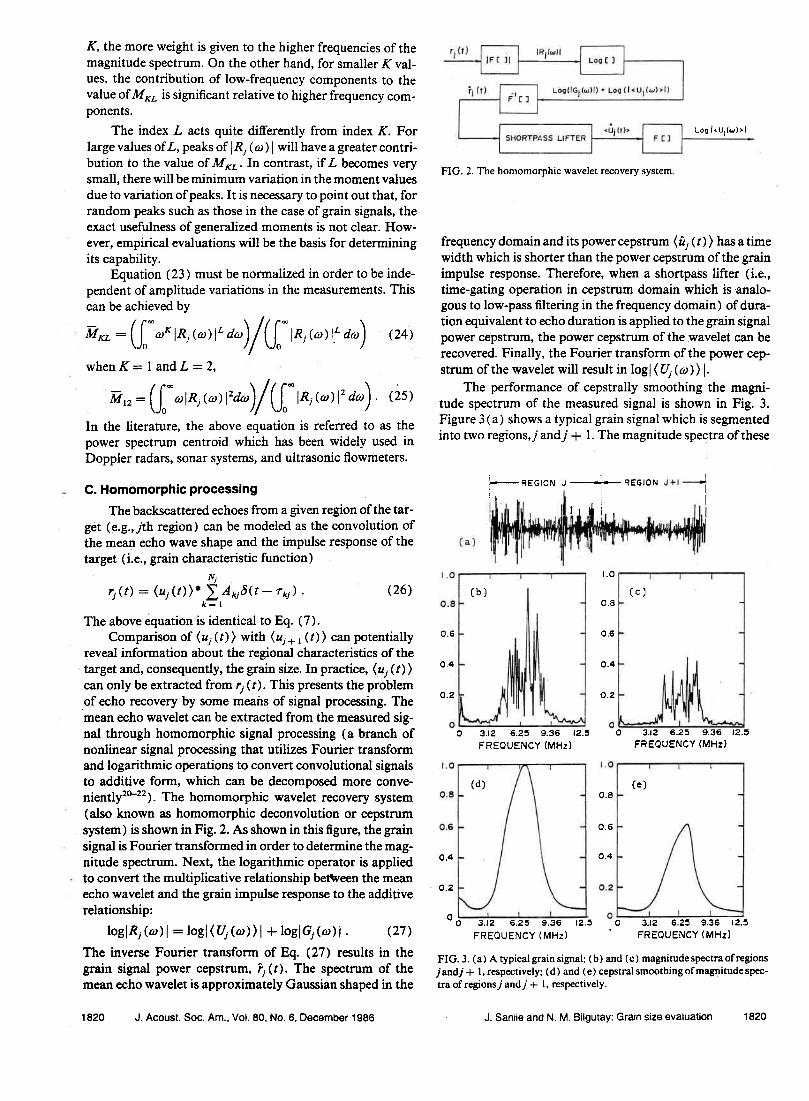
FIG. 2. The homomorphic wavelet recovery system
frequency domain and its power cepstrum \tq G) ) has a timewidth which is shorter than the power cepstrum of the grainimpulse response. Therefore, when a shortpass lifter (i.e.,time-gating operation in cepstrum domain which is analo-gous to low-pass filtering in the frequency domain) of dura-tion equivalent to echo duration is applied to the grain signalpower cepstrum, the power cepstrum of the wavelet can berecovered. Finally, the Fourier transform ofthe power cep-strum of the wavelet will result in logl (U,(a))|.
The performance of cepstrally smoothing the magni-tude spectrum of the measured signal is shown in Fig. 3.Figure 3(a) shows a typical grain signal which is segmentedinto two regions,Tandl * l. The magnitude spectra of these
-M*,. : U"-,.1R,
(a,) I' o,) / U" lR, (ot) l: d,)
F- nEcrorrrl r
JI
, lI r t l , ,
R E G I O N
o.6
A A
o.6
o.4
o .2
o.4
o .2
o.4
o.2
o 3. t2 6.?a 9.35 t2.3FREQUENCY (MHz)
o.E
oo '
FIG. 3. ( a ) A typical grain signal; ( b ) and (c ) magnitude spectra of regionsj andj + l, rcspectively; (d ) and (e) cepstral smoothing of magnitudc spec-tra ofregionsT andT + I, respectively.
J. Saniie and N. M. Bilgutay: Grain size €valuation 1820
L o q l < u j ( @ ) > l
tu,,:(I-,,., @)fo,)/ U"- 1R, {,) f d,) . lzstIn the literature, the above equation is referred to as thepower spectrum centroid which has been widely used in
Doppler radars, sonar systems, and ultrasonic flowmeters.
C. Homomorphic processing
The backscattered echoes from a given region ofthe tar-get (e.g.,lh region) can be modeled as the convolution oft}re mean echo wave shape and the impulse response of thetarget (i.e., grain characteristic function)
NJ
r j ( t ) : (u , ( t ) l * >Ak j6 ( t - rx i ) .
k : I
(26)
The above equation is identical to Eq. (7).Comparison of (u1G)l with (zr*, (t)) can potentially
reveal information about the regional characteristics ofthetarget and, consequently, the grain size. In practice, (ui U)lcan only be extracted from 1 (r). This presents the problem
.of echo recovery by some meais of signal processing. Themean echo wavelet can be extracted from the measured sig-nal through homomorphic signal processing (a branch ofnonlinear signal processing that utilizes Fourier transformand logarithmic operations to convert convolutional signalsto additive form, which can be decomposed more conve-niently2c22). The homomorphic wavelet recovery system(also known as homomorphic deconvolution or cepstrumsystem) is shown in Fig. 2. As shown in this figure, the grainsignal is Fourier transformed in order to determine the mag-nitude spectrum. Next, the logarithmic operator is appliedto convert the multiplicative relationship bettueen the meanecho wavelet and the grain impulse response to the additiverelationship:
loglRr(ar) l : logl(U,(ol) l l -p loglGr(ar) l . (27)
The inverse Fourier transform of Eq. (27) results in thegrain signal power cepstrum, 1(r). fne spectrum of themean echo wavelet is approximately Gaussian shaped in the
1820 J. Acoust. Soc. Am., Vol. 80, No. 6, December 1986
o . 6
3.t2 6.25 9.36 t2.3 0FREOUENCY (MHz)
o 3.t2 6.25 9.36 12.5FREQUENCY (MHz)
3. t2 6.25 9.36 t2.3FREOUENCY (MHz)
( b )
( d ) ( e )

two regions are shown in Fig. 3(b) and (c)' The nonlinear
pro"rriirrg discussed above is applied to obtain the magni'
tud, sp""itum as shown in Fig. 3(d) and (e)' Further, the
recouered magnitude spectrum of the wavelets are used to
estimate the frequency'dependent attenuation as described
in Eq. ( 16) '
IV. EXPERIMENTAL PROCEDURE
The object of this work is to evaluate the grain size vari'
ation in solids when other physical parameters (e'g', crystal
shape, elastic constants, density, and velocities) remain con'
stant. These assumptions allow us to accurately interpret the
measurements resulting from the grain size variation' In this
study, 2-in.-diam stainless steel rods (type 303) were heat
treaied to obtain various grain sizes. The stainless steel (SS)
samples initially had a mean grain size of abott25 p' Empiri-
catly, it was found that grain size does not change signifi-
cantly by heat treatment for temperatures below 1300'C'
However, temperatures between 1300"C and 1400'C will
change the grain size several fold. The stainless steel samples
were heat tieated for roughly t h. After completion of the
heat treatment process, the samples were quenched in water
bath.Micrographs of the heat'treated samples are shown in
Fig. 4. The grain size of the heat'treated samples was ana-
lyzed by the intercept method,23 which resulted in microgra'
phic grain size estimates of 86 and I 60 p for the I 350'C and
ilgz;C t"-ples, respectively' The grain size estimates given
here correspond to the average grain boundary spacing'
However, in the literature, calculations related to scattering
are often based on the average grain diameter' A linear rela'
tionship exists between the two definitions,r given by
D : ki where D is the average grain diameter, Z is the aver-
age grain boundary spacing (intercept method), and ft is a
*rrtt"ot multiplier with approximate values between 1'5
and2.25, depending on the grain shape' This clearly shows
that the averagegrain diameter is an ambiguous term unless
the grain shape is known, which is rarely the case' Therefore,
it is preferable to define 4" St"io size in terms of the average
grain boundary spacingZ. However, the average grain diam'
iter may be approximated as twice the average grain bound'
ary spacing for comparison purposes. Using a factor of two,
thl average grain diameters for SS, SS at 1350'C, and SS at
1387'C are 50, 172, arrd32O 1't, respectively'The experimental grain signal measurements were ac-
complishedusing a Gamma type transducer-manufacturedby K-B Aerotech with approximately a 6'MIIz center fre-
qrr.t "y and a 3-dB bandwidth of approximately 1'5 MHz'
it is tiarrsaucer exhibits a high sensitivity which allows it to
detect echoes from greater depths in the sample' The trans-
ducer is excited by a pulser generating pulses of width on the
( b )
R E G I O N J - F ( E u l u l l J + l + l
R A N G E ( 5 . 6 c m )
FIG. 5. Grain signal from stainless steel samples'
J. Saniie and N' M. Bilgutay: Grain size evaluBtion 1821
FIG. 4. Micrographic results of stainless steel samples. (a) Stainless steel
sample (sS) without heat treatment; (b) stainless steel sample heat treatcd
at tjSO "C (SS-1350); and (c) stainless steel sample heat treated at 1387'C
(SS- 138? ). The average grain diameter for SS, SS:1350, and SS-1387 are 50'
172, and 32O pm, resPectivelY.
1821 J. Acoust. Soc' Am., Vol.80, No 6, December 1986
+--"..-=+r.i'.'i""l

\\
\
\ - \
ss - 1387s s - | 3 5 0
r . o o
o .85
2 1 1
2 .5 3.O
2 .5
o . t 3 9
o . to4
o.o69
o . r 8 6
o .139
o.o92
o.o46
o.o l . o r . 5 2 .O
R A N G E ( C M )
l .o 1.5 2-o
R A N G E ( c m )
r . o 1 . 5
R A N G E
2.5
o .85\I..t'Jr\-^\\
\
--- sss s - l 3 5 c
2 . 3 2 do.o
FIG. 6. Temporal averaging ofstainless steel grain signals'
o.750
o.500
o.250
o. r50
o . i l 3
o.o75
o.o37
o
o.o o.2 o.4 o.8
o.o o.2 o.4 0.6 o.8 t . o
FIG. 7. Envelope of autocorrelation functions of stainless steel grain sig-
nals.
1822 J. Acoust. Soc. Am., Vol.80, No.6, D€cember 1986'
FIG. 8. Histogram of backscattered grain signals' Solid lins rcgron j'
dashed line: rcgionT * I'
order of a few nanoseconds. The reffected echo is amplifed
by a broadband rfreceiver. The pulse repetition rate is about
2b0 pulses per second which prevenb any range ambiguity'
A range gate enables the selection of a-particular segment of
O" tenectea signal for processing. Tte measured data are
sampled at 50 MHz using a Biomation 8100 transient re-
"otd-"t. Each experimental data set contains 1024 points
which is equivalent to 20.48 ps. Coherent averaging is ap-
plied in ord-er to enhance the signal-to'noise ratio (SNR) of
ih" -"*ut"ment. Measurements are performed using the
contact method in which the transducer is acoustically cou-
pled to the sample with couplant jelly' The measured signal
consists only of grain echoes from the bulk material, exclud-
ing any sample boundary echoes. Figure 5 shows typical
J. Saniie and N. M. Bilgutay: Grain size €valuation 1822
2.O
(cm)
o . 5 0 0
o . 2 3 0
o.5 t .o 1 .5 2 .O'
R A N G E ( c m )
; l
i L .
n i| |
'-1
I ll - - ' l
I q i
L..r
s 5 - r 3 5 0
L..tL J - 1
fI
-J
IL-trJ
III
J
s s - 1 3 8 7
fII
I IJ
t.]
II
. - - - sss s - 1 3 5 0
v1. nn r^ufr.r4
o
s s - 1 3 8 7s s - 1 3 5 0

TABLE I. Statistical parameters corresponding to the histograms ofgrain signals.
ss- I 387Regionj RegionT + I
ss- I 350Regionj RegionT* I
ssRegionT RegionT* I
0.290.200. l50.63
grain signals from the original stainless steel (SS) sample aswell as the heat-treated samples at temperatures of 1350 "C
(SS-1350) and 1387"C (SS-1387). Although diferencesbetween these composite signals exist, they are not readilyquantifiable.
V. RESULTS AND DISCUSSION
The processing algorithms described earlier have beenapplied to stainless steel grain signals. The grain sigaalsshown in Fig. 5 are time averaged, resulting in plots shown inFig. 6. Time averaging is obtained by a smoothing function
[see F4s. (18) and (19)] which is rectangular and has aduration of lO.24,as. The resulting smoothed function isnormalized such that its initial amplitude is unity. Since SS-1350 and SS-1387 have larger grain sizes than SS, variationin their decaying characteristics is also apparent. It is as-sumed these signals decay exponentially, governed by theattenuation resulting from scattering at the grain boundar-ies. This attenuation coefficient (referred to as the apparentattenuation coefficient) can be obtained by a simple linearregression model between the log of the smoothed functionand distance. The apparent attenuation coefficients for SS,SS-1350, and SS-1387 are 0.027,0.061, and 0.054, respec-tively. Results show that there is hardly any noticeable dif-ference between the smoothed results of SS-1350 and SS-1387 although their grain sizes ditrer by almost a factor oftwo. This is possibly due to the fact that the grain size of SS-1387 is slightly above the upper limit of the Rayleigh scatter-ing region (i.e., stochastic region) where multiple scatteringefects can be significant. The overall evaluation of the re-sults obtained in this study demonstrates the feasibility oftime averaging for grain size characterization.
Autocorrelation functions for stainless steel grain sig-nals are presented in Fig. 7. Since no regular pattern or peri-odicity exists in the grain structure of the samples, the enve-lope of the autocorrelation functions reveals no informationabout the grain size or its distribution.
In time domain analysis, an alternative and certainlypractical evaluation ofthe backscattered grain signals is thedetermination of the histograms of the rectified received sig-nal amplitude. Histograms of the segmented stainless steelgrain signals are shown in Fig. 8. In addition, the statisticalparameters of the distributions are shown in Table I.Graphical comparison of these histograms reveals that rela-tive changes between the two regions of the signal depend onthe scattering and attenuation characteristics ofthe grains.For example, due to attenuation, the histograms of region
/ * I for both SS- 13 87 and SS- 1350 display a shift toward thelower amplitudes compared to the histograms of region 7.
1823 J. Acoust. Soc. Am., Vol.80, No.6, December 1986
However, because of the smaller average grain size and cor-respondingly reduced attenuation, the shift in the amplitudedistribution is less apparent for sample SS. Forboth regionsTandT * l, the amplitude distribution of sample SS is clearlybroader than the corresponding distributions of samples SS-1350 and SS-1387, as evident in Fig. 8. Furthennore, evalua-tion of the statistical parameters (i.e., mean, mode, standarddeviation, and skewness), as shown in Table I, especially thevalues of mean and standard deviation, suggests similar con-clusions.
Moment analysis is applied to the magnitude spectra forK : 1,2,3 and L: 1,2,3,4. For the present experimentaldata, careful examination of the moment values reveals thatno specific feature in the magnitude spectrum (e.g., a forbid-den band offrequency or an enlarged frequency component )exists. Therefore, no unusual value is observed (either verylarge or very small) for the moments of higher order ofweighting Isee Eq. (24)).In addition, a noticeable correla-tion exists among moments corresponding to a given datasegment. Therefore, it becomes evident that one moment[e.g., power spectrum centroid; see Eq. (25 ) ] is adequate forquantizing the magnitude spectrum.
Power spectrum centroids ofstainless steel grain signaisare shown in Table II. Relative changes in each data seemminor and inadequate for an appropriate conclusion. Never-theless, it has been observed that the mean frequency of thesignal decreases as the grain size increases. For example, thepower spectrum centroids for SS, SS-1350, and SS-1387 are7.10, 6.85, and 6.60 MHz, respectively. These results sup-port the concept that the expected signal frequency de-creases as grain size increases.
The efect of frequency on the attenuation coefficient inthe stainless steel samples is obtained by cepstrally smooth-ing the magnitude spectrum of the segmented data and ap-plyrng F4. ( 16). These results are presented in Fig. 9. TheSS-1387 sample has the largest attenuation coefficient whichappears to be constant within the 5.5- to 7.5-MHz range, asshown in the figure. The SS-1350 sample shows a relativelyconstant attenuation coefficient and its value is lower thanthe attenuation coefficient of the SS-1387 sample. Finally,the SS sample has grain size well in the Rayleigh region and,
TABLE II. Power spectrum centroids of the stainless steel grain signals.
Entire signal Regionj Region.t * I
ss 7.10ss-1350 6.85ss-1387 6.60
0.340.200 .170.82
0.Mo.250.230.81
MeanModes.d.SK
0.350.500. l8
- 0.83
0.,!00.250 . 1 90.77
0.300.25n l ' )
0.41
6.986.936.65
7.256.876.65
J. Saniie and N. M. Bilgutay: Grain size evaluation

c
;oFzg
trlttrJ
()z
trzl!FF
5 5 - r J d / [ U = J j U S )
SS-1350 (D=172!o)
ss (D=50u)
-o .2ao6 .00 6 .50 7 .OO 7 .50
FREQUENCY (MHz)
FIG. 9. Dependence ofthe attenuation coefficient on frequency in stainlesssteel grain signals.
as expected, has the lowest attenuation coefficient, which
displays a clear dependence on frequency. Present results
clearly support that the attenuation coefficient measured by
the cepstrum technique can be potentially useful in grain size
evaluation. The application of the cepstrum technique tograin size evaluation is a novel approach introduced in this
work for the first time for ultrasonic grain size measure-ments.
vt. coNcLusloNsThe results presented in this paper indicate that various
signal processing techniques can be utilized in ultrasonicgrain size evaluation. Specifically, a new technique is intro-duced for grain size estimation which utilizes homomorphicsigaal processing. All techniques are concerned with remov-ing the randomness in the backscattered signal and extract-ing parameters related to the frequency-dependent attenu-ation coefficient and, consequently, to the grain size.Although we have demonstrated the feasibility of the pro-posed techniques for grain size characteization, the applica-bility and reproducibility ofthe techniques to a broad rangeof large grained materials deserve further investigation.
rE. E. Alridge, "The Estimation of 6rain Size in Metals," in Non-Destruc-tiue Testing, &ited by X. Egerton, Harwell Post-Graduate Series (OxfordU. P., Oxford, 1969).
'�R. L. Roderick and R. Truell, "The Measurement of Ultrasonic Attenu-ation in Solids by the Pulse Technique and Some Results in Steel," J.Acoust. Soc. Am. 23, 267 (1952).
3J. Krautkramer and H. Krautkramer, Llltrasonic Testing of Materials(Springer, New York, 1977).
4K. Goebbels, "Structure Analysis by Scattered Ultrasonic Radiation," inResearch Techniques in Nondesrructiue Testing,editedby R. Sharpe (Aca-demic, New York, 1980).
5D. Beecham, "Ultrasonic Scatter in Metals: its Properties and its Applica-tion to Grain Size Determination," Ultrasonics 4,67-76 (1966\.
68. Fay, "Theoretical Consideration of Ultrasonic Backscattering," Acus-tica 28, 354-357 ( 197 3).
78. Fay, K. Brendel, and G. Ludwig, "studies of Inhomogeneous Sub-stances by Ultrasonic Backscattering," Ultrasound Med. Biol.2, 195-198(r976).
8K. Goebbels and P. Holler, "Quantitative Determination of Grain Size byMeans ofScattered Ultrasound," Proceedings ofthe 8th l4torld Conferenceon NDT (1976), pp. l-7.
eK. Goebbels and P. Holler, "Quantitative Determination of Grain Sizeand Detection oflnhomogeneities in Steel by Ultrasonic BackscatteringMeasurements," in Ultrasonic Mateials Characterization, edited by H.Berger and M. Linzer (National Bureau of Standards, Gaithersburg, MD,1980), Special Publication 596, pp. 67-74.
toS. Kraus and K. Goebbels, "Improvement of Signal-to-Noise Ratio forthe LJltrasonic Testing of Coarse Grained Materials Characterization,"edited by H. Bergerand M. Linzer (National Bureau of Standards, Gaith-ersburg, MD, 1980), Special Publication 596, pp. 551-559.
ttA. Bhatia, "Scattering of High-Frequency Sound Waves in Polycrystal-line Materials," J. Acoust. Soc. Am. 31, l6-23 ( 1959).
r2W. P. Mason and H. I. McSkimin, "Attenuation and Scattering of High-Frequency Sound Waves in Metals and Glasses," J. Acoust. Soc. Am. 19,464473 (1947).
rrE. P. Papadakis, "Revised Grain Scattering Formulas and Tables," J.Acoust. Soc. Am. 37, 703-710 ( 1965).
'oE. P. Papadakis, "Ultrasonic Attenuation Caused by Scattering in Poly-crystalline Metals," J. Acoust. Soc. Am. 37,711-717 (1965).
tsR. C. Chivers, "The Scattering of Ultrasound by Human Tissues-SomeTheoretical Models," Ultrasound Med. Biol. 3, 1-13 ( 1977).
r6P. M. Morse and K. V. Ingard, Theoretical Acoasrr'cs (McGraw-Hill, NewYork .1968 ) .
r7J. Saniie, "Ultrasonic Signal Processing: System Identification and Pa-rameter Estimation of Reverberant and Inhomogenmus Targets," Ph.D.thesis, Purdue University, 1981.
IEJ. Saniie and N. M. Bilgutay, "flltrasonic Grain Size Evaluation of Heat-
treated Stainless Steel Samples," in Reuiew of Prcgress in QuantitatiueNDE, edited by D. O. Thompson and D. E. Chimenti (Plenum, NewYork, 1985), Vol.48, pp. 939-946.
reA. Papoulis, Probability and Stochastic Prucess (McGraw-Hill, New'York. 1965).2oA. V. Oppenheim and R. W. Schafer, Drgr?a I Signal Processing (Prentice-
Hall, Princeton, NJ, 1975).2rT. J. Ulrych, "Application of Homomorphic Deconvolution to Seis-
mology," Geophysics 36, 650-660 ( l97l ).2tD. G. Childers, D. P. Skinner, and R. C. Kemerait, "The Cepstrum: A
Guide to Processing," Proc. IEEE 65, 1428-lM3 (1977).23J. E. Hilliard, "Grain Size Estimation by the Intercept Method," North-
western University, Dept. of Materials Science and Materials ResearchCenter (Internal Report), November 1963.
o.75Q
-o.o50
'1824 J. Acoust. Soc. Am., Vol. 80, No.6, December 1986 J. Saniie and N. M. Bilgutay: Grain size €valuation 1824