ece grc spring 2013 - university of...
TRANSCRIPT

Conference Commitee General Chair Dr. Pauline Markenscoff Technical Committee Dr. Wanda Wosik Chair Sohini Sengupta Dhivya Ketharnath Conference Coordination MyTrang Baccam Monica Sanchez Financial Committee Dr. Steven Pei
ECE GRC Spring 2013
Graduate Research Conference
April 26, 2013
Hilton UH Hotel & Conference Center
University of Houston
Comunications Committee Dr. Bhavin Sheth Nitin Kushwaha Session Judges Dr. Yuhua Chen Dr. Tom Hebert Dr. Amin Khodaei Dr. Wajiha Shireen Dr. Yan Yao Local Arrangements Committee Dr. Ji Chen

i
The 2013 CDC/HEP/GRC gratefully acknowledges generous support received
from our sponsors

i
9 TH Annual Capstone Design and Graduate Research Conference
April 26, 2013
The Hilton UH Hotel & Conference Center Houston, Texas
Program
8:00 - 8:55 am Breakfast and registration, Waldorf Astoria Room 210, Lobby
8:55 - 9:00 am Opening Ceremonies, Plaza Room 247
Opening Remarks by Dr. Pauline Markenscoff, Conference Chair
Welcome to Technical Sessions by Dr. Wanda Wosik
9:00 - 10:00 am Technical Program - Oral Session A, Plaza Room 247
10:00 -10:30 am Remarks
Dr. Rathindra Bose, VC/VP for Research and Technology Transfer
Dr. Badri Roysam, Chairman, ECE Department
10:30 - 10:45 am Coffee Break, Waldorf Astoria Room 210, Lobby
10:45- 11:30 am Technical Program - Oral Session B, Plaza Room 247
11:30- 12:30 pm Lunch, Waldorf Astoria Room 210
12:30 - 1:00 pm Plenary Presentation “Life, Liberty and the Pursuit of Happiness:
Advice on Maximizing Your Impact?” by Dr. Milton Morris, Vice
President of Research and Development of Cyberonics, Waldorf Astoria
Room 210
1:00 - 3:00 pm Technical Program - Poster Session C, Conrad Ballroom
3:00 – 4:00 pm Technical Program - Oral Session D, Plaza Room 247
4:00 - 4:15 pm Coffee Break, Waldorf Astoria Room 210, Lobby
4:15 - 5:00 pm Technical Program - Oral Session E, Plaza Room 247
5:00 - 5:30 pm Elevator Talks by Students, Waldorf Astoria Room 210
5:30 - 6:30 pm Awards Ceremony, Waldorf Astoria Room 210

ii * means Student Presenter.
GRC 2013 TECHNICAL PROGRAM
The Hilton UH Hotel & Conference Center
April 26, 2013
8:00 – 8:55 am Breakfast
8:55 – 9:00 am Opening Remarks in Plaza
Session A: Neural Sensing And Bioengineering Session Type: Oral Time: 9:00 – 10:00 am Location: Plaza Faculty Chair: Dr. Jose Contreras-Vidal
9:00 – 9:15 am AUTONOMIC MARKERS OF VISUAL AWARENESS Ziyang Li* and Bhavin R. Sheth
2
9:15 – 9:30 am INFORMATION PROCESSING BOTTLENECKS OF HUMAN VISUAL SYSTEM D. Huynh*, O. Ekiz, S. P. Tripathy, H. E. Bedell, and H. Ogmen
4
9:30 – 9:45 am FABRICATION OF NEURAL PROBES FOR SIMULTANEOUS IN VIVO OPTICAL STIMULATION AND ELECTRICAL RECORDING IN THE BRAIN M. M. Gheewala*, W.-C. Shih, G. Purushothaman , J. A. Dani, and J. C. Wolfe
6
9:45 – 10:00 am DECODING THE EVOLVING GRASPING STRUCTURE FROM ELECTROENCEPHALOGRAPHIC (EEG) ACTIVITY Harshavardhan A. Agashe*, and Jose L. Contreras-Vidal
8
10:00 – 10:30 am Welcoming Remarks and Addresses in Plaza
10:30 – 10:45 am Coffee Break

iii
Session B: Electromagnetics in Broad Applications Session Type: Oral Time: 10:45 – 11:30 am Location: Plaza Faculty Chair: Dr. David Jackson 10:45 – 11:00 am SCALABLE SPARSE OPTIMIZATION FOR BIG POWER
GRID DATA L. Liu* and Z. Han
10
11:00 – 11:15 am WIRELESS ENERGY TRANSMISSION FOR GEOPHYSICAL APPLICATIONS. Xiyao Xin*, David Jackson, Ji Chen, and Paul Tubel
12
11:15 – 11:30 am AN ANALYSIS OF COPPER SURFACE ROUGHNESS EFFECTS ON SIGNAL PROPAGATION IN PCB TRACES Xichen Guo*, David R. Jackson, and Ji Chen
14
11:30 – 12:30 pm Lunch, Waldorf Astoria Room 210
12:30 – 1:00 pm Plenary Presentation by Dr. Milton Morris, Vice President of Research and Development of Cyberonics, Waldorf Astoria Room 210
Session C: POSTER PRESENTATIONS Time: 1:00 – 3:00 pm Location: Shamrock Faculty Chair: Dr. Ji Chen and Dr. Zhu Han
Session P1: Imaging for Biomedical Applications
QUANTITATIVE PROFILING OF MICROGLIA POPULATIONS USING HARMONIC CO-CLUSTERING OF ARBOR MORPHOLOGY MEASUREMENTS Yanbin Lu*, William Shain, Lawrence Carin, Ronald Coifman, and Badrinath Roysam
34
EXTENDED L-MEASURE: A COMPUTATIONAL APPROACH FOR QUANTITATIVE CELL ARBOR MORPHOMETRY A. Cheong* and B. Roysam
36
COLOR BASED SEGMENTATION OF BRIGHTFIELD MICROSCOPY IMAGES Prithvi B Subrahmanya* and B. Roysam
38

iv
A MACHINE-LEARNING METHOD FOR IDENTIFICATION AND TRACING OF BASAL ASTROCYTE ARBORS IN 3D CONFOCAL MICROSCOPY IMAGES P. Kulkarni*, M. Savelonas, J. Luisi, B. Busse, R. Padmanabhan, V. Somasundar, K. Trett, C. Harris, P. Chong, W. Shain, and B. Roysam
40
QUANTITATIVE ANALYSIS OF HIGH -THROUGHPUT CELL INTERACTION BETWEEN HUMAN NATURAL KILLER CELL AND NALM6, BASED ON MIGRATION PATTERNS AND SHAPE MORPHOLOGY N. Rey*, A. Merouane, I. Liadi, G. Romain, N. Varadarajan, B. Roysam, and L. Cooper
42
SUPERVISED SEED DETECTION USING OVER-COMPLETE DICTIONARIES OF GLIAL ARBORS FOR AUTOMATED TRACING M. Megjhani*, A. Merouane, and B. Roysam
44
NUCLEAR SEGMENTATION FOR WHOLE BRAIN SECTIONS USING ELLIPTICAL KERNELS, STEERABLE FILTERS AND SECOND ORDER GRAPH CUTS Kedar B Grama* and Badrinath Roysam
46
Session P2: Imaging for Sensing GRAPH BASED SEGEMENTATION OF
HYPERSPECTRAL IMAGES Tanu Priya*, Minshan Cui, and Saurabh Prasad
48
HYPERSPECTRAL IMAGE CLASSIFICATION USING INFINITE GAUSSIAN MIXTURE MODELS Hao Wu*, Saurabh Prasad, and Minshan Cui
50
COMPRESSIVE SENSING HYPERSPECTRAL MICROSCOPY, IMAGING AND ANALYTICS Jing Lu* and Wei-Chuan Shih
52
LOCALIZED SURFACE PLASMON RESONANCE IN GOLD NANOISLAND AND NANOPOROUS GOLD SUBSTRATES Szu-Te Lin*, Pratik I. Motwani, J. C. Wolfe and Wei-Chuan Shih
54
FIBER-OPTIC PYROMETER BASED ON BLACKBODY RADIATION Zhuan Zhu*, Hang Yu, Zhihua Su, and Jiming Bao
56

v
Session P3: Neuro-Engineering in Visual Systems
STATISTICAL MODELING OF VISUAL MASKING
Sevda Agaoglu*, Mehmet N. Agaoglu, and Haluk Ogmen 58
ALLOCATION OF VISUAL ATTENTION TO STATIC AND DYNAMIC STIMULI
Fahrettin F. Gonen*, Hamza Hallal, and Haluk Ogmen
60
Session P4: Energy and Power Solutions
DSTATCOM OPTIMAL SIZING FOR WIND FARM
REACTIVE POWER COMPENSATION Venkata Siddartha Dasari* and Amin Khodaei
62
SMART CHARGING STATION FOR PHEVS BASED ON
DC BUS VOLTAGE SENSING P.Goli* and W. Shireen
64
DEVELOPMENT OF A WIND TURBINE EMULATOR BASED ON DSP CONTROL OF INDUCTION MOTOR Shyam Janakiraman* and Wajiha Shireen
66
Session P5: Networking
DYNAMIC OPTICAL PATH SETUP IN DWDM MULTI-
MODE SWITCHING NETWORKS Wenhao Chen*, Lei Wang, Dmitriy Chenchykov, Linsen Wu, and Yuhua Chen
68
Session P6: Materials and Devices at Micro- and Nanoscale
TEMPERATURE EFFECT GROWTH RATE AND
THICKNESS OF GRAPHENE BY CHEMICAL VAPOR DEPOSITION Sirui Xing*, Wei Wu, and Shin-Shem Pei
70
DESIGN TO ENHANCE DEFECT TOLERANCE OF ULTRA THIN MULTIJUNCTION PHOTOVOLTAICS A. Mehrotra* and A. Freundlich
72
STRESS EVOLUTION DURING ANNEALING OF ELECTRODEPOSITED COFENI ALLOYS D.Wu*, N. Dole, P. Abraham, D. Lee, A. Papou, and S.R.Brankovic
74

vi
MONOLITHIC HIERARCHICAL GOLD NANOSTRUCTURES BY COMBINED TOP-DOWN AND BOTTOM-UP NANOFABRICATION Fusheng Zhao*, Jianbo Zeng, and Wei-Chuan Shih
76
OPTIMIZATION OF REACTIVE ION ETCHING TO FABRICATE SILICON NITRIDE STENCIL MASKS IN SF6 PLASMA Prithvi Basu* and Paul Ruchhoeft
78
Session P7: Noninvasive Biosensing, Neural System Prosthetics USING RECIPROCITY TO ESTIMATE THE INDUCED
VOLTAGE FOR PACEMAKER UNDER MRI RF COIL Shi Feng*, Qingyan Wang, and Ji Chen
80
NEURAL CORRELATES OF THE MIRROR NEURON SYSTEM Yu Zhang* and Jose L. Contreras-Vidal
82
RECONSTRUCTING SURFACE EMG FROM SCALP EEG DURING MYOELECTRIC CONTROL OF A CLOSED LOOPED PROSTHETIC DEVICE Andrew Y. Paek*, Jeremy D. Brown, R. Brent Gillespie, Marcia K. O'Malley, Patricia A. Shewokis, and Jose L. Contreras-Vidal
84
NON-INVASIVE BRAIN MACHINE INTERFACE CONTROL FOR ROBOT-BASED STROKE REHABILITATION Nikunj A. Bhagat* and Jose L. Contreras-Vidal
86
Session D: Imaging For Bio- and Nano-Structures Session Type: Oral Time: 3:00 – 4:00 pm Location: Plaza Faculty Chair: Dr. Jack Wolfe
3:00 – 3:15 pm OPTICAL IMAGING BASED NANOHOLE SYSTEM FOR ULTRASENSITIVE BIO-DETECTION. Yanan Wang*, Andrew Paterson, Katerina Kourentzi, Paul Ruchhoeft, Richard Willson, and Jiming Bao
16
3:15 – 3:30 pm FABRICATION OF PLASMONIC NANO-STRUCTURES FOR SURFACE ENHANCED RAMAN SPECTROSCOPY Pratik I Motwani*, Ji Qi,Wei-chuan Shih, and J.C. Wolfe
18

vii
3:30 – 3:45 pm LASER-BASED ACTIVE-ILLUMINATION HYPERSPECTRAL MICROSCOPY WITH MULTI-MODAL IMAGING ANALYTICS Jingting Li* and Wei-Chuan Shih
20
3:45 – 4:00 pm UNSUPERVISED DISCOVERY OF MORPHOLOGICAL PROGRESSIONS OF MICROGLIA ARBORS IN RESPONSE TO IMPLANTED NEUROPROSTHETIC DEVICES Y. Xu*, N. Rey, M. Megjhani, A. Cheong, K. Trett, P. Qiu, W. Shain, and B. Roysam
22
4:00 – 4:15 pm Coffee Break
Session E: Electromagnetics: Nanoparticles, Materials and Devices Session Type: Oral Time: 4:15 – 5:15 pm Location: Plaza Faculty Chair: Dr. Jarek Wosik 4:15 – 4:30 pm ACCURATE CHARACTERIZATION OF NANOPARTICLES
HEATING EFFICIENCY FOR DRUG DELIVERY AND CANCER THERAPY Dhivya Ketharnath*, Rohit Pande, Leiming Xie, Biana Godin, and Jarek Wosik
24
4:30 – 4:45 pm MANIPULATING CELLS WITH A DYNAMICALLY-RECONFIGURABLE ELECTRO-MAGNETIC COIL Ruoli Jiang*, Ben H. Jansen, and Ji Chen
26
4:45 – 5:00 pm STUDYING SURFACE KINETICS USING SURFACE REFLECTIVITY Ela Bulut* and Stanko R. Brankovic
28
5:00 – 5:15 pm
CVD GROWN SINGLE CRYSTAL MOS2 FOR HIGH MOBILITY AND HIGH ON-OFF CURRENT RATIO TRANSISTORS Su-Chi Chang*, Wei Wu, Debtanu De,Yanan Wang, Jiming Bao, Haibing Peng and Shin-Shem Pei
30
5:45– 6:30 pm
Reception and Awards Ceremony in Waldorf Astoria

viii
Plenary Presentation by Dr. Milton M. Morris, Ph.D.
Sr. Vice President, Research & Development, Cyberonics, Inc
Life, Liberty and the Pursuit of Happiness: Advice on
Maximizing Your Impact? We are all born with gifts. The most we can do is use them. I have come to believe that there is no bigger impact to society that we can make with our lives than the one that can be made through the proper leverage of the gifts we’ve been given in doing something that brings us true pleasure and delivers to society a compelling solution to an unmet need. Our individual “greatness” is best expressed at the confluence between our gifts, our happiness and our service to society. While nature gives us the freedom to operate inside of the confluence, many of us have a great deal of trouble finding it – insufficient knowledge of self, ever in pursuit of happiness but rarely in possession of happiness, and too much time spent consumed in self-service. No wonder then that lives with immediately obvious and observable impact seem to be the exception. Bill Gates, Steve Jobs, George Washington, Margaret Thatcher, Mother Teresa, Abraham Lincoln, Dr. Martin Luther King Jr. and more. Each with their respective “greatness” expressed through the transformation of society at a specific point of need – impact. As engineers and research scientists, we are born naturally gifted in math, physics and other hard sciences. We are built to deliver solutions for some of the most enduring unmet needs society faces. Yet, many of us commit chunks of our lives to jobs, corporations, research endeavors, educational programs, and other, that 1) do not optimally leverage our respective gifts, and/or 2) do not elicit passion or excitement, and/or 4) do not address a meaningful unmet societal need. Through this plenary session, we will discuss methods for identifying our own unique gifts, applications of those gifts that could enable a life lived in a state of happiness, and some worthwhile unmet needs in society that are ripe for solution. Maximizing our impact may be as simple as identifying and living within our own personal confluence. We are all born with gifts. The most we can do is use them.

ix
Milton M. Morris, Ph.D. Sr. Vice President, Research and Development Milton M. Morris, Ph.D. joined Cyberonics as Vice President, Research & Development in January 2009. During his tenure with Cyberonics, the R&D organization has developed two human grade implantable pulse generator systems – one system commercialized and the other in human clinical trials, one pre-clinical grade pulse generator system under evaluation with novel intellectual property protected stimulation paradigms, one new pulse generator system with intellectual property protected wireless communication capabilities under development and a novel intellectual property protected non-implantable system capable of detecting seizures for the purpose of event notification and
logging. His R&D team has driven FDA and DEKRA approvals of stronger MRI conditional labeling of the VNS Therapy® systems giving patients and physicians access to faster higher resolution 3 Tesla imaging systems. Under Dr. Morris’ leadership, the Cyberonics R&D team has grown over 300%, hiring top medical device talent with relevant skills in ASIC development, neurophysiology and epilepsy, algorithm development, signal processing, alternative powering, RF communication and development of class III active implantable medical devices. Dr. Morris joined Cyberonics from InnerPulse Corporation, a privately held cardiology-focused medical technology company in the Research Triangle Park (North Carolina), where he had served as Director, Program Management and Operations since November 2007. Earlier, Dr. Morris worked at Guidant Corporation and its successor, Boston Scientific Corporation. Over a period of 11 years, he held several positions, including Principal Senior Research Scientist; Director, Research & Development; and Director, Marketing where he was a franchise leader for both the implantable pacemaker and defibrillator businesses. Prior to joining Guidant, Dr. Morris spent 5 years working as a Research Assistant in the Medical Computing Laboratory at the University of Michigan in collaboration with the electrophysiology group at the University of Michigan hospital and the Michigan Heart and Vascular Institute. During this period, Dr. Morris was awarded fellowships from the National Science Foundation (NSF) and the National Institutes of Health (NIH) in support of his research on the development of novel approaches to low power arrhythmia classification algorithms designed for implantable defibrillators. Dr. Morris is named as an inventor on over 15 patents and an author on 19 peer reviewed publications, book chapters, abstracts and scientific presentations. Dr. Morris has served as an Adjunct Assistant Professor in the Electrical and Computer Engineering department at the University of Minnesota where he taught Control Systems and served on thesis committees. Additionally, Dr. Morris has been a member of the University of Michigan Rackham Dean’s Advisory Board, the University of Houston Biomedical Engineering Industrial Advisory Board, and the Advisory Board for the Weldon School of Biomedical Engineering at Purdue. Dr. Morris holds a Masters in Business Administration from Kellogg School of Management, a Masters and Ph.D. in Electrical Engineering from the University of Michigan and a Bachelor of Science in Electrical Engineering from Northwestern University.

THIS PAGE IS INTENTIONALLY BLANK

1
ABSTRACTS FOR ORAL PRESENTATIONS

2
CHANGES IN THE AUTONOMIC AND CENTRAL NERVOUS SYSTEMS IN RESPONSE TO TRANSITIONS TO VISUAL AWARENESS
Ziyang Li*1and Bhavin R. Sheth1,2
1Department of Electrical and Computer Engineering 2Center for Neuro-Engineering and Cognitive Science
University of Houston Houston, TX 77204-4005
Abstract
Visual awareness, using a number of perceptual paradigms such as binocular rivalry and visual detection, has been studied for decades. Most researches focused on how activation of brain components, in particular, the cortex changes in line with the organism’s level of awareness. However, little emphasis is put on the autonomic nervous system (ANS) in response to transitions to and from awareness. What kind of role the body plays in awareness still remains vague. In this study, we designed a set of visual stimulus paradigms to implement binocular rivalry and visual detection tasks, and applied electrocardiography (ECG), impedancecardiography (ICG) and pupillometry to investigate the activation of two main parts of the ANS - sympathetic and parasympathetic nervous systems. From the analysis of high-frequency (HF) component of heart rate variability (HRV), pre-ejection period (PEP) and pupil size change, our results thus far tentatively indicate that visual detection activates the parasympathetic system and deactivates the sympathetic system. However, perceptual alternations in binocular rivalry deactivate the parasympathetic system. Introduction Binocular rivalry and visual detection are two common tools to probe visual awareness. Most researches on visual awareness are interested in the behavioral analysis and its association with central nervous system, among which, EEG, MEG and fMRI were often used as the techniques. Britz and Pitts (2011) found the three major ERP components during binocular rivalry [1]; Liu et al. (2012) distinguished the seen and unseen stimuli in visual detection task from lateral occipital cortex at 200-300ms [2]. Meanwhile, another major research focus, the ANS activation, has been closely related with emotion researches, which won’t be involved in our visual awareness experiments. On the other side, the HF power of HRV and PEP were often used in those studies as parameters to measure parasympathetic and sympathetic activations respectively, which gave us precious reference in implementing the experiments. This study will contribute in meaningful ways to our general understanding of visual awareness and the involvement of structure in the nervous system above and beyond the cortex. And our knowledge of how human body reacts to consciousness will also be enriched. Methods Participants (n=10) were required to do three visual tasks, the intermittent binocular rivalry (BR) (including two physical alternation control conditions), the visual detection of a near-threshold stimulus (VD1), and the visual discrimination of stimulus with six

3
levels of intensity (VD2), as shown in Figure 1. Four keys were used in all three tasks to record the response along with two levels of confidence. ECG, ICG, EEG and pupil size tracking were conducted and data was analyzed from behavioral performance, weighted heart rate (WHR), HF power of HRV, and PEP pre and post awareness transition. Classification and multiple linear regression will also be applied to VD1 and VD2 to discriminate the autonomic responses within each factor (the confidence, correctness and intensity), and weight the three factors in distinguishing the autonomic responses.
Fig. 1. Illustration of procedures for three tasks. Procedure a. needs to be presented through a stereoscope. Results Analysis from limited number of subjects thus far showed that in VD1 and VD2, WHR decreases due to orienting response to fixation cross changing color to green, but increases immediately after stimulus presentation, no matter subject detected the stimulus or not. The amount of increase seems to be differed in the confidence level. In BR task, we didn't observe any change of WHR at the perceptual alternation. The HF power of HRV increases at the stimulus presentation in VD1 and VD2, which indicates the activation of parasympathetic system, and decreases at the perceptual alternation in BR task; The PEP also increases in VD1 and VD2, which indicates a deactivation of sympathetic system, and doesn't change in BR; The pupil size in BR increases at reversal trials, but decreases after stimulus onset in VD1 and VD2, which are accordant with the findings from HRV and PEP. By applying multiple linear regression modeling to HF power of HRV in VD2, we found that confidence level drives the amplitude of response instead of correctness or intensity. References [1] J. Britz, M. A. Pitts, "Perceptual reversals during binocular rivalry: ERP components and their concomitant source differences," Psychophysiology 48(11): 1490-9. 2011. [2] Y. Liu, A. L. Paradis, et al., "Activity in the lateral occipital cortex between 200 and 300 ms distinguishes between physically identical seen and unseen stimuli," Front Hum Neurosci 6: 211. 2012.

4
INFORMATION PROCESSING BOTTLENECKS OF HUMAN VISUAL SYSTEM
D. Huynh*, O. Ekiz, S. P. Tripathy, H. E. Bedell, and H. Öğmen
Center for Neuro-Engineering and Cognitive Science Department of Electrical and Computer Engineering
University of Houston Houston, TX 77204-4005
Abstract Our access to incoming visual stimuli typically involves a loss of information due to limitations that may occur at different processing levels. The visual system encodes visual information and transfers its contents into three memory systems with increasing time scales, viz., iconic (or sensory) memory, visual short-term memory (VSTM), and long-term memory (LTM). In the present study, we analyzed how motion information is processed and stored in memory. In contrast to the traditional assumption that the major bottleneck of information processing resides in VSTM, our results show a rather distributed and complex structure for bottlenecks that occur during a visual glance. Introduction Human cognition is severely limited in the number of items that can be processed at a time. For years, this notion has been particularly dominant in the field of memory research and led to competing theories regarding whether the limits on VSTM are constrained by a fixed number of discrete memory slots or by a finite resource that is shareable among items being processed (e.g.[2],[3]). Although competing, they all converged on the idea that, among different memory stores, sensory memory and LTM have very large capacity and VSTM constitutes the capacity bottleneck. As a result, most studies of capacity limits focus exclusively on VSTM, by-passing stimulus encoding and sensory memory stages. Our goal in this study was to examine information processing bottlenecks from the encoding of the stimulus to its storage in VSTM. Methods We extended the method and the paradigm used in [1]. The stimuli consisted of a number of identical disks with a subset of which designated as "targets" and the remaining being "distractors" (Fig.1). The disks moved along linear trajectories in random directions and then stopped. After a delay period, a cue indicated a randomly selected target for report.
Fig.1. Illustration of experimental designs.
Participants were asked to report the remembered motion direction of the cued target. By measuring the response error and by applying statistical modeling, we analyzed systematically the information processing limits of the visual system, from stimulus
5
encoding to sensory memory and to VSTM. The distribution of errors can be described by the following equation:
. ; , 1 180,180 ,
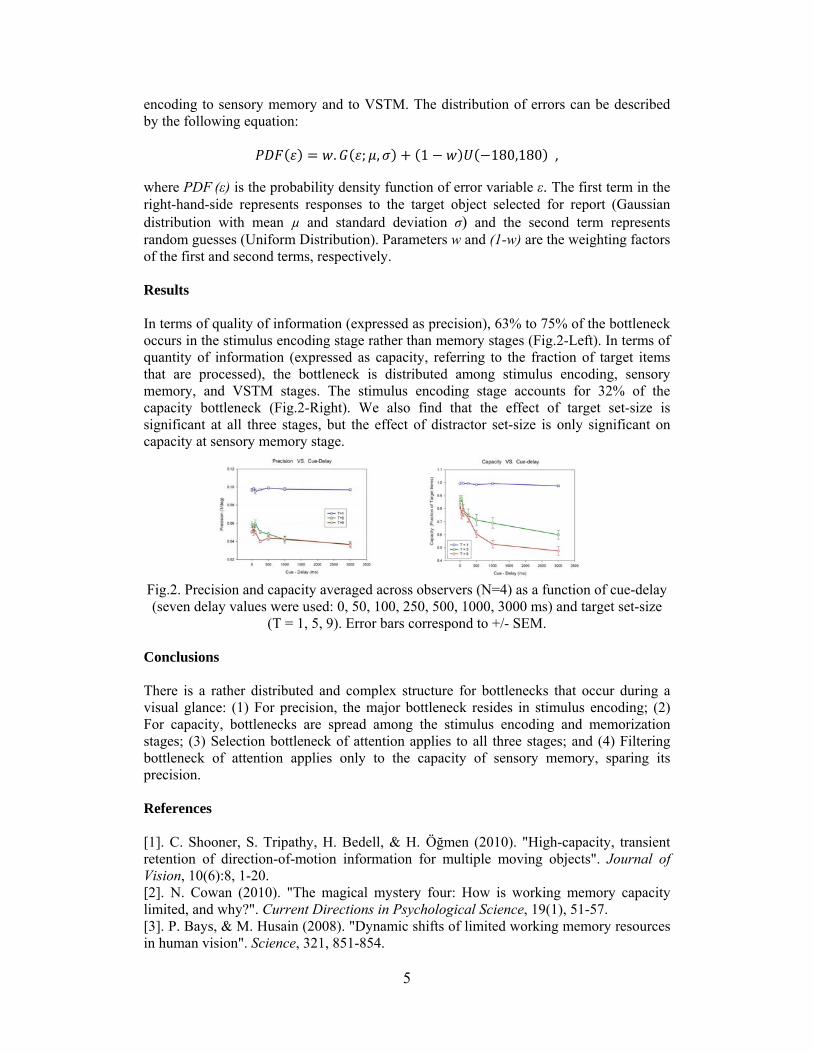
where PDF (ε) is the probability density function of error variable ε. The first term in the right-hand-side represents responses to the target object selected for report (Gaussian distribution with mean µ and standard deviation σ) and the second term represents random guesses (Uniform Distribution). Parameters w and (1-w) are the weighting factors of the first and second terms, respectively. Results In terms of quality of information (expressed as precision), 63% to 75% of the bottleneck occurs in the stimulus encoding stage rather than memory stages (Fig.2-Left). In terms of quantity of information (expressed as capacity, referring to the fraction of target items that are processed), the bottleneck is distributed among stimulus encoding, sensory memory, and VSTM stages. The stimulus encoding stage accounts for 32% of the capacity bottleneck (Fig.2-Right). We also find that the effect of target set-size is significant at all three stages, but the effect of distractor set-size is only significant on capacity at sensory memory stage.
Fig.2. Precision and capacity averaged across observers (N=4) as a function of cue-delay (seven delay values were used: 0, 50, 100, 250, 500, 1000, 3000 ms) and target set-size
(T = 1, 5, 9). Error bars correspond to +/- SEM. Conclusions There is a rather distributed and complex structure for bottlenecks that occur during a visual glance: (1) For precision, the major bottleneck resides in stimulus encoding; (2) For capacity, bottlenecks are spread among the stimulus encoding and memorization stages; (3) Selection bottleneck of attention applies to all three stages; and (4) Filtering bottleneck of attention applies only to the capacity of sensory memory, sparing its precision. References [1]. C. Shooner, S. Tripathy, H. Bedell, & H. Öğmen (2010). "High-capacity, transient retention of direction-of-motion information for multiple moving objects". Journal of Vision, 10(6):8, 1-20. [2]. N. Cowan (2010). "The magical mystery four: How is working memory capacity limited, and why?". Current Directions in Psychological Science, 19(1), 51-57. [3]. P. Bays, & M. Husain (2008). "Dynamic shifts of limited working memory resources in human vision". Science, 321, 851-854.
6
FABRICATION OF NEURAL PROBES FOR SIMULTANEOUS IN VIVO OPTICAL STIMULATION AND ELECTRICAL RECORDING IN THE BRAIN
M. M. Gheewala*1, W.-C. Shih1, G. Purushothaman2, J. A. Dani3, and J. C. Wolfe1
1Department of Electrical and Computer Engineering, University of Houston, Houston, TX 77204-4005
2Cell and Developmental Biology, Vanderbilt University, Nashville, TN 37232 3Neuroscience, Baylor College of Medicine, Houston, TX 77030
Abstract Optogenetics uses genetic manipulations to insert opsin containing light-gated ion channels into cells providing control of spiking activity with millisecond precision. This paper discusses the fabrication of an advanced optrode, neural probe with an optical channel to excite or inhibit the activity of targeted neurons and electrode arrays for localizing and mapping neuronal dipoles in the target region. A 2-channel prototype has been fabricated by ion beam proximity lithography with plasma deposited resist and in vivo preliminary recordings show the successful demonstration of the use of optrodes for neural photostimulation and recording. Introduction Many fundamental questions in neuroscience remain open and hard to address due to the inability to know in vivo the location of spiking neurons. Extraordinary effort has been expended in developing neuro-imaging tools [1], [2] but the localization errors of such methods can be as high 1 cm. The design specifications of a probe that allows high-precision 3-D mapping of localization of neuronal dipoles has been described [3], [4]. It will need to have 6 tiers of 4-channel integrated sensors (tetrodes) with overlapping recording fields. The recording field of one of these tiers should include the tip to provide access to undisturbed tissue ahead of the probe. The electrode site diameters should be less than 5 µm to enable synchronous spikes to be mapped [5]. The tiers need to be just 10 µm apart to provide the recording field overlap. Experimental We propose to fabricate such optrodes to enable the determination of neural circuits. The fabrication process for a 2-channel prototype involves several steps. First, the fiber is coated with sputtered gold and PPMMA, a plasma-deposited resist that becomes insoluble in a special developer (amyl acetate) when it is irradiated by high energy ions [6]. Then resist lines are exposed on opposite sides of the fiber using a mask illuminated by a broad beam of 30 keV He+ ions. Resist lines remain after development that protects the conductor lines during Ar+ sputter etching, which removes the unprotected gold. The formation of gold conductor lines is complete after removal of the remaining resist in an O2 plasma. Lastly, the probe is again coated with resist and exposed using a transverse wire to protect the electrode sites from ion exposure. The resist over the sites clears on development, while the exposed resist remains as an insulating and protective layer. Results and Discussion The two channel prototype was used to acquire preliminary in vivo data. Photostimulated electrical recordings from adult male prosimian primates (Figure 1a) and spontaneous

7
electrical recordings in the hippocampus of a mouse (Figure 1b) successfully demonstrate the use of such probes as recording/stimulation devices utilized across rapidly expanding fields of optogenetic experimentation. These probes offer much higher precision in the sensing and 3-D localization of neuronal sources.
0 0.1 0.2Time (sec)
20
30
40
50
Fre
qu
enc
y (i
mp
/sec
)
Fre
quen
cy
(imp/
sec)
Neu
ron
al r
espo
nse
(spi
ke/s
ec)
Fig. 1. (a) In vivo testing in adult male prosimian primates (Otolemur garnettii) showing peri-stimulus time histogram for a low contrast drifting grating and (b) photostimulated spike recording from a single neuron. (c) In vivo testing in mouse hippocampus showing differences in spike amplitude on the two different channels. Conclusion We have demonstrated the ability to fabricate integrated conductors and contacts on flexible, needle-like substrates for the first time. The process relies on plasma-enhanced chemical vapor deposition to achieve a resist coating with nanoscale uniformity, energetic helium ions or neutral atoms for near diffraction-free resist exposure over the cylindrical probe topology, and a micromachined silicon jig to align the conductor mask with a needle to within a few micrometers over a ~5 cm length. Such a probe configuration has a wide range of functionality including 3-D mapping of action potentials in the cylindrical volume surrounding the tetrode along with optogenetic control of neuronal signals with high spatial resolution and genetic specificity. The technology provides a practical way to incorporate multiple tiers of 4-channel sensors that could increase the source localization capability, a development that would dramatically increase the number of units that could be isolated at each probe position. References [1] D. Cox et al., “High-resolution three-dimensional microelectrode brain mapping using stereo microfocal X-ray imaging,” J Neurophysiol, vol. 100, pp. 2966-2976, Nov 2008. [2] S. S. Dalal, et al., “Localization of neurosurgically implanted electrodes via photograph-MRI-radiograph coregistration,” J. Neurosci. Methods, vol. 174, no. 1, pp. 106-115, Sep 2008. [3] F. Mechler, et al., “Three-dimensional localization of neurons in cortical tetrode recordings,” J. Neurophysiol., vol. 106, pp. 828-848, May 2011. [4] F. Mechler, et al., “Dipole characterization of single neurons from their extracellular action potentials,” Journal of Computational Neuroscience, vol 32, pp. 73-100, Feb 2012. [5] D. N. Hill, et al., “Quality metrics to accompany spike sorting of extracellular signals,” The Journal of Neuroscience, vol. 31, no. 24, pp. 8699–8705, Jun 2011. [6] D. Parikh, et al., “Nanoscale pattern definition on nonplanar surfaces using ion beam proximity lithography and conformal plasma-deposited resist,” J. MEMS, vol. 17, no. 3, pp. 735-740, Jun 2008.

8
DECODING THE EVOLVING GRASPING STRUCTURE FROM ELECTROENCEPHALOGRAPHIC (EEG) ACTIVITY
Harshavardhan A. Agashe*1 and Jose L. Contreras-Vidal1
Noninvasive Brain-Machine Interface Systems Lab 1 Department of Electrical and Computer Engineering
University of Houston Houston, TX 77204-4005
Abstract Although grasping various objects is critical in determining independence in daily life of amputees, decoding of different grasp types from noninvasively recorded brain activity has not been investigated. Here we show results suggesting electroencephalography (EEG) is a feasible modality to extract information on grasp types from the user’s brain activity. We found that the information about the intended grasp increases over the grasping movement, and is significantly greater than chance up to 200 ms before movement onset. Introduction There were an estimated 40,000 upper limb amputees in the US in 2012. Highly articulated anthropomorphic neuroprostheses provide an opportunity to change amputees’ quality of life by allowing them to perform tasks independently. Advances in surgical procedures like targeted muscle reinnervation (TMR) have allowed classifying the electromyographic (EMG) patterns from targeted muscles to control prosthetic functions like moving the arm and basic grasping. Here we evaluate the feasibility of using electroencephalography (EEG), a noninvasive and portable technique to record brain activity at the scalp, as a source signal for controlling grasp types in robotic limbs. Methods Simultaneous EEG and hand kinematics were recorded from five healthy participants while they performed a grasping task. Subjects were seated with five objects (calculator, CD, espresso cup, zipper and a beer mug) arranged in front of them. Subjects were instructed to randomly select, reach and grasp any of the five objects. Whole head EEG and hand joint angles were recorded simultaneously while subjects performed this task. In an offline analysis, bandpass-filtered (0.1-1 Hz) EEG were used to construct linear decoder models to predict the first two Principal Components (PCs) of hand kinematics [1]. These predictions were then classified into one of the five grasp types with a Bayesian classifier. Information obtained due to the classifier was quantified as the decrease in entropy in the class distributions given knowledge of EEG. The maximum information that the classifier can provide is the entropy of the prior uniform distribution of objects, which was used to normalize the mutual information and obtain an information score Results We calculated the information score for classifiers using PC1, PC2 and PC1-2 combined, for both predictions from EEG, and recorded kinematics, for all subjects (Fig. 1). As expected, the information score increases steadily over the trial duration, and 50% of the

9
information is available midway through the movement. Classifier performance using both PC1 and 2 was highest, though not significantly greater than PC1 ( 0.05). PC2 performance was the lowest. Although classification performance from EEG appeared to be lower than kinematics, we found no significant differences, indicating that the EEG extracts almost all information available about kinematics.
To find out the common EEG electrodes being recruited to predict PC1 and PC2 trajectories, we plotted a spatial histogram of the percentage of times an EEG electrode was selected by the genetic algorithm across subjects (Fig. 2). Of interest, the scalp maps showed not only relevant contralateral EEG channels but also ipsilateral sensors. The spatial scalp maps suggest recruitment of brain areas involved in executive decision-making, primary and supplementary motor function as well as visuo-motor transformations, all of which are known to be involved in self-initiated and self-selected grasping tasks.
References [1] H. A. Agashe and J. L. Contreras-Vidal, “Reconstructing hand kinematics during reach to grasp movements from electroencephalographic signals.,” Conference proceedings: Annual International Conference of the IEEE EMBS, vol. 2011.
Fig. 1. Evolution of classifierinformation. The Bayesianclassifier was applied to PC1, PC2and combined PC 1-2 trajectories,both from EEG predictions andrecorded kinematics, for allsubjects. The information score,which gives the percentage ofmaximum possible informationgain due to the classifier, wascalculated from the confusionmatrices at each point in time. Theinformation score steadilyincreases over the trial for allsubjects (Movement onset at 0s).
PC2 (green traces) had a throughput significantly lower than PC1 after the first 0.5 s. Althoughthere was a trend for information from EEG (solid lines) to be lower than from kinematics (brokenlines), there was no significant difference at 0.05 level. A histogram of movement end times isindicated by the shaded gray region, from which it is noticeable that 50% of the information isalready available halfway through the movement (1s). The information available about grasp typesis significantly greater than chance up to 200 ms before movement onset. 95% confidence intervalsare indicated by shaded regions around trajectories.
Fig. 2. Locations of optimal EEGelectrodes. The percentage of timesan EEG electrode was selected forthe GA to predict trajectories forPC1 (left) and PC2 (right) is shownabove as a spatial distribution on thescalp. Recruitment of electrodessuggests a sparse network involvingfrontal, supplementary motor andmotor as well as parietal cortices.

10
SCALABLE SPARSE OPTIMIZATION FOR BIG POWER GRID DATA
L. Liu* and Z. Han Wireless Networking, Signal Processing and Security Lab
Department of Electrical and Computer Engineering University of Houston
Houston, TX 77204-4005
Abstract
Detection of false data injection attacks is of importance for reliable operations in power systems, and an effective utilization of the anticipated smart grid data deluge will provide us actionable insights to achieve this goal. However, the big volume of data collected is hard to be analyzed. In this paper, we formulate the false data detection problem as a matrix separation problem, and utilize the low rank matrix factorization method to solve it. It is shown that the proposed method is able to recover the electric power states as well as detect malicious attacks, even under the situation that collected measurement data are incomplete. Numerical simulations validate the effectiveness of the proposed mechanism.
Introduction
Unveiling false data injection attacks are crucial to the security and reliability of power systems [1]. This task is challenging, since attackers may be able to construct the false data attack vectors against the protection scheme, and inject attack vectors into power grid that can bypass the traditional detection methods. At the same time, the amount of data collected can be formidable for signal processing. Furthermore, the incomplete measurement data due to intended attacks or meter failures complicate the task, and thus make state estimation even more difficult. In this paper, by noticing the intrinsic low dimensionality of temporal measurement of power grid state, and the sparse nature of false data injection attacks, a novel matrix separation [2] is presented to determine false data injection attacks in electric power grid.
Problem Formation The DC model for the real power measurement can be written in a linear matrix form as:
, (1)
where H is the Jacobian matrix of power system. denotes the power system state variables and e is the measurement error. The false data injection attack is defined as: Definition 1: (False data injection attack) [3] The malicious attack vector a is called the false data injection attack if and only if a can be expressed as a linear combination of the columns of H as a = Hc. Denote as the measurement of the power state for a time period of t, and A as the false data attacks matrix. The obtained temporal observations can be expressed as:
= , (2) where matrix E stands for the measurement errors. Given the observations at the ISO,

11
considering the missing measurement due to the meter failures or communication links outage in practical applications, the power state variables and false data injection attacks matrix A can be separated by the following minimization problem [4]:
min , ‖ ‖ . . , (3)
where is expressed as a product of U and V for some adjustable rank estimate r. Ωis the observation set. Main results
Fig. 1. Numerical results. (left) ROC for IEEE 118 bus. (right) State estimation performance. The proposed algorithm is evaluated on the IEEE 118 bus, and compared to the nuclear norm minimization approach. The numerical results on the ROC performance and error cumulative distributive function are shown in Fig.1. Conclusion The unprecedented volume, velocity and variety of information in electric grid provide us new opportunities, if appropriately utilized, to enhance the reliability of power systems. In this paper, we propose a scalable optimization based mechanism that exploits the structure of power states measurement and malicious attacks to detect the false data injection, and numerical results validate the effectiveness of the proposed algorithm. References
[1] E. Hossain, Z. Han, and H. V. Poor, Smart Grid Communications and Networking, Cambridge University Press, UK, 2012. [2] E. Candes, X. Li, Y. Ma, and J. Wright, “Robust principal component analysis?,” Journal of the ACM, vol. 58, no. 3, pp. 1-37, May 2011. [3] Y. Liu, M. K. Reiter, and P. Ning, “False data injection attacks against state estimation in electric power grids,” the 16th ACM Conference on Computer and Communications Security, Chicago, IL, USA, Nov. 2009. [4] Y. Shen, Z. Wen, and Y. Zhang, “Augmented Lagrangian alternating direction method for matrix separation based on low-rank factorization,” Rice CAAM Tech Report TR11-02.
12
WIRELESS ENERGY TRANSMISSION FOR GEOPHYSICAL APPLICATIONS
Xiyao Xin*1, David Jackson1, Ji Chen1, and Paul Tubel2
Applied Electromagnetics Research Group 1 Department of Electrical and Computer Engineering
University of Houston Houston, TX 77204-4005
2 Tubel Energy, Inc. 25907 Oak Ridge Dr, The Woodlands, TX 77380
Abstract Wireless power transmission is beneficial for geophysical applications, where it is desired to transfer power from one point to another along a pipe or between two pipes with an obstruction in between. This investigation focuses on optimizing the achievable range and power transfer efficiency when transmitting wirelessly between two coils that are wrapped around pipes in a lossy environment. A CAD model for the transmitting and receiving coils is used to calculate the power transfer efficiency and study the eddy current loss in the lossy environment. Encapsulating the coils with an insulated casing increases the power transfer efficiency by reducing eddy currents, and it also makes the system less sensitive to the surrounding environment. Introduction Wireless power transmission is required whenever it is difficult or prohibitive to transfer power directly via a cable from a source to a receiver. Some of the pioneering investigations were done in the early 20th century, when Nicola Tesla used a resonant circuit to transfer electrical power wirelessly [1]. Recently, researchers from MIT developed a wireless power transfer system using self-resonant coils, using magnetic induction [2]. Also, there have been studies of transferring power wirelessly via radio waves [3]. The results of such studies apply to cases in which the environment is lossless, such as air. For lossy environments, however, the implementation of wireless power transmission will be more challenging as the loss of the environment will induce eddy currents hence reduce the power transfer efficiency significantly. This investigation will focus on optimizing the achievable range and power transfer efficiency when transmitting wirelessly between two coils that are in the presence of a lossy environment. Many of the conclusions apply to other applications, however, including wireless transmission between coils in free space or in other lossy environments. CAD model A CAD model is introduced to analyze power transfer efficiency. In this model, both the transmitting and receiving coils are modeled as combination of lumped circuit elements. Each coil is modeled as an inductor (L1 and L2) in series with a resistor (R1 and R2) along with a shunt capacitance (Cs1 and Cs2) placed in parallel across the circuit to model the stray capacitance of the coil. A shunt resistor (Rp1 and Rp2) is also placed in parallel with the inductor to model the eddy current losses in the pipe and in the surrounding lossy environment, which may include a lossy earth as well as water with a certain amount of salinity. The magnetic coupling between the coils is modeled as the mutual inductance

13
(M). Tuning capacitors (Ct1 and Ct2) are used to compensate the inductance of the coils in order to reach resonance.
Fig. 1. The circuit model used for wireless power transmission in a lossy environment In order to derive a formula of power transfer efficiency, we assume that magnetic coupling between primary coil and secondary coil is weak, which means the magnetic flux generated by the current in the secondary coil will not affect the primary coil. Also, the power load RL is assumed to be conjugate match with secondary coil. With such assumptions being made, we can derive two sets of formula for the power transfer efficiency, one for lossless environment, the other for lossy environment. Eddy Current Effects The eddy current effects are due to the electric field in a lossy media induced by the time-varying magnetic field. The eddy current mainly results from the oil pipe and the surrounding lossy environment. Eddy currents in the lossy environment are mainly localized around the coils. Therefore, if coils can be sealed by insulate casing, then the ohmic eddy-current lossy due to the lossy environment will be reduced, since the region closest to the coils is now insulating. References [1] N. Tesla, “Apparatus for transmitting electrical energy,” US patent number 1,119,732, December 1914. [2] A. Kurs, A. Karalis, R. Moffatt, J. D. Joannopoulos, P. Fisher, and M. Soljacic, “Wireless power transfer via strongly coupled magnetic resonances,” Science, vol. 317, pp. 83-85, July 2007. [3] W. Brown, “The history of power transmission by radio waves,” IEEE trans. Microwave Theory Tech., Special Centennial Historical Issue, vol. MTT-32, No. 9, pp. 1230-1242, Sept. 1984.

14
AN ANALYSIS OF COPPER SURFACE ROUGHNESS EFFECTS ON SIGNAL PROPAGATION IN PCB TRACES
Xichen Guo*1, David R. Jackson1, and Ji Chen1
Applied Electromagnetic Laboratory 1Department of Electrical and Computer Engineering
University of Houston Houston, TX 77204-4005
Abstract Conductor loss due to the roughened metal foil surface has significant effects on high-speed signals propagation. A practical method to evaluate these effects, including the signal attenuation and the propagation phase velocity, is proposed in this paper. A periodic structure is used to model the morphology of the roughness profile. The equivalent surface impedance is extracted and is then used in the traditional attenuation constant formula to calculate the actual conductor loss. This approach is validated using measurement, and is shown to be able to provide robust result within 0.2 dB/m relative error in attenuation constant. Introduction Stripline transmission line is often used for high-speed signal propagation. The metal foil is usually specially treated to have rough surface. It is reported such roughness increase the signal loss as well as dispersion. The effects of the roughness become even more crucial when the height of the roughness becomes comparable to or larger than the metal skin depth. The conventional skin depth formula becomes inaccurate especially at high frequencies since the fields near the metal behave totally different compared to those for smooth conductors. In this paper, a practical method to evaluate these roughness effects, including the signal attenuation and the effects on the phase constant of the propagating signal, is proposed and investigated. Analysis A periodic structure is used to represent the rough surface of the conductors, and within the unit cell, a hemispheroid similar is chosen to model the metal protrusion. The period of the structure is r, the amplitude of the roughness is Ar and the base radius of the
Fig. 1 A waveguide structure used to extract the fundamental Floquet wavenumber. Only one unit cell in the x-direction is inside the waveguide; the structure outside the waveguide (dashed) is not modeled. The x-directed periodicity is accounted for by the left and right PMC walls of the waveguide.

15
hemispheroid is rbase. An infinite numbers of Floquet modes are produced by this periodic structure, and all high-order modes are evanescent except for the fundamental zero-order Floquet mode. A rectangular waveguide structure with appropriate boundaries can be used to determine the equivalent surface impedance as shown in Fig. 1. The dominant mode wavenumber is then calculated using full-wave solver and an equivalent surface impedance is then calculated from the wavenumber. Results A 42.5 stripline with standard (STD) foil is used to show the roughness effects on the signal dispersion and losses. This foil has an average roughness amplitude Ar = 7.975 m, a period r = 10.62 m and rbase = 3.54 m. Fig. 3 shows the comparison of the total attenuation constant between the calculated results using proposed method and measurement, for a stripline of 39.14 cm long. The attenuation constant for this stripline increases by 1.5 Np/m compared to that with smooth conductors.
Fig. 2. The total attenuation constant αT for a single-ended stripline with STD foil. The measured data is extracted directly from the measured insertion loss information of the STD line. The smooth data is calculated using the conventional skin-depth formula. Reference [1] A. F. Horn, J. W. Reynolds, and J. C. Rautio, “Conductor Profile Effects on the Propagation Constant of Microstrip Transmission Lines,” Microwave Symposium Digest (MTT), 2010 IEEE MTT-S International, pp. 868–871, 2010. [2] E. Hammerstad and O. Jensen, “Accurate models for microstrip computer-aided design,” Microwave Symposium Digest, 1980 IEEE MTT-S International, vol. 1, no. 12, 1980, pp. 407–409. [3] S. Hall, S. G. Pytel, P. G. Huray, D. Hua, A. Moonshiram, G. A. Brist, and E. Sijercic, “Multigigahertz causal transmission line modeling methodology using a 3-D hemispherical surface roughness approach,” IEEE Transactions on Microwave Theory and Techniques, vol. 55, no. 12, pp. 2614–2624, Dec. 2007. [4] A. Koul, M. Y. Koledintseva, S. Hinaga, and J. L. Drewniak, “Differential extrapolation method for separating dielectric and rough conductor losses in printed circuit boards,” IEEE Transactions on Electromagnetic Compatibility, vol. 54, no. 2, pp. 421–433, 2012.

16
OPTICAL IMAGING BASED NANOHOLE SYSTEM FOR ULTRASENSITIVE BIO-DETECTION
Yanan Wang*1, Andrew Paterson2, Katerina Kourentzi2, Paul Ruchhoeft1, Richard
Willson2, and Jiming Bao1
1 Department of Electrical and Computer Engineering 2 Department of Chemical and Biomolecular Engineering
University of Houston Houston, TX 77204-4005
Abstract In this work, we present a straightforward and high-throughput approach to detect biological entities. Distinguished from intensely studied surface plasmon resonance (SPR) involved nanohole systems, our design is simply based on optical transmission imaging of submicron hole arrays. Taking advantage of interference lithography and selective functionalization, we have successfully demonstrated this design using anti-lysozyme antibodies, and have shown a limit of detection below 0.1 ng/mL. Introduction and System Design The great demand for detection of biological entities such as protein biomarkers, viruses, and bacteria in basic research and clinical diagnostics impulsed a rapid development of biosensing technologies in the last decade. Micro- and nanostructured materials have been widely embedded in optical sensor design, with promising of increased sensitivities and multiplexing capabilities. As the mainstream design, SPR based systems have capability to implement quantitative and qualitative in-time measurements. However, the multiplexing has become an issue due to the requirement of bulky configuration and spectroscopic base. In fact, a design of bio-detection system which can simultaneously accomplish high throughput, high sensitivity, high multiplexing capability is still missing.
Fig. 1. Schematic of optical imaging based nanohole system. The capture of biological targets can be signaled as a blocking of transmission light through nanohole. Over 30,000 events can be monitored simultaneously in a frame of optical microscope image with a 250µm x 250µm field of view. Therefore, we exploited a new optical approach for biodetection in this paper. The schematic of this design is shown as Fig. 1.
17
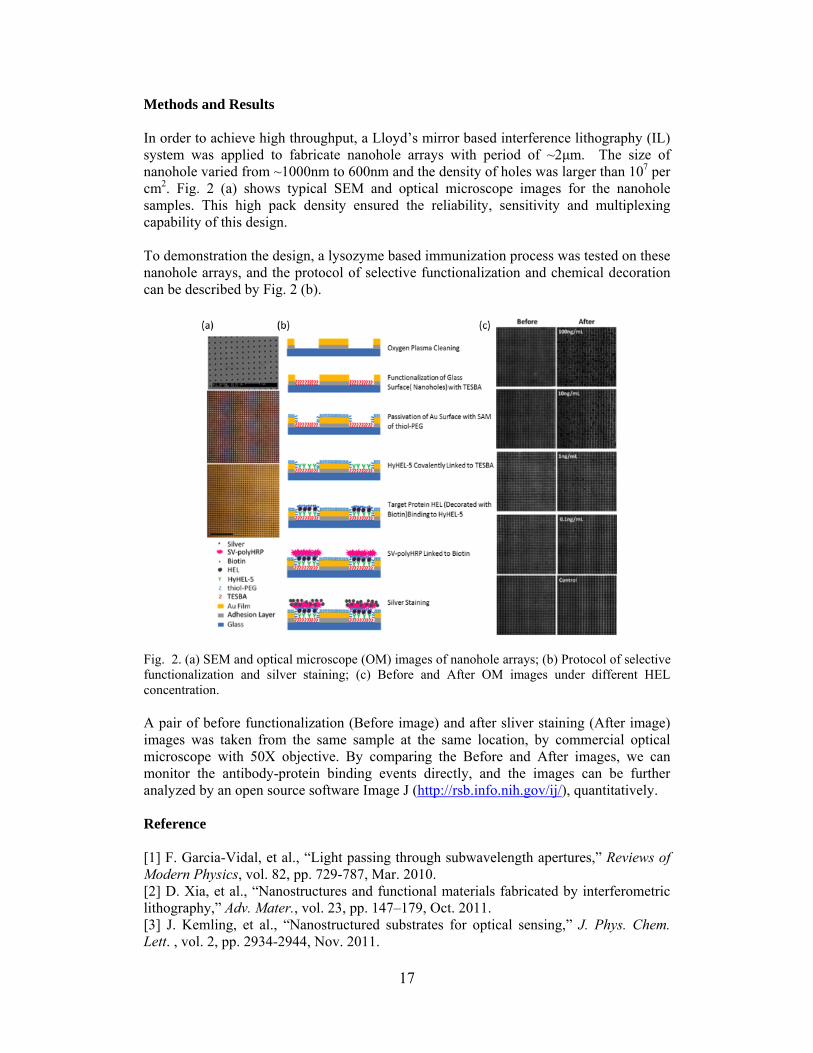
Methods and Results In order to achieve high throughput, a Lloyd’s mirror based interference lithography (IL) system was applied to fabricate nanohole arrays with period of ~2μm. The size of nanohole varied from ~1000nm to 600nm and the density of holes was larger than 107 per cm2. Fig. 2 (a) shows typical SEM and optical microscope images for the nanohole samples. This high pack density ensured the reliability, sensitivity and multiplexing capability of this design. To demonstration the design, a lysozyme based immunization process was tested on these nanohole arrays, and the protocol of selective functionalization and chemical decoration can be described by Fig. 2 (b).
Fig. 2. (a) SEM and optical microscope (OM) images of nanohole arrays; (b) Protocol of selective functionalization and silver staining; (c) Before and After OM images under different HEL concentration. A pair of before functionalization (Before image) and after sliver staining (After image) images was taken from the same sample at the same location, by commercial optical microscope with 50X objective. By comparing the Before and After images, we can monitor the antibody-protein binding events directly, and the images can be further analyzed by an open source software Image J (http://rsb.info.nih.gov/ij/), quantitatively. Reference [1] F. Garcia-Vidal, et al., “Light passing through subwavelength apertures,” Reviews of Modern Physics, vol. 82, pp. 729-787, Mar. 2010. [2] D. Xia, et al., “Nanostructures and functional materials fabricated by interferometric lithography,” Adv. Mater., vol. 23, pp. 147–179, Oct. 2011. [3] J. Kemling, et al., “Nanostructured substrates for optical sensing,” J. Phys. Chem. Lett. , vol. 2, pp. 2934-2944, Nov. 2011.

18
FABRICATION OF PLASMONIC NANO-STRUCTURES FOR SURFACE ENHANCED RAMAN SPECTROSCOPY
Pratik I Motwani*1, Ji Qi1,Wei-Chuan Shih1, and J.C. Wolfe1,2
Nanosystem Manufacturing Center 1 Department of Electrical and Computer Engineering
2 Department of Physics University of Houston
Houston, TX 77204-4005 Abstract Surface enhanced Raman spectroscopy is one of the most sensitive techniques for molecular sensing. Developing plasmonic substrates in order to improve the sensitivity and effectiveness of SERS has been the current topic of research. Here, we propose sputtered gold nano-dots (AuNDs) and nanoporous gold disks (NPGD) as effective SERS substrates. AuNDs show an average SERS enhancement factor of 8*106 with large scale structural uniformity. NPGD however, show an enhancement factor of ~ 108 that is ~517 times larger than that for planar NPG thin films. The technique presented here can be generalized for patterning NPG into other geometrical shapes. Introduction Surface enhanced Raman spectroscopy (SERS) has been widely used for molecular identification and compositional analysis with very high sensitivity and thus can provide a platform for chemical and biological sensing. The high sensitivity in SERS is attributed to the near field enhancements by localized surface plasmons at resonance with the excitation wavelength. These enhancements are observed in the SERS “hot spots” due to plasmonic coupling between the nanostructures. Development of plasmonic nanostructures of noble materials like gold and silver has been the current topic of interest since these exhibit strong electromagnetic field enhancements in the visible and near-infrared region of the EM spectrum. Fabrication of large area uniform substrates with high stability and high reproducibility typically in the dimensions of the order of nanometer has been one of the most important challenges in order to exploit the wide analytical applications of SERS. Here, we typically demonstrate a comparatively inexpensive fabrication of two different types of substrates being used extensively for molecular sensing applications. The first type of substrate developed in our lab is coined as AuNDs (Gold nano-dots). They are thin self organized sputtered gold-nano islands of about 6-8nm in size and 4-5 nm spacings with very large area structural uniformity and high stability. AuNDs, smaller and denser than any of the existing technologies exhibit an enhancement factor of about a million which is one of the best, using a cost effective physical protocol. The other type of substrate coined as nanoporous gold disk (NPGD) exploits the SERS response of nanoporous gold patterned in disk shaped structures. These types of NPG disk shaped structures are fabricated using a large scale inexpensive technique called nanosphere lithography (NSL). The fabrication process is currently being applied for the formation of different geometries of patterned nanoporous gold.

19
Methods AuNDs were fabricated using a diode sputtering system at high pressures. The gold nano-islands obtained are smaller, denser and cost effective than any of the current technologies. A self assembled monolayer of a SERS marker was then coated on these islands in order to test them for SERS response. NPGD were fabricated using large area spin coated PS nanospheres as the etch mask for argon plasma etching of the alloy (Au28 Ag72)films deposited using a home built DC magnetron sputter deposition system. The stack consists of a thick gold supporting under layer for the NPGD. Ag was then selectively leeched out from the alloy by dipping the samples in 70% concentrated nitric acid for few seconds. The residual silver content was determined to be less than 10% by EDS. Results
Fig.1. (a) Scanning electron micrographs (SEM) for 5nm thick AuNDs (b) SEM for 500nm diameter NPG disks. A 517 fold improvement is obtained in the enhancement factor when the nanoporous gold is patterned into disk shaped structures (NPGD). The enhancement factor obtained for AuNDs was estimated to be around 8*106 for a self-assembled monolayer of benzenethiol. The simplicity of the fabrication for AuNDs enables it to be used for various molecular sensing applications [5]. References [1] J. Qi, P. Motwani, M. Gheewala, C. Brennan, J. C. Wolfe, W.-C. Shih, “Surface-enhanced Raman spectroscopy with monolithic nanoporous gold disk substrates,” Nanoscale, Advance Article, Dec. 2012. [2] J. Qi, P. Motwani, J.C.Wolfe, W.-C.Shih, “High-throughput Raman and surface-enhanced Raman microscopy,” Proc.SPIE.8597, Plasmonics In Biology and Medicine X, Feb. 2012. [3] J. Qi, P. Motwani, J.C.Wolfe, W.-C.Shih, “High-throughput chemical imaging of living cells,” Advances in Optics for Biotechnology, Medicine and Surgery, Engineering Conference International, Naples FL, Jun 2011. [4] J.-S. Wi, S. Tominaka, K. Uosaki and T. Nagao, “Porous gold nanodisks with multiple internal hot spots,” Phys. Chem. Chem. Phys., 14, 9131–9136, Jul. 2012. [5] W.-C.Shih, J. Qi, “Detection of organic gunshot residues by surface-enhanced Raman spectroscopy,” Pittcon, Orlando FL, 2012.
(a) (b)

20
LASER-BASED ACTIVE-ILLUMINATION HYPERSPECTRAL MICROSCOPY WITH MULTI-MODAL IMAGING ANALYTICS
Jingting Li* and Wei-Chuan Shih
NanoBioPhotonics Group Department of Electrical and Computer Engineering
University of Houston Houston, TX 77204-4005
Abstract We present a parallel Raman microspectroscopy scheme for simultaneously collecting Raman spectra from multiple points by projecting a series of multi-point laser illumination pattern using a spatial light modulator (SLM). The scheme enables us to collect Raman spectra within 80 80μm field of view from as many as 100 points simultaneously per illumination pattern. With a series of patterns calculated from the bright field image considering the vertical separation distance between two adjacent particles, we can cover all the particles in one sample without overlapping spectra information. Introduction Raman spectroscopy is a powerful tool for compositional analysis via inelastic light scattering. Conventional Raman spectroscopy requires a long acquisition time since it is a weak phenomenon. We present a Raman spectroscopy scheme to automatically generate a series of illumination patterns to avoid vertical overlapping just from the bright field image of a translucent sample and acquire Raman spectra with high speed. Analysis To acquire a Raman spectra map of a sparse sample is time-consuming and inefficient. Instead, using SLM to active illuminate the sample with a series of patterns can achieve higher efficiency without mechanical moving or waste of laser power by scanning areas without valid sample. To avoid overlapping of spectra, on the direction vertical to spectra, the distance between two adjacent illuminated sample points should not be less than its size. Thus we can split all the points into subgroups within which there is no overlapping. Methods Sample used is 2μm polystyrene beads on a coverslip. We use a flat silicon wafer to verify the positions of Illumination patterns. First a visual image is taken by camera1. A program module calculates the centroids of bead and separates them into subgroups. Then we generate the accordingly holograms of each pattern by a module written with LabView. The laser wavefront is modulated by an SLM to generate the desired pattern. Illuminated sample spectra is taken by camera2. Results Shown in Fig.1 (a) is a bright field image of 1413 polystyrene beads of 2μm diameter within 80 80μm . The centroids of all beads are separated into 45 patterns that covers
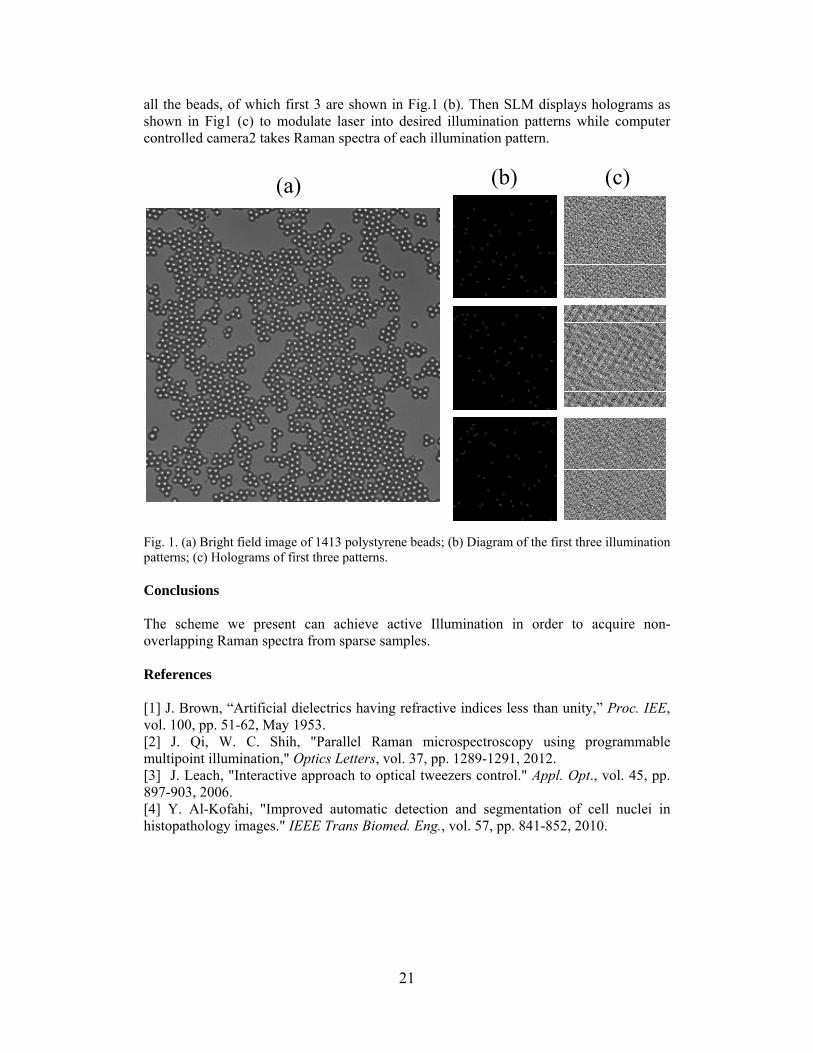
21
all the beads, of which first 3 are shown in Fig.1 (b). Then SLM displays holograms as shown in Fig1 (c) to modulate laser into desired illumination patterns while computer controlled camera2 takes Raman spectra of each illumination pattern.
(a) (b) (c)
Fig. 1. (a) Bright field image of 1413 polystyrene beads; (b) Diagram of the first three illumination patterns; (c) Holograms of first three patterns. Conclusions The scheme we present can achieve active Illumination in order to acquire non-overlapping Raman spectra from sparse samples. References [1] J. Brown, “Artificial dielectrics having refractive indices less than unity,” Proc. IEE, vol. 100, pp. 51-62, May 1953. [2] J. Qi, W. C. Shih, "Parallel Raman microspectroscopy using programmable multipoint illumination," Optics Letters, vol. 37, pp. 1289-1291, 2012. [3] J. Leach, "Interactive approach to optical tweezers control." Appl. Opt., vol. 45, pp. 897-903, 2006. [4] Y. Al-Kofahi, "Improved automatic detection and segmentation of cell nuclei in histopathology images." IEEE Trans Biomed. Eng., vol. 57, pp. 841-852, 2010.
22
UNSUPERVISED DISCOVERY OF MORPHOLOGICAL PROGRESSIONS OF MICROGLIA ARBORS IN RESPONSE TO IMPLANTED
NEUROPROSTHETIC DEVICES
Y. Xu*1, N. Rey1, M. Megjhani1, A. Cheong1, K. Trett2, P. Qiu3, W. Shain2, and B. Roysam1
1 Dept. of Electrical and Computer Eng., Uni. of Houston, Houston, TX, 77204 2 Center for Intg. Brain Res., Seattle Children’s Res. Institute, Seattle, WA, 98101
3 Dept. of Bioinfo. & Comput. Biology, MD And. Cancer Center, Houston, TX, 77030 Abstract Microglia, Central Nervous System (CNS) cells,similar to macrophages, undergo characteristic changes in cell arbor morphology in response to tissue perturbation. Our goal is to discover the progression of these changes and determine the associated arbor features derived from 3-D multi-channel fluorescence confocal microscope images of rat brain tissue. A progression from highly ramified microglia to round cells proximal to the injury site of an implanted neuroprosthetic recording device is revealed. Introduction Microglia, the resident immune cells of the Central Nervous System (CNS), exhibit progressions of 3-D arbor morphologies, reflecting underlying cellular activation states, in response to tissue perturbations [1]. Current understanding of microglia is largely based on qualitative visual analysis of 2-D micrographs. There is a compelling need for an objective and quantitative 3-D analysis of microglia arbors over extended (multi-millimeter) tissue regions. Towards this goal, we present a method combining 3-D confocal imaging of extended tissue regions, large-scale computational image analysis [2], quantitative neuromorphology [3], and bio-informatics [4], which allows unsupervised discovery of progressive alterations in microglia arbors from image-based cell measurements and mapping their 3-D spatial distribution in the tissue. Furthermore, we have developed a multithreaded implementation of this method at interactive spend in the open-source FARSIGHT toolkit (www.farsight-toolkit.org). Analysis and Results Coronal sections of rat brain motor cortices, some with electrodes implanted for 30 days were cut into 100-μm thick slices, and labeled (GFAP for astrocytes, Iba-1 for microglia, Hoechst for nuclei, and NeuroTrace for neurons). From the overlapping tiles imaged by a spinning disk confocal microscope, a 3-D montage of extended was created. Nuclei were segmented and Iba-1+ nuclei identified. Microglial somas were segmented using a level-set method and the arbors were automatically traced. The arbor morphologies were quantified with the L-measure to generate 131 features/cell. These features are the input of the k-NNG based progression analysis which consists of three components: 1) Feature clustering to generate coherent modules of highly correlated features; 2) Feature selection by comparing the k-NNGs of each feature module to find a group of progression-similar feature modules that show significant variation patterns; 3) Multi-level visualization to display the progression at user-defined resolutions by making cuts on the dendrogram of hierarchical clustering of samples. Importantly, all of the analysis charts and the 3-D rendering of the original image overlaid with the arbor traces are actively linked, enabling the interactive multi-scale analysis.

23
Fig.1. Results of progression discovery of microglia arbor morphology. Groups C1 through C6 are cells with progressively less-complex arbors. (A) Spatial distribution of the six microglia groups near the implant displayed as color-coded spheres. (B) Sample close-up images (green), and automated arbor traces (right), of microglia for each group. (C) Cell population distributions for the six microglia groups for control, implanted, and device-proximal tissue. (D) Heatmap representation of the progression showing significant progressive variations of the selected features. The discarded features do not exhibit a clear variation pattern. References [1] R.A. Onas, et al., “The spider effect: morphological and orienting classification of microglia in response to stimuli in vivo,” PLoS ONE, vol. 7, Feb. 2012. [2] C.S. Bjornsson, et al., “Associative image analysis: A method for automated quantification of 3D multi-parameter images of brain tissue”, J Neuroscience Methods, vol. 170, pp. 165-178, Jan. 2008. [3] R. Scorcioni, S. Polavaram, and G.A. Ascoli, “L-measure: a web-accessible tool for the analysis, comparison and search of digital reconstructions of neuronal morphologies,” Nature Protocols, vol. 3, pp. 866-876, Mar. 2008. [4] P. Qiu, A.J. Gentles, and S.K. Plevritis, “Discovering biological progression underlying microarray samples,” PLoS Comput Biol, vol. 7, Apr. 2011.
24
ACCURATE CHARACTERIZATION OF NANOPARTICLES HEATING EFFICIENCY FOR DRUG DELIVERY AND CANCER THERAPY
Dhivya Ketharnath*1,2, Rohit Pande,1,2 Leiming Xie,1 Biana Godin,3 and Jarek Wosik1,2
1Electrical and Computer Engineering Department 2Texas Center for Superconductivity, University of Houston, Houston, TX 772042
3Department of Nanomedicine, The Methodist Hospital Research Institute, Houston, Texas, 77030
Abstract
We describe an accurate method to characterize the efficiency of rf heating of various nanoparticles (NPs) suspension and targeted ligand-NPs combinations. We have analyzed all rf loss components, which include magnetic spin losses, electric field induced losses in NPs and eddy-currents losses in NPs solution. A 30 MHz high-Q resonator was designed to measure samples placed inside a parallel plate capacitor and solenoid coil with or without a specially designed electric field shield. To quantify rf heat enhancement due to the presence of NPs, their specific absorption rate (SAR) was determined by measuring the temperature change of the NP suspension using a solenoid coil. We carried out measurements of magnetic (superparamagnetic iron-oxide with dextran matrix), metallic (Au) and dielectric (silica) NPs to analyze all possible mechanisms of heat loss to subsequently identify and isolate the contribution from just the NP. Introduction Currently available targeted cancer treatments such as rf hyperthermia and ablation techniques are non-selective frequently inducing thermal necrosis in both normal and malignant cells in the treatment zone. However, it has been demonstrated that functionalized nanoparticles (NPs), acting as rf absorption enhancers in the presence of an external rf source are cell-selective. While the rf heating of colloidal suspensions as a whole is well documented, contribution of medium heating to overall heating of the NP suspension has generally been neglected.
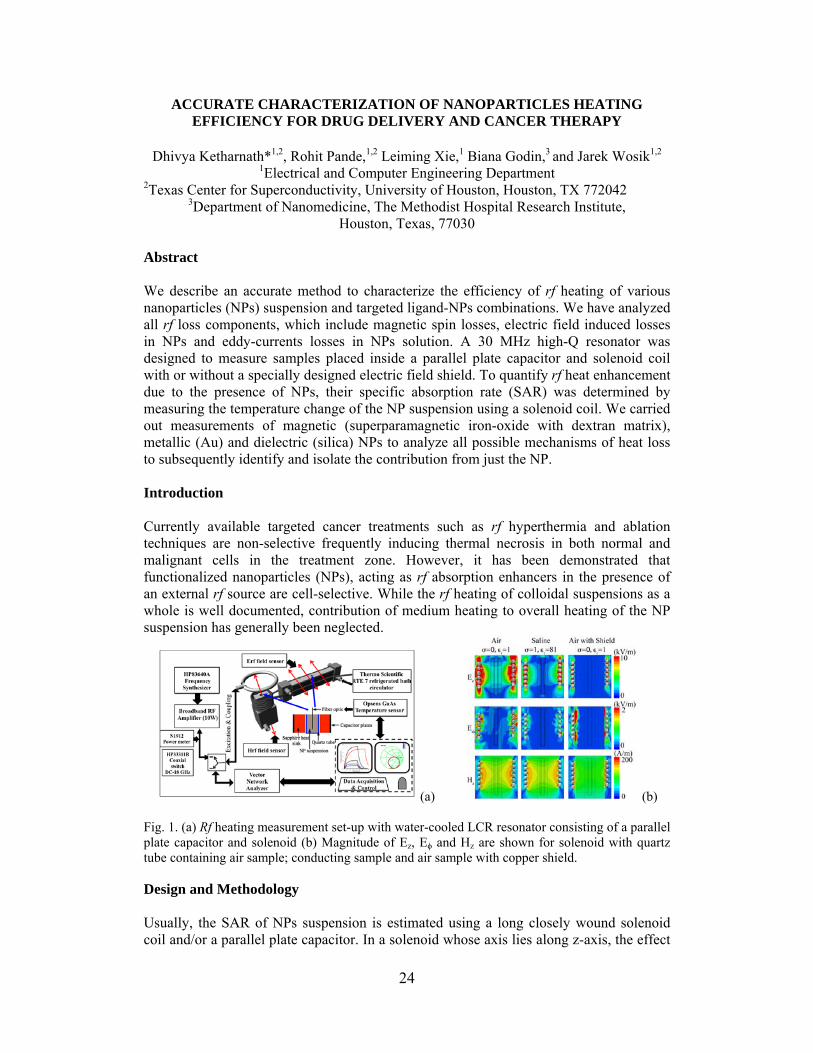
(a) (b) Fig. 1. (a) Rf heating measurement set-up with water-cooled LCR resonator consisting of a parallel plate capacitor and solenoid (b) Magnitude of Ez, Eϕ and Hz are shown for solenoid with quartz tube containing air sample; conducting sample and air sample with copper shield.
Design and Methodology Usually, the SAR of NPs suspension is estimated using a long closely wound solenoid coil and/or a parallel plate capacitor. In a solenoid whose axis lies along z-axis, the effect

25
of the time-varying uniform rf magnetic field Hz responsible for spin related losses and the induced electric field E responsible for eddy currents losses on the SAR measurements have been studied in literature. However, the existence of the conservative electric field Ez caused by the scalar electric potential due to the coil winding which in most solenoid configurations is at least in the order of E magnitude has been overlooked[1]. The neglected heating resulting from interaction of Ez field component with both NPs leads to an overestimation of the SAR of the NPs[2]. Figure 1a and 1b show the experimental set-up and the numerically analysis of rf losses due to interaction of both NPs and the suspension with electric (Erf) and magnetic (Hrf) field respectively. ResultsandConclusionsWe distinguish and specifically calculate the individual contributions of the rf magnetic and electric fields to the overall heating efficiency of the NPs as shown in Figure 2a for the three rf fields configurations. To determine the magnetic loss of the SPIO NPs, the calorimetric equations for the sample in the solenoid with shield are used,
(1)
The magnetic component of SAR (SARM) of the SPIO NPs can be expressed as follows,
20 "
2M zNP
SAR H
(2)
It can be estimated from our calculations that if the Es field loss was neglected (as it is in literature calculated SAR) calculated magnetic SAR would be ~14 kW/kg as compared to actual magnetic SAR of 4.1 kW/kg (off ~250%!) as shown in Figure 2b [3].
(a) (b)
Conc.
(mg/mL) ”
SARM
(kW/kg)
SARM /fH2
(Wsm2/kgA2)
28 0.0038 4.1 2.9 x 10⁻¹²
1 0.0054 5.86 4.2 x 10⁻¹²
Fig. 2. (a) Temperature dependence on time for 28 mg/mL and 1 mg/mL SPIO suspension samples, insets show size distribution, zeta potential and first 20s linear dependence of temperature (b) SAR values of SPIO NPs for, Hz=7.1 kA/m, Es=1.91 kV/m, f=30 MHz. References[1] B. Park, et al., "A method to separate conservative and magnetically-induced electric fields in calculations for MRI and MRS in electrically-small samples," Journal of Magnetic Resonance, vol. 199, pp. 233-237, 2009. [2] Y. Yuan and D.-A. B. Tasciuc, "Comparison between experimental and predicted specific absorption rate of functionalized iron oxide nanoparticle suspensions," Journal of Magnetism and Magnetic Materials, vol. 323, pp. 2463-2469, 2011. [3] D. Ketharnath, et al., "A method to measure specific absorption rate of nanoparticles in colloidal suspension using different configurations of radio-frequency fields," Applied Physics Letters, vol. 101, pp. 083118-4, 2012.
Cpssqsusss
1
2 sus E
2
0" Hz
2 f
26
MANIPULATING CELLS WITH A DYNAMICALLY-RECONFIGURABLE ELECTRO-MAGNETIC COIL
Ruoli Jiang*, Ben H. Jansen, and Ji Chen
Center for Neuro-Engineering and Cognitive Science
Department of Electrical and Computer Engineering University of Houston
Houston, TX 77204-4005
Abstract Current cancer screening techniques are often labor-intensive and require high initial costs. To address these issues, we are participating in a project to develop a low-cost chip for cell enrichment. The proposed system uses water-based bio-compatible ferrofluid as a uniform magnetic environment that surrounds the non-magnetic (cancer) cells within a set of microfluidic channels and reservoirs. By applying an external magnetic field, the non-magnetic objects can be pushed away, and these objects (including cancer cells) can be potentially trapped, manipulated and directed towards a specific location. Key to this system is the ability to deliver dynamically-reconfigurable magnetic field patterns. We are developing a system that produces such fields. Introduction
Current cell screening technologies such as the fluorescence activated cell sorter (FACS) are labor intensive, require ‘tags’ to identify cells of interest and are of high cost. In contrast, microfluidic chips use only a small amount of cell samples, and can carry out enrichment and manipulation based on physical biomarkers of cells such as size, density, shape, elasticity and polarization. The cells of interest can be manipulated by applying a magnetic buoyancy force if the microparticles are suspended in a ferrofluid. Ferrofluids are stable colloidal suspensions of permanently magnetized nanoparticles in a carrier liquid like water or oil. Each particle is typically made from magnetite (Fe3O4) coated with a monolayer of surfactant to prevent the particles from agglomerating under van der Waals attraction forces. Furthermore, the ~10 nanometer particle diameter is small enough to ensure that the particles remain dispersed by Brownian motion and do not agglomerate under gravity and magnetic interactions. Therefore, ferrofluids are stable suspensions that exhibit superparamagnetic susceptibilities with suspended magnetic particles constituting typically up to 10% of the total fluid volume. Method The basic idea of this device is to manipulate micro-particles by forces applied to them through externally generated, time-varying magnetic fields. The magnetic field gradient thus obtained will exert a translation force on magnetic particles. We envision that the magnetic fields are produced by a set of cross-wires under the container holding the particles suspended in a liquid. By varying the current flowing through each cross-wire in a controlled manner, magnetic fields with desired gradient characteristics can be obtained resulting in a desired movement of the suspended particles. The following analysis shows how this can be accomplished. Consider point like magnetic particles that are constrained to move in a chamber in the x-y plane. They will experience magnetic force exerted by a y-directional steady current under the chamber given by an odd function of x:

27
2 20
, 2 2 2 3( )m x
V I xzF
x z
.
Magnetic particles tend to gather above the current flow, while nonmagnetic particles will be pushed away. We can apply this mechanism to transport or trap nonmagnetic particles in ferrofluids. For example, sequentially applying a brief current pulse to a number of parallel cross-wire will result in a motion perpendicular to the cross-wires. Nonmagnetic particles may be trapped by applying steady currents to two sets of neighboring x-directional and y-directional wires. References [1] T. Zhu, F. Marrero, L. Mao, "Continuous separation of non-magnetic particles inside ferrofluids," Microfluidics and Nanofluidics, 9, 1003-1009, 2010. [2] T. Zhu, D. J. Lichlyter, M. A. Haidekker, L. Mao, "Analytical model of microfluidic transport of non-magnetic particles in ferrofluids under the influence of a permanent magnet," Microfluidics and Nanofluidics, 6, 1233-1245, 2011. [3] T. Zhu, R. Cheng, L. Mao, "Focusing Microparticles in a Microfluidic Channel with Ferrofluids," Microfluidics and Nanofluidics, 2011. [4] T. Zhu, F. Marrero, L. Mao, "In Continuous separation of non-magnetic particles through negative magnetophoresis inside ferrofluids," 5th Annual IEEE International Conference on Nano/Micro Engineered and Molecular Systems, Xiamen, China, 2010. [5] Shihab M. Elborai, "Ferrofluid surface and volume flows in uniform rotating magnetic fields, " Massachusets Institute of Technology 2006. [6] H. C. Kitchener, P. E. Castle, J. T. Cox, Chapter 7: Achievements and limitations of cervical cytology screening. Vaccine 2006, 24 Suppl 3, S3/63-70. [7] R. J. S. Derks, "Magnetiic bead manipulation in a sub-microliter fluid volume application for biosensing," Microfluid Nanofluid (2007) 3:141-149.

28
STUDYING SURFACE KINETICS USING SURFACE REFLECTIVITY
Ela Bulut*1 and Stanko R. Brankovic1,2,3 Electrochemical Nanofabrication & Nanomaterials Synthesis Group
1 Department of Electrical and Computer Engineering 2 Department of Electrical & Computer Engineering
3 Department of Chemical & Biomolecular Engineering Department of Chemistry
University of Houston Houston, TX 77204-4005
Abstract The objective of this research was to study surface reflectivity measurements during underpotential deposition (UPD) of lead monolayer on Au(100) single crystal. We have successfully implemented surface reflectivity measurements to study reaction kinetics of UPD. The results proved that monolayer coverage has a direct effect on intensity and reflectivity. Intensity of the reflected beam decreases with increasing monolayer lead coverage on gold crystal. This opens the potential to study surface limited redox replacement reaction kinetics [1]. Introduction Underpotential deposition (UPD) phenomenon refers to potential dependent adsorption of metal atomic layers onto a foreign metal substrate at a potential which is more positive than the reversible Nernst potential [2]. Results and Discussion
Figure 1: (a) Current Density vs. Potential graph of Lead UPD on Au(100) from 0.1M HClO4 + 1mM Pb2+.with a 20mV scan rate. Voltage Limits: 0.7V-0.02V. (b) Charge vs. Potential graph. (c) Coverage vs. Potential graph. Figure 1 shows the CV that is obtained during Pb(UPD) on Au(100). Adsorption and stripping peaks are almost reversible during lead UPD on Au(100) crystal. Charge can be integrated from anodic or cathodic reaction as in figure 1-(b).
Q i. dt (1) After using the cathodic curve from figure 1-(a) and calculating charge and Q/Q0, charge values can be directly transformed into coverage values, and then coverage vs. potential graph can be obtained as in figure 1-(c). Basic components of our system are a CCD camera, a laser as the light source, gold plated thin film wafer as the reflecting mirror, an electrochemical cell to immerse all three electrodes (working, reference, and counter electrodes), data acquisition device (DAQ), connector block, and a potentiostat. Reflectivity can be measured from pixel intensities of an image [3]. In other words

29
change in the reflectivity of a surface has a linear relationship with changing intensity of the reflected light from a surface. In addition to this, it is also proved that coverage has a direct correlation with intensity of the reflected light beam in many optical and electrochemical studies (I~R~θ [4]. Therefore, we can normalize our pixel intensity vs. potential graphs into normalized intensity vs. potential graph to estimate the change in the coverage with respect to potential difference. While I represents intensity, it can be stated that change in the coverage with time can be expressed with change in the intensity (
~ ~ ). Finally, the correlation between the reflectivity and coverage is
R=RPb/Au+(1-θ).R0, so coverage (θ) can be expressed as below.
θ/
(2)
Here, R0 is the reflectivity from the bare gold surface while R refers to the recorded reflectivity values of the reflected laser beam during the experiment, RPb/Au is the reflectivity of surface with full monolayer coverage. represents the coverage which becomes 1 when the lead UPD monolayer is completed.
Figure 2: (a) Intensity vs. Potential graph of Lead UPD on Au(100) from 0.1M HClO4 + 1mM Pb2+.with a 10mV scan rate. (b) Normalized intensity vs. Potential graph. (c) Coverage vs. Potential graph. Intensity decreases with deposition of lead on Au(100) with decreasing potential, and starts increasing after reaching minimum potential value due to desorption process of lead UPD monolayer. When the potential decreases (adsorption takes place), coverage increases and reaches to its maximum value at minimum potential value (-60mV). In contrary, when potential increases from -60mV to 0.6V, coverage decreases because of the stripping of lead monolayer. Conclusion It is proved that coverage has a direct effect on intensity and reflectivity. We have successfully implemented surface reflectivity measurements to study reaction kinetics of underpotential deposition. Intensity of the reflected beam decreases with increasing monolayer lead coverage on Au(100). This opens the potential to study surface limited redox replacement reaction kinetics [1]. References [1] S. R. Brankovic, Functional Properties of Bioinspired Surfaces - Characterizations and Technological Applications, Chapter 11, World Scientific, 2009. [2] E. Herrero, L. J. Buller, and H. Abruna, “Underpotential Deposition at Single Crystal Surfaces of Au, Pt, Ag and Other Materials,” Chem. Rev., vol. 101, pp. 1897-1930, 2001. [3] L. Ke, “A Method of Light Reflectance Measurement”, Master Thesis, Tsinghua University, 1993. [4] 22. D.M Kolb, D Leutloff and M. Przasnyski, “Optical Properties of Gold Electrode Surfaces Covered with Metal Monolayers”, Surface Science, 47 (1975) 622-634.
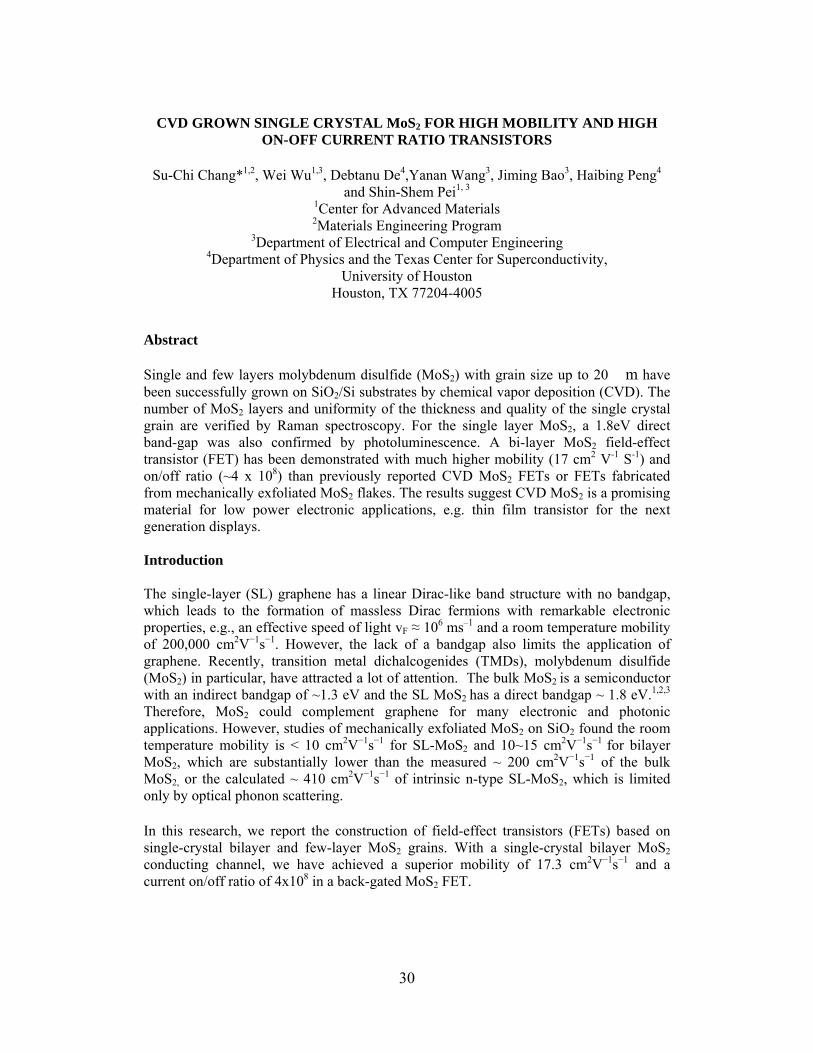
30
CVD GROWN SINGLE CRYSTAL MoS2 FOR HIGH MOBILITY AND HIGH ON-OFF CURRENT RATIO TRANSISTORS
Su-Chi Chang*1,2, Wei Wu1,3, Debtanu De4,Yanan Wang3, Jiming Bao3, Haibing Peng4 and Shin-Shem Pei1, 3
1Center for Advanced Materials 2Materials Engineering Program
3Department of Electrical and Computer Engineering 4Department of Physics and the Texas Center for Superconductivity,
University of Houston Houston, TX 77204-4005
Abstract Single and few layers molybdenum disulfide (MoS2) with grain size up to 20 �m have been successfully grown on SiO2/Si substrates by chemical vapor deposition (CVD). The number of MoS2 layers and uniformity of the thickness and quality of the single crystal grain are verified by Raman spectroscopy. For the single layer MoS2, a 1.8eV direct band-gap was also confirmed by photoluminescence. A bi-layer MoS2 field-effect transistor (FET) has been demonstrated with much higher mobility (17 cm2 V-1 S-1) and on/off ratio (~4 x 10⁸) than previously reported CVD MoS2 FETs or FETs fabricated from mechanically exfoliated MoS2 flakes. The results suggest CVD MoS2 is a promising material for low power electronic applications, e.g. thin film transistor for the next generation displays. Introduction The single-layer (SL) graphene has a linear Dirac-like band structure with no bandgap, which leads to the formation of massless Dirac fermions with remarkable electronic properties, e.g., an effective speed of light vF ≈ 106 ms–1 and a room temperature mobility of 200,000 cm2V−1s−1. However, the lack of a bandgap also limits the application of graphene. Recently, transition metal dichalcogenides (TMDs), molybdenum disulfide (MoS2) in particular, have attracted a lot of attention. The bulk MoS2 is a semiconductor with an indirect bandgap of ~1.3 eV and the SL MoS2 has a direct bandgap ~ 1.8 eV.1,2,3 Therefore, MoS2 could complement graphene for many electronic and photonic applications. However, studies of mechanically exfoliated MoS2 on SiO2 found the room temperature mobility is < 10 cm2V−1s−1 for SL-MoS2 and 10~15 cm2V−1s−1 for bilayer MoS2, which are substantially lower than the measured ~ 200 cm2V−1s−1 of the bulk MoS2, or the calculated ~ 410 cm2V−1s−1 of intrinsic n-type SL-MoS2, which is limited only by optical phonon scattering. In this research, we report the construction of field-effect transistors (FETs) based on single-crystal bilayer and few-layer MoS2 grains. With a single-crystal bilayer MoS2 conducting channel, we have achieved a superior mobility of 17.3 cm2V−1s−1 and a current on/off ratio of 4x10⁸ in a back-gated MoS2 FET.
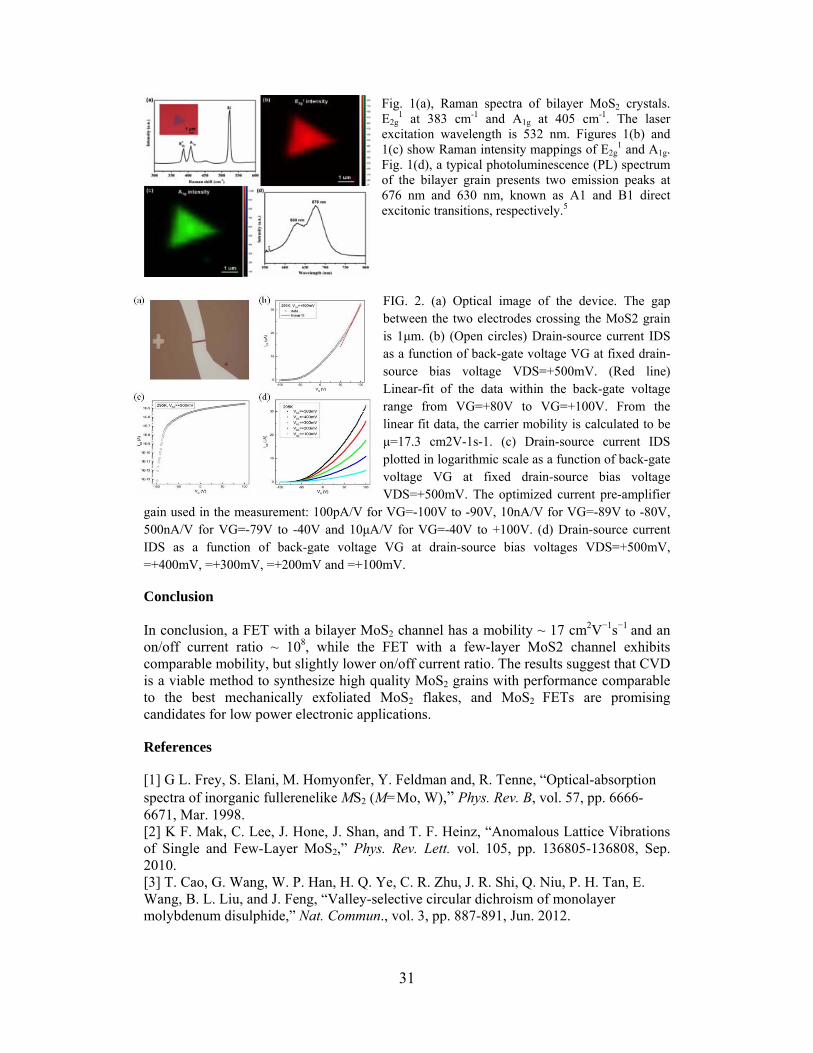
31
Fig. 1(a), Raman spectra of bilayer MoS2 crystals. E2g
1 at 383 cm-1 and A1g at 405 cm-1. The laser excitation wavelength is 532 nm. Figures 1(b) and 1(c) show Raman intensity mappings of E2g
1 and A1g. Fig. 1(d), a typical photoluminescence (PL) spectrum of the bilayer grain presents two emission peaks at 676 nm and 630 nm, known as A1 and B1 direct excitonic transitions, respectively.5
FIG. 2. (a) Optical image of the device. The gap between the two electrodes crossing the MoS2 grain is 1μm. (b) (Open circles) Drain-source current IDS as a function of back-gate voltage VG at fixed drain-source bias voltage VDS=+500mV. (Red line) Linear-fit of the data within the back-gate voltage range from VG=+80V to VG=+100V. From the linear fit data, the carrier mobility is calculated to be μ=17.3 cm2V-1s-1. (c) Drain-source current IDS plotted in logarithmic scale as a function of back-gate voltage VG at fixed drain-source bias voltage VDS=+500mV. The optimized current pre-amplifier
gain used in the measurement: 100pA/V for VG=-100V to -90V, 10nA/V for VG=-89V to -80V, 500nA/V for VG=-79V to -40V and 10μA/V for VG=-40V to +100V. (d) Drain-source current IDS as a function of back-gate voltage VG at drain-source bias voltages VDS=+500mV, =+400mV, =+300mV, =+200mV and =+100mV.
Conclusion In conclusion, a FET with a bilayer MoS2 channel has a mobility ~ 17 cm2V−1s−1 and an on/off current ratio ~ 108, while the FET with a few-layer MoS2 channel exhibits comparable mobility, but slightly lower on/off current ratio. The results suggest that CVD is a viable method to synthesize high quality MoS2 grains with performance comparable to the best mechanically exfoliated MoS2 flakes, and MoS2 FETs are promising candidates for low power electronic applications.
References
[1] G L. Frey, S. Elani, M. Homyonfer, Y. Feldman and, R. Tenne, “Optical-absorption spectra of inorganic fullerenelike MS2 (M=Mo, W),” Phys. Rev. B, vol. 57, pp. 6666- 6671, Mar. 1998. [2] K F. Mak, C. Lee, J. Hone, J. Shan, and T. F. Heinz, “Anomalous Lattice Vibrations of Single and Few-Layer MoS2,” Phys. Rev. Lett. vol. 105, pp. 136805-136808, Sep. 2010. [3] T. Cao, G. Wang, W. P. Han, H. Q. Ye, C. R. Zhu, J. R. Shi, Q. Niu, P. H. Tan, E. Wang, B. L. Liu, and J. Feng, “Valley-selective circular dichroism of monolayer molybdenum disulphide,” Nat. Commun., vol. 3, pp. 887-891, Jun. 2012.

32
THIS PAGE WAS LEFT INTENTIONALLY BLANK

33
ABSTRACTS FOR POSTER PRESENTATIONS

34
QUANTITATIVE PROFILING OF MICROGLIA POPULATIONS USING HARMONIC CO-CLUSTERING OF ARBOR MORPHOLOGY MEASUREMENTS
Yanbin Lu*1, Lawrence Carin2, Ronald Coifman3, and Badrinath Roysam1
1 Department of Electrical and Computer Engineering University of Houston, Houston, TX 77204-4005 2Department of Electrical and Computer Engineering
Duke University, Durham, NC 27708-0291 3Department of Mathematics
Yale University, New Haven, CT 06520-8283
Abstract
Microglia are the resident immune cell population in the mammalian central nervous system (CNS). These highly plastic cells exhibit ramified arbors in their resting state, and progressively less-complex arbors when activated. Our goal is to compare the spatial distributions of resting and activated microglia in normal brain tissue against tissue that is perturbed by insertion of a neural recording device. A hierarchical extension of Coifman’s [1, 2] unsupervised harmonic analysis method was used to profile these multivariate data and identify groups of similar cells and the underlying features. This iterative procedure induces an orthogonal basis by constructing a coupled geometry over the row and column spaces of the feature matrix. Smoothing of the dataset, and the row and column clusters is achieved simultaneously when the algorithm converges.
Introduction
We are interested in profiling the changes to large populations of microglia (>10,000 cells) caused by implantation of neuroprosthetic devices. For this, we present a harmonic analysis based hierarchical co-clustering method that accepts high-dimensional feature vectors (>127 features) describing microglial arbor morphology, and groups these data in a manner that allows us to identify groups of morphologically similar cells and clusters of related features simultaneously, in a robust and concise manner. Specifically, we are interested in co-clustering approaches with built-in smoothing ability in order to avoid over-fragmentation of clusters due to the unavoidably “noisy” nature of the arbor feature data. Our method is able to infer the geometry of the row and column spaces, and also take into consideration the structure of the entire data matrix simultaneously. Method Given a feature matrix , in this application, a microglia data table with rows corresponding to cells, columns corresponding to arbor features, the method iteratively clusters rows and columns to achieve smoothing of the matrix such that groups of similar cells and groups of correlated features are inferred when convergence is obtained. Iterative co-clustering between rows and columns is performed by constructing the local geometry of the row space and column space of the feature matrix alternatively. Result The harmonic co-clustering reveals four salient groups of cells, as seen in Figure 1 below. Figure 1(a & b) on the left show the spatial distributions of each of these cell groups

35
using color-coded spheres for control, and device-implanted tissue, respectively. The panels (c – f) in Figure 1 show close-ups of sample cells from each cluster. The heatmaps on the right in Figure 1 is a visualization of data matrix for both raw data and reorganized data.
Fig. 1. Spatial distribution & typical samples: (a-b) spatial distribution of four subsets of cells for a control tissue and implanted tissue, color coded spheres corresponding to cells in four groups; (c-f) typical samples of four subsets cells. Heatmap of (a) raw feature table of the implanted tissue data; (b) reorganized data table applying Purple boxes indicated four salient groups of cells.
Conclusion Our hierarchical extension of harmonic co-clustering is a powerful method to profile microglial arbors, allowing direct comparison of normal and tissue perturbed brain tissue. This method is robust to noise in features, produces biologically meaningful yet concise results, and is scalable to large datasets. By combining this method with a linked visualization system, it is possible to map the spatial distribution of cells versus their activation status. Quantitative results obtained on large datasets including cells from control and implanted tissues demonstrate the power of this method. References [1] R.R. Coifman & M. Gavish, “Harmonic Analysis of Digital Data Bases,” Wavelets and Multiscale Analysis, Birkhäuser Boston, 2011. [2] M. Gavish, B. Nadler, & R.R. Coifman, “Multiscale Wavelets on Trees, Graphs and High Dimensional Data: Theory and Applications to Semi Supervised Learning,” in Proc. ICML, pp.367-374, 2010. [3] R.R. Coifman & S. Lafon, “Diffusion maps,” Applied and Computational Harmonic Analysis, pp. 5-30, 2006.

36
EXTENDED L-MEASURE: A COMPUTATIONAL APPROACH FOR QUANTITATIVE CELL ARBOR MORPHOMETRY
A. Cheong* and B. Roysam
Bio-Image Analytics Laboratory Department of Electrical and Computer Engineering
University of Houston Houston, TX 77204-4005
Abstract Quantitative analysis was performed on three-dimensional images of rat brains that received neural implants. The application of L-Measure, a quantitative measurement tool for neuronal reconstructions, on the images revealed certain limitations in describing the overall cell shape, the cell orientation, and the soma as well as viewing the data at multiple scales. Additional metrics were developed and some methods of L-Measure were reworked to enhance the quantitative study of neurites within a program called the FARSIGHT 3D Trace Editor. Introduction Microglia are the main form of immune defense within the brain. Their role in the protection and maintenance of the brain makes them a target of study of neurological diseases. Microglia can be classified into three states: ramified, amoeboid, and activated. In each state, microglia takes on a particular structure. In the case of studying the effects of neural implantation, the brain slice reveals a majority of amoeboid-like microglia gathering at the implant site after one week and a majority of activated (highly-branched) microglia after six weeks. A healthy and unaffected brain shows microglia in a ramified (resting) state. The quantitative feature analysis allow for the objective comparison of microglia in their various states as well as the study of the cell variations within a state. L-Measure computes 43 unique metrics and all except for type, helix, and fractal dimension are incorporated in the FARSIGHT 3D Trace Editor[1]. The trace editor is a program used for visualizing neuronal images and performing cluster edits on traces, which are a collection of 3D points and their radii modeling the soma and the processes of each cell in an image[2]. The measurements are obtained from the traces and presented in a table where each row list the computed features of a cell: the soma surface area, the diameter of the processes, the path length of the processes, and so on. A total of 69 unique metrics are currently computed at the cell-level in the Trace Editor. Methods An addition of 26 metrics have been added to describe glial morphology (see Table 1).
Table 1. Some metrics to describe glial morphology. Metrics Description Distance to Device Euclidean distance of the soma point to
the surface of the device. Azimuth/Elevation to Device Direction of the Euclidean distance of the
soma point to the surface of the device.

37
Overall Cell Tips to Device Angle The angle between the overall tip direction and the closest point to the device with the soma point as the vertex.
Convex Hull Magnitude The overall direction of the surface points with the soma point as the origin.
Convex Hull Surface Area The surface area of the convex hull. Convex Hull Volume The volume of the convex hull. Ellipsoid Major Length The longest length of the 3D ellipse. Ellipsoid Minor Length The medium length of the 3D ellipse. Ellipsoid Normal Length The shortest length of the 3D ellipse. Ellipsoid Major Azimuth/Elevation The direction of the longest length of the
3D ellipse. Ellipsoid Eccentricity A measure of how much the ellipsoid
deviates from being circular. Discussion Since L-Measure currently provides quantitative information only at the cell level, the current work is to expand the quantitative analysis across multiple levels to provide information at the segment level and below as well as the information above such as the cell-to-cell level. With each additional level, new features emerge such as the density and nearest neighbor measurements at the cell-to-cell level. The manipulation of data at multiple levels will further enhance the quantitative analysis of neurites. For each level, the applicable features are put into a heat map, or some other graphical representation of data, to obtain a hierarchy of features to reveal correlations between features. While L-Measure computes the same statistics (min, mean, max, and standard deviation) for every metric, not every metric should have these statistics such the counts, which only computes one number for each cell. Since these statistics should not be applied to soma position and the counts, not every feature can be correlated through direct comparison of the min, mean, and max. A method that takes into account feature dependencies upon other features needs to be applied to the data. Other alternative methods, such as the comparison of distributions, are being considered to obtain more accurate feature correlations. Conclusion The proposed metrics along with L-Measure are designed to set a quantitative standard for researchers to use for analyzing neurites and compare results. Analyzing data at multiple levels as well as adding new metrics will provide insight to understanding cell morphology. Additional metrics will be implemented and validated for a quantitative description of the overall cell shape as needed. References [1] R. Scorcioni, S. Polavaram, and G.A. Ascoli, "L-Measure: a web-accessible tool for the analysis, comparison and search of digital reconstructions of neuronal morphologies," Nature Protocols, vol. 3, pp. 866-876, Apr. 2008. [2] http://www.farsight-toolkit.org/wiki/Trace_Editor

38
COLOR BASED SEGMENTATION OF BRIGHTFIELD MICROSCOPY IMAGES
P. B. Subrahmanya* and B. Roysam
Bio-Image Analytics Research Group Department of Electrical and Computer Engineering
University of Houston Houston, TX 77204-4005
Abstract
The objective of this project is to develop an intuitive and reliable segmentation technique for bright field microscopy images based on color. There are various methods which have been developed to segment image based on color but most of them require parameter tuning when dealing with different image datasets or variations within a dataset. This tuning requires the user to understand some part of the algorithm employed. This project presents a novel method of segmentation of 2D bio-medical images by employing active learning for classifying super pixels. This is more intuitive to the user and is adaptable to variations present within and between datasets. Introduction In the field of bio-medical imaging, staining is the basic method of separating different proteins or cells in tissue sample. Once stained, there are various imaging techniques present which can capture the required spectral components one at a time or altogether. Bright field microscopy which captures the image formed by passing light through the tissue sample is one of the simplest and most popular techniques used for various analyses. In order to aid with these analyses various image processing and analysis techniques have been developed. Image processing deals with improving the quality of image whereas, image analysis deals with higher level operations like detection and interpretation of image contents. Image segmentation is a borderline process which presents the image in such a way that it is beneficial for subsequent analysis or annotation. Hence it is important to equip the user with reliable and easy to tune segmentation algorithm. Analysis There are many different methods developed for segmentation of color images [3 and 4]. Some of them try to find edges present in the image using different color models at different scales before combining them based on some criteria. These methods usually require some preprocessing and filtering before segmentation and are sensitive to parameters. Region or area based segmentation techniques perform segmentation either growing uniform regions from initial seeds or by splitting up of non-uniform regions into smaller segments until they satisfy the homogeneity criteria and then merging them based on heuristic to form maximum possible uniform area. These techniques work well when criteria can be defined easily; this cannot be generalized easily since there is lot of spectral overlap in all bio-medical image datasets which is innate to staining process. Clustering techniques employ various features from different color models, sometimes data dependent specialized features and discover clusters within them. There are many clustering techniques available but most of them require parameter tuning which requires the user to understand the working of algorithm to some extent. This is not desirable

39
when there is large variety of datasets with both inter and intra-dataset variance. Method We are using simple linear iterative clustering algorithm [1] to create superpixels in the given image. This reduces the number of feature points to be classified speeding up the algorithm and acts as a down sampling step. Classifying superpixels instead of pixels also reduces the resulting texture in the output which may occur due to noise or errors in input image. The mean color values of the superpixels are tabulated and converted from RGB color space to CIEL*a*b* and HSI color space before presenting it to active machine learning algorithm [2]. Active learning algorithm queries the most informative samples to be labeled by user to converge on to best classifier. Once the superpixels are classified the final segmentation result is obtained. Result
Fig. 1. Tissues from different anatomical regions are segmented.
Fig 2. Images from same dataset with variations in staining (IBA1 stained Glioblastoma images).
The algorithm can handle variance within a dataset and between datasets as long as they are linearly separable and by presenting the user with samples from original image, we are able to successfully develop an intuitive and adaptable segmentation algorithm. References [1] Radhakrishna Achanta, Appu Shaji, Kevin Smith, Aurelien Lucchi, Pascal Fua, and Sabine Susstrunk, "SLIC Superpixels Compared to State-of-the-Art Superpixel Methods," IEEE Transactions on Pattern Analysis And Machine Iintelligence, 2012. [2] R. Padmanabhan, Active and transfer learning methods for computational histology, Ph.D. dissertation, Department Of Electrical and Computer Engineering, University Of Houston, 2012. [3] Siddhartha Bhattacharyya, "A Brief Survey of Color Image Preprocessing and Segmentation Techniques," Journal of pattern recognition, 2011. [4] Wladyslaw Skarbek, Andreas Koschan, Color Image Segmentation-A survey, Polish Academy of Science, Technical University of Berlin, Oct. 1994.

40
A MACHINE-LEARNING METHOD FOR IDENTIFICATION AND TRACING OF BASAL ASTROCYTE ARBORS IN 3D CONFOCAL MICROSCOPY
IMAGES
P. Kulkarni*1, M. Savelonas1, J. Luisi1, B. Busse1, R. Padmanabhan1, V. Somasundar1, K. Trett2, C. Harris2, P. Chong2, W. Shain2, and B. Roysam1
Biomedical Image Analytics Research Group 1University of Houston, Houston, TX.
2Neurosurg., Seattle Children’s Res. Inst., Seattle, WA Abstract
Astrocytes are glial cells of particular importance for studying several disease mechanisms, as well as brain reaction to the presence of implanted devices. Astrocyte nuclei detection is a complicated task due to the presence of microglial cells, neurons and endothelial nuclei. In addition, astrocytes are characterized by a complex octopus-like morphology, and complex cell-cell and cell-vessel contact patterns. Given that astrocyte nuclei and processes are stained in different channels, there is a substantial challenge for automated quantification methods. This work introduces a novel machine-learning method for the quantification of astrocytes, based on a combination of morphological and associative features derived from 3D multi-channel confocal microscopy images. Astrocyte roots, i.e. regions of basal convergence of astrocyte processes, are strong indicators of the presence of astrocyte nuclei within their proximity. In the proposed method, nuclei classification and root detection are effectively coupled in a 2-stage classification scheme, employing active learning so as to allow the expert biologist to provide the most informative training examples. Starting from the identified roots, a tree-based tracing algorithm is applied to enable quantification of astrocyte morphology. Experimental results demonstrate the usefulness of the proposed method for quantifying tissue perturbations caused by implanted neuroprosthetic devices. Results
Fig. 1 shows some of the challenges for astrocyte tracing.

41
Fig. 2 on left shows dense interest point detection, figure on right shows root points detected using the classification method.
Fig. 3 shows the tracing of astrocyte arbors for a couple of images. Conclusion The proposed algorithm performs automated classification and morphological quantification of astrocyte cells. The use of active learning for training the classifier further reduces the human effort involved in the process. Using the proposed method which is a part of FARSIGHT, an open source toolkit, it would be possible for researchers to quantify astrocyte cell morphology as a function of disease or perturbations caused to the CNS. References [1] N. Oberheim, G. Tian, X. Han, W. Peng, T. Takano, B. Ransom, and M. Nedergaard, “Loss of Astrocytic Domain Organization in the Epiliptic Brain,” The Journal of Neuroscience, Vol. 28, No. 13, March 2008. [2] M. Karim, B. Roysam, N. Mesfin, A. Jeromin, M. Yuksel, and S. Kalyanaraman, “Automatic Selection of Parameters for Vessel/Nurite Segmentation Algorithms,” IEEE Transactions on Image Processing, Vol. 14, No. 9, September 2005.
42
QUANTITATIVE ANALYSIS OF HIGH -THROUGHPUT CELL INTERACTION BETWEEN HUMAN NATURAL KILLER CELL AND NALM6, BASED ON
MIGRATION PATTERNS AND SHAPE MORPHOLOGY
N. Rey*1, A. Merouane1, I. Liadi2, G. Romain2, N. Varadarajan2, B. Roysam1, L. Cooper3 1 Department of Electrical and Computer Engineering
2 Department of Chemical & Biomolecular Engineering University of Houston
Houston, TX 77204-4005 3Division of Pediatrics, Research Unit 907, University of Texas MD Anderson Cancer
Center
Abstract Cancer immunotherapy can harness the specificity of immune response to eliminate tumors. Adoptive cell therapy (ACT) based on the adoptive transfer of T-Cells genetically modified to express a chimeric antigen receptor (CAR) has shown considerable promise in clinical trials. Discovering the optimal functions of CAR T-Cells associated with clinical benefit is essential for designing the next generation of clinical trials. Although recent advances in live animal imaging like multiphoton microscopy have advance the understanding of T-Cell functions in vivo, T-Cell based ACT in clinical trials requires the need to link molecular and functional features of T-Cell pre-infusion with clinical efficacy post-infusion, by using in vitro assays monitoring T-Cell functions. To accomplish this Microfabricated arrays designed in biocompatible polymers like polydimethylsiloxane (PDMS) are used to spatially confine effectors and targets in small volumes (wells). In this way thousands of effectors-targets interactions can be monitored simultaneously by imagining individual wells. A nanowell array containing 6,000 wells was designed and imaged every 10 minutes for a period of 17 hours. Two imaging modalities have been used bright field and fluorescence imaging. The algorithms developed use the information present in both imaging modalities to accurately find and detect each individual cell. Accurately quantifying the motility and migration pattern of the effectors and target cells is of foremost importance since this information can be further correlated to how likely an effector-target cell interaction will result on a successful killing event. This study describes the computational methods used to analyze the high-throughput interaction between effectors and targets cells together with the preliminary cell-to-cell interaction analysis obtained from these data. To this end we have developed algorithms for accurately detecting each individual cell container (wells), segment every cell target and killer cells [3], and solve the association problems (track cells across different time points). All the core algorithms have been tested and implemented using C++, with an interface in MATLAB. Results Despite intense study of interaction between natural killer (NK) and target cells, few studies have been devoted to the individual study of entire contact history of each NK cell [1]. Additionally, of the few studies reported most of them have only been done using small sample sets consisting of a reduced number of cell interactions [2]. The proposed approach has allowed us to quantitatively study the cell-to-cell interaction and the motility behavior of the effectors cells in a high throughput application in a fully
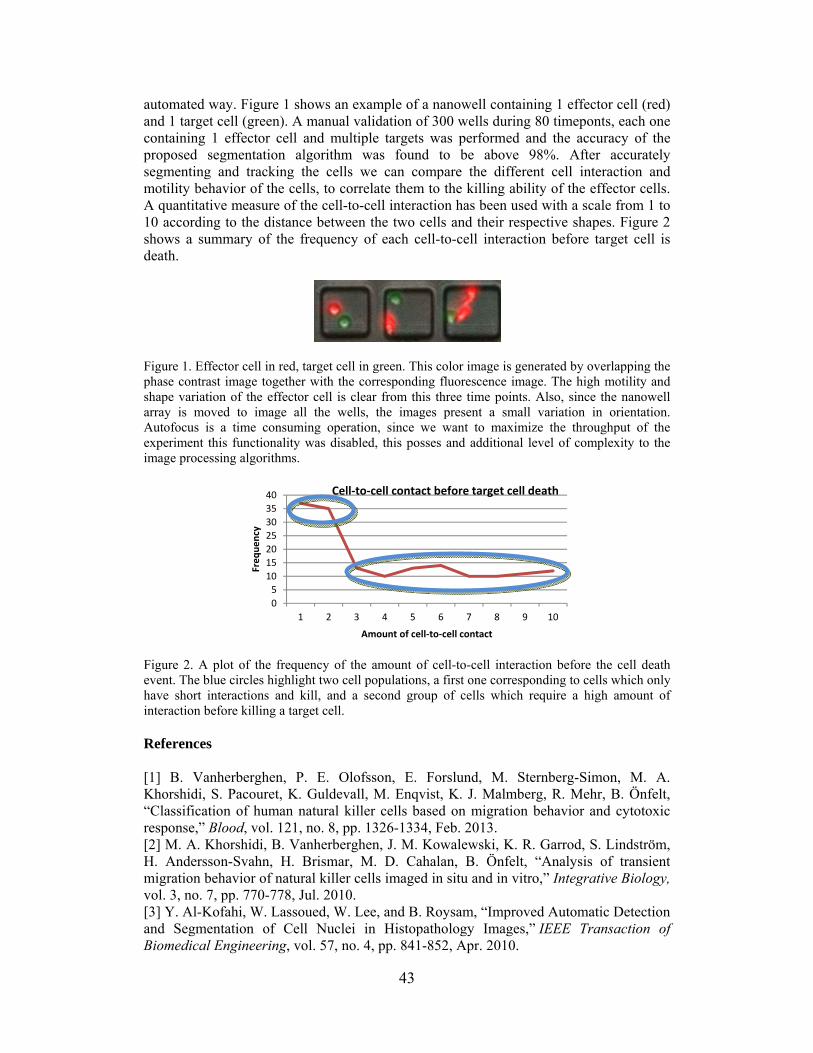
43
automated way. Figure 1 shows an example of a nanowell containing 1 effector cell (red) and 1 target cell (green). A manual validation of 300 wells during 80 timeponts, each one containing 1 effector cell and multiple targets was performed and the accuracy of the proposed segmentation algorithm was found to be above 98%. After accurately segmenting and tracking the cells we can compare the different cell interaction and motility behavior of the cells, to correlate them to the killing ability of the effector cells. A quantitative measure of the cell-to-cell interaction has been used with a scale from 1 to 10 according to the distance between the two cells and their respective shapes. Figure 2 shows a summary of the frequency of each cell-to-cell interaction before target cell is death.
Figure 1. Effector cell in red, target cell in green. This color image is generated by overlapping the phase contrast image together with the corresponding fluorescence image. The high motility and shape variation of the effector cell is clear from this three time points. Also, since the nanowell array is moved to image all the wells, the images present a small variation in orientation. Autofocus is a time consuming operation, since we want to maximize the throughput of the experiment this functionality was disabled, this posses and additional level of complexity to the image processing algorithms.
Figure 2. A plot of the frequency of the amount of cell-to-cell interaction before the cell death event. The blue circles highlight two cell populations, a first one corresponding to cells which only have short interactions and kill, and a second group of cells which require a high amount of interaction before killing a target cell. References [1] B. Vanherberghen, P. E. Olofsson, E. Forslund, M. Sternberg-Simon, M. A. Khorshidi, S. Pacouret, K. Guldevall, M. Enqvist, K. J. Malmberg, R. Mehr, B. Önfelt, “Classification of human natural killer cells based on migration behavior and cytotoxic response,” Blood, vol. 121, no. 8, pp. 1326-1334, Feb. 2013. [2] M. A. Khorshidi, B. Vanherberghen, J. M. Kowalewski, K. R. Garrod, S. Lindström, H. Andersson-Svahn, H. Brismar, M. D. Cahalan, B. Önfelt, “Analysis of transient migration behavior of natural killer cells imaged in situ and in vitro,” Integrative Biology, vol. 3, no. 7, pp. 770-778, Jul. 2010. [3] Y. Al-Kofahi, W. Lassoued, W. Lee, and B. Roysam, “Improved Automatic Detection and Segmentation of Cell Nuclei in Histopathology Images,” IEEE Transaction of Biomedical Engineering, vol. 57, no. 4, pp. 841-852, Apr. 2010.
0
5
10
15
20
25
30
35
40
1 2 3 4 5 6 7 8 9 10
Frequency
Amount of cell‐to‐cell contact
Cell‐to‐cell contact before target cell death
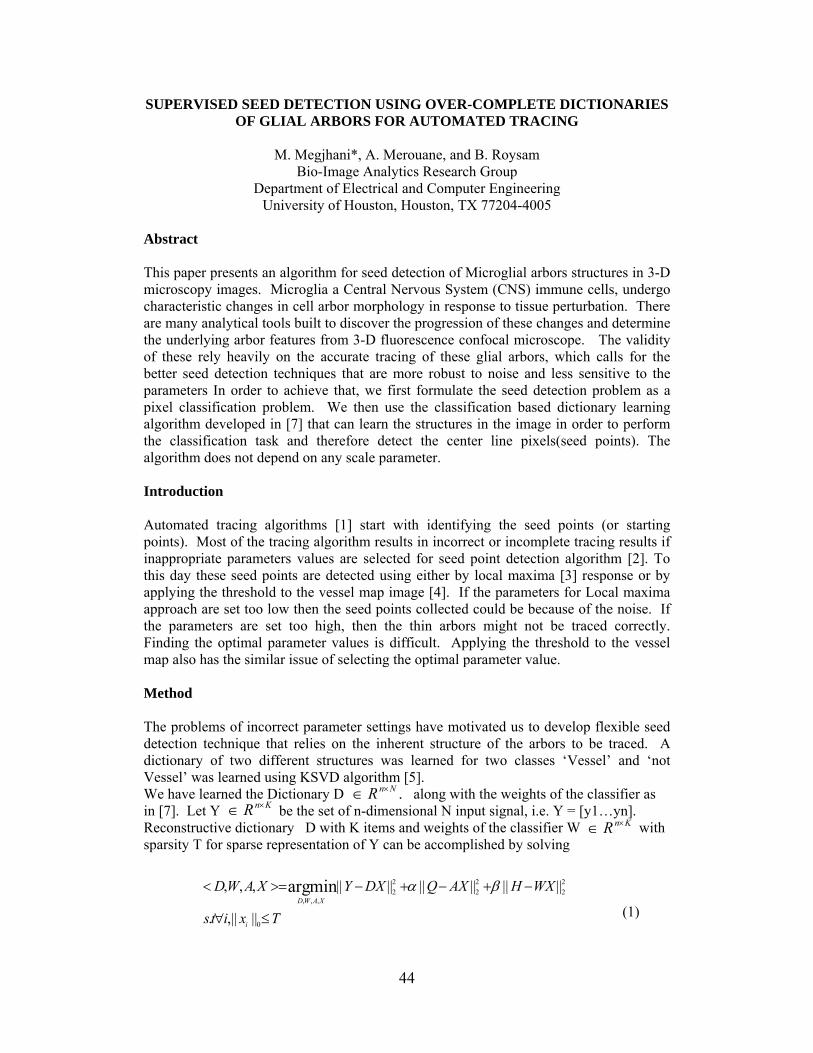
44
SUPERVISED SEED DETECTION USING OVER-COMPLETE DICTIONARIES OF GLIAL ARBORS FOR AUTOMATED TRACING
M. Megjhani*, A. Merouane, and B. Roysam
Bio-Image Analytics Research Group Department of Electrical and Computer Engineering
University of Houston, Houston, TX 77204-4005 Abstract This paper presents an algorithm for seed detection of Microglial arbors structures in 3-D microscopy images. Microglia a Central Nervous System (CNS) immune cells, undergo characteristic changes in cell arbor morphology in response to tissue perturbation. There are many analytical tools built to discover the progression of these changes and determine the underlying arbor features from 3-D fluorescence confocal microscope. The validity of these rely heavily on the accurate tracing of these glial arbors, which calls for the better seed detection techniques that are more robust to noise and less sensitive to the parameters In order to achieve that, we first formulate the seed detection problem as a pixel classification problem. We then use the classification based dictionary learning algorithm developed in [7] that can learn the structures in the image in order to perform the classification task and therefore detect the center line pixels(seed points). The algorithm does not depend on any scale parameter. Introduction Automated tracing algorithms [1] start with identifying the seed points (or starting points). Most of the tracing algorithm results in incorrect or incomplete tracing results if inappropriate parameters values are selected for seed point detection algorithm [2]. To this day these seed points are detected using either by local maxima [3] response or by applying the threshold to the vessel map image [4]. If the parameters for Local maxima approach are set too low then the seed points collected could be because of the noise. If the parameters are set too high, then the thin arbors might not be traced correctly. Finding the optimal parameter values is difficult. Applying the threshold to the vessel map also has the similar issue of selecting the optimal parameter value. Method The problems of incorrect parameter settings have motivated us to develop flexible seed detection technique that relies on the inherent structure of the arbors to be traced. A dictionary of two different structures was learned for two classes ‘Vessel’ and ‘not Vessel’ was learned using KSVD algorithm [5]. We have learned the Dictionary D along with the weights of the classifier as in [7]. Let Y be the set of n-dimensional N input signal, i.e. Y = [y1…yn]. Reconstructive dictionary D with K items and weights of the classifier W with sparsity T for sparse representation of Y can be accomplished by solving (1)
KnR
.NnR KnR
Txits
WXHAXQDXYXAWD
i
XAWD
0
2
2
2
2
2
2,,,
||||,.
||||||||||||,,, minarg
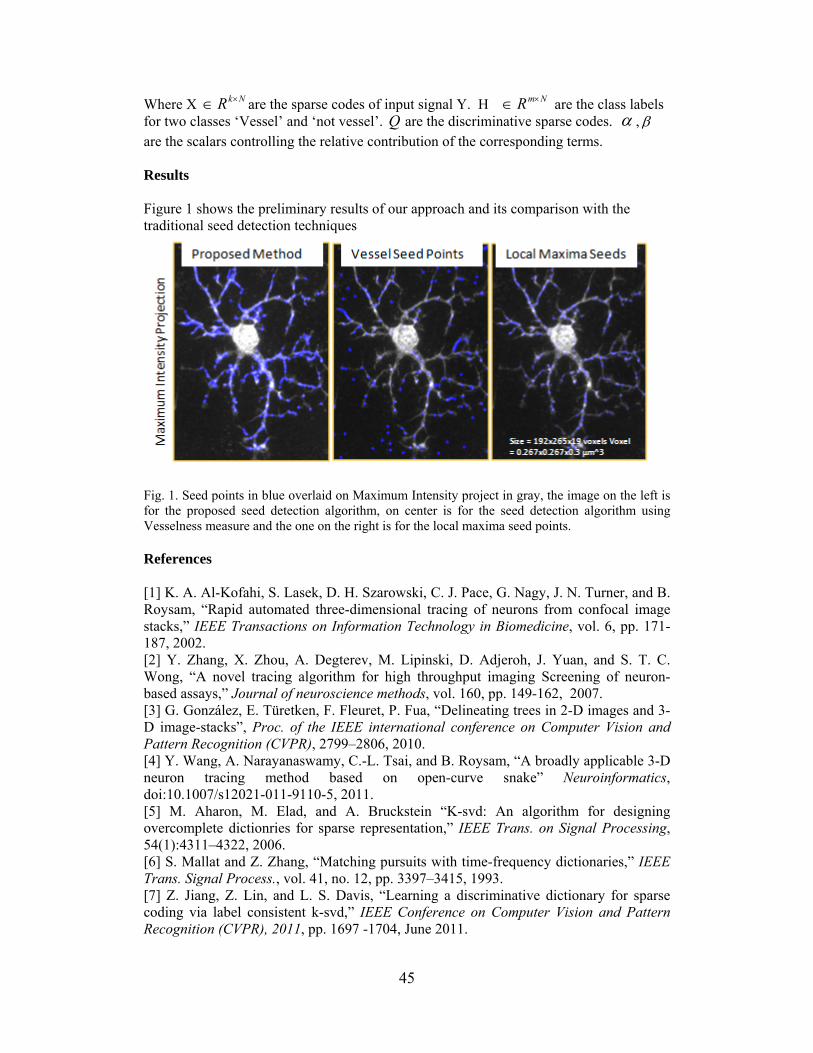
45
Where X are the sparse codes of input signal Y. H are the class labels for two classes ‘Vessel’ and ‘not vessel’. are the discriminative sparse codes. , are the scalars controlling the relative contribution of the corresponding terms. Results Figure 1 shows the preliminary results of our approach and its comparison with the traditional seed detection techniques
Fig. 1. Seed points in blue overlaid on Maximum Intensity project in gray, the image on the left is for the proposed seed detection algorithm, on center is for the seed detection algorithm using Vesselness measure and the one on the right is for the local maxima seed points. References [1] K. A. Al-Kofahi, S. Lasek, D. H. Szarowski, C. J. Pace, G. Nagy, J. N. Turner, and B. Roysam, “Rapid automated three-dimensional tracing of neurons from confocal image stacks,” IEEE Transactions on Information Technology in Biomedicine, vol. 6, pp. 171-187, 2002. [2] Y. Zhang, X. Zhou, A. Degterev, M. Lipinski, D. Adjeroh, J. Yuan, and S. T. C. Wong, “A novel tracing algorithm for high throughput imaging Screening of neuron-based assays,” Journal of neuroscience methods, vol. 160, pp. 149-162, 2007. [3] G. González, E. Türetken, F. Fleuret, P. Fua, “Delineating trees in 2-D images and 3-D image-stacks”, Proc. of the IEEE international conference on Computer Vision and Pattern Recognition (CVPR), 2799–2806, 2010. [4] Y. Wang, A. Narayanaswamy, C.-L. Tsai, and B. Roysam, “A broadly applicable 3-D neuron tracing method based on open-curve snake” Neuroinformatics, doi:10.1007/s12021-011-9110-5, 2011. [5] M. Aharon, M. Elad, and A. Bruckstein “K-svd: An algorithm for designing overcomplete dictionries for sparse representation,” IEEE Trans. on Signal Processing, 54(1):4311–4322, 2006. [6] S. Mallat and Z. Zhang, “Matching pursuits with time-frequency dictionaries,” IEEE Trans. Signal Process., vol. 41, no. 12, pp. 3397–3415, 1993. [7] Z. Jiang, Z. Lin, and L. S. Davis, “Learning a discriminative dictionary for sparse coding via label consistent k-svd,” IEEE Conference on Computer Vision and Pattern Recognition (CVPR), 2011, pp. 1697 -1704, June 2011.
NkR NmR Q

46
NUCLEAR SEGMENTATION FOR WHOLE BRAIN SECTIONS USING ELLIPTICAL KERNELS, STEERABLE FILTERS AND SECOND ORDER
GRAPH CUTS
Kedar B Grama* and Badrinath Roysam Bio-Image Analytics Research Group
Department of Electrical and Computer Engineering University of Houston
Houston, TX 77204-4005
Abstract
In this paper we present a method for the robust detection and segmentation of nuclei in 2D slices of the whole rat brain. The heterogeneity of the cell shapes, sizes and texture in a whole brain section presents a challenge to the current generation algorithms for nuclear segmentation. We propose a three step segmentation algorithm for the robust detection segmentation of nuclei.
Introduction
A majority of nuclear segmentation algorithms follow a two pronged strategy to segment nuclei, the first seed detection and the second segmentation refinement. The first step is usually a binarization step to detect the foreground pixels [1] in the image followed by either convolution with a circular and elliptical kernels [1] or radial voting frameworks [2] to detect the centers of the nuclei. The seed detection is followed by an initial segmentation step an estimate of the boundaries of the cells are produced to be passed on to a later refinement step. This can be a local maximum clustering [1] or Voronoi tessellation [2] or other methods where the seeds themselves alone are used for growing contours. With the segmentation refinement too there are a variety of methods available. The popular methods are graph cuts and, evolution of contours using partial differential equations (PDE). Alpha expansion [3] is the preferred graph cuts based method. The PDE based methods are active contours and level sets. We present methods to make these two steps more robust than what is present in the current literature below.
Methods
With the free availability of fast Fourier transform (FFT) based fast convolution algorithms [4] there has been a long history of development of steerable filters [5]. For the robust detection of the all nuclei in the rat brain where there is a large variation in the size, shape and textures of the nuclei we need to use a variety of elongated kernels. We use a set of steerable to filters to implement convolutions with a large range of Laplacian of Gaussians (LoG) which include elliptical kernel and get the maximum responses for each pixel. While these are robust to elliptical shapes and uniform blobs they are weak in detecting highly textured nuclei and nuclei with large unstained nuclei such as the pyramidal neurons in the cortex of the brain. To detect these nuclei, we use fast tensor voting framework [6] to get another set of responses for the nuclei and use a local widowed clustering to get the seeds for the nuclei. While computing the responses we store the kernel which corresponds to the maximum

47
response. Hence for each seed we have an accurate initial segmentation. We then initialize all the pixels under the corresponding kernel with a unique label and then use the improved graph cuts framework which includes the second order smoothness terms to refine the boundaries. The energy terms for the weights of the nodes and the edges in the graph are the same as those presented in [1]. Results
Shown below is a sample result of the proposed seed detection method. Results of the proposed initial labeling and refinement strategy will be presented on the poster.
Fig. 1. Details the segmentation steps. Left: Input image. Right: The seeds detected, green points represent the accepted seed and the red, rejected seeds where the LoG response and the tensor voting did not have corresponding local maxima in 5x5 window.
References
[1] Y. Al-Kofahi, W. Lassoued, W. Lee, and B. Roysam, “Improved automatic detection and segmentation of cell nuclei in histopathology images,” IEEE Transactions on Biomedical Engineering, 57(4), 841-852, 2010. [2] H. Chang, Q. Yang, and B. Parvin, “Segmentation of heterogeneous blob objects through voting and level set formulation,” Pattern recognition letters, 28(13), 1781-1787, 2007. [3] Y. Boykov, O. Veksler, and R. Zabih, “Fast approximate energy minimization via graph cuts,” IEEE Transactions on Pattern Analysis and Machine Intelligence, 23(11), 1222-1239, 2001. [4] M. Frigo, and S. G. Johnson, “The design and implementation of FFTW3,” Proceedings of the IEEE, 93(2), 216-231, 2005. [5] W. T. Freeman, and E. H. Adelson, “The design and use of steerable filters” IEEE Transactions on Pattern Analysis and Machine Intelligence, 13(9), 891-906, 1991. [6] E. Franken, M. Van Almsick, P. Rongen, L. Florack, and B.Ter Haar Romeny, “An efficient method for tensor voting using steerable filters”, In Computer Vision–ECCV, pp. 228-240, Springer Berlin Heidelberg, 2006. [7] O. Woodford, P. Torr, I. Reid, and A. Fitzgibbon, ”Global stereo reconstruction under second-order smoothness priors”, IEEE Transactions on Pattern Analysis and Machine Intelligence, 31(12), 2115-2128, 2009.

48
GRAPH BASED SEGEMENTATION OF HYPERSPECTRAL IMAGES
Tanu Priya*1, Minshan Cui1, and Saurabh Prasad1 1Department of Electrical and Computer Engineering
University of Houston Houston, TX 77204-4005
Abstract Hyperspectral images are associated with a large number of features and high dimensional data, which makes segmentation a challenging task. The interpretation of an image as a graph leads to a fast and efficient method of generating image segments. Considering the merits, graph based methods have become increasingly popular for image segmentation. In this research, we present a graph based approach for hyperspectral image segmentation. Our approach uses both spatial and spectral information from hyperspectral images, and segments more than one object. This approach can be applied in various fields and it represents an important advantage to the object segmentation field. Introduction As emphasized by the Gestalt theory that perceptual grouping plays an important role in human visual perception. Elements are structured into groups called segments sharing common features. Thus segmentations are helpful for object recognition. The wide availability of hyperspectral images led to new developments in the field of image segmentation. Graph based segmentation is one such computationally efficient method developed in recent years [1]. Each pixel in the image corresponds to a node in the graph. It is associated with a spectrum and edges that connect a node to its neighbors. These edges carry weights corresponding to a function which describes the divergence between the two spectra. Each pixel starts as a separate segment. Neighboring subgraphs are merged whenever there is no evidence of a boundary between the two regions, resulting in a segmented graph. The approach has been implemented to images with three channels [1]. In this work, we have extended the proposed study to multi-channel or hyperspectral images. Algorithm testing is done with real hyperspectral images. Related Work A predicate is defined for evaluating the evidence for a boundary between two components in a segmentation. The Felzenszwalb algorithm [1] determines the boundary evidence by comparing the weight associated with segment’s smallest connecting edge to the maximum internal weight in either subgraph. The resulting predicate compares the inter-component differences to the intra- component differences and is thereby adaptive with respect to the local characteristics of the data. The weight on the edge is the dissimilarity measure which is given by spectral divergence[2]. Euclidean distance across all wavelengths is used to compute the divergence.
49
Experimental Results Figure 1 shows a hyperspectral image of Pavia City. Figure 2 shows a segmented image of the city where each segment represents a homogenous area.
Fig. 1. - Pavia City Fig. 2. - Segmented Image Conclusion Experimental results presented in this work indicate that graph based segmentation is an efficient approach to segment a hyperspectral image. Our segmentation algorithm makes simple greedy decisions, and yet produces segmentations that obey the global properties of being not too coarse and not too fine according to a particular region comparison function. References [1] P. F. Felzenszwalb and D. P. Huttenlocher, “Efficient graph-based image segmentation,” Int. J. Comput. Vis., vol. 59, no. 2, pp. 167–181, Sep. 2004. [2] David R. Thompson, Lukas Mandrake, Martha S. Gilmore, and Rebecca Castaño, “Superpixel Endmember Detection” , IEEE,Vol. 48, No. 11, Nov. 2010 .

50
HYPERSPECTRALIMAGECLASSIFICATIONUSINGINFINITEGAUSSIANMIXTUREMODELS
Hao Wu*, Saurabh Prasad, and Minshan Cui
Hyperspectral Image Analysis Lab Department of Electrical and Computer Engineering
University of Houston Houston, TX 77204-4005
Abstract
In this work we present and apply a new Hyperspectral image classification method based on infinite Gaussian mixture models (IGMM). Since this approach is a non-parametric Bayesian method, we circumvent the problem of model selection which is unavoidable and often difficult when employing traditional parametric Gaussian mixture models (GMM). In the preprocessing step, we use Local Fisher’s Discriminant Analysis (LFDA) for dimension reduction. We compared our proposed IGMM based classification method to the existing state-of-the-art classification methods.
Introduction
Hyperspectral imagery (HSI) provides rich information captured over a wide range of the electromagnetic spectrum for each pixel in the image, making it suitable for ground cover classification applications. We need to do dimensionality reduction to the original data. Local Fisher’s Discriminant Analysis (LFDA) [1] had been applied to HSI since it preserves the statistical structure of multimodal and non-Gaussian data. When using GMM, the typical approach for determining the number of modes is to employ the Bayesian Information Criteria (BIC).Although LFDA-GMM achieves good classification performance, estimation of the number of modes may be inaccurate and it also requires a “tuning” process. IGMM The common generative Gaussian Mixture Model is [2]:
| ~ ( | ), | ~ ( | )i i i kc M ultinom ial x c k G aussian
(1) where the indicators
1{ }Ni iC c indicate which class each pixel belongs to, and
1{ } , { , }Kk k k k k
are parameters of Gaussian distribution. We choose conjugate
priors which yields a posterior that is in the same family as the prior, for the model parameters as following:
| ~ ( | ,..., ), ~ HDirichletK K
, (2)
where ~ H stands for:
0
10 0 0~ ( , / ), ~ ( )k k k vGaussian K Inverse Wishart
(3)
Since the posterior distributions for both C and Θ cannot be computed analytically, we
use Gibbs Sampler to obtain samples from it [2]. Upon convergence, these samples will
approximate the posterior distribution. We sample new values for Θ according to

51
H( | , , , , ) ( | , ) ( )i
k k i i k kc k
P C x P x c P
(4)
where 1 1 1{ , ..., , , ..., }k k k N and H ( )kP
is the probability of k
under H . C is
sampled according to ( | , , , , ) ( | , ) ( k | , )i i i i i iP c k C x P x c P c C
(5)
where 1 1 1{ , ..., , , ..., }i k k NC c c c c and
k, ,1( k | , )
,N 1
i
i i
nk K
iP c C
k K
(6)
This generative process in (6) is known as the Chinese restaurant process [3]. Experimental results Three classification algorithms are compared here: SVM, LFDA-GMM and LFDA-IGMM. The data we are using is "University of Pavia" and "Pavia Center". The classification results are in the Table 1.
TABLE 1: Overall Accuracies (%) as a function of number of training samples per class
Number of Training Samples per Class 40 70 100 150 Algorithms University of Pavia Data
SVM 84.28 84.58 85.46 89.90 LFDA-GMM 83.70 88.88 90.45 91.47 LFDA-IGMM 83.03 88.38 90.37 92.21
Algorithms Pavia Center Data SVM 91.25 93.88 94.72 95.55
LFDA-GMM 91.50 94.26 95.28 95.98 LFDA-IGMM 91.02 93.71 95.44 96.42
References
[1] W. Li, S. Prasad, J. E. Fowler and L. M. Bruce, “Locality-Preserving Dimensionality Reduction and Classification for Hyperspectral Image Analysis,” IEEE Transactions on Geoscience and Remote Sensing, vol. 50, no. 4, April 2012. [2] R. M. Neal, “Probabilistic inference using Markov chain Monte Carlo methods,” University of Toronto, Tech. Rep. CRG-TR-93-1, 1993. [3] T. L. Griffiths and Z. Ghahramani, “Infinite latent feature models and the Indian buffet process,” Gatsby Computational Neuroscience Unit, Tech. Rep. 2005-001, 2005.

52
COMPRESSIVE SENSING HYPERSPECTRAL MICROSCOPY, IMAGING AND ANALYTICS
Jing Lu* and Wei-Chuan Shih
NanoBioPhotonics Group Department of Electrical and Computer Engineering
University of Houston Houston, TX 77204-4005
Abstract We design and develop a hyperspectral imaging system using the theory of compressive sensing (CS). Compared to conventional hyperspectral imaging system collecting the whole 3D data cube, this novel system is able to use much fewer observations to reconstruct spectral and spatial information. In this system, a spatial light modulator (SLM) is used to generate a measurement pattern to get the coded projection of data cube and CS reconstruction method is used to estimate full data cube. Introduction Spectral imager is a useful technique widely used in many fields, such as biomedical analysis, environmental sensing. It collects a three-dimensional data cube which is the intensity of light as a function of spectral wavelength and spatial location. Conventional spectral imagers generate equal or larger number of measurements than the elements in the data cube. But for those spectra, they tend to be sparse on some basis, such as the wavelet basis, so that it is not necessary to collect the whole data cube. Fortunately, the development of CS technique makes it possible to obtain fewer measurements than before, and recover the original data cube using mathematical methods. In the past few years, many researchers developed some novel spectral imaging systems based on the theory of CS. Wagadarikar et al. proposed a coded aperture snapshot spectral imager (CASSI) which encodes 3D data cube into single shot two dimension array and then estimate the cube by solving an optimization problem [1]. Arguello et al. enhanced the reconstruction quality of CASSI by obtaining multiple shot measurements [2]. Then Wu et al. provide a more flexible solution to multishot snapshot spectral imager by using a digital micromirror device (DMD) [3]. However, the systems above could only reconstruct spectra with small amounts of bands. In this work, we present a hyperspectral imager which can reconstruct spectra in the range of dozens to hundreds of bands. Methods In this system, an input data cube is propagated to a liquid crystal based SLM which generates a random measurement pattern. After the spatial information is modulated, a dispersive element is used to generate spectral modulation of SLM modulated image. Then the measurements are captured by a standard charge-coupled device (CCD) detector. Finally, the input data cube is reconstructed using two-step iterative shrinkage/thresholding (TwIST) algorithm developed by Bioucas-Dias et al [4]. We simulate the measurement acquisition process by using computer that implements spatial and spectral modulation, and investigate the reconstruction. Spectra used are

53
collected by Raman microscopy with 801 spectral bands. The data cube simulated has spatial image size 200×200 pixels and 40 spectral bands which are obtain by adding every five bands together from original spectra. This data cube is spatially encoded by random generated SLM pattern which is a binary mask with 37% pixels on and 63% pixels off. Then after the dispersive element, the measurement we get is a matrix with size 200×240 pixels. During the recovery process, we use TwIST solver to obtain the reconstructed data cube. References [1] A. Wagadarikar, R. John, R. Willett, and D. Brady, "Single disperser design for coded aperture snapshot spectral imaging," Applied Optics, vol. 47, no. 10, pp. B44-B51, 2008. [2] H. Arguello and G. R. Arce, "Code aperture optimization for spectrally agile compressive imaging," JOSA A, vol. 28, no. 11, pp. 2400-2413, 2011. [3] Y. Wu, I. O. Mirza, G. R. Arce, and D. W. Prather, "Development of a digital-micromirror-device-based multishot snapshot spectral imaging system," Optics Letters, vol.36 no.14, pp. 2692-2694, 2011. [4] J. M. Bioucas-Dias, and M. A. T. Figueiredo, "A new TwIST: two-step iterative shrinkage/thresholding algorithms for image restoration," IEEE Transactions on Image Processing, vol.16 no.12, pp. 2992-3004, 2007.
54
LOCALIZED SURFACE PLASMON RESONANCE IN GOLD NANOISLAND AND NANOPOROUS GOLD SUBSTRATES
Szu-Te Lin*, Pratik I. Motwani, J. C. Wolfe, and Wei-Chuan Shih
Bio-Nano-Photonics Research Group Department of Electrical and Computer Engineering
University of Houston Houston, TX 77204-4005
Abstract
We measure the extinction spectra of nanoporous gold (NPG) by nitric acid dealloying from Au-Ag film and sputtered gold nanoisland in both transmission and reflection modes. We can control the nanoisland feature size by changing the deposition time and the porous size by varying dealloying condition. We found two peaks from extinction spectra. One less than 500nm corresponds to the resonant absorption of gold and the other ranging from 520nm to NIR represents the localized surface plasmon resonance (LSPR) excitation from different nanostructure. The shift band determines the adequate incident wavelength for surface-enhanced Raman spectroscopy (SERS).
Introduction
A surface plasmon is an electro-magnetic wave propagating alone the surface of a thin metal layer. The surface plasmon can absorb or scatter the incident light and resulting an extinction peak. If the plasmon resonance occurs on nano-scale fine structure, it is called localized surface plasmon resonance. The extinction peak may vary due to different dielectric media or different surface structures [1, 2]. The extinction peak can be used to identify the laser wavelength for Raman spectroscopy. The band shift property has been applied on organic and biologic molecule detection. In this paper, we demonstrate the ability of LSPR measurement as a quick refractive index sensing tool.
Methods
The LSPR measurement has been done in reflection and transmission modes. Transmission mode can measure highly transparent material like thin gold coating on coverslips. A broadband white light is collimated and shine on the sample. The light is scattered and absorbed by the thin gold coating and the transmitted light is collected by fiber to a spectrometer (Thorlabs CCS200). In contrast, mirrorlike substrates such as silicon or thick gold on coverslips need to be measured by reflection mode. The white light is guided from one branch of a multimode fiber optical coupler (FIS MMC38550129C) to the combined port. The sample is placed very close to the fiber and the reflected light is collected by the same fiber and delivered to the other branch which is connected to the spectrometer.
The gold nanoisland is sputtered on hydrofluoric treated silicon or piranha cleaned coverslips by Hummer sputter coater system (Technics). The NPG formation contains two processing steps. First is the convention top-down deposition of Au-Ag film on substrate. The less noble metal is then dissolved in concentrated nitric acid. The leftover gold will form a porous structure during the process. The pore and ligament sizes can be controlled by changing the dealloying time and temperature [2, 3]. The NPG film can also be synthesized by dealloying a white gold leaf [4].
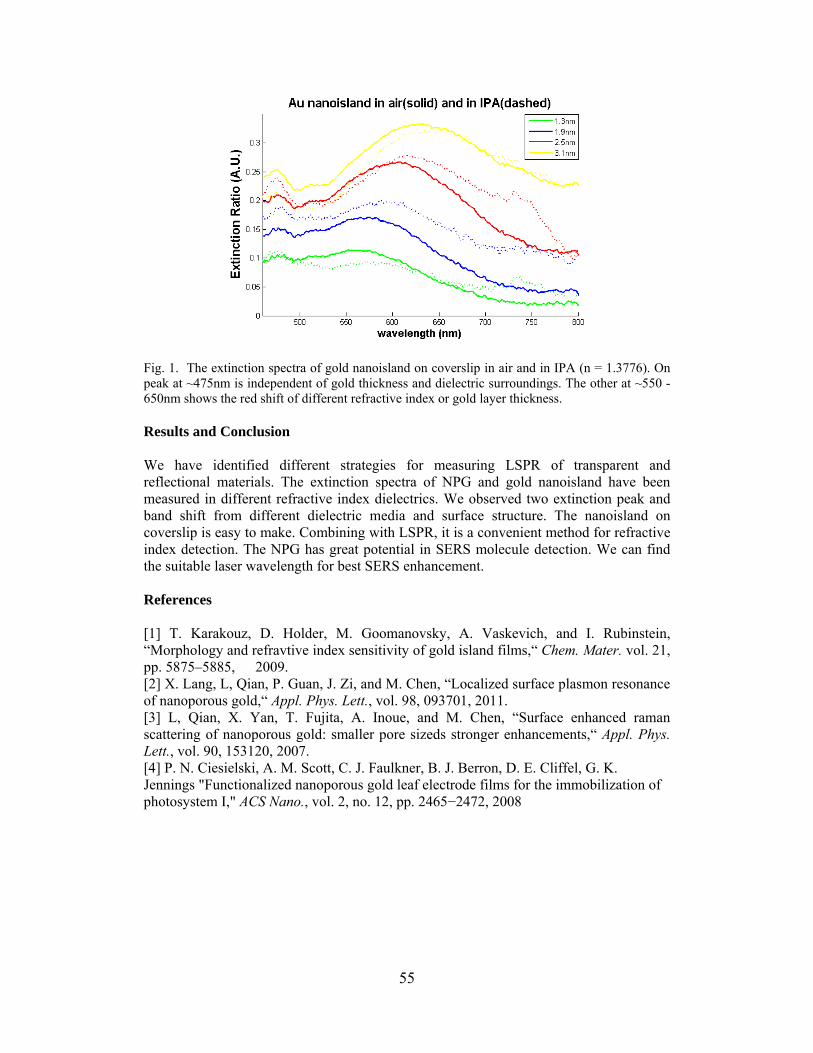
55
Fig. 1. The extinction spectra of gold nanoisland on coverslip in air and in IPA (n = 1.3776). On peak at ~475nm is independent of gold thickness and dielectric surroundings. The other at ~550 - 650nm shows the red shift of different refractive index or gold layer thickness.
Results and Conclusion
We have identified different strategies for measuring LSPR of transparent and reflectional materials. The extinction spectra of NPG and gold nanoisland have been measured in different refractive index dielectrics. We observed two extinction peak and band shift from different dielectric media and surface structure. The nanoisland on coverslip is easy to make. Combining with LSPR, it is a convenient method for refractive index detection. The NPG has great potential in SERS molecule detection. We can find the suitable laser wavelength for best SERS enhancement.
References
[1] T. Karakouz, D. Holder, M. Goomanovsky, A. Vaskevich, and I. Rubinstein, “Morphology and refravtive index sensitivity of gold island films,“ Chem. Mater. vol. 21, pp. 5875–5885, 2009. [2] X. Lang, L, Qian, P. Guan, J. Zi, and M. Chen, “Localized surface plasmon resonance of nanoporous gold,“ Appl. Phys. Lett., vol. 98, 093701, 2011. [3] L, Qian, X. Yan, T. Fujita, A. Inoue, and M. Chen, “Surface enhanced raman scattering of nanoporous gold: smaller pore sizeds stronger enhancements,“ Appl. Phys. Lett., vol. 90, 153120, 2007. [4] P. N. Ciesielski, A. M. Scott, C. J. Faulkner, B. J. Berron, D. E. Cliffel, G. K. Jennings "Functionalized nanoporous gold leaf electrode films for the immobilization of photosystem I," ACS Nano., vol. 2, no. 12, pp. 2465−2472, 2008
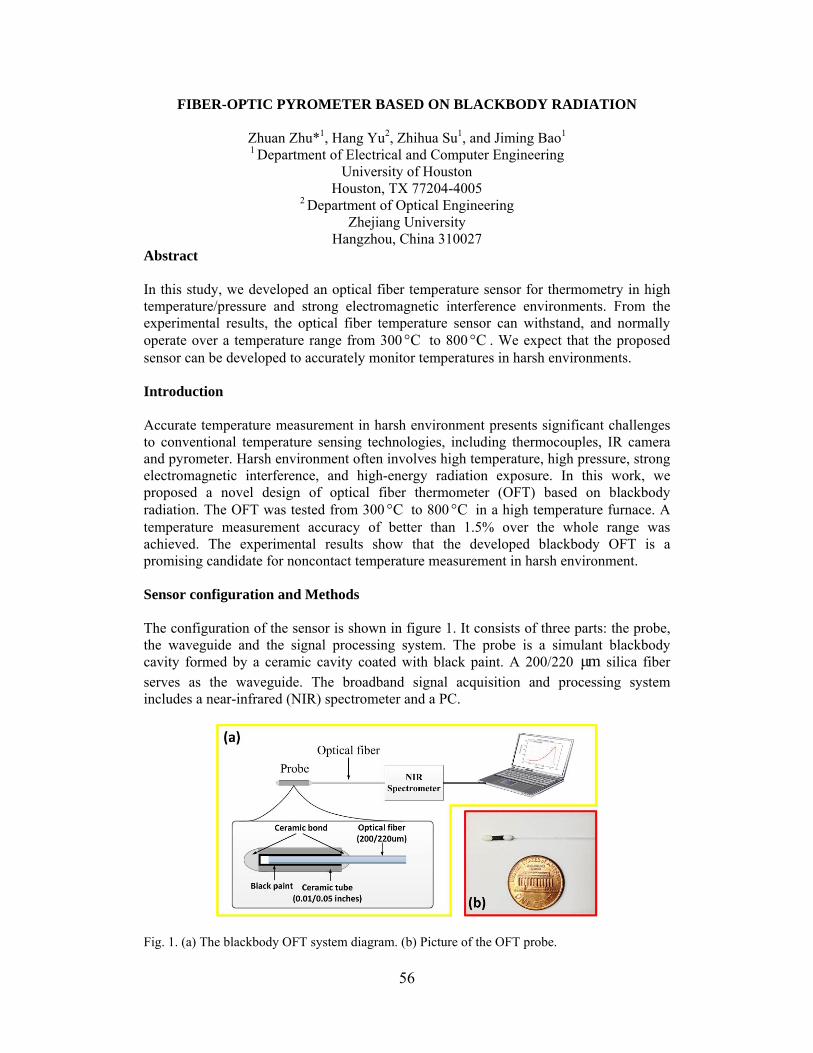
56
FIBER-OPTIC PYROMETER BASED ON BLACKBODY RADIATION
Zhuan Zhu*1, Hang Yu2, Zhihua Su1, and Jiming Bao1 1 Department of Electrical and Computer Engineering
University of Houston Houston, TX 77204-4005
2 Department of Optical Engineering Zhejiang University
Hangzhou, China 310027 Abstract In this study, we developed an optical fiber temperature sensor for thermometry in high temperature/pressure and strong electromagnetic interference environments. From the experimental results, the optical fiber temperature sensor can withstand, and normally operate over a temperature range from 300 °C to 800 °C . We expect that the proposed sensor can be developed to accurately monitor temperatures in harsh environments. Introduction Accurate temperature measurement in harsh environment presents significant challenges to conventional temperature sensing technologies, including thermocouples, IR camera and pyrometer. Harsh environment often involves high temperature, high pressure, strong electromagnetic interference, and high-energy radiation exposure. In this work, we proposed a novel design of optical fiber thermometer (OFT) based on blackbody radiation. The OFT was tested from 300 °C to 800 °C in a high temperature furnace. A temperature measurement accuracy of better than 1.5% over the whole range was achieved. The experimental results show that the developed blackbody OFT is a promising candidate for noncontact temperature measurement in harsh environment. Sensor configuration and Methods The configuration of the sensor is shown in figure 1. It consists of three parts: the probe, the waveguide and the signal processing system. The probe is a simulant blackbody cavity formed by a ceramic cavity coated with black paint. A 200/220 μm silica fiber serves as the waveguide. The broadband signal acquisition and processing system includes a near-infrared (NIR) spectrometer and a PC.
Fig. 1. (a) The blackbody OFT system diagram. (b) Picture of the OFT probe.

57
According to blackbody radiation theory, we can determine the temperature of any warm object by measuring the emitted IR radiation and fitting the radiation spectrum by Planck's radiation function. However, in practical cases, three main factors should be taken into consideration: 1) the ceramic cavity emissivity ; 2) the optical path factor ; 3) the photo detector responds . So, a system correction should be done before blackbody radiation fitting. In this study, all these factors can be taken as constants. To get the correction factors, our solution is dividing the blackbody radiation spectrum at temperature T1 by the radiation spectrum of the OFT at the same temperature. Results The blackbody OFT was tested from 300 °C to 800 °C in a high-temperature furnace. The probe of the OFT was placed in the furnace and a K-type thermocouple was placed in the same position to monitor the furnace temperature. The furnace temperature was increased with step of 50 °C . Data obtained by thermocouple and the OFT are listed in table 1. Here, the temperature T for system correction is 582.1 °C . The maximum deviation of temperature test results of the OFT and thermocouple is about 1.5%. When the temperature higher then 434.0 °C , the deviation is within 0.2%. This is a good result among current OFTs.
Thermocouple ( °C )
Fiber Sensor ( °C )
Thermocouple ( °C )
Fiber Sensor ( )
287.3 283.0 584.5 584.74 335.7 332.7 634.1 634.48 384.0 381.8 683.5 683.63 434.0 434.8 733.3 734.29 482.7 482.71 783.3 784.04 533.0 533.42
Table 1. Results of the test of blackbody optical fiber sensor in a high-temperature furnace from 287.3 ºC to 783.3 ºC. Conclusion In this study, a blackbody optical fiber thermometer was developed for accurate thermometry in harsh environment without complicated fabrication and calibration processes. Experimental results show that the OFT has a stable performance from 300 to 800 °C , and achieve a temperature measurement accuracy of better than 1.5% over the whole temperature range. References [1] R. R. Dils, “High-temperature optical fiber thermometer,” Journal of Applied Physics, vol. 54.3, pp. 1198--1201, 1983. [2] L. Tong, et al., “A Zirconia single-crystal fiber-optic sensor for contact measurement of temperatures above 2000°C ,” Measurement Science and Technology, vol. 10, pp. 607--611, 1999. [3] Y. B. Yu, W. K. Chow, “Review on an advanced high-temperature measurement technology: the optical fiber thermometry,” Journal of Thermodynamics, vol. 2009, pp. 1--12, 2009.
°C
°C
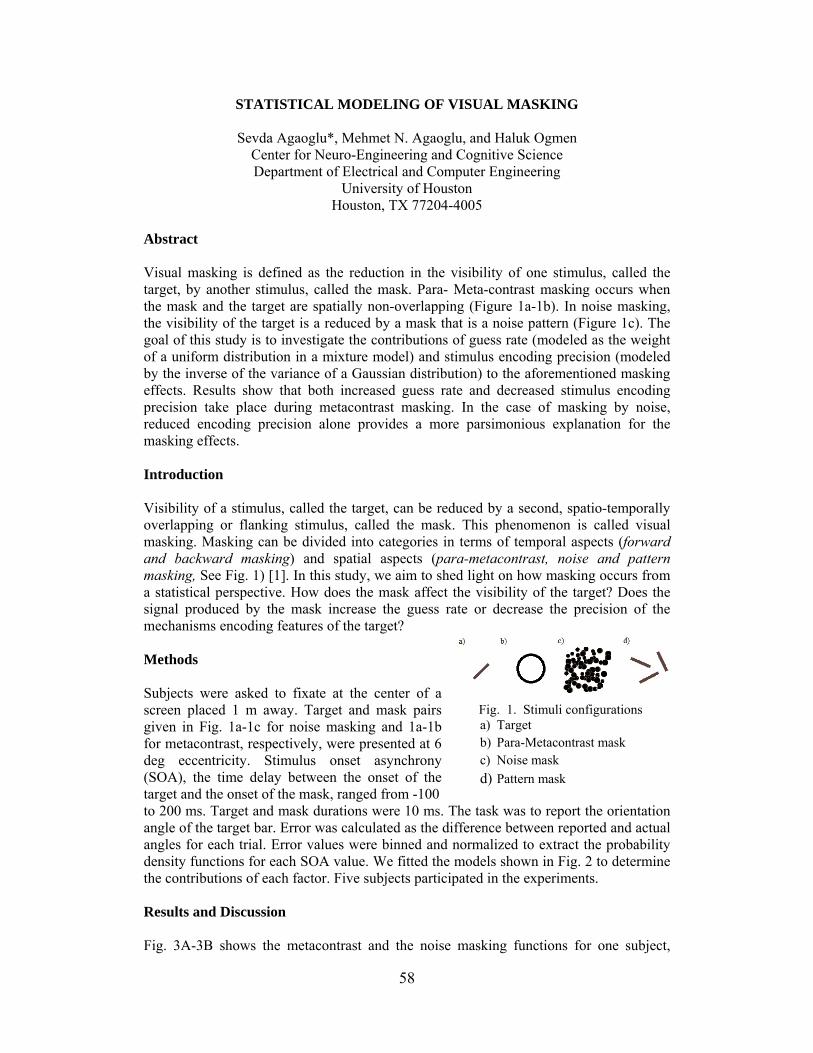
58
STATISTICAL MODELING OF VISUAL MASKING
Sevda Agaoglu*, Mehmet N. Agaoglu, and Haluk Ogmen Center for Neuro-Engineering and Cognitive Science Department of Electrical and Computer Engineering
University of Houston Houston, TX 77204-4005
Abstract Visual masking is defined as the reduction in the visibility of one stimulus, called the target, by another stimulus, called the mask. Para- Meta-contrast masking occurs when the mask and the target are spatially non-overlapping (Figure 1a-1b). In noise masking, the visibility of the target is a reduced by a mask that is a noise pattern (Figure 1c). The goal of this study is to investigate the contributions of guess rate (modeled as the weight of a uniform distribution in a mixture model) and stimulus encoding precision (modeled by the inverse of the variance of a Gaussian distribution) to the aforementioned masking effects. Results show that both increased guess rate and decreased stimulus encoding precision take place during metacontrast masking. In the case of masking by noise, reduced encoding precision alone provides a more parsimonious explanation for the masking effects. Introduction Visibility of a stimulus, called the target, can be reduced by a second, spatio-temporally overlapping or flanking stimulus, called the mask. This phenomenon is called visual masking. Masking can be divided into categories in terms of temporal aspects (forward and backward masking) and spatial aspects (para-metacontrast, noise and pattern masking, See Fig. 1) [1]. In this study, we aim to shed light on how masking occurs from a statistical perspective. How does the mask affect the visibility of the target? Does the signal produced by the mask increase the guess rate or decrease the precision of the mechanisms encoding features of the target? Methods Subjects were asked to fixate at the center of a screen placed 1 m away. Target and mask pairs given in Fig. 1a-1c for noise masking and 1a-1b for metacontrast, respectively, were presented at 6 deg eccentricity. Stimulus onset asynchrony (SOA), the time delay between the onset of the target and the onset of the mask, ranged from -100
Fig. 1. Stimuli configurations a) Target b) Para-Metacontrast mask c) Noise mask
d) Pattern mask
to 200 ms. Target and mask durations were 10 ms. The task was to report the orientation angle of the target bar. Error was calculated as the difference between reported and actual angles for each trial. Error values were binned and normalized to extract the probability density functions for each SOA value. We fitted the models shown in Fig. 2 to determine the contributions of each factor. Five subjects participated in the experiments. Results and Discussion Fig. 3A-3B shows the metacontrast and the noise masking functions for one subject,
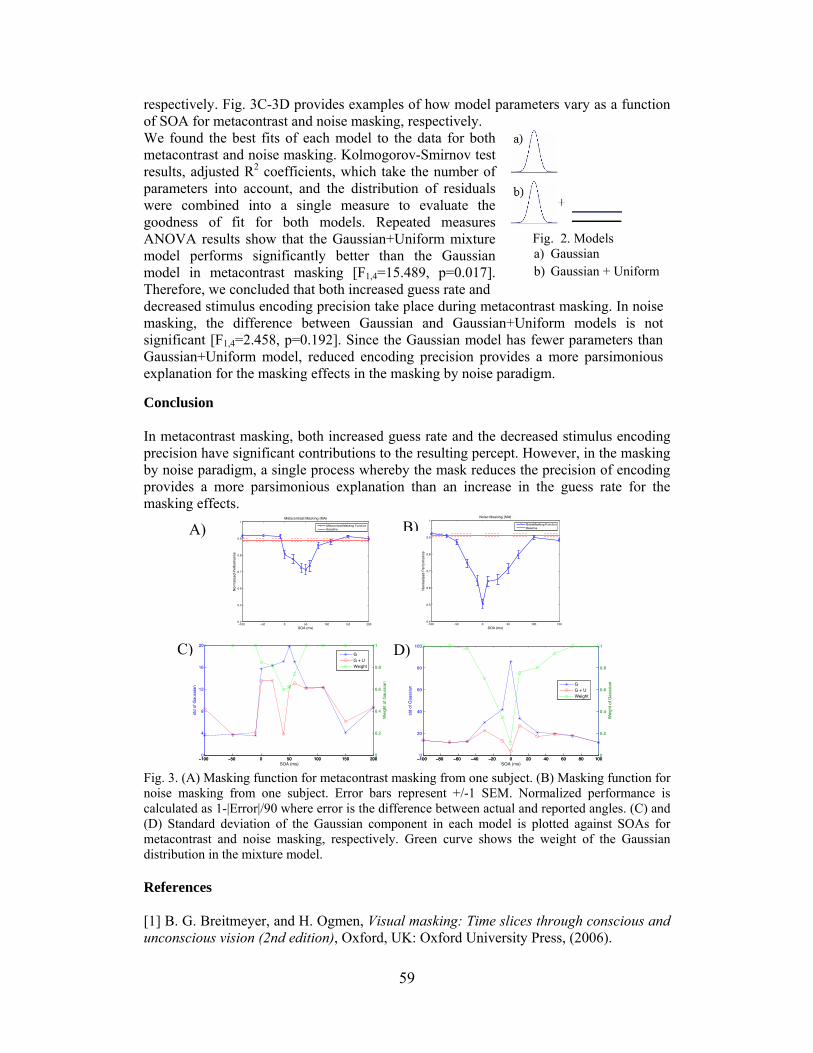
59
respectively. Fig. 3C-3D provides examples of how model parameters vary as a function of SOA for metacontrast and noise masking, respectively. We found the best fits of each model to the data for both metacontrast and noise masking. Kolmogorov-Smirnov test results, adjusted R2 coefficients, which take the number of parameters into account, and the distribution of residuals were combined into a single measure to evaluate the goodness of fit for both models. Repeated measures ANOVA results show that the Gaussian+Uniform mixture model performs significantly better than the Gaussian model in metacontrast masking [F1,4=15.489, p=0.017]. Therefore, we concluded that both increased guess rate and
Fig. 2. Models a) Gaussian b) Gaussian + Uniform
decreased stimulus encoding precision take place during metacontrast masking. In noise masking, the difference between Gaussian and Gaussian+Uniform models is not significant [F1,4=2.458, p=0.192]. Since the Gaussian model has fewer parameters than Gaussian+Uniform model, reduced encoding precision provides a more parsimonious explanation for the masking effects in the masking by noise paradigm.
Conclusion In metacontrast masking, both increased guess rate and the decreased stimulus encodingprecision have significant contributions to the resulting percept. However, in the maskingby noise paradigm, a single process whereby the mask reduces the precision of encodingprovides a more parsimonious explanation than an increase in the guess rate for the masking effects.
Fig. 3. (A) Masking function for metacontrast masking from one subject. (B) Masking function for noise masking from one subject. Error bars represent +/-1 SEM. Normalized performance is calculated as 1-|Error|/90 where error is the difference between actual and reported angles. (C) and (D) Standard deviation of the Gaussian component in each model is plotted against SOAs for metacontrast and noise masking, respectively. Green curve shows the weight of the Gaussian distribution in the mixture model. References [1] B. G. Breitmeyer, and H. Ogmen, Visual masking: Time slices through conscious and unconscious vision (2nd edition), Oxford, UK: Oxford University Press, (2006).
A) B)
D) C)
60
ALLOCATION OF VISUAL ATTENTION TO STATIC AND DYNAMIC STIMULI
Fahrettin F. Gonen*1, Hamza Hallal2, and Haluk Ogmen1 Center for Neuro-Engineering and Cognitive Science 1 Department of Electrical and Computer Engineering
2 Department of Mechanical Engineering University of Houston
Houston, TX 77204-4005
Abstract
Under normal viewing conditions, our visual system receives a staggering amount of information from the environment. Given that the brain has limited resources and capacity, it is essential to understand how attentional processes select targets of interest in a scene. Most of the research in this area focused on the allocation of attention to static objects. Since moving objects constitute a crucial aspect of our ecological environment, we analyzed the allocation of attention to moving targets. In particular, we focused on spatial and “object-based” components of attention and how perceptual grouping determines object-level units. Subjects respond significantly faster to static objects compared to dynamic ones. Spatial, rather than object-based”, component was the main factor controlling the allocation of attention in dynamic displays. Furthermore, we found that grouping by color plays a major role for both static and dynamic stimuli in determining how attentional processes select targets of interest.
Introduction
The first goal of this project is to study how attention is allocated to moving targets. The second goal is to examine the effect of grouping by color in the allocation of attention. Short cue-target delays facilitate target detection [2]. For static stimuli, an “object effect” was indicated by the advantage of a target stimulus positioned inside the cued object relative to a target at the same distance from the cue but positioned outside the cued object [3]. For dynamic stimuli, the cue facilitated the detection based on both object and space relations [4]. Taken together, the results of previous studies showed that the allocation of attention for dynamic stimuli follows both low-level (space effect) and higher level (object effect) factors. Here, we extended these studies with the following specific aim: investigation of perceptual grouping by color using moving objects with same versus different colors.
Methods
The author and 11 naive observers having normal or corrected to normal vision participated in the experiment. Stimuli were presented on a 20-inch color monitor in a dark room, with a black background. The resolution of the display was set to 656 x 492 pixels. The stimuli were generated by using a video card (Visual Stimulus Generator; VSG 2/3). A fixed head and chin rest was set to a distance of 1 m. from the display monitor. Egly et al.’s (1994) experiment was modified in order to allow the whole stimulus to rotate around a circle of fixed radius. The fixation point was a white plus sign placed in the center of the monitor. Stimuli consisted of four arcs rotating around the fixation point (Fig. 1 right panel). The cued item and the item in which the target appeared had either the same or different color. The task of the observer was to press a joystick button as soon as the target appeared. Reaction time (RT) was the dependent variable. Results were analyzed with repeated measures ANOVA and t-tests with

61
Bonferroni correction. Results
The left panel of Fig. 1 shows the mean RT and standard errors.
Fig. 1. RT averaged across observers 1 SEM (left) and illustration of the stimulus (right).
Observers respond to targets in static stimuli significantly faster than those in dynamic stimuli (F(1,11)=20.639, p=0.004). For the static stimulus, RTs for the invalid between condition are significantly higher than the other conditions indicating an object-effect. In the dynamic case, RTs for the invalid between condition were not significantly different, suggesting the absence of an object effect. In contrast, RTs for invalid space were significantly shorter than the other three conditions, indicating a space effect. The effect of color grouping was significant (F(1,11)=8.210, p=0.029) and there was no interaction between grouping and motion condition (F(1,11)=0.132, p=0.729).
Conclusions
Our results show that observers are faster in detecting targets in static stimuli compared to dynamic stimuli. For static stimuli, attention is allocated preferentially to “objects”. In contrast, for dynamic stimuli, the spatial location of the cue determines the allocation of attention. Color grouping plays an important role for the allocation of attention for both static and dynamic stimuli. Taken together, our results suggest that although commonalities exist between how attention is allocated to static and dynamic objects, rules governing the allocation of attention differ based on the movement of the object.
References
[1] Abrams, R. A., & Law, M. B., “Object-based visual attention with endogenous orienting.” Perception and Psychophysics, 62, 818–833, 2000. [2] Duncan, J. “Selective attention and the organization of visual information.” Journal of Experimental Psychology: General, 113, 501–517, 1984. [3] Egly, R., Driver, J., & Rafal, R. D. “Shifting attention between objects and locations: Evidence from normal and parietal lesion subjects.” Journal of Experimental Psychology: General, 123, 161–177, 1994. [4] Hallal H., Ogmen H., “Allocation of attention for dynamic stimuli in human vision” Summer Undergraduate Research Day (SURF), 2012.

62
DSTATCOM OPTIMAL SIZING FOR WIND FARM REACTIVE POWER COMPENSATION
Venkata Siddartha Dasari*1 and Amin Khodaei1
1 Department of Electrical and Computer Engineering University of Houston
Houston, TX 77204-4005 Abstract
Wind Energy is a promising alternative to generate clean electrical energy devoid of greenhouse gas emissions. With the increase in penetration of wind energy, voltage stability has become a cause for concern and reactive power compensators are employed to maintain the voltage within the desired range. Apart from the voltage stability issues, reactive power compensation is also necessary for better transient responses to faults and other disturbances. In the earlier days, this was performed by static devices like shunt capacitor which thereafter lead to the utilization of DVR, SVC’s and STATCOM’s. DSTATCOMs are seen as a bright prospect for better dynamic response. The amount of reactive power compensation required by the system decides the optimal size and the placement of a DSTATCOM which requires further research and analysis.
Introduction
Presently, harnessing the immense potential of wind energy to generate electricity with the help of high capacity wind turbines is of great importance as there is a surge in electricity usage. By the end of 2011, the United States is the largest wind energy producer of 95.2TWh i.e. 27.6% of wind generated electricity produced throughout the world. In the United States, Texas tops the Installed wind Power Capacity with 10,929 MW. The incorporation of the wind energy is predicted to provide a foundation for a healthy tomorrow with sustainable energy resources. With the increasing growth in wind turbine size and generation, reactive power compensation has become one of the important factors to be taken into consideration. Reactive Power is basically described as the background energy movement in an Alternating current (AC) system from the production of electric and magnetic fields. The amount of reactive power produced or absorbed by the wind farm and the grid changes as the power changes at different wind speeds. At lower wind speeds, the generation of real power will be less and therefore lesser amount of reactive power is necessary. For reactive power compensation, flexible AC transmission system (FACTS) devices such as distributed static compensator (DSTATCOM), Static Var Compensator (SVC), and switched capacitor banks are used. Though DSTATCOMs are expensive when compared to SVCs, their ability to provide more capacitive reactive power when there is a sudden voltage collapse makes them the most reliable reactive power compensator device. Model Outline This paper presents the medium voltage DSTATCOM technology which adds the missing functionality to wind parks to become Grid Code compliant. The DSTATCOM is in principle a voltage source converter (VSC) connected to the grid via a coupling transformer. If the compensator voltage is greater than the grid voltage, then the DSTATCOM acts like a capacitor device generating reactive power required by the grid.

63
Conversely, if the magnitude of grid voltage is greater than the compensator voltage, the device acts like an inductor consuming reactive power. In either of the cases the grid current is phase shifted by 90 degrees compared to the grid voltage. Literature suggests that the requirement of reactive power is approximately one third of the nominal active power generated by a wind park. The given power system is analysed and various parameters like the voltage per unit, power loss in the line, reactive power required by the line and the power factor are calculated. As a DSTATCOM can generate up to double of reactive power for duration of a few seconds, the sizing of the DSTATCOM has to be done based on this factor. As the present model consists of a DSTATCOM and a static compensating device like a switched capacitor bank, optimization has to be done to determine which among the devices will produce the required reactive power. If the device generates more reactive power than required by a particular bus, the additional reactive power can be transmitted to the neighbouring buses which results in increased efficiency of the device. There are many operating constraints involved in the optimization process of sizing a DSTATCOM, such as limiting the voltage within a particular range, maintaining the power factor above a particular value, and the investment cost. The power losses in the line has also to be considered and the number of static and dynamic reactive power compensating devices to be incorporated. By considering all the constraints and the sensitivity factors the optimization has to be performed either by deterministic approach or by a non-deterministic evolutionary algorithmic approach. As of now many optimization techniques like Particle Swarm Optimization, Genetic Algorithm, and Averaging Technique have been performed. Thereby installing a DSTATCOM, the power quality can be improved by reducing the voltage flicker, stabilizing the voltage level and improving the network recovery during line fault. In this research a new deterministic method will be proposed to optimally size the DSTATCOMs required for efficient operation of a wind farm.
Conclusion
Reactive power is necessary for maintaining voltage stability and to reduce flickering problem. Whenever there is a considerable drop in the voltage which may lead to failure of electric power grid, this effect can be mitigated by using a reactive power compensator. For this purpose, there is a great necessary of determining the optimum size of a DSTATCOM that is required to cater the needs of reactive power. References
[1] F. Jiangxia, L. Jun, Z. Feng, and W. Chengfu, “Researches on reactive power compensation for wind farms based on statistical law of wind power,” IEEE PES Innovative Smart Grid Technologies, no. 1, pp. 1–4, May 2012. [2] E. Babaei, A. Nazarloo, and S. H. Hosseini, “Application of flexible control methods for D-STATCOM in mitigating voltage sags and swells,” 2010 Conference Proceedings IPEC, pp. 590–595, Oct. 2010. [3] S. Varshney, L. Srivastava, and M. Pandit, “Optimal location and sizing of STATCOM for voltage security enhancement using PSO-TVAC,” 2011 International Conference on Power and Energy Systems, pp. 1–6, Dec. 2011. [4] S. Bahramirad, W. Reder, and A. Khodaei, “Reliability-Constrained Optimal Sizing of Energy Storage System in a Microgrid,” IEEE Transactions on Smart Grid, vol. 3, no. 4, pp. 2056–2062, Dec. 2012.

64
SMART CHARGING STATION FOR PHEVS BASED ON DC BUS VOLTAGE SENSING
P. Goli*1,2 and W. Shireen1,2
Power Electronics and Renewable Energy Systems Research Lab 1 Department of Electrical and Computer Engineering
2College of Technology University of Houston
Houston, TX 77204-4005
Abstract It has been estimated that, there will be one million Plug-In Hybrid Electric Vehicles (PHEVs) by the end of this decade. There is a growing risk that, this proliferation in the number of PHEVs will trigger extreme surges in demand while charging them during rush hours. To mitigate this impact, a unique charging station architecture is proposed in which the rate of charging of the PHEVs is controlled in such a way that the impact of charging during peak load period is not felt on the grid. The power needed to charge the plug-in hybrids comes from grid-connected photovoltaic generation or the utility or both. A unique control strategy based on DC bus voltage sensing is proposed for the above system for efficient transfer of energy. By using the proposed control strategy, the operations of charging station can be categorized into four modes: grid-connected rectification, PV charging and grid- connected rectification, PV charging and grid-connected inversion.
Introduction
There would be one million plug-in hybrid electric vehicles on the road by the year 2015 [1, 2]. This will add extra load to the already overloaded U.S grid. Though the increase in awareness about PHEVs is a healthy development, it’s the customer who makes the final call as to when and how to charge their vehicles, which could mean challenges for electric utilities and charging service providers. Hence, there is an immediate need to develop charging station infrastructure integrating renewable energy with smart grid technologies. The proposed charging station will charge the PHEVs from the photovoltaic system, thus reducing the stress on the grid. When the grid is at peak and solar power is insufficient to charge the PHEVs then the charging station would enable vehicle charging to be delayed or temporarily interrupted. The charging station also includes an energy storage unit (ESU) which consists of a battery bank to store energy during off peak hours which can be used during emergencies to charge the PHEVs.
Proposed Architecture
Figure 1 shows the block diagram of the proposed charging station architecture. The main components of the charging station are the PCU, PV array, energy storage unit and the controller. The PCU consists of a DC/DC boost converter which also performs the function of maximum power point tracking (MPPT), a DC/DC buck converter with battery management system (BMS), an energy storage unit (ESU) and a DC/AC bi-directional grid tied converter. The BMS prevents the PHEV from getting overcharged and also controls the rate of charge when the situation demands. The ESU will support the charging of PHEV when there is no power available either from the grid or the PV system. The battery pack in the ESU can be charged by the grid during off peak hours.

65
The controller monitors and controls the direction of power flow in the system. As shown in Figure 1 the operation of the control algorithm is based on five inputs among which VDC.bus, SOC and IDTR are used for taking decisions to determine the direction of power flow [3, 4]. By using the proposed control strategy, the operations of charging station can be categorized into four modes: grid-connected rectification, PV charging and grid- connected rectification, PV charging, PV charging and grid-connected inversion.
Fig. 1. Detailed block diagram showing the PCU and controller in detail Conclusions
This paper proposes a charging station architecture by using a combination of photovoltaic system and smart charging strategies. A unique control strategy based on DC bus voltage sensing, which decides the direction of power flow is presented. The proposed charging station architecture in a parking lot features advantages such as low cost, pollution free environment, and low maintenance. Therefore, charging a PHEV using solar power is one of the most attractive options, to create an energy-wise, cost effective, and overall sustainable society. References [1] J. Voelckar, “One Million Plug-in Cars by 2015” IEEE Spectrum, vol. 48, issue 4, pp 11-13, April 2011. [2] S.W. Hadley, "Evaluating the impact of Plug-in Hybrid Electric Vehicles on regional electricity supplies," Bulk Power System Dynamics and Control - VII. Revitalizing Operational Reliability, 2007 IREP Symposium, vol., no., pp.1-12, 19-24 Aug. 2007. [3] G. Gamboa, C. Hamilton, R. Kerley, S. Elmes, A. Arias, J. Shen, and I. Batarseh, "Control strategy of a multi-port, grid-connected, direct-DC PV charging station for plug-in electric vehicles," Energy Conversion Congress and Exposition (ECCE), 2010 IEEE , vol., no., pp.1173-1177, 12-16 Sept. 2010. [4] Z. Li, T. Wu, Y. Xing, K. Sun, and J.M. Gurrero, "Power control of DC microgrid using DC bus signaling," Applied Power Electronics Conference and Exposition (APEC), 2011.

66
DEVELOPMENT OF A WIND TURBINE EMULATOR BASED ON DSP CONTROL OF INDUCTION MOTOR
Shyam Janakiraman* and Wajiha Shireen
Department of Electrical and Computer Engineering University of Houston
Houston, TX 77204-4005 Abstract
Research in Wind Energy Conversion Systems (WECS) like design of blades, design of power electronic devices, development of control algorithms that run the system requires a controlled test environment with steady state wind characteristics. The objective of this thesis is to come up with an Emulator [1] which serves as a test bench to check the control algorithms designed for WECS. This emulator will allow replicating the characteristic of a real wind turbine i.e. Torque and the Power Generate in a controlled test environment without depending on natural wind resources and actual wind turbine. It also can also be used as an educational tool to teach the operation, behavior and control of a wind turbine. The muscle of this emulator is a 1 HP induction motor coupled with an induction generator. The brain of this emulator is a Digital Signal Processor (DSP) based algorithm which controls the motor. The DSP algorithm obtains the wind speed as input from the user and the real time turbine speed as a feedback. The algorithm evaluates the Tip Speed Ratio (TSR) Power Coefficient (Cp), Blade pitch angle, Torque and Power for the specific turbine. Introduction The major components of typical Wind Energy Conversion System (WECS) include wind turbine, generator, interconnection apparatus and control systems. A WECS is a structure that transforms the kinetic energy of the incoming air stream into electrical energy. The extraction device [2], named wind turbine rotor turns under the wind stream action, thus harvesting a mechanical power. The rotor drives a rotating electrical machine, the generator, which outputs electrical power. The wind turbine Emulator emulates the mechanical characteristics of a wind turbine at various wind speeds using a controlled motor drive system. The motor drive system behaves as a variable speed wind turbine for the generator and the power electronic converters. The Emulator, which is expected to reproduce the behavior of real wind turbine , should be able to simulate the turbine mechanical system. The most common approach to get turbine output torque is to use the aerodynamic equation to calculate the torque output. Analysis The total theoretical power available in the wind with speed “u” m/s and radius of blade “r” m/s is.
(1)
But the power extracted from the wind is limited due to aerodynamic design of the wind turbine. The Power curve of a wind turbine is defined by
, 1 2/ 3 4 / � 6 (2)

67
where, 1/ 1/ 0.08 0.035/ 1 (3)
where λ is defined as the Tip Speed ratio , β is the Pitch angle, constants C1, C2, C3, C4, C5, C6 are power coefficients depending upon wind turbine design and .Hence the total power that could be extracted from the air by a specified wind turbine design would be , (4)
/ (5)
This is the theoretical torque which has to be emulated by an Induction motor. The three-phase voltages, currents and fluxes of AC-motors can be analyzed in terms of complex space vectors. With regard to the currents, the space vector [3] can be defined as follows. Assuming that ia, ia, ic are the instantaneous currents in the stator phases, then the complex stator current vector is defined by
(6) where α = e (j2*pi/3).
Fig 1. Field Oriented torque control of induction Fig 2. Characteristics of a Wind Turbine. motor. The calculated Torque from Equation 1 can be converted to Is by the Induction Motor modeling . By using Clarke and Park Transformation (Fig 1) we can convert Is into id and iq. Hence induction motor is controlled according the user input (windspeed). References [1] L. Chang, R. Doraiswami, T. Boutot, H. Kojabadi, "Development of a wind turbine simulator for wind energy conversion systems," 2000 Canadian Conference on Electrical and Computer Engineering, vol.1, no., pp.550,554 vol.1, 2000. [2] H. M. Kojabadi, Chang Liuchen, T. Boutot, "Development of a novel wind turbine simulator for wind energy conversion systems using an inverter-controlled induction motor," IEEE Transactions on Energy Conversion, vol.19, no.3, pp.547,552, Sept. 2004 [3] H. Voltolini, M.H. Granza, J. Ivanqui, R. Carlson, "Modeling and simulation of the Wind Turbine Emulator using induction motor driven by torque control inverter," 2012 10th IEEE/IAS International Conference on Industry Applications (INDUSCON), vol., no., pp.1,6, 5-7, Nov. 2012.

68
DYNAMIC OPTICAL PATH SETUP IN DWDM MULTI-MODE SWITCHING NETWORKS
Wenhao Chen*1, Lei Wang2, Dmitriy Chenchykov1, Linsen Wu1, and Yuhua Chen1
Systems Research Lab 1 Department of Electrical and Computer Engineering
University of Houston Houston, TX 77204-4005
2 Halliburton Inc. 3000 North Sam Houston Pkwy E, Houston, TX, 77032
Abstract In this paper, we present an integrated DWDM multi-mode scheduling scheme for the DWDM multi-mode switching router. The proposed scheme integrates burst scheduling in the OBS mode, connection setup/teardown in the OCS mode, and channel reconfiguration in the EPS mode in a seamless fashion, which allows wavelengths to be dynamically shared among three different switching modes. We have implemented the proposed integrated multi-mode scheduler in FPGA hardware in an optical switching testbed. We have demonstrated in real hardware that the proposed algorithm is suitable for high speed hardware implementation. Introduction Traditional routers either perform electronic packet switching or optical switching. Although electronic packet switching has the finest granularity, the cost of EPS routers increases dramatically as the number of DWDM channels increases due to expensive Optical/Electrical/Optical (O/E/O) conversion. On the other hand, optical switching can provide cost effective scaling of DWDM channels by directing incoming wavelengths directly to the outputs, bypassing O/E/O conversion. While optical circuit switching is suitable for sustained high bandwidth applications, optical burst switching [2][3] is better for bursty traffic. Unfortunately, neither of these two practical forms of optical switching technologies can provide switching functions at the packet level. To solve the dilemma, the Reconfigurable Asymmetric Optical Burst Switching (RA-OBS) networks have been proposed [1] to allow multiple switching modes, namely, electronic packet switching (EPS), optical burst switching (OBS), and optical circuit switching (OCS) to be supported in the same network, and on the same router platform concurrently. Existing approaches either only provide grooming functions as lower speed traffic is added or dropped at the router nodes, or are designed for routers with a relatively small number of DWDM channels. In comparison, the RA-OBS multi-mode switching architecture dynamically shares a set of electronic switching ports among different switching modes through the core optical switching fabric. Therefore, it allows for cost effective expansion of the network with a large number DWDM channels by keeping a relatively small number of expensive electronic switching ports. Reconfigurable Asymmetric Optical Burst Switching (RA-OBS) In RA-OBS networks, each wavelength in a DWDM link can be individually configured and reconfigured in one of the three switching modes: the EPS, OCS or OBS mode. RA-OBS core routers internally switch data according to the switching mode configured for

69
the wavelengths.
Hardware Implementation and Testbed Experiments We have verified the effectiveness of the proposed integrated multi-mode scheduling algorithm, and its speed and cost effectiveness in hardware implementation in a hardware testbed illustrated in Figure 1. We have implemented the proposed algorithm in FPGA hardware using Hardware Description Language Verilog HDL. The FPGA hardware is used along with the optical switching node in the optical switching testbed.
A large medical image transfer hardware experiment is demonstrated to test the reliability of the MEM switch. Conclusion In this paper, we have proposed a multi-mode scheduling scheme for the RA-OBS multi-mode switching network. The proposed scheme can provide burst scheduling in the OBS mode, connection setup/teardown in the OCS mode, as well as channel reconfiguration in the EPS mode in an integrated fashion. The performance of the proposed integrated scheduler has been verified in a hardware testbed. Acknowledgement The authors would like to thank Texas Instruments, Inc. for their generous donation of the DaVinci video development board. References [1] Y. Chen, P. Verma, “Optical burst switching – an emerging core network technology,” Internet Networks – Wired, Wireless, and Optical Technologies, K. Iniewski, Ed. CRC Press, Taylor & Francis Group, pp. 265-290, 2010. [2] B. Mukherjee, Optical WDM networks, Springer, 2006. S. Q. Zheng, A. Gumaste, “SMART: An optical infrastructure for future internet (invited paper),” Broadnets’06, San Jose, CA, 2006. [3] X. Liu, C. Qiao, W. Wei, T. Wang, “A universal signaling, switching and reservation framework for future optical networks,” IEEE/OSA Journal of Lightwave Technology, vol. 27, no. 12, pp. 1806-1815, June 2009.
Fig. 1. Hardware Testbed
Virtex-7
SFP+/SFP
FW9500
W1
W2
W3
W4
Virtex-7SFP+/SFP
SFP+/SFP
SFP+/SFP
FWCDS
FWCDS
FWCDS
FWCDS
SFP+/SFP
SFP+/SFP
SFP+/SFP
SFP+/SFP
FWCDS
FWCDS
FWCDS
FWCDS
MEM optical switch
DE3 Integrated Scheduler

70
TEMPERATURE EFFECT ON GROWTH RATE AND THICKNESS OF GRAPHENE BY CHEMICAL VAPOR DEPOSITION
Sirui Xing*, Wei Wu, and Shin-Shem Pei
Center for Advanced Materials, Department of Electrical and Computer Engineering,
University of Houston, Houston, TX 77204
Abstract A study of temperature effect on graphene growth on Cu substrate by chemical vapor deposition (CVD) is presented. Additionally, we analyze the graphene bilayers grown at 950 °C. Statistics of the rotation angle distribution suggests that over 75% of the bilayers are twisted graphene while with the rest being oriented (AB-stacked). Our results provide insight into the optimization of CVD graphene growth on Cu, and should be beneficial for the development of novel graphene based electronic devices with tunable characteristics. Introduction With the advantages of good quality, scalability, and transferability, graphene films grown by chemical vapor deposition (CVD) on Cu shown high potential for the commercialization due to not only its cost efficiency but also its capability of limiting graphene film thickness. [1] The CVD conditions for graphene growth on Cu have been intensively modified in order to improve graphene quality. Growth temperature has been demonstrated to be a critical parameter, however, its detailed effect on graphene growth and film thickness remains fragmentary. A systematic study on such temperature effect is necessary for a better understanding of the CVD process, as well as the further improvement of graphene quality. The CVD graphene on Cu was believed to be a self-limiting process enabling the growth of predominantly monolayer graphene films. The self-limiting effect, however, can be easily broken under ambient-pressure CVD conditions with high concentration of carbon source and/or low growth temperature, where multi-layer graphene grains are nucleated and grown. Such multi-layer graphene, particularly bilayer, recently, have attracted great interest due to the tunable band structures with different stacking arrangements (i.e., rotation angles) between graphene layers. In this paper, we report the growth of graphene on Cu by CVD at different temperatures ranging from 900 °C to 1050 °C, and systematically study the effect of temperature on the growth process, e.g. growth rates, coverage percentage, and film thickness. We put forward an exponential equation as a model to fit the graphene coverage ratio as a function of growth time. An activation energy of ~1.89 eV has also been derived for graphene growth on Cu. In addition, the stacking arrangements of graphene bilayers obtained at 950 °C are analyzed. Statistical results of the rotation angle distribution indicate that the majority of the graphene bilayers are twisted graphene, of which the Raman spectra largely different from those of the AB-stacked bilayers. Our studies could not only benefit fundamental research on improvement of graphene quality, but also shed light on development of novel tunable graphene electronics.
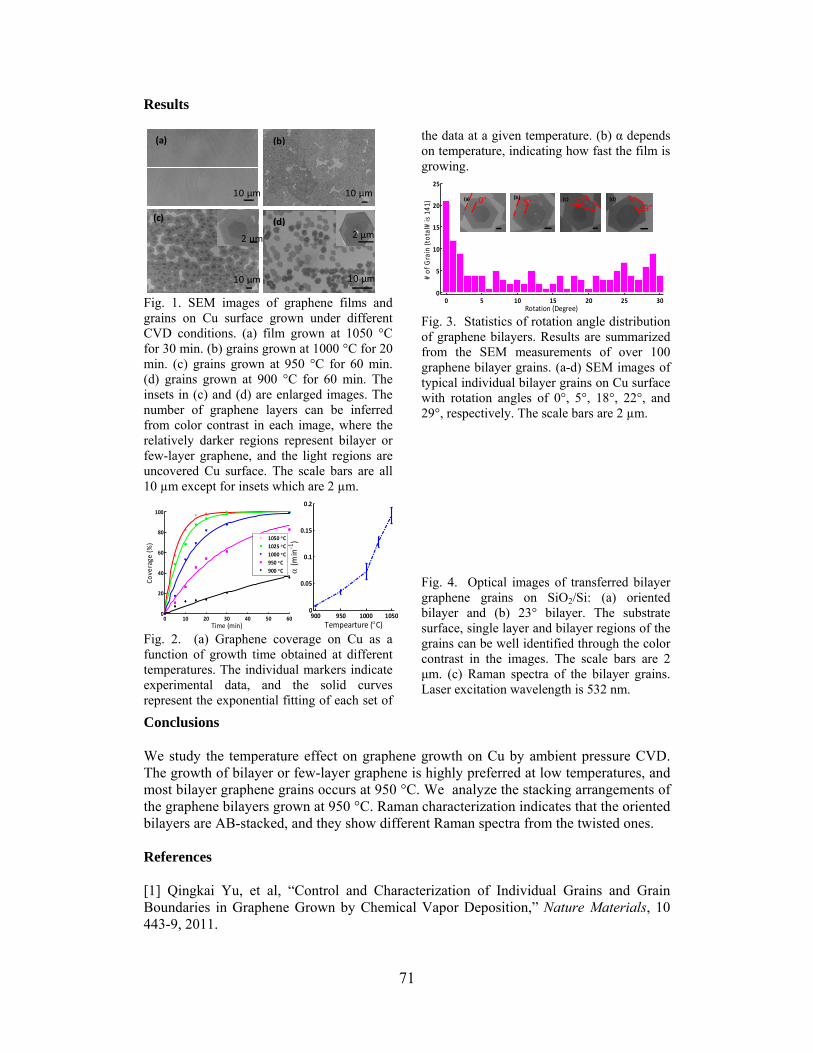
71
Results
Fig. 1. SEM images of graphene films and grains on Cu surface grown under different CVD conditions. (a) film grown at 1050 °C for 30 min. (b) grains grown at 1000 °C for 20 min. (c) grains grown at 950 °C for 60 min. (d) grains grown at 900 °C for 60 min. The insets in (c) and (d) are enlarged images. The number of graphene layers can be inferred from color contrast in each image, where the relatively darker regions represent bilayer or few-layer graphene, and the light regions are uncovered Cu surface. The scale bars are all 10 µm except for insets which are 2 µm.
Fig. 2. (a) Graphene coverage on Cu as a function of growth time obtained at different temperatures. The individual markers indicate experimental data, and the solid curves represent the exponential fitting of each set of
the data at a given temperature. (b) α depends on temperature, indicating how fast the film is growing.
Fig. 3. Statistics of rotation angle distribution of graphene bilayers. Results are summarized from the SEM measurements of over 100 graphene bilayer grains. (a-d) SEM images of typical individual bilayer grains on Cu surface with rotation angles of 0°, 5°, 18°, 22°, and 29°, respectively. The scale bars are 2 µm.
Fig. 4. Optical images of transferred bilayer graphene grains on SiO2/Si: (a) oriented bilayer and (b) 23° bilayer. The substrate surface, single layer and bilayer regions of the grains can be well identified through the color contrast in the images. The scale bars are 2 μm. (c) Raman spectra of the bilayer grains. Laser excitation wavelength is 532 nm.
Conclusions We study the temperature effect on graphene growth on Cu by ambient pressure CVD. The growth of bilayer or few-layer graphene is highly preferred at low temperatures, and most bilayer graphene grains occurs at 950 °C. We analyze the stacking arrangements of the graphene bilayers grown at 950 °C. Raman characterization indicates that the oriented bilayers are AB-stacked, and they show different Raman spectra from the twisted ones. References [1] Qingkai Yu, et al, “Control and Characterization of Individual Grains and Grain Boundaries in Graphene Grown by Chemical Vapor Deposition,” Nature Materials, 10 443-9, 2011.
(c) (d)
2 µm
(a) (b)
2 µm
10 µm 10 µm
10 µm 10 µm
0 5 10 15 20 25 300
5
10
15
20
25
Rotation (Degree)
# of Grain (total# is 141) 0°(a)
5°(b)
22° (c)
29° (d)
0 10 20 30 40 50 600
20
40
60
80
100
Time (min)
Cove
rage
(%)
1050 C
1025 C
1000 C
950 C
900 C
900 950 1000 10500
0.05
0.1
0.15
0.2
Tempearture (C)
(min
‐1)

72
DESIGN TO ENHANCE DEFECT TOLERANCE OF ULTRA THIN MULTIJUNCTION PHOTOVOLTAICS
A. Mehrotra*1 and A. Freundlich1
Center for Advanced Materials, Photovoltaics Research Group 1 Department of Electrical and Computer Engineering
University of Houston Houston, TX 77204-4005
Abstract
In this work we have evaluated thickness dependent efficiency of Inverted Metamorphic (IMM) solar cells as a function of radiation doses and dislocations and band gap of the bottom metamorphic InGaAs subcell. It is shown that for moderate to high doses of radiation, very high EOL efficiencies can be afforded with substantially higher dislocation densities than those commonly perceived as acceptable for IMM devices. i.e even in the presence of dislocation densities as large as 2x107cm-2,for typical 2x1015cm-2 1MeV electron fluence a remaining power factor of >85% (ηEOL~28%) can be reached by a careful selection of InGaAs band gap. Finally these finding could in turn be used to simplify manufacturing (thinner graded buffers) or/and increase yield for IMM space cells. Introduction Inverted metamorphic multijunction (Fig. 1) solar cells have demonstrated AM0 efficiencies of ~33% [1]. But the major drawback in IMM solar cells is the presence of defects in InGaAs bottom sub-cell which cause reduction in minority carrier lifetime and result in efficiency degradation, hence thick buffer layer are used in order reduce these defects. Space radiation also causes reduction in diffusion length and lifetimes [2]. Hence solar cells in space slowly degrade due to presence of this radiation. It is been shown that thickness optimization of multijunction GaInP/GaAs solar cell would give better end of life performance (EOL) than conventional solar cells [3]. Hence in IMM by using thin devices, one would obtain low efficiencies at beginning of life (BOL) but would result in improved efficiency at end of life (EOL) than conventional thick devices. Discussion Dislocations present in metamorphic 1ev InGaAs sub-cell would decrease the efficiency of solar cell, hence buffer filtering techniques are commonly used in order to reduce dislocation density in InGaAs solar cell below 106 cm-2. In IMM solar cell the current limiting sub-cell is mid GaAs cell, which hints towards use to degraded bottom InGaAs cell without having any effect on efficiency. Hence using high dislocation density in InGaAs one can still achieve the same efficiencies till GaAs sub-cell remains current limiting. Using thinner InGaAs cell with high dislocations maintains the Voc while the sub-cell is not too thin to become current limiting. Fig. 1 (b) shows that for dislocation densities of 106, 107 and 2x107 cm-2 when optimized for 2x1015 cm-2 equivalent electron fluence, the EOL performance is the same for all solar cells, which is evident in the figure since change is dislocation density doesn’t lead to change in EOL efficiency. For example for a radiation dose equivalent to a fluence of 1015 cm-2 1MeV electrons the optimal design for highest EOL performance becomes insensitive to the presence of dislocation densities, which are smaller than 107 cm-2.
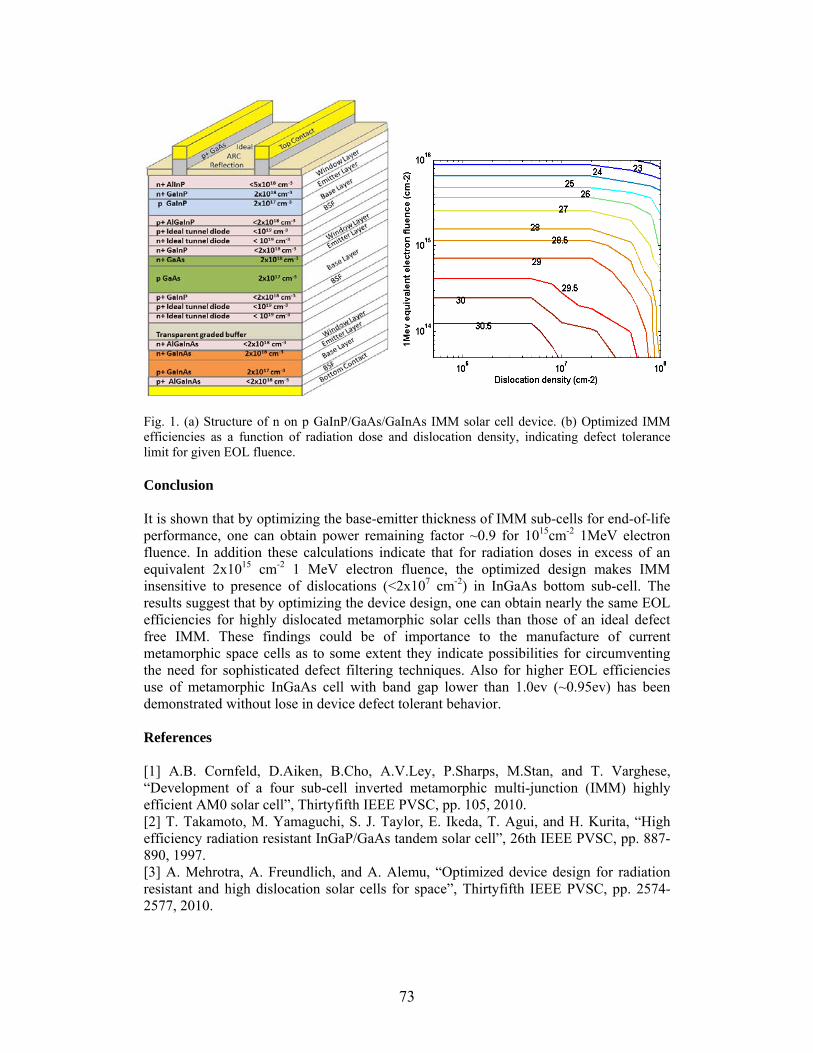
73
Fig. 1. (a) Structure of n on p GaInP/GaAs/GaInAs IMM solar cell device. (b) Optimized IMM efficiencies as a function of radiation dose and dislocation density, indicating defect tolerance limit for given EOL fluence. Conclusion It is shown that by optimizing the base-emitter thickness of IMM sub-cells for end-of-life performance, one can obtain power remaining factor ~0.9 for 1015cm-2 1MeV electron fluence. In addition these calculations indicate that for radiation doses in excess of an equivalent 2x1015 cm-2 1 MeV electron fluence, the optimized design makes IMM insensitive to presence of dislocations (<2x107 cm-2) in InGaAs bottom sub-cell. The results suggest that by optimizing the device design, one can obtain nearly the same EOL efficiencies for highly dislocated metamorphic solar cells than those of an ideal defect free IMM. These findings could be of importance to the manufacture of current metamorphic space cells as to some extent they indicate possibilities for circumventing the need for sophisticated defect filtering techniques. Also for higher EOL efficiencies use of metamorphic InGaAs cell with band gap lower than 1.0ev (~0.95ev) has been demonstrated without lose in device defect tolerant behavior. References [1] A.B. Cornfeld, D.Aiken, B.Cho, A.V.Ley, P.Sharps, M.Stan, and T. Varghese, “Development of a four sub-cell inverted metamorphic multi-junction (IMM) highly efficient AM0 solar cell”, Thirtyfifth IEEE PVSC, pp. 105, 2010. [2] T. Takamoto, M. Yamaguchi, S. J. Taylor, E. Ikeda, T. Agui, and H. Kurita, “High efficiency radiation resistant InGaP/GaAs tandem solar cell”, 26th IEEE PVSC, pp. 887-890, 1997. [3] A. Mehrotra, A. Freundlich, and A. Alemu, “Optimized device design for radiation resistant and high dislocation solar cells for space”, Thirtyfifth IEEE PVSC, pp. 2574-2577, 2010.
74
STRESS EVOLUTION DURING ANNEALING OF ELECTRODEPOSITED CoFeNi ALLOYS
D.Wu*1, N. Dole1, P. Abraham2, D. Lee3, A. Papou3, and S.R.Brankovic1, 2
Electrochemical Nanofabrication and Nanomaterials Synthesis Group 1Department of Electrical and Computer Engineering
2Department of Chemical and Biomolecular Engineering University of Houston, TX 77204-4005
3Texas Instruments Incorporation Santa Clara, CA 95052-8090
Abstract With the progress in the semiconductor and magnetic industry, thin films are preferred in device fabrication. The use of these devices at high temperatures is largely governed by their reliability. The stress that develops in the thin films on substrates can be detrimental to the performance of the thin film electronic devices. Our research work mainly focuses on stress measurements during annealing of electrodeposited CoFeNi alloys. In this talk, we have made an effort to explain the reasons for stress during annealing of electrodeposited CoFeNi alloys with suitable results. Introduction The development of theoretical foundations in electrochemical engineering, electrometallurgy and sophistication of tools used for electrodeposition has contributed to the wide-spread use of electrodeposition in the semiconductor and magnetic industries. Nowadays, electrodeposition is recognized as a mature method for fabrication of magnetic thin film heads, and in microelectronics and Micro-Electro-Mechanical System (MEMS) technologies. The reliability of the thin films used in MEMS is studied by measuring the stress evolved in the electrodeposited films. The total stress in a film can be contributed to two effects, mainly due to grain coalescence during deposition and grain boundary diffusion (vacancy annihilation) during annealing. The stress during deposition can be controlled by aptly adjusting the deposition parameters. When the film is heated above room temperature, a linear decrease in the stress (increase in compressive stress) is observed. This change corresponds to the difference in thermal expansion between the film and the substrate [1]. This type of stress change is perfectly elastic in nature as long as the expansion of the film and the substrate are within elastic limits. When a film is deposited at room temperature there is very little diffusion and one would expect the vacancy concentration to be much larger than at equilibrium. When these excess vacancies are subsequently annihilated the associate volume change results in a tensile stress in the film. As the annealing temperature goes higher, other effects such as grain boundary diffusion, impurity effects and grain growth also play an important role [2]. In order to obtain lower stress in thin films, saccharin as additive has been used in the design of electrodeposited solutions, and the effect of saccharin concentration to thin film stress level during annealing is to be investigated. Results and Discussions We measured the stress evolved during annealing by conducting in-situ experiments using the optical system based on the cantilever bending method. Stoney's equation is
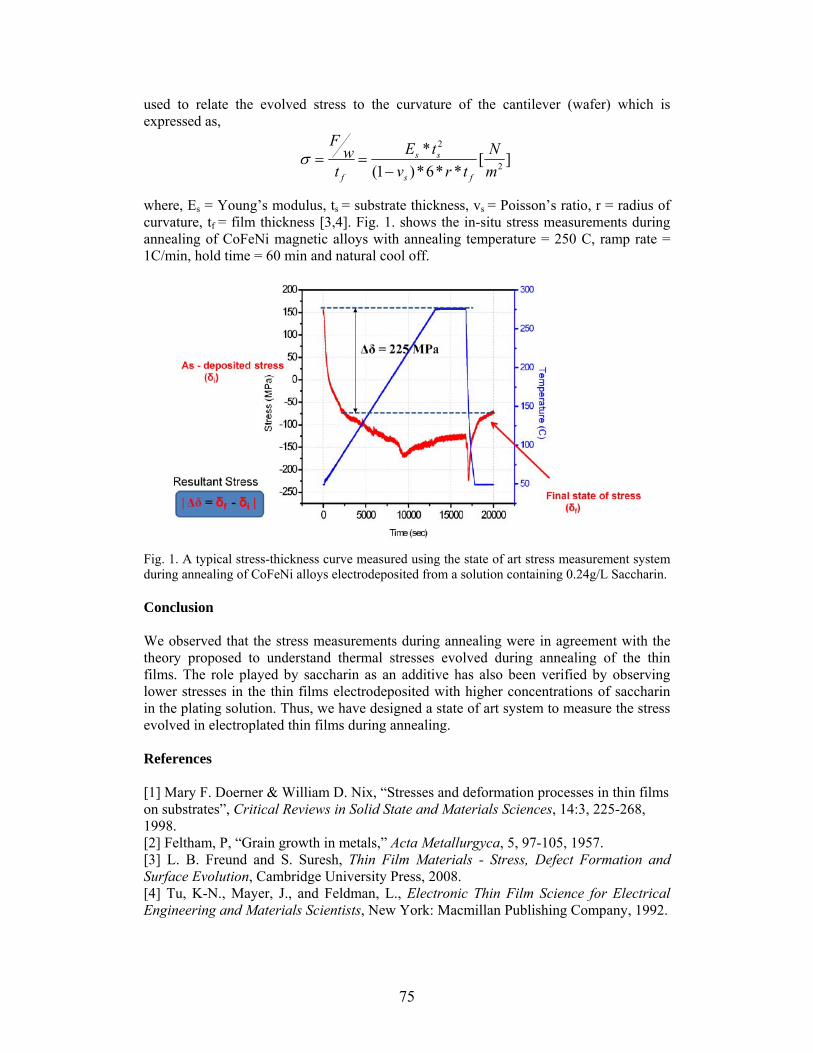
75
used to relate the evolved stress to the curvature of the cantilever (wafer) which is expressed as,
where, Es = Young’s modulus, ts = substrate thickness, vs = Poisson’s ratio, r = radius of curvature, tf = film thickness [3,4]. Fig. 1. shows the in-situ stress measurements during annealing of CoFeNi magnetic alloys with annealing temperature = 250 C, ramp rate = 1C/min, hold time = 60 min and natural cool off.
Fig. 1. A typical stress-thickness curve measured using the state of art stress measurement system during annealing of CoFeNi alloys electrodeposited from a solution containing 0.24g/L Saccharin. Conclusion We observed that the stress measurements during annealing were in agreement with the theory proposed to understand thermal stresses evolved during annealing of the thin films. The role played by saccharin as an additive has also been verified by observing lower stresses in the thin films electrodeposited with higher concentrations of saccharin in the plating solution. Thus, we have designed a state of art system to measure the stress evolved in electroplated thin films during annealing. References [1] Mary F. Doerner & William D. Nix, “Stresses and deformation processes in thin films on substrates”, Critical Reviews in Solid State and Materials Sciences, 14:3, 225-268, 1998. [2] Feltham, P, “Grain growth in metals,” Acta Metallurgyca, 5, 97-105, 1957. [3] L. B. Freund and S. Suresh, Thin Film Materials - Stress, Defect Formation and Surface Evolution, Cambridge University Press, 2008. [4] Tu, K-N., Mayer, J., and Feldman, L., Electronic Thin Film Science for Electrical Engineering and Materials Scientists, New York: Macmillan Publishing Company, 1992.
][**6*)1(
*2
2
m
N
trv
tE
tw
F
fs
ss
f
76
MONOLITHIC HIERARCHICAL GOLD NANOSTRUCTURES BY COMBINED TOP-DOWN AND BOTTOM-UP NANOFABRICATION
Fusheng Zhao*1, Jianbo Zeng1, and Wei-Chuan Shih1
BioNanoPhotonics Research Group 1 Department of Electrical and Computer Engineering
University of Houston Houston, TX 77204-4005
Abstract We propose nanoporous gold disks (NPGDs) released from a substrate as novel gold nanostructure. Patterned or mechanically stamped nanoporous gold (NPG) has been reported has an excellent Surface Enhanced Raman Spectroscopy (SERS) enhancement factor.[1-3] The effective surface area of NPGD is estimated to be ~10 times its projected area, thereby provides more attachment sites for analyte adsorbates. The proposed NPGD can be fabricated with controlled sizes and shapes. They can also be released from the substrate and recovered into NPGD colloidal. By using polystyrene beads with different diameter as etching mask, we fabricated NPGD with size ranges from 300nm to 700nm. IntroductionNanoprous gold (NPG) has many properties that offer potential benefits for many applications due to its catalytic activity, electrical conductivity, and mechanical properties. Among them intense interest has been sparked in NPG as SERS substrates. In this work, we explore further the fabrication of NPGD using hybrid top-down planar large-area sputter etching and bottom-up atomic self-assembly during dealloying. The resulted structure is thus hierarchical with the external disk shape and the internal porous network. The fabricated NPGD were released from the substrate and recovered into colloidal solution. This process offers potential benefits for transferring NPGD onto different substrate, using NPGD for drug delivery and other applications. Fabrication method and Results The initial film stack, consisting of a 120 nm thick Au:Ag=28:72 (wt. %) alloy film on a silicon substrate was deposited by DC sputtering. The alloy target was provided by ACI Alloys. The deposition rate for the alloy films was 27 nm/min. The stack was patterned by RF-sputter-etching in 99.999% argon gas through a polystyrene beads mask described blow. RF-etching was timed to produce completely isolated alloy. The PS spheres were removed by sonication in chloroform for 2 min. Ag was selectively dissolved by dipping in 70% room temperature HNO3 for 1 min followed by deionized water rinse and nitrogen dry to form the NPGDs. The process of NPGD fabrication and the corresponding SEM pictures are shown in Fig 1. As this stage, the NPGD are still well attached to the silicon substrate, and 1 min sonication in 1 mM surfactant (SDS) solution was needed to release the NPGDs into colloid and preventing them from aggregation. By slowly injecting 1% (wt.%) polystyrene beads colloidal onto the surface of water, a monolayer was formed by hydrophobic polystyrene beads. This tight monolayer could be transferred onto the sample surface acting as a mask for large-area sputter etching.

77
Fig 1. Fabrication process steps and SEM picturea of the each steps. (a) Initial film stack. (a’) SEM top view of step a, (b) Alloy film was etched into an alloy disk by sputter etching, (b’) SEM of step b, (c) PS spheres were removed by sonication in chloroform for 2 min, (c’)SEM of step c. (d) Ag was selectively dissolved. (d’) SEM of final NPGD on the silicon substrate. By using PS beads with different diameters range from 460nm to 1100nm, NPGD with different size were made as shown in Fig 2.
Fig 2. NPGD with different size (a)300 nm NPGD made from 460 nm PS beads. (b)380 nm NPGD made from 600 nm PS beads. (c)500 nm NPGD made from 800 nm PS beads. (d)700nm NPGD made from 1100 nm PS beads. Summary By using the method described in the paper, over 90% PS monolayer coverage on substrate was achieved, and after pattern transfer PS beads were 100% removed. 35% isotropic shrinkage in all directions due to dealloying was observed for fabricated NPGD. Large quantity colloidal NPGD without aggregation was successfully harvested, the total number of NPGD in one alloy coating run on a 3 inch substrate is on the order of 10 billion. Reference[1] Y. Jiao, D. Ryckman, P. N. Ciesielski, C. A. Escobar, G. K. Jennings, and S. M. Weiss, Nanotechnology, 2011, 22, 295302. [2] Jung-Sub Wi, Satoshi Tominaka, Kohei Uosaki and Tadaaki Nagao, Phys. Chem. Chem. Phys., 2012, 14, 9131-9136. [3] S. W. Lee, K. S. Lee, J. Ahn, J. J. Lee, M. G. Kim, and Y. B. Shin, 90 Acs Nano, 2011, 5, 897-904.

78
OPTIMIZATION OF REACTIVE ION ETCHING TO FABRICATE SILICON NITRIDE STENCIL MASKS IN SF6 PLASMA
Prithvi Basu*1 and Paul Ruchhoeft1,2
Nanofabrication Research Group 1 Department of Electrical and Computer Engineering
University of Houston Houston, TX 77204-4005
Abstract Stencil masks can be used to print very high resolution patterns using ion beam lithography. Line widths as small as 50 nm have been controllably etched through silicon nitride membranes using reactive ion etching (RIE) in CF4 and CHF3. One issue with these gases is this process leads to the formation of a polymer (Teflon) and consequently slows down the etch rates of the silicon nitride. In this work, we will be optimizing the reactive ion etching of silicon nitride using sulfur hexafluoride (SF6) and oxygen, which we hypothesize, will overcome these problems. Introduction In this work, we will be optimizing the reactive ion etching of silicon nitride using sulfur hexafluoride (SF6) and oxygen, which we hypothesize, will overcome these problems. The stencil masks for this work are 0.5 µm thick free standing membranes, which are formed from double-side polished four-inch diameter silicon wafers coated with a 500 nm thick layer of non-stoichiometric low stress silicon nitride and coated with 20 nm of Copper and 200 nm of PMMA (poly(methyl methacrylate)). The patterns are printed using the e beam lithography and are developed. To transfer the patterns, the dry etching techniques consisted of ion milling in Argon, to etch the patterns through the hard mask followed by reactive ion etching in SF6 and oxygen to transfer the pattern through silicon nitride. In this work we focused our attention towards dry etching techniques like ion milling in argon followed by reactive ion etching in SF6 and oxygen. In ion beam proximity lithography, ions that are extracted from a source and are used to illuminate through the stencil mask. Particles that pass through the membrane openings are used to print the desired pattern on the substrate. For these reasons stencil mask fabrication is necessary.
Fig. 1. Process flow diagram of mask fabrication. Method First, multiple openings or windows of predetermined size are etched into the silicon nitride layer on one side of the wafer using transparency film as an etch mask. The gasses

79
used are 0.2 mTorr of oxygen and 0.8 mTorr of CF4 and a power setting of 30 watts. To form the membranes of nitride, the silicon is etched in the exposed windows using a solution of potassium hydroxide (KOH) and water. 20 nm layer of copper is deposited onto the front side of the wafer using evaporation. After this, a 200 nm thick layer of PMMA is deposited onto the front side of the wafer by spin-coating. Next the membranes are cleaved into individual pieces from the wafer and then printed on using electron beam lithography and developed. The next step is to transfer the pattern into the hard mask using PMMA as an etch mask. An argon plasma at 1 mTorr and 13 watts is used to remove the copper using the PMMA layer as an etch mask. Since 20 nm of copper was used, and the sputter rate of copper is 4 nm per minute (as measured), in order to get an over etch of 100 percent, copper was sputtered in argon for 10 minutes at 13 watts. Once the pattern has been driven into the copper layer, the next step is to etch the nitride using the remaining copper as an etch mask. The nitride membrane is etched in the same 80/20 mixture of SF6/O2 at 1 mTorr as the windows, but at a power of 15 watts for one hour. Results
Fig. 2. SEM image of 100 nm openings in the front side of the membrane.
Fig. 3. SEM image of 100 nm openings in the back side of the membrane. References [1] J. Randall, D. Flanders, N. Economou, J. Donnelly, and E. Bromley, “Masked ion beam resist exposure using grid support stencil masks,” Journal of Vacuum Science & Technology B: Microelectronics and Nanometer Structures, vol. 3, no. 1, pp. 58-61, 1985. [2] S. Pang, M. Geis, W. Goodhue, N. Efremow, D. Ehrlich, R. Goodman, and J.Randall, “Pattern transfer by dry etching through stencil masks,” Journal of Vacuum Science & Technology B: Microelectronics and Nanometer Structures, vol. 6, no. 1, pp. 249-252, 1988. [3] J. Randall, “Pattern distortions in stencil masks,” Journal of Vacuum Science & Technology B: Microelectronics and Nanometer Structures, vol. 12, no. 6, pp. 3543-3546, 1994. [4] J. Randall, L. Stern, and J. Donnelly, “The contrast of ion beam stencil Masks,” Journal of Vacuum Science & Technology B: Microelectronics and Nanometer Structures, vol. 4, no. 1, pp. 201-204, 1986. [5] J. Randall, D. Flanders, N. Economou, J. Donnelly, and E. Bromley, “Silicon nitride stencil masks for high resolution ion lithography proximity printing,” Journal of Vacuum Science & Technology B: Microelectronics and Nanometer Structures, vol. 1, no. 4, pp.1152-1155, 1983.

80
USING RECIPROCITY TO ESTIMATE THE INDUCED VOLTAGE FOR PACEMAKER UNDER MRI RF COIL
Shi Feng*1, Qingyan Wang1, and Ji Chen1
1 Department of Electrical and Computer Engineering University of Houston
Houston, TX 77204-4005
Abstract
This paper presents a novel method for efficient estimation of the induced voltage on the pacemaker under the MRI. The method is based on the reciprocity theorem, which allows people to measure the transfer function of the pacemaker leads instead of simulation of the pacemaker with the whole human body. This method is easy to implement. The result is stable and is verified by directly measuring the induced voltage on the pacemaker in the ASTM phantom.
Introduction
MRI is widely used modality for visualization of soft tissue. However, most current devices such as pacemaker or defibrillators are not compatible with MRI due to the electromagnetic compatibility (EMC) issues. [2] One particular problem is the induced voltage on the pacemaker under MRI. It is hard to be directly estimated by simulation because the pacemaker lead dimension is too small compared with the MRI RF (radio frequency) coil and human body model. To overcome this problem, pacemaker lead transfer function is measured. However, the transfer function measurement is very hard to be accurate enough or is too complicated This paper proposes an efficient approach to estimate the induced voltage on the pacemaker due to the MRI RF coil. Methods Impedance simulations were done to assess such a voltage generation during MRI (Fig. 1).
Fig. 1. A diagram represents the original problem. The main structure of Pacemaker Lead is coax. The Pacemaker Can is modeled as impedance Z.
The original problem is to estimate the induced voltage on the Pacemaker Can. Here, we model the Can as impedance. The relation between the incident electric field and induced voltage is the transfer function:
∙
ring%
Medium%
V2%
‐ p% V1%
Einc (current on the RF coil, source a)
Z bet ween t ip and can
Z bet ween r ing and can

81
where is the transfer function, is incident electric field.
Fig. 2. Applying reciprocity, turning off the original incident electric field and add a current source on the port. Direct measurements the transfer function is difficult and has less accuracy. We can prove that the induced common mode current on the lead due to the current source on the port is equivalent to the transfer function by reciprocity. It is very easy to be measured.
∙
Results To verify the transfer function result, we calculate the induced voltage from the transfer function as well as the induced voltage from direct measurement in the ASTM phantom. The pacemaker lead is laid to many different trajectories in the phantom. The figure below shows the comparison results:
Fig. 3. The comparison between the induced voltage from transfer function and induced voltage from directly measurement. Conclusions We proposed a very efficient method to estimate the induced voltage on the Pacemaker Can due to the radiation of MRI RF coil. The results matched very well with the direct measurement result. References [1] Dan Harvey, “Making Waves With MRI,” [Online]. Available: http://www.imagingeconomics.com/issues/articles/MI_2004-08_01.asp. [2] Gimbel JR and Kanal E. “Can patients with implantable pacemakers safely undergo magnetic resonance imaging?” Journal of the American College of Cardiology 2004; 43:1325-7.
ring%
Medium%
+p%
Einc (current on the RF coil, source a)
I = 1A (source b)
Z bet ween t ip and can
I (common mode cur rent on t he leads, source b’)
82
NEURAL CORRELATES OF THE MIRROR NEURON SYSTEM
Yu Zhang*1 and Jose Contreras-Vidal Noninvasive Brain Machine Interface System Lab
1 Department of Electrical and Computer Engineering University of Houston
Houston, TX 77204-4005
Abstract The mirror neuron system of the human brain is thought to be critical for learning by imitation, action understanding and perceiving others’ intentions. The proposed study investigates the features and developmental milestones of this system in young infants. In this study, 6-24 month old infant subjects will be tested. Electroencephalography (EEG), kinematic data and video will be recorded simultaneously when subjects are observing something or do something themselves. Introduction The mirror neuron was first found in "macaque monkeys" by Giacomo Rizolatti [1] and it is a special kind of sensorimotor neurons that fire both when the animal manipulates an object in a specific way or see others do so. It is not well established that mirror neurons exist in human brains because single neuron recording is not as feasible as it is used in monkey study. But there is a great deal of evidence supporting the overlap in activation of some human brain area both during action execution and action observation from functional magnetic resonance imaging (fMRI), magnetoencephalography (MEG), electroencephalography (EEG) and transcranial magnetic stimulation (TMS) studies. This brain system and related brain circuit is called human mirror neuron system[2]. The properties of this system lead researchers to speculate its implications in many social capabilities such as action understanding, imitation and language developing. Besides, human behavioral studies have also documented the close linkage between observation and execution of human acts. A developmental focus on the neural correlation between action observation and action execution has received gradual attention. The mirror neuron system becomes the starting point of formulating a comprehensive developmental neuroscience of imitation and social learning. Previous studies have provided several speculations with regard to the ontogeny of mirror neuron system including associative learning. [3] One way to testify this hypothesis is to test the shaping and characterization of mirror neuron system in young infants. This can even provide clues of how mirror neuron system functions in the context of those pivotal social functions. Methods Eighty infants from 6 to 24 months will be recruited for our proposed experiments. During the experiment, EEG, kinematics data and video will be recorded synchronously while the subjects are observing something or doing something themselves. Electroencephalography tests above the skull difference of electrical potential caused by the currents escaped from inside of the brain. These currents are produced by activated neurons when they are involved in certain process. Thus EEG can reflect the activation of brains in a macroscopic level. Although EEG doesn't provide as good space resolution as

83
some neuroimaging recording such as fMRI does, it has very good time resolution and doesn't induce risks as noninvasive recording techniques do. For these properties, EEG is considered most feasible in baby studies. There are some classical features of EEG signals that have been investigated for a long time and used maturely in brain machine interface studies. Those include steadily evoked potentials, event related potentials, and different EEG frequency bands that are believed to be encoded with information the brain wants to convey. With regard to action and body movement, 'mu' rhythm, which is a frequency band in the alpha range, has long been used as an index of engagement of the brain during volitional movement, motor imagery and preparation. [4] Although 'mu' rhythm is established in adult studies, a standardized approach to identify individual infant mu rhythm band and comprehensively measuring its activation is still unavailable. This would be a major focus of our proposed study. In the brain machine interface studies, various machine learning algorithms have been employed in the work of reconstructing movement trajectory, classifying different movement modes to restore mobile ability of disabled people. [5] These algorithms, we believe, can also be exploited in this study to index the level of activation of mirror neuron system in the form of correlates between brain activity and infants' movement. The gradual changes of these indexes along with time and its sensitivity to motor experience can shed light on the development and shaping of this system. References [1] G. Rizzolatti and L. Craighero, “The mirror-neuron system.” Annual review of neuroscience, vol. 27, pp. 169–92, Jan. 2004. [2] P. J. Marshall and A. N. Meltzoff, “neural mirroring systems:exploring the EEG Mu Rhythm in Human infancy,” developmental cognitive neuroscience, vol. 1, no. 2, pp. 110–123, 2012. [3] C. Heyes, “Mesmerising mirror neurons.,” NeuroImage, vol. 51, no. 2, pp. 789–91, Jun. 2010. [4] G. Pfurtscheller and F. H. Lopes da Silva, “Event-related EEG/MEG synchronization and desynchronization: basic principles.,” Clinical neurophysiology : official journal of the International Federation of Clinical Neurophysiology, vol. 110, no. 11, pp. 1842–57, Nov. 1999. [5] J. R. Wolpaw, N. Birbaumer, D. J. McFarland, G. Pfurtscheller, and T. M. Vaughan, “Brain-computer interfaces for communication and control.,” Clinical neurophysiology : official journal of the International Federation of Clinical Neurophysiology, vol. 113, no. 6, pp. 767–91, Jun. 2002.
84
RECONSTRUCTING SURFACE EMG FROM SCALP EEG DURING MYOELECTRIC CONTROL OF A CLOSED LOOPED PROSTHETIC DEVICE
Andrew Y. Paek*1, Jeremy D. Brown2, R. Brent Gillespie2, Marcia K. O'Malley3, Patricia
A. Shewokis4, and Jose L. Contreras-Vidal1 1Non-Invasive Brian Machine Interfaces Systems Laboratory
Department of Electrical and Computer Engineering University of Houston, 1Houston, TX 77004
2 Department of Mechanical Engineering University of Michigan, Ann Arbor, MI, 48109
3Department of Mechanical Engineering and Materials Science Rice University, Houston, TX 77005
4Nutrition Sciences Department in the College of Nursing and Health Professions School of Biomedical Engineering
Drexel University, Philidelphia, PA 19104 Abstract In this study, able bodied human subjects operated a neuroprosthesis that contained a robotic gripper that was controlled with surface electromyography (EMG) and an exoskeleton that provided force feedback to the subjects. The goal of the study was to develop a neural decoder that used scalp electroencephalography (EEG) to reconstruct the EMG used to control the gripper and to investigate the effects of force feedback on the EMG reconstructions. Introduction Our previous work has shown that integrating force feedback in a neuroprosthesis device improved the subjects' ability to discriminate what kind of objects were being held. This device featured a robotic gripper and an exoskeleton. The robotic gripper was commanded through EMG activity from the biceps muscles. The exoskeleton provided force feedback, where it applied a torque about the subject's elbow. The magnitude of the torque was related to how much force was measured at the gripper's tips [1]. It was of interest to observe if scalp EEG can be used to control the neuroprosthesis instead of EMG. In this sense, a brain machine interface (BMI) could be fabricated where the subject controlled the neuroprosthesis with his or her thoughts. Such BMI could be used to restore motor function to users with paralysis or amputations. To test the feasibility of this BMI, our goal was to reconstruct the EMG used to control the prosthesis from scalp EEG. While other studies have shown it is possible to reconstruct EMG from other neural activity such as neural spikes [2], [3], little work has been done in reconstructing EMG during the use of a prosthesis with sensory feedback. Methods Able bodied human subjects operated the prosthesis in four different combinations where the arm that was used to control the robotic gripper was varied, and the presence of the force feedback was turned on or off. Throughout all the conditions, subjects used the prosthesis to squeeze objects of varying stiffness and were instructed to guess what the object was based on force feedback. While subjects performed this task, 64 channel scalp EEG and functional Near Infrared Spectroscopy (fNIRS) was recorded.
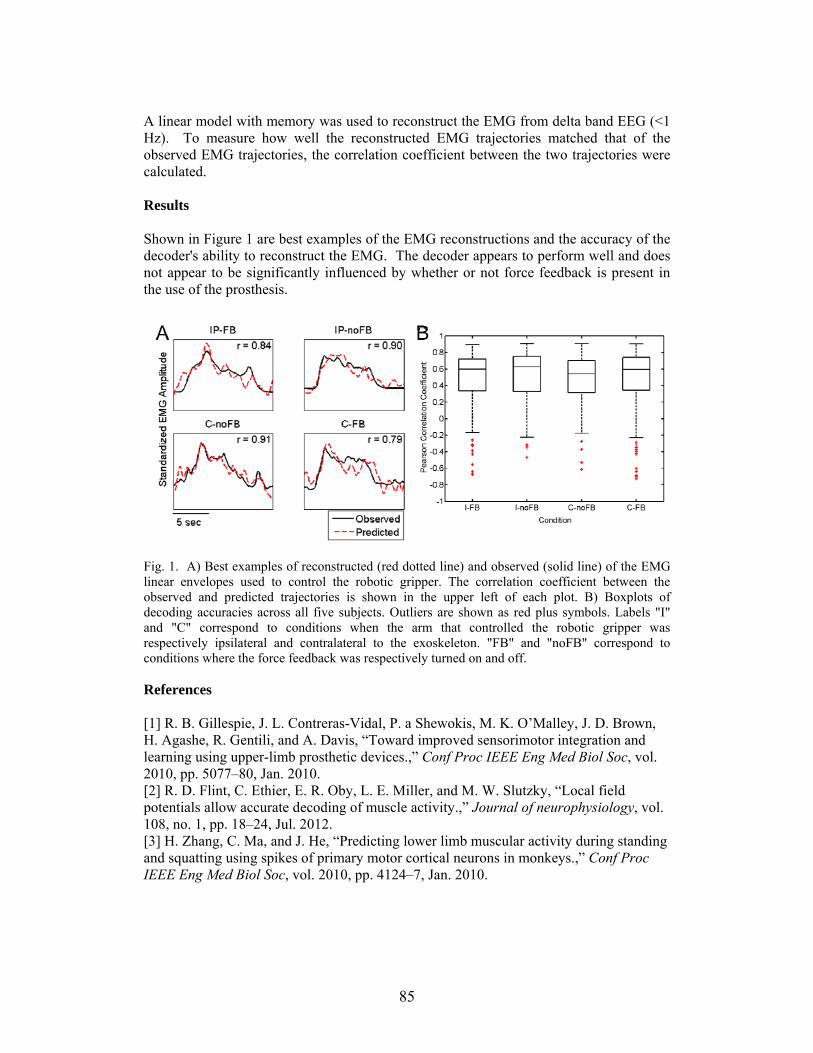
85
A linear model with memory was used to reconstruct the EMG from delta band EEG (<1 Hz). To measure how well the reconstructed EMG trajectories matched that of the observed EMG trajectories, the correlation coefficient between the two trajectories were calculated. Results Shown in Figure 1 are best examples of the EMG reconstructions and the accuracy of the decoder's ability to reconstruct the EMG. The decoder appears to perform well and does not appear to be significantly influenced by whether or not force feedback is present in the use of the prosthesis.
Fig. 1. A) Best examples of reconstructed (red dotted line) and observed (solid line) of the EMG linear envelopes used to control the robotic gripper. The correlation coefficient between the observed and predicted trajectories is shown in the upper left of each plot. B) Boxplots of decoding accuracies across all five subjects. Outliers are shown as red plus symbols. Labels "I" and "C" correspond to conditions when the arm that controlled the robotic gripper was respectively ipsilateral and contralateral to the exoskeleton. "FB" and "noFB" correspond to conditions where the force feedback was respectively turned on and off. References [1] R. B. Gillespie, J. L. Contreras-Vidal, P. a Shewokis, M. K. O’Malley, J. D. Brown, H. Agashe, R. Gentili, and A. Davis, “Toward improved sensorimotor integration and learning using upper-limb prosthetic devices.,” Conf Proc IEEE Eng Med Biol Soc, vol. 2010, pp. 5077–80, Jan. 2010. [2] R. D. Flint, C. Ethier, E. R. Oby, L. E. Miller, and M. W. Slutzky, “Local field potentials allow accurate decoding of muscle activity.,” Journal of neurophysiology, vol. 108, no. 1, pp. 18–24, Jul. 2012. [3] H. Zhang, C. Ma, and J. He, “Predicting lower limb muscular activity during standing and squatting using spikes of primary motor cortical neurons in monkeys.,” Conf Proc IEEE Eng Med Biol Soc, vol. 2010, pp. 4124–7, Jan. 2010.
86
NON-INVASIVE BRAIN MACHINE INTERFACE CONTROL FOR ROBOT-BASED STROKE REHABILITATION
Nikunj A. Bhagat*, and Jose L. Contreras-Vidal
Non-Invasive Brain Machine Interface Systems Laboratory Department of Electrical and Computer Engineering
University of Houston Houston, TX 77204-4005
Abstract Rehabilitation robots are being increasingly used for motor recovery in stroke patients. Although, robotic therapy has the advantage of providing repetitive practice, superior therapy outcomes can be obtained by ensuring continuous patient engagement during therapy. In this ongoing study, we combine non-invasive Brain Machine Interface (BMI) with the MIT-Manus robot, a clinically proven robot for stroke rehabilitation. This interface will ensure patient involvement by allowing them to use their thoughts to control the robot's movements. We present our currently developing methods to investigate the added clinical potential of BMI based rehabilitation robots for upper-limb motor recovery. Introduction
In spite of various robotic and physical therapist based stroke rehabilitation techniques, up to 30% of all stroke victims experience severe long term disabilities [1]. Hence, any incremental contribution to the current therapies may significantly improve the quality of life of stroke survivors. Current robotic rehabilitation devices such as the MIT_Manus [2] and MAHI Exo II [3] provide assist-as-needed forces and are effective in upper-limb motor recovery through repetitive and intensive practice. Using interactive games, these robots seek to encourage patient participation and voluntary drive. Patient engagement or participation during therapy is considered essential to maximize the therapy outcomes [2]. However, in present robotic therapies, apart from the user’s verbal assurance there is no empirical evidence to ensure user engagement. On the other hand, Motor Imagery, the process of mental simulation of a given action in the absence of any physical movement, has proved effective in stroke rehabilitation [4]. Further, motor imagery is assumed to capture the user’s voluntary drive and involves mental processes similar to those involved during real world movements [2]. Noninvasive BMI using Electroencephalography (EEG) signals provides a unique medium for using motor imagery to ensure patient participation. In a noninvasive restorative BMI [1], the objective is to decode the patient’s movement intentions and use it to control a therapeutic robot. This will close the loop to involve the patients in their own therapy and require them to actively participate during the therapy. Such an active therapy will induce the brain’s plasticity and can facilitate superior motor recovery. Previous studies [5] with healthy subjects have found that a person’s intended movement can be predicted from low frequency (0.3 - 4Hz) EEG signals. In the current study, we will use a similar approach for chronic stroke survivors. Additionally, our goal is to augment the MIT-Manus’s standard rehabilitation therapy with the noninvasive BMI, thereby enabling the patients to simultaneously control the robot using their thoughts.

87
Methods Following institutional review board approval for this study, hemiplegic and hemiparetic chronic stroke subjects will be recruited and randomly assigned to experimental and control groups. The experimental group will undergo the proposed BMI-robot training, whereas the control group will undergo standard training using the MIT-Manus. The experiment protocol will consist of a single calibration session followed by multiple training sessions. During calibration, the subject’s affected hand will be attached to the robot’s end-effector and transported along a pre-recorded trajectory. During this motion, the subjects will be instructed to imagine moving their hand in order to track the motion of the end-effector, while recording their brain signals using a 64 channel active electrode EEG cap. The purpose of the calibration phase is to train our decoders, for online estimation of subject’s intended motion trajectory (i.e. robot end-effector’s position/velocity) using Kalman Filters. In addition, Support Vector Machine classifiers will be used to identify subject’s intended target position. During the training phase, the subjects will perform center out target hitting task. For standard rehabilitation (control group), the robot randomly selects the target and guides the user’s hand towards the target. For the experimental group, the loop will be closed and initially the BMI will only predict the subject’s intended target position followed by the robot’s guidance to reach the target. Gradually, as the subject learns voluntary BMI control, the robot’s guided motion will be substituted with continuous estimation of subject’s intended motion. It is hypothesized that this combined BMI-robot training will encourage user participation during therapy and strengthen the neural connections between the brain and the affected limb. Performance Evaluation Clinical measures such as the Fugl-Meyer Assessment (FMA) test, which is a stroke specific performance based index, will be used to compare pre and post training outcomes for the experimental and control groups. References [1] S. R. Soekadar, N. Birbaumer, and L. G. Cohen, “Brain-Computer-Interfaces in the Rehabilitation of Stroke and Neurotrauma,” Systems Neuroscience and Rehabilitation SE - 1, pp. 3–18 LA – English, 2011. [2] K. K. Ang, C. Guan, K. Sui Geok Chua, B.-T. Ang, C. Kuah, C. Wang, K. S. Phua, Z. Y. Chin, and H. Zhang, “A Clinical Study of Motor Imagery-Based Brain-Computer Interface for Upper Limb Robotic Rehabilitation,” Engineering in Medicine and Biology Society, 2009. EMBC 2009. Annual International Conference of the IEEE. pp. 5981–5984, 2009. [3] A. U. Pehlivan, O. Celik, S. Member, and M. K. O. Malley, “Mechanical Design of a Distal Arm Exoskeleton for Stroke and Spinal Cord Injury Rehabilitation,” IEEE International Conference on Rehabilitation Robotics, 2011. [4] P. Langhorne, F. Coupar, and A. Pollock, “Motor Recovery After Stroke: a Systematic Review.,” Lancet Neurology, vol. 8, no. 8, pp. 741–54, Aug. 2009. [5] T. J. Bradberry, R. J. Gentili, and J. L. Contreras-Vidal, “Fast Attainment of Computer Cursor Control with Noninvasively Acquired Brain Signals.,” Journal of Neural Engineering, vol. 8, no. 3, p. 036010, Jun. 2011.

88
AUTHOR INDEX
Name Page Name Page
Abraham, P. 74 Cooper, L. 42
Agaoglu, Mehmet N. 58 Cui, Minshan 48, 50
Agaoglu, Sevda 58 Dani, J. A. 6
Agashe, Harshavardhan A. 8 Dasari, Venkata Siddartha
62
Bao, Jiming 15, 30, 56 De, Debtanu 30
Basu, Prithvi 78 Dole, N. 74
Bedell, H. E. 4 Ekiz, O. 4
Bhagat, Nikunj A. 86 Feng, Shi 80
Brankovic, Stanko R. 28 Freundlich, A. 72
Brown, Jeremy D. 84 Gheewala, M. M. 6
Bulut, Ela 28 Gillespie, R. Brent 84
Busse , B. 40 Godin, Biana 24
Carin, Lawrence 34 Goli, P. 64
Chang, Su-Chi 30 Gonen, Fahrettin F. 60
Chen, Ji 12, 14, 26, 30, 80 Grama, Kedar B. 46
Chen, Wenhao 68 Guo, Xichen 14
Chen, Yuhua 68 Hallal, Hamza 60
Chenchykov, Dmitriy 68 Han, Z. 10
Cheong, A. 36 Harris, C. 40
Chong, P. 40 Huynh, D. 4
Coifman, Ronald 34 Jackson, David R. 12, 14
Contreras-Vidal, Jose L. 8, 82, 84, 86 Janakiraman, Shyam 66

89
Jansen, Ben H. 26 Paterson,Andrew 16
Jiang, Ruoli 26 Pei, Shin-Shem 30, 70
Ketharnath, Dhivya 24 Peng, Haibing 30
Khodaei, Amin 62 Prasad, Saurabh 48, 50
Kourentzi,Katerina 16 Priya, Tanu 48
Kulkarni, P. 40 Purushothaman, G. 6
Lee, D. 74 Qi, Ji 18
Li, Jingting 20 Qiu, P. 22
Li, Ziyang 2 Rey, N. 22, 42
Liadi, I. 42 Romain, G. 42
Lin, Szu-Te 54 Roysam, Badrinath 22, 34, 36, 38, 40, 42, 44, 46
Liu, L. 10 Ruchhoeft,Paul 16, 78
Lu, Jing 52 Savelonas, M. 40
Lu, Yanbin 34 Shain, W. 22, 40
Luisi, J. 40 Shain, William 34
Megjhani, M. 22, 44 Sheth, Bhavin R. 2
Mehrotra, A. 72 Shewokis, Patricia A. 84
Merouane, A. 42, 44 Shih, Wei-Chuan 6, 18, 20, 52, 54, 76
Motwani, Pratik I. 18, 54 Shireen, Wajiha 64, 66
Ogmen, Haluk 4, 58, 60 Somasundar, V. 40
O'Malley, Marcia K. 84 Su, Zhihua 56
Padmanabhan, R. 40 Subrahmanya, Prithvi B. 38
Paek, Andrew Y. 84 Trett, K. 40
Pande, Rohit 24 Tripathy, S. P. 4
Papou, A. 74 Tubel, Paul 12

90
Varadarajan, N. 42
Wang, Lei 68
Wang, Qingyan 80
Wang,Yanan 30
Willson,Richard 16
Wolfe, J. C. 6, 54, 18
Wosik, Jarek 24
Wu, D. 74
Wu, Hao 50
Wu, Linsen 68
Wu, Wei 70
Xie, Leiming 24
Xin, Xiyao 12
Xing, Sirui 70
Xu, Y. 22
Yu, Hang 56
Zeng, Jianbo 76
Zhang, Yu 82
Zhao, Fusheng 76
Zhu, Zhuan 56