annual graduate research conference - welcome letter...
TRANSCRIPT

Annual Graduate Research Conference
April 28, 2017The Hilton UH Hotel & Conference Center
Houston, Texas
8:30 - 8:55 am Registration, Waldorf Astoria, Ballroom, Lobby
8:55 - 9:00 am Opening Remarks by Dr. Wanda Wosik, Plaza Ballroom
9:00 - 10:05 am Technical Program - Oral Session A, Plaza Ballroom
10:05 -10:30 am
Dr. Hanadi Rifai, Associate Dean, College of Engineering
Dr. Badri Roysam, Chairman, Electrical and Computer Engineering
10:30 - 10:45 am Coffee Break, Waldorf Astoria, Ballroom, Lobby
10:45- 11:50 am Technical Program - Oral Session B, Plaza Ballroom
11:50- 12:45 pm Lunch, Shamrock Ballroom
12:30 - 1:15 pm Keynote Presentation “The Global Impact of Electrical & Computer Engineering in Society”, Igor Alvarado, Business Development Manager for Academic Research, National Instruments Corp.,Shamrock, Ballroom
1:15 - 2:20 pm Technical Program - Oral Session C, Plaza Ballroom
2:20 - 2:30 pm
2:30 - 3:35 pm
Coffee Break, Waldorf Astoria, Ballroom, Lobby
Technical Program - Oral Session D, Plaza Ballroom
3:35 - 5:30 pm Technical Program - Poster Session, Waldorf Astoria Ballroom
5:30 - 6:00 pm Elevator Talks by CDC students, Shamrock Ballroom
6:00 - 6:30 pm Awards Ceremony Shamrock Ballroom

GRC 2017
The Hilton UH Hotel & Conference Center
April 28, 2017
8:30 – 8:55 am Registration, Waldorf Astoria, Ballroom, Lobby
8:55 – 9:00 am Opening Remarks in Plaza Ballroom
TECHNICAL PROGRAM
Session A: Power, Management, and Data Systems for Microgrids,Communication, Mobile, and BioMedical Imaging.Session Type: OralTime: 9:00 – 10:05 amFaculty Chair: Dr. David Mayerich
9:00 – 9:05 am POWER SHARING AND POWER QUALITY CONTROL USING DG- INTERFACING VOLTAGE SOURCE INVERTER IN MICROGRIDQicheng Huang and Kaushik Rajashekara
1, A1
9:06 – 9:11 am ADVANCED POWER SHARING SCHEME UNDER UNBALANCED AND NONLINEAR LOADS IN ISLANDING MICRO GRIDMehmet Emin Akdogan and Mehdi Abolhassani
3, A2
9:12 – 9:17 am IMPLEMENTATION OF ADAPTIVE PROTECTION SCHEME FOR MICROGRID USING IEC 61850 COMMUNICATION PROTOCOLRikesh Shah, Wajiha Shireen, Preetham Goli
5, A3
9:18 – 9:23 am REDEFINING QOS AND CUSTOMIZING THE POWER MANAGEMENT POLICY TO SATISFY INDIVIDUAL MOBILE USERSKaige Yan, Xingyao Zhang, Jingweijia Tan and Xin Fu
7, A4
9:24 – 9:29 am A HIERARCHICAL GAME FRAMEWORK FOR RESOURCE MANAGEMENT IN FOG COMPUTINGHuaqing Zhang, Yanru Zhang, Yunan Gu, and Zhu Han
9, A5
9:30 – 9:35 am FULL DUPLEX IN MASSIVE MIMO SYSTEMS: ANALYSIS AND FEASIBILITYRadwa Sultan, Lingyang Song, Karim G. Seddik, and Zhu Han
11, A6

9:36 – 9:41 am THREE DIMENSIONAL AUTOMATED SEGMENTATION OF NEURAL SOMA IN LARGE KESM IMAGES OF BRAIN TISSUELeila Saadatifard and David Mayerich
13, A7
9:42 – 9:47 am GPU BASED FEATURE SELECTION USING MULTIDIMENSIONAL BIOMEDICAL IMAGES TO ENABLE FAST INFRARED IMAGING USING DFIRRupali Mankar, Saurabh Prasad, Michael Walsh, and David Mayerich
15, A8
9:48 – 9:53 am FAST GPU-BASED SEGMENTATION FOR HIGH-THROUGHPUT TIME-LAPSE IMAGING MICROSCOPY IN NANOWELL GRIDS (TIMING)Jiabing Li, Leila Saadatifard, Navin Varadarajan, Badri Roysam and David Mayerich
17, A9
9:54 – 9:59 am VISUALIZATION AND VALIDATION SYSTEM FOR HIGH-THROUGHPUT QUANTITATIVE CHARACTERIZATION OF TIME-LAPSE IMAGING MICROSCOPY IN NANOWELL GRIDS (TIMING)Hengyang Lu, Melisa A. M. Paniagua, Navin Varadarajan , and Badrinath Roysam
19, A10
10:00 –10:05 am STRUCTURE TENSOR TRACTOGRAPHY FOR VISUALIZING LARGE-SCALE MICROSCOPY DATA SETS Srijani Mukherjee and David Mayerich
21, A11
10:05 –10:30 am Welcoming Remarks and Addresses in Plaza BallroomDr. Hanadi Rifai, Associate Dean, College of Engineering
Dr. Badri Roysam, Chairman, Electrical and Computer Engineering
10:30 – 10:45 am Coffee Break
Session B: Broad Applications of Electromagnetics: Biomedical Treatment and Diagnostics, VLSI Circuits, and Control Session Type: OralTime: 10:45 – 11:50 amFaculty Chair: Dr. Joe Charlson
10:45 – 10:50 am GENDER DIFFERENCES IN NEURAL ACTIVITY WHILE EXPERIENCING ART IN A MUSEUM SETTINGAkshay Sujatha Ravindran and Jose L. Contreras Vidal
23, B1

10:51 – 10:56 am ADVANCED RECOGNITION OF TERRAIN TRANSITIONS DURING LOCOMOTION VIA NON-INVASIVE EEGJustin A. Brantley, Trieu Phat Luu, and Jose L. Contreras-Vidal
25, B2
10:57 – 11:02 am THE LONG EFFECTS OF MILD TRAUMATIC BRAIN INJURY ON BRAIN ACTIVITY BASED ON THE STROOP PARADIGMLianyang Li and George Zouridakis
27, B3
11:03 – 11:08 am REDUCTION OF RADAR CROSS SECTION USING ACTIVE ANTENNA ELEMENTSO. H. Council, Sohini Sengupta, D. R. Jackson, and S. A. Long
29, B4
11:09 – 11:14 am ASSESSMENT OF TIME REVERSAL METHODS USED FOR OPTIMIZED HYPERTHERMIA IN CANCER TREATMENTKuang Qin and Jarek Wosik
31, B5
11:15 – 11:20 am WIDEBAND LNA WITH 1.9 DB NOISE FIGURE IN 0.18 M CMOS FOR HIGH FREQUENCY ULTRASOUND IMAGING APPLICATIONSYuxuan Tang, Yulang Feng, Zhiheng Zuo, Qingjun Fan and Jinghong Chen
33, B6
11:21 – 11:26 am BIO-IMPEDANCE SPECTROSCOPY FOR MITOCHONDRIAL ANALYSISUday Kiran Karlapudi, Joe Charlson, Jarek Wosik, Jinghong Chen,and Wanda Zagozdzon-Wosik
35, B7
11:27 – 11:32 am EARLY STUDIES OF A NEW TRANSMISSION MECHANISM FOR MANIPULATOR ACTUATION DESIGNED FOR MR-GUIDED INTERVENTIONSHaoran Zhao, Xin Liu, Habib M. Zaid, Dipan J. Shah, Michael Heffernan, Aaron T. Becker, and Nikolaos V. Tsekos
37, B8
11:33 – 11:38 am STIMULATED RAMAN HYPERSPECTRAL IMAGING BASED ON SPECTRAL SELECTION OF BROADBAND LASER PULSES Jingting Li and Wei-Chuan Shih
39, B9
11:39 – 11:44 am EXOSOME DETECTION WITH NANOPOROUS GOLD DISK VIA LOCALIZED SURFACE PLASMON RESONANCE SHIFTN. Ngo, O. Zenasni, and W. Shih
41, B10
11:45 – 11:50 am PHYSICAL EXPERIMENTS FOR TURN COST OF MULTICOPTERAn Nguyen, Dominik Krupke, Sándor Fekete, and Aaron T. Becker
43, B11
11:50 – 12:45 pm Lunch, Shamrock, Ballroom

12:30 – 1:15 pm Keynote Presentation, “THE GLOBAL IMPACT OF ELECTRICAL & COMPUTER ENGINEERING IN SOCIETY”, Igor Alvarado, Business Development Manager for Academic Research National Instruments Corp.Shamrock, Ballroom
Session C: Fabrication and Control of Micro- and Nano Probes, Structures, and Microrobots Session Type: OralTime: 1:15 – 2:15 pmFaculty Chair: Dr. Aaron Becker
1:15 – 1:20 pm DEVELOPMENT OF MULTI-CONTACT PROBES WITH THIN FILM CONDUCTOR WIRING ON OPTICAL FIBERSUBSTRATESTamanna Afrin Tisa, Apeksha Awale, Mufaddal Gheewala, Pratik Motwani, Rebecca Kusko, Madhuri Manjunath, Venu Jonnalagadda, Navjot Randhawa, Gopathy Purushothaman, John Dani, Wei-Chuan Shih, John Wolfe
45, C1
1:21 – 1:26 pm DEVELOPMENT OF REUSABLE, FLEXIBLE ELECTROSTATIC LENSES FOR NANOPANTOGRAPHYPrithvi Basu, Ryan Sawadichai, Ya Ming, Vincent M. Donnelly,Demetre J. Economou and Paul Ruchhoeft
47, C2
1:27 – 1:32 pm GENERATING SYNTHETIC MICROVASCULAR MODEL FOR MICROFLUIDICSJiaming Guo, Paul Ruchhoeft, and David Mayerich
49, C3
1:33 – 1:38 pm PATH PLANNING AND AGGREGATION FOR A MICROROBOT SWARM IN VASCULAR NETWORKS USING A GLOBAL INPUTLi Huang, Louis Rogowski, Min Jun Kim, and Aaron T. Becker
51, C4
1:39 – 1:44 pm PARALLEL SELF-ASSEMBLY UNDER UNIFORM CONTROL INPUTSSheryl Manzoor, Samuel Sheckman, Jarrett Lonsford, Hoyeon Kim,Minjun Kim, and Aaron T. Becker
53, C5
1:45 – 1:50 pm ALGORITHMS FOR SHAPING A PARTICLE SWARM WITH A SHARED CONTROL INPUT USING BOUNDARY INTERACTIONShiva Shahrokhi, Arun Mahadev, and Aaron T. Becker
55, C6
1:51 – 1:56 pm MAXIMIZING SWARM COVERAGE:HUNTING FOR MEMBERS OF A MOVING POPULATIONMary C. Burbage and Aaron T. Becker
57, C7

1:57 – 2:02 pm GLOBALLY CONTROLLED SWARM FOR MULT-ROBOT COVERAGEArun V. Mahadev, Dominik Krupke , S´andor P. Fekete, Aaron T. Becker
59, C8
2:03 – 2:08 pm FLUORESCENCE IMAGING WITH DOTLENS ON A SMARTPHONEYulung Sung and Wei-Chuan Shih
61, C9
2:09 – 2:14 pm HIGH-THROUGHPUT AND HIGH QUALITY MID-INFRARED SPECTROSCOPIC IMAGING USING DISCRETE FREQUENCY LASER SCANNING AND TIME-DELAYED INTEGRATIONShihao Ran and David Mayerich
63, C10
2:15 – 2:20 pm MOVING MILLIROBOTS THROUGH TISSUE USING MAGNETIC HAMMER ACTUATIONAshwin Ramakrishnan, Julien Leclerc, and Aaron T. Becker
65, C11
2:20 – 2:30 pm Coffee Break
Session D: Physics, Technology, and Characterization of New Materials for Electron Devices and Circuits, MEMS, and Energy SourcesSession Type: OralTime: 2:30 – 3:35 pmFaculty Chair: Dr. Jack Wolfe
2:30 – 2:35 pm ELECTROLESS ATOMIC LAYER DEPOSITION OF PT2+ ON CU NANOWIRESDhaivat J. Solanki and Stanko R. Brankovic
67, D1
2:36 – 2:41 pm FABRICATION OF MULTI-POINT SIDE-FIRING OPTICAL FIBER BY LASER MICRO-ABLATIONHoang Nguyen, Arnob M Parvez, Aaron T Becker, John C Wolfe, Matthew K Hogan, Philip J Horner, and Wei-Chuan Shih
69, D2
2:42 – 2:47 pm MECHANICAL MILLING INDUCED BAND GAP CHANGE IN PSEUDOBOEHMITE AND PSEUDOBOEHMITE DOPED WITH CR3+
W. Yang, S. Brankovic, and F. C. Robles Hernández
71, D3
2:48 – 2:53 pm ENHANCING INTERFACIAL STABILITY OF SODIUM METAL ANODE WITH SOLID POLYMER-SULFIDE COMPOSITE ELECTROLYTE Ye Zhang and Yan Yao
73, D4

2:54 – 2:59 pm (110) CUBIC AND (100) RHOMBOHEDRAL GE CRYSTAL FORMATION ON GLASS USING AL-INDUCED CRYSTALLIZATIONKaveh Shervin, Khim Kharel and Alexandre Freundlich
75, D5
3:00 – 3:05 pm CHICKEN EGG SHELLS AS ROBUST, REPRODUCIBLE, AND LOW-COST SERS SUBSTRATES Md Masud Parvez Arnob and Wei-Chuan Shih
77, D6
3:06 – 3:11 pm INTERACTION OF ORGANIC CATION WITH WATER MOLECULE IN PEROVSKITE CH3NH3PBI3: FROM DYNAMIC ORIENTATIONAL DISORDER TO HYDROGEN BONDINGZhuan Zhu, Viktor G. Hadjiev, Yaoguang Rong, Rui Guo, Bo Cao, Zhongjia Tang, Fan Qin, Yang Li, Yanan Wang, Fang Hao, Swaminathan Venkatesan, Wenzhi Li, Steven Baldelli, Arnold M. Guloy, Hui Fang, Yandi Hu, Yan Yao, Zhiming Wang and Jiming Bao
79, D7
3:12 – 3:17 pm DIRECT FABRICATION OF NANO-POROUS GOLD DISKS ON POLYDIMETHYLSILOXANE Ibrahim Misbah and Wei-Chuan Shih
81, D8
3:18 – 3:23 pm ULTRA-FAST ENERGY STORAGE PROPERTIES OF CONJUGATED REDOX POLYMER: A MECHANISM STUDYFang Hao and Yan Yao
83, D9
3:24 – 3:29 pm TOWARDS A FULL AQUEOUS CALCIUM-ION BATTERY FOR GRID ENERGY STORAGESaman Gheytani and Yan Yao
85, D10
3:30 – 3:35 pm FAST GPU-BASED SNAKES FOR MASSIVE 2D/3D IMAGESM. Lotfollahi and D. Mayerich
87, A12
5:30– 6:00 pm Elevator Talks by CDC Students, hosted by Dr. Len Trombetta, Shamrock Ballroom
6:00 – 6.30 pm Awards Ceremony and Reception, Shamrock Ballroom
Session E: POSTER PRESENTATIONSTime: 3:35 – 5:30 pm, Waldorf Astoria, BallroomAll posters will match talks presented by the graduate students in oral sessions.
Presentations by the following companies are scheduled

POWER SHARING AND POWER QUALITY CONTROL USING DG-INTERFACING VOLTAGE SOURCE INVERTER IN MICROGRID
Qicheng Huang and Kaushik RajashekaraPower Electronics, Microgrids and Subsea Electrical Systems Center
Department of Electrical and Computer EngineeringUniversity of Houston
Houston, TX 77204-4005
Abstract
This paper investigates power sharing and power quality control in a microgrid system by using the interfacing voltage source inverters (VSIs) control methods. An inverter-current based power sharing method is proposed to accurately share the load power demand among VSIs, which can significantly reduce the implementation cost. Next a virtual RLC damper based active damping method is proposed to provide sufficient damping effect to ensure the system stability. Then a unified selective harmonic compensation strategy using DG-interfacing inverter in the presence of nonlinear local loads in both grid-connected and islanded microgrid is discussed.
Introduction
There is a tendency to connect renewable energy resources to the individual microgrid system in the form of distribution generation. To interconnect these renewable energy resources to the main utility, the power electronics converter is often used as an efficient interface of distributed generation units. Specifically, the 3-phase Voltage Source Inverter (VSI) is most widely used in DC/AC applications. However, the reliable and accurate power sharing among parallel VSIs brings challenge to the VSI control. In addition, the presence of power converters with high order LCL filters introduces resonance problem to system stability. In addition, the growing application of distributed nonlinear loads further aggravates the harmonic distortions in the microgrid. To address above problems, this paper investigates the power sharing and power quality control through VSI control. By modifying the control algorithms of VSI, the possibility of power sharing and power quality improvement is discussed.
Methods
The control block diagrams of the inverter for power sharing in islanded mode and for active resonance damping are shown in Fig.1.
Fig.1. Control block diagram of inverter: (left) inverter-current-feedback based power sharing;(right) capacitor-current-feedback based active damping
1

In islanded mode, the output voltage of the inverter is controlled and the inverter current is used to implement droop control loop, virtual impedance loop and inner voltage/current loop. In such a way, the number of current sensors and hence the implementation costs can be reduced. By properly configuring the virtual impedance of the parallel inverters, the active and reactive power demand of the load can be equally shared between inverters. In grid-connected mode, the output current of the inverter is controlled. To ensure the system stability, the inherent resonance peak of the LCL filter must be dampened. By introducing an additional capacitor current feedback loop, a virtual damper branch is inserted to the passive capacitor, so that the resonance peak in the current can be suppressed.
Results
An experimental prototype which consists of two Semikron inverters is built in the lab. The control algorithms are implemented a FPGA-based digital controller named dSPACE. The three-phase grid is simulated by a regenerative Chroma grid simulator. Fig.2 shows the experimental results. It can be seen that the output currents of two parallel inverters have obvious phase error before the proposed power sharing method is enabled, which means there is reactive power sharing error between inverters. However, after the proposed method is enabled, the output currents of the two inverters are in the same phase, which indicates the reactive power sharing error is reduced to almost zero.
Conclusions
To solve the load power demand sharing among inverters in islanded microgrid, an inverter current feedback based droop control method is proposed, analyzed and verified. Compared with the conventional droop methods, the proposed method can effectively share the load power and reduce the number of sensors and implementation costs.
References
[1] J.M. Guerrero, L.G. Vicuna and J. Matas, et.al., “A Wireless-controller to enhance dynamic performance of parallel inverters in distributed generation systems,” IEEETrans. Power Electron., vol.19, no.5, pp.1205-1213, Sep. 2006.
[2] M. Chandokar, D. Divan and R. Adapa, “Control of parallel connected inverters in standalone ac supply systems,” IEEE Trans. Ind. Appl., vol.29, no.1, pp.136-143, Jan.1993.
Fig.2. (left) photo of the prototype; (mid) voltage and current waveforms of two parallel inverters before the proposed method is enabled; (right) voltage and current waveforms of two
parallel inverters after the proposed method is enabled.
2

ADVANCED POWER SHARING SCHEME UNDER UNBALANCED AND NONLINEAR LOADS IN ISLANDING MICRO GRID
Mehmet Emin Akdogan and Mehdi AbolhassaniDepartment of Electrical and Computer Engineering
University of HoustonHouston, TX 77204-4005
Abstract
Active, unbalance and harmonic power sharing inaccurately between distributed generators (DGs) and voltage quality problems are critical issues under unbalanced and nonlinear loads in the micro grids. Thus, advanced power sharing scheme with unbalanced and harmonic loads in islanding micro grid is presented to eradicate power sharing problems and reduce unbalanced voltage and harmonics distortion. The hierarchical control structure comprises primary and secondary levels. Effectiveness of the hierarchical power sharing scheme will be presented on MATLAB/Simulation and RT simulator for real-time simulation. PCC voltage distortion will decrease noticeably while load current sharing is improved properly after compensation.
Introduction
Distributed generation (DG) using renewable energy such as wind turbines and solar power plants has been widely used in recent years, because of growing demand for electricity and attention environmental protection and renewable energy. Furthermore, micro grid is as one of the solutions to integrate DG units to reduce the impact of high DG penetration on power system operation and improve the service reliability. Advantages of micro grid are increasing power quality, reliability and controllable.
Proposed Method
Active, reactive, unbalance and harmonic power sharing inaccurately between DGs and voltage quality problems are important affair under unbalance and nonlinear loads in the micro grids. Thus, proposed hierarchical control structure is designed in Fig.1. In the control scheme, secondary control manages compensation of positive and negative sequences of fundamental and main harmonic components for improving voltage quality. It sends proper reference signal to primary local control. Primary local control receives compensation voltage signal from secondary control and produces the reference voltage for DGs interface inverters. The local controller of each DG mainly includes power droop
3

for sharing active and reactive power among DGs without communication,voltage and current controllers, compensation effort controller and virtual impedance control loop. Virtual impedance loop for positive and negative sequences of fundamental and harmonic components is used to achieve better power sharing of reactive, unbalance and harmonic powers. Moreover,compensation effort controller is adopted for sharing powers proportionally among different power rated DG units.
Fig.1. Power stage and Hierarchical control for a general micro grid
Experimental Test System
The effectiveness of the proposed control scheme in simulations will be simulatedin three steps. In first step, unbalanced load is connected to PCC to test unbalanced voltage quality. Second step with nonlinear load is connected to PCC to demonstrate harmonic current sharing. Finally, third step with both loadsobserve unbalanced and harmonic power sharing under unbalanced and nonlinear loads.
Conclusion
A hierarchical control structure proposes improving power sharing scheme under unbalanced and harmonic loads in islanding micro grid. PCC voltage distortion will decrease noticeably while load current reactive, unbalance and harmonic powers sharing is improved properly after compensation.
4

IMPLEMENTATION OF ADAPTIVE PROTECTION SCHEME FORMICROGRID USING IEC 61850 COMMUNICATION PROTOCOL
Rikesh Shah*1, Wajiha Shireen2, Preetham Goli1
1Department of Electrical and Computer Engineering2Department of Electrical Technology
University of HoustonHouston, TX 77204-4005
Abstract
Implementation of microgrid protection using traditional protection scheme brings several issues mainly due to unforeseen change in short circuit current, lack of protective device co-ordination, undesired islanding and untimely tripping of generator interfaces protection etc. Consequently, the conventional fixed over current setting for relay protection schemes need to be improved [1]. This paper would discuss the algorithm and implementation of adaptive protection scheme to be applied for microgrid using modern overcurrent relays (IED-Intelligent Electronic Device) with the use of extensive communication.
Introduction
Microgrids powered by renewable energy sources have several advantages such asimproved reliability and sustainability of power supply to the customers and the utilities. As microgrid becomes an important part of the distribution system, issues and challenges arising from its implementation have to be addressed. Without undermining the importance of other issues, protective device coordination is considered as a critical challenge for microgrid implementation.In view of the above issues this paper establishes an adaptive protection scheme that dynamically changes the settings of the numerical relays in a microgrid based on its topology and fault location. To implement this scheme/algorithm on a laboratory based microgrid testbed at University of Houston, the microgrid has been modeled with logical nodes based on the IEC 61850 communication standard [2]. Also, a centralized protectionunit is set up along with all protection IEDs for adaptive protection.
Proposed Adaptive Protection Scheme/Algorithm
The algorithm developed for the adaptive protection scheme has been discussed briefly as follows. The entire protection scheme will be implemented using extensive communication among the numerical relays. The scheme mainly consists of two
1. Topology Sensing2. Calculation of Relay Settings
The topology sensing stage analyses the actual operating condition of the grid acquired by continuous measurement of grid parameters and detects the disturbances due to adjusted tripping characteristics. During a fault scenario, trip signal to the respective circuit breaker is generated. During the next stage prediction, data of the DG (Distributed Generators) availability is utilized in order to review the selectivity of numerical relays for each new operating condition and to adapt, if selectivity is not given any longer. If the adaptation is successful and the boundary conditions are not broken, the tripping
5

characteristics of respective relays will be matched. If there is no possible solution without breaking the boundary conditions, a signal will be generated that forbids the acceptance of the operation predicted by the Energy Management System (EMS).
The standard IEC 61850 allows for real-time communication by means of periodically sent telegrams. In case of a spontaneous change in state at the sending unit, telegrams will be sent with a high repetition rate within a few milliseconds right after the change in state. Thus, changes in state can be detected rapidly.
Apart from the algorithm, following simulations and study development shall be discussed in the paper.
1. IEEE Test System Simulation: Power system simulation software ETAP will be used to analyze the impact of high DG penetration on protective relay coordination for IEEE 13 bus test system [3].
2. Develop Microgrid Testbed: This task includes the setting up of a three bus microgrid testbed with various types of DGs and loads. Numerical relays from different vendors will be utilized to protect the test system during various simulated fault scenarios.
3. Communication Architecture: GOOSE (Generic Object Oriented Substation Event) feature will be setup in the microgrid testbed. DGs will be modelled in accordance with IEC 61850-7-420 [4].
Conclusion
The simulation results identifies the issues related to microgrid protection and the discussed scheme in this paper provides accurate fault currents and relay settings in real time. However, the use of extensive communication poses the threat for redundancy and security of the microgrid system.
References
[1] P. Kumar and Nagaraju, "Protection Issues in Micro grid.," May 2013. [2] B. M. Han, "Communication Architecture of the IEC 61850 based Microgrid
System," in Research Gate, September 2011. [3] A. K. Sahoo, "Protection of Microgrid through Coordinated Directional Over-current
Relays," in IEEE Global Humanitarian Technology Conference, 2014. [4] C. O. a. A. Z. Taha Selim Ustun, "Modeling of a Centralized Microgrid Protection
System and Distributed Energy Resources According to IEC 61850-7-420.," in IEEE TRANSACTIONS ON POWER SYSTEMS, August 2012.
6

REDEFINING QoS AND CUSTOMIZING THE POWER MANAGEMENT POLICY TO SATISFY INDIVIDUAL MOBILE USERS
Kaige Yan, Xingyao Zhang, Jingweijia Tan and Xin FuDepartment of Electrical and Computer Engineering
University of HoustonHouston, TX 77204-4005
Abstract
Delivering an excellent use experience to the customers is the top challenge faced by today’s mobile device designers and producers. There have been multiple studies on achieving the good trade-offs between QoS and energy to enhance the user experience, however, they generally lack a comprehensive understanding of QoS, and ignore the fact that each individual user has his/her own preference between QoS and energy. In this study, we overcome these two drawbacks and propose a customized power management policy that dynamically configures the mobile platform to achieve the user-specific optimal QoS and energy trade-offs to satisfy each individual mobile user.
Introduction
Recently, there has been an exploding growth in the usage of mobile devices, and delivering an excellent user experience to all various customers is the top challenge faced by today's mobile device designers. It is well known that the Quality-of-Service (QoS) and battery life are the two paramount factors affecting the user experience from the computer system perspective. But QoS and long battery life can hardly be satisfied simultaneously. There have been multiple studies on obtaining the good trade-off between QoS and energy (i.e., battery life) to improve the mobile user experience [1] [2] [3]. However, they generally lack a comprehensive and accurate understanding of QoS, moreover, they ignore the user differences which play a quite important role in the user experience, e.g., some users may desire a long-life battery, while others may require high QoS. In this study, we aim to tackle the above two challenges (i.e., QoS measurement, and user differences) and explore a customized power management policy (CUSA) that dynamically configures the mobile platform to obtain the user-specific optimal QoS and energy trade-off and hence, satisfy each individual mobile user.
Methods
We first provide a novel and comprehensive definition of mobile device QoS from computer system perspective, and propose the accurate QoS measurement and management methodologies. In the past, the QoS definitions for mobile devices in our community are mostly based on the application execution time or application specific (e.g. web browsing) [1] [2]. For mobile applications with intensive user interactions, rather than the overall application’s execution time, what users care regarding quality of service are (1) the responsiveness that is the amount of time the system takes to process and display the desired contents after the user input, and (2) the display quality that is how well the contents are displayed in the screen. Both them have strong relation with the energy as well. In this study, we integrate these two factors into our QoS characterization. To accurately measure responsiveness, we propose a practical sampling-basedmechanism to identify when the useful contents are displayed. By using it, the responsiveness can be easily adjusted by changing the frequencies of CPU and other
7

accelerators like GPU, thus trade with the energy. Moreover, to model and manage the display quality that is significantly determined by the displaying color, we explore a color approximation and transforming mechanism. It approximates a color with a new one, which is similar to the original but consumes less power. With our proposed mechanisms, trading the display quality with the energy becomes possible.
We then develop our customized power management policy (CUSA) for each individual mobile user based on the above proposed QoS modeling and management schemes. As an interesting observation of this work, we find that a user’s personality largely determines his/her preferences between the QoS and battery life. For example, people exhibiting strong trait on agreeableness show strong interests in gaining the long battery life and pay less attentions to the display quality as they usually have a lot of friend and the long-life battery is important for them to keep connected. The conscientious people prefer the high system responsiveness, since they are highly organized and usually have regular charging behavior and the long battery life is less attractive to them. Based on this observation, we propose the online personality-guided user satisfaction prediction model that predicts individual user’s satisfaction with the execution of certain mobile application based on its delivered QoS (measured by our above proposed QoS model) and energy consumptions, under the guidance of the user’s personality. Finally, by leveraging this model, we explore the personality-guided user satisfaction optimization scheme that intelligently configures the system parameters (e.g., CPU frequency, GPU frequency, display color) at run time to satisfy each individual mobile user.
Results
Fig.1 (a) User satisfaction with CUSA and other power management policies for different users; (b) User satisfaction with CUSA and other power management policies for different mobile applications
References
[1] Zhu, Yuhao, Matthew Halpern, and Vijay Janapa Reddi. "Event-based scheduling for energy-efficient qos (eqos) in mobile web applications." High Performance Computer Architecture (HPCA), 2015 IEEE 21st International Symposium on. IEEE, 2015.[2] Gaudette, Benjamin, Carole-Jean Wu, and Sarma Vrudhula. "Improving smartphone user experience by balancing performance and energy with probabilistic QoS guarantee." High Performance Computer Architecture (HPCA), 2016 IEEE International Symposium on. IEEE, 2016.[3] Shye, Alex, et al. "Learning and leveraging the relationship between architecture-level measurements and individual user satisfaction." ACM SIGARCH Computer Architecture News.Vol. 36. No. 3. IEEE Computer Society, 2008.
8

A HIERARCHICAL GAME FRAMEWORK FOR RESOURCE MANAGEMENT IN FOG COMPUTING
Huaqing Zhang, Yanru Zhang, Yunan Gu, and Zhu HanDepartment of Electrical and Computer Engineering
University of HoustonHouston, TX 77204-4005
Abstract
Supporting real-time and mobile data services, fog computing has been considered to be a promising technology to overcome long and unpredicted delay in cloud computing. However, as resources in the fog nodes (FNs) are owned by independent users or infrastructure providers, the data service operators (DSOs) are required to communicate with FNs and allocate resources from the FNs to the authorized data service subscribers (ADSSs). In this work, we propose a three-layer hierarchical game framework, where optimal strategies of each DSO, FN and ADSS are designed to obtain stable and optimal utilities in distributed fashions.
Introduction
Ever since the digital revolution half a century ago, the scale of digital data has grown exponentially. Nowadays, for some emerging data services and applications, such as vehicle-to-vehicle communication, augmented reality and smart grid, not only the volume of resources, but the service delay and delay jitter determine the quality of service (QoS) [1]. Moreover, most resources in cloud are physically located far from ADSSs, failing to support the requirements of mobility and real-time interactions during the data services. Accordingly, in order to improve QoS for ADSSs, it is necessary to pull the computing resources closer to ADSSs [2].
In 2014, the idea of fog computing was first proposed by Cisco [3]. The fog computing, similar to cloudlet, edge computing proposed by other companies, is composed of geo-distributed fog nodes (FNs), which can be any fixed or mobile collaborative devices with built-in data storage, computing and communication devices. Benefiting from the small scale, low cost and mobility, the FNs located around ADSSs are able to offload data traffics from the cloud, reduce the communication cost in the networks and provide real-time, location-aware data services [4].
Analysis and Methods
Nevertheless, the fog computing architecture considered in prior work is based on a single, centralized DSO scenario, which simplifies the system architecture and lacks generality. Following the sequential decision making behaviors for the distributed DSOs, FNs and ADSSs, game theory can be considered as a powerful tool to solve the resource allocation problem. In this work, we propose a three-layer hierarchical game frameworkwith three sub-games.
We first introduce the Stackelberg sub-game for the interaction between the DSOs and the ADSSs to solve the virtualized resource allocation problem. The key problem is the pricing mechanism.
9

Then according to the amount of requested virtualized resources, in order to motivate the FNs to offer the optimal amount of virtualized resources, the moral hazard model in contract theory is utilized to model the interaction between the DSOs the FNs. The key problem is the incentive mechanism design between the DSOs and FNs.
Based on the offered physical resources and provided virtualized resources, the student project allocation matching sub-game from matching theory is adopted to achieve a stable resource allocation solution. The key problem is resource matching in a distributed which is combinatorial in nature.
Results
We evaluate the performances of ADSSs in Matlab, with the number of ADSSs increasing, regardless of the computing data size for each ADSS, the total utility of ADSSs generally increases. The utility of the ADSS in fog computing can be better than the utility in cloud computing.
Fig. 1. The utility of ADSSs with the number of ADSSs increasing in both cloud computing and distributed fog computing scenarios.
Conclusion
In this paper, the optimal strategies of each DSO, FN and ADSS is designed with a three-layer hierarchical game framework, so that all DSOs, FNs and ADSSs achieve stable and optimal utilities in distributed fashions.
References
[1] S. Yi, C. Li, and Q. Li, “A Survey of Fog Computing: Concepts, Applications and Issues,” Proceedings of the 2015 Workshop on Mobile Big Data, pp. 37-42, Hangzhou, China.[2] Y. Mao, C. You, J. Zhang, K. Huang, and K. B. Letaief, “Mobile Edge Computing:Survey and Research Outlook,” arXiv preprint, arXiv: 1701.01090, 2017.[3] CISCO, “Fog Computing and the Internet of Things: Extend the Cloud to Where the Things Are,” white paper, 2015. Available at https://www.cisco.com/c/dam/en us/solutions/trends/iot/docs/computing-overview.pdf.[4] I. Goiri, K. Le, J. Guitart, J. Torres, and R. Bianchini, “Intelligent Placement of Datacenters for Internet Services,” Proc. IEEE ICDCS, pp. 131-142, Minneapolis, MI, Jun. 2011.
10

FULL DUPLEX IN MASSIVE MIMO SYSTEMS: ANALYSIS AND FEASIBILITY
Radwa Sultan1*, Lingyang Song2, Karim G. Seddik3 and Zhu Han1
1 Electrical and Computer Engineering Department, University of Houston, TX, USA2 School of Electrical Engineering and Computer Science, Peking University, Beijing,
China3 Electronics and Communications Engineering Department, American University in
Cairo, New Cairo, Egypt
Abstract
In this paper, we study full duplex (FD) massive multiple-input-multiple-output (MIMO) systems. We consider a base station equipped with massive MIMO which can operate either in FD or half duplex. We derive bounds for both the uplink and downlink capacities when the number of antennas grows asymptotically. We find the necessary conditions for the base station to work in FD in terms of the number of transmitting antennas, co-channel interference and self-interference cancellation. Simulations results validate the derived capacity bounds and thresholds obtained for FD communication.
Introduction
Full-duplex (FD) can double the data rate achieved by half duplex (HD) transmission because it allows each node to simultaneously transmit and receive at the same time and frequency resources. However, the main hurdle that limits the capacity gain is the high self-interference (SI) caused by the node's transmission on the node's reception. Recently, the evolution in the SI cancellation has revived the attention to FD communication [1]-[2]. Additionally, large scale multiple-input multiple-output (MIMO) or massive MIMO [3] is expected to achieve network densification by largely increasing the number of active antennas which increases spectral efficiency.
Our contributions in this paper are summarized as follows:Investigating the difference between FD and HD in terms of the received power, co-channel interference (CCI), and multiuser interference (MUI). Deriving upper and lower bounds for the DL and the UL capacities, respectively, forboth FD and HD communications when number of antennas grows asymptotically.Determining the necessary conditions to be satisfied for the FD mode to outperform the HD mode.
System Model
Fig.1. System Model
11

Asymptotic Analysis
We will derive upper bounds for the DL capacities for the FD mode and the HD mode. Additionally, we will derive lower bounds for the UL capacities of both the FD and the HD modes. An upper bound for the FD DL rate is given by
A lower bound for the FD UL rate is given by
Similarly, an upper bound of the HD DL rate and a lower bound for the HD UL rate can be derived.
Numerical Analysis
Fig. 2. Variation of Full Duplex Downlink and Uplink Capacities with Uplink Transmission Power
Fig. 3. Validating the values of
References
[1] D. Bharadia, E. McMilin, and S. Katti, "Full duplex radios," in SIGCOMM, Hong Kong, China, Aug. 2013, pp. 375-386.[2] M. Jainy, J. I. Choiy, T. M. Kim, D. Bharadia, S. Seth, K. Srinivasan, P. Levis, S. Katti, and P. Sinha, "Practical, real-time, full duplex wireless," in MobiCom, Las Vegas, NV, Sep. 2011, pp. 301-312.[3] F. Rusek, D. Persson, B. K. Lau, E. Larsson, T.L.Marzetta, O. Edfors, and F. Tufvesson, "Scaling up MIMO: Opportunities and challenges with very large arrays," IEEE Signal Processing Magazine, vol. 30, no. 1, pp. 40-60, Jan. 2013.
12

THREE DIMENSIONAL AUTOMATED SEGMENTATION OF NEURAL SOMA IN LARGE KESM IMAGES OF BRAIN TISSUE
Leila Saadatifard1 and David Mayerich1
1 Department of Electrical and Computer EngineeringUniversity of Houston
Houston, TX 77204-4005
Abstract
Variability in size, shape, and clumping cells together make finding the positions of cell nuclei challenging. Since accurate algorithms are often computationally intensive, segmentation is too slow for large 2D images, video, and 3D images. This work is focused on automated detection of cell soma in thionin stained Knife-Edge Scanning Microscopy (KESM) images using iterative voting technique. It provides several advantages, including: minimal user input, no user feedback, and highly parallel design. The high level of parallelism built in to our algorithm means that the algorithm is scalable, allowing the allocation of additional computational resources to improve segmentation speed.
Introduction
Fully automated techniques are required in order to realistically process the volumetric data sets. Maintaining high accuracy with minimal user input is a well understood problem in segmentation. In this paper, we describe an automated method for finding the position of cell soma in images stained using thionin (Nissl) and imaged using Knife-Edge Scanning Microscopy (KESM) [1]. Iterative voting algorithm is an appropriate technique for finding the cell nuclei in 2D datasets [2]. We used this algorithm to find cell nuclei in the 3D datasets and for improving time performance, we parallelized iterative voting and used the GPU.
Method
Iterative voting is a blob detection algorithm and can precisely detect the cell nucleilocations in different type of images. So we extend this algorithm for three dimensional data sets, and since it is computationally expensive, we implemented that on the heterogeneous platform (GPU-base) to improve the time performance. Every pixel of the dataset generates a conical voting field based on the pixel gradient magnitude and direction. All voting fields are integrated to produce a vote dataset, where the magnitude of each pixel reflects the probability of a cell centroid at that position. This vote dataset is then used to refine the direction of each voting field. The vote dataset is then iteratively refined and local maxima of high intensity values in the vote dataset are calculated and labeled as cell centroids. We develop a GPU-based algorithm to calculate the vote dataset and update the voting fields in a practical time frame. However, these calculations can be highly parallelized by (a) computing the vote dataset for each pixel independently and (b) updating the voting field for each pixel independently. Both of these calculations can be represented as a 3D template function. The most time consuming part of this algorithm is computing the conical voting field for every pixel at thread level, which needs the information of neighboring pixels that required lots of data fetching for each thread. To overcome this issue, we take advantage of atomic operations to calculate the vote dataset.
13

Results
We applied the GPU base iterative voting algorithm on the KESM dataset. The 3D implementation of iterative voting localizes most of the cells in the data set. Figure 1 shows three neighboring slides of a crop of the data set. The red areas are the voted ones by iterative voting. By finding local maxima and then threshold that, position of each cell will be found.
Fig. 1. Three slides of Nissl data set overlaid by the voting dataset (red areas).
For 128cube chunk of dataset, we manually make a ground truth and compute the validation features for both 3D iterative voting implementations on C++/CUDA andMATLAB. The precision-recall curve in figure 2 (a) shows the validation results that approves the accuracy of this algorithm improved due to parallelizing. Time performance of the parallelized iterative voting algorithm is the other important feature that makes using this algorithm practical for large images, videos and 3D datasets. Figure 2 (b)displays the required time for running this technique as parallel and sequential.
Fig. 2. (a) Precision-Recall curve for parallel and sequential implementation, (b) Time performance for 3D iterative voting running on CPU (MATLAB) and GPU (CUDA).
Conclusion
Validation results demonstrate that our algorithm works well for detecting cell nuclei in volumetric data sets that include cells with varying sizes and shapes, and also it has been shown to be robust in images where cells are densely packed. By parallelizing the iterative voting algorithm and running on the GPU, performance significantly improves.
References
[1] D Mayerich, L Abbot and B McCromick, Journal of Microscopy Volume 231 (2008).[2] B Parvin et al, IEEE transactions on image processing (2007).
14

Figure 1 Breast tissue stained with H&E stain (left) and IT imaged breast tissue classified using only 10 features selected by GA-LDA here green is
GPU BASED FEATURE SELECTION USING MULTIDIMENSIONAL BIOMEDICAL IMAGES TO ENABLE FAST INFRARED IMAGING
USING DFIR
Rupali Mankar1, Saurabh Prasad1, Michael Walsh2, David Mayerich1
1. Department of Electrical and Computer Engineering, University of Houston, USA2. Department of Pathology, University of Illinois at Chicago, Chicago, USA
AbstractVibrational spectroscopy has become popular among researchers as an alternative for histopathological studies. However, imaging with FTIR (Fourier Transformed Infrared spectroscope) takes long time and generates large (terabytes in size) spectroscopic image per tissue section. Hence, we propose use of GA-LDA (Genetic Algorithm – Linear Discriminant Analysis) feature selection algorithm to reduce dimensionality and enablefast imaging using discrete frequency infrared system. GA wraps around Fishers’ ratio as a fitness function and selects best feature subset over a number of iterations using Fisher’s criteria. We further demonstrate that the GPU (Graphics Processing Unit)implementation of algorithm makes feature selection fast with huge data sets.
IntroductionHistopathological staining technique is in practice from several years but results of these studies are non-quantitative and prone to human errors. Whereas, vibrational spectroscopy has the potential to standardize and automate histopathological analysis [1].However, drawbacks like long imaging time and large data size per tissue hold it back from clinical applicability. Hence, we have proposed GA-LDA asa feature selection algorithm for dimensionality reduction of IR spectroscopic data. We have compared it with popular dimensionality reduction technique PCA in spectroscopy. Features selected with GA-LDA algorithm provides better classification performance for various types of tissues. GA-LDA serves two purposes - it reduces dimensionality and enables discretefrequency imaging by finding spectral markers for classification. In order to select robust spectral markers irrespective of patients, we use tissue microarrays (TMAs) which include tissues form hundreds of patients on the same slides. These imaged datasets are large in size and therefor make the feature selection computationally extensive. We further improved GA-LDAcomputational efficiency by implementing it on GPU. This helped us to test our algorithm on different types of tissues and observe differences in results due to change in histology protocols and/or data preprocessing.
Methods and MaterialsHyperspectral images (HSI) of tissues are collected using Agilent FTIR spectroscope and also using Spero QCL (quantum cascade laser) system. For IR imaging, tissues are placed on IR transparent CaF2 window and adjacent sections placed on positively charged glass slides for generating groud thruth using conventional histopathology techniques. HSI images from FTIR are collected in low magnification mode with 15x IR objective with 0.65 NA, it gives pixel size of 5.5 m. Raw hyperspectral image goes through
0.5mm 0.5mm
15

preprocessing like baseline correction and normalization before feature selection and classification. These preprocessing ensures that we are selecting features based on chemical information by matigating effects of structural artifacts. GA-FDA feature selection is supervised feature selection and it uses ground truth obtained from chemical stains of adjacent sections. It selects feature subsets and it helps to avoid selection of correlated features which is highly probable for algorithms which select features on an individual basis. With GA-LDA, we have another advantage of data parallelism. In GA-LDA algorithm, we are using linear discriminant analysis (LDA) as a function, which evaluates each candidate solution from the GA population at every generation to find optimal solution [3]. GA search by doing this evaluation for each candidate solution which is feature subset in our case, on CPU takes long time. On the other hand if we use GPU and compute score of each candidate solution in parallel then it makes GA-LDA algorithm a lot faster. Improvement in computation time grows exponential with data size. Also, if we increase population size then GA converges fast to optimal solution and needs less number of generations for finding optimal solution.
ResultsOur proposed method has been tested on breast, bone, kidney, liver and prostate tissues. Breast tissue classification results are shown in the following charts. Training and validation is done on images from different slides for seven different classes but for better visualization only four classes’ results are plotted. We found that GA-FDA performsslightly better than PCA on complex data sets as well with advantage of spectral marker selection.
ConclusionGPU implemented GA-LDA is a fast and better way to find spectral signatures on huge data sets. Classification based on spectral signature provides high accuracy for cancer-relevant tissue types. This also enables use of these spectral markers for Discrete Frequency IR (DFIR) imaging.
References
[1] D. Fernandez at al Nature Biotechnology, 23, 469-474 (2005).[2] D. Mayerich et al, SPIE Medical Imaging: Digital Pathology, 904107 (2014).[3] M. Cui, S. Prasad, W. Li and L. M. Bruce: IEEE Vol.6, No.3, (June2013)
0.6
0.7
0.8
0.9
1
0 20 40 60 80 100
Area
und
er R
OC
curv
e
Number of features
GA
coll epith fibro lymph
0.6
0.7
0.8
0.9
1
0 20 40 60 80 100
Area
und
er R
OC
curv
e
Number of features
PCA
coll epith fibro lymph
16

FAST GPU-BASED SEGMENTATION FOR HIGH-THROUGHPUT TIME-LAPSE IMAGING MICROSCOPY IN NANOWELL GRIDS (TIMING)
Jiabing Li1, Leila Saadatifard1, Navin Varadarajan2, Badri Roysam1 and David Mayerich1
1 Department of Electrical and Computer Engineering2 Department of Chemical Engineering
University of Houston, Houston, TX 77204-4005
Abstract
Automated profiling of individual cell-cell interactions from high-throughput Time-lapse Imaging Microscopy In Nanowell Grids (TIMING) provides a method for studying variations in the effectiveness of engineered immune calls. However, current algorithms used to perform segmentation and tracking are slow and computationally expensive. This is primarily due to reliance on eigen decomposition of a large sparse matrix. In this paper, describe a revised algorithm that is able to achieve a 3% improvement in accuracy with a 10X speedup using GPU computing. This allows real-time data processing without the need of high-performance clusters and time-consuming data transfers.
Introduction
In order to achieve real-time performance in TIMING data sets with minimal parameter tuning, we first simplify the TIMING pre-processing pipeline by (1) implementing a GPU-based median filter and (2) use iterative voting [2] to identify cell centers. Instead of relying on spectral clustering, our clustering algorithm combines connected-components with the cell centers to identify the pixels associated with each identified cell. Compared with the previous spectral clustering algorithm, we are able to reduce over-segmentation, increasing accuracy by 3%, and improve performance by a factor of 10X.
Methods
1. Image Pre-processing
Fig. 1. Iterating voting for identifying cell centers
We perform Normalized Cross-Correlation (NCC) based template fitting method to get nanowell location automatically. Smooth image using a median filter with radius 3 while preserving cell boundaries and then make first segmentation by Using K-means with feature Intensity. In order to extract cell centers, we use Iterative Voting, in which every pixel of dataset generates a conical voting field based on the pixel gradient magnitude and direction and all voting fields are integrated to produce a vote image that is used to refine voting field direction. Vote image is then iteratively refined and local maxima of high
17

intensity values are calculated and labeled as centroids. Result is shown as Figure 1. Finally, crop segmented images and cell-centers image into nanowell blocks.
2. Cell Clustering
Spectral Clustering: Given N foreground pixel coordinates, compute similarity matrix W and then compute Degree matrix D of W row-summation. Next, compute un-normalized graph Laplacian matrix: L = D - W. We calculate their eigenvectors U based on LU = DU. Finally, using K-means, cluster the foreground points corresponding to the rows of into clusters C and re-label the foreground pixels based on these classes.
Connected-components with cell centers distance Clustering (CCD Clustering):Firstly, label connected-components by processing runs of input image [4]. We set every connected components cluster as one run per row. Get run-length encode the input image and then scan the runs, assigning preliminary labels and recording label equivalences in a local equivalence table. Resolve the equivalence classes and relabel the runs based on the resolved equivalence classes. Inside each connected components cluster, find out the cell centers and then calculate the distances between the cluster points and cell centers, choose the minimum distance and then re-label the point as corresponding cell center.
Results & Conclusions
Spectral clustering takes 1m 21s per slice and CCD clustering takes 1.1s per slice. Two clustering results are shown as Figure 2. There are three pairs and in each pair, the left one is spectral clustering result and another one is CCD Clustering result. For pair (a), the left one cells are over segmented. Pair (b) get the same results. For pair (c), some pixels of the left one are clustered falsely. So compared with the previous spectral clustering algorithm, we are able to reduce over-segmentation, increasing accuracy efficiently and improve performance by a factor of 10X.
(a) (b) (c)Fig. 2. Three pairs for Spectral clustering and CCD clustering results
References
[1] A Merouane, N Rey-Villamizar, Y Lu, I Liadi, G Romain, J Lu, H Singh, L J.N. Cooper, N Varadarajan, B Roysam1, “Automated profiling of individual cell–cellinteractions from high-throughput time-lapseimaging microscopy in nanowell grids (TIMING)”, OXFORD, doi: 10.1093/bioinformatics/btv355, June 2015.[2] L Saadatifard, D Mayerich, "Fast Automated Cell Nucliei Segmentation In Large KESM Images Using GPU", GRC, pp: 9-10, 2.[3] Wu, X. et al. (2004) The local maximum clustering method and its application in microarray gene expression data analysis. EURASIP J. Adv. Signal Process., 2004, 53-63.[4] Haralick, Robert M., and Linda G. Shapiro, Computer and Robot Vision, Volume I, Addison-Wesley, 1992, pp. 28-48.
18

VISUALIZATION AND VALIDATION SYSTEM FOR HIGH-THROUGHPUT QUANTITATIVE CHARACTERIZATION OF TIME-LAPSE IMAGING
MICROSCOPY IN NANOWELL GRIDS (TIMING)
Hengyang Lu1, Melisa A. M. Paniagua2, Navin Varadarajan 2, and Badrinath Roysam1
1 Department of Electrical and Computer Engineering2 Department of Chemical and Biomolecular Engineering
University of HoustonHouston, TX 77204-4005
Abstract
Time-lapse Imaging microscopy in nanowell grids (TIMING) is a powerful tool for quantifying and analyzing interacting T cells and cancer cells in vitro. In our previous work, an automatic high-throughput micrograph processing pipeline has been built to segment and track each individual cells. Here, we present a novel visualization system to give better access to the pipeline output results. With this system, biologists can validate the outputs and fine-tune the results efficiently.
Introduction
It is important and meaningful to monitor the interactions between CAR-T cells and cancer cells and screen out the group of T cells [1] scoring the best in killing cancer cells.TIMING method offers a great chance to fulfill this task. With nanowell grid confinement, T cells and cancer cells are monitored, segmented, tracked and quantified within each individual unit, Fig. 1-D&E. This confinement increases the possibility of interactions between cells and the sparsity of cell distributions improves the accuracy of cell profiling results. A step further from our previous work [2], we develop an integrated visualization system for validating the cell profiling results, and details are covered in Section Methods.
Methods
(A) Format the output data. One TIMING dataset contains multi-spectral time-lapse images of several blocks, shown in Fig 1-A and B. To format the output data from the micrograph processing pipeline, we chop off the images in space and time, shown in Fig.1-C, where a nanowell is cropped, and save them in standard format.(B) Profiling of nanowells. A simple classification of nanowells is based on the number of T cells and cancer cells detected in them. By specifying some pre-set parameters, the profiler can generate separate tables containing nanowells of the same ratio between T cells and cancer cells, shown in Fig. 1-G. The calculated feature parameters are listed in Fig 1-F. And the killing summaries are in Fig. 1-H.(C) Single nanowell observatory and feature board component. By clicking any nanowell shown in the table, a single nanowell observatory window will pop up, shown in Fig. 1-H. Users can go and check out the features of cells detected in that nanowell,shown in Fig. 1-I. One of the most useful part of the feature board module is to check outthe ANNEXIN-V level and confirm the killing and death events of cells.(D) Re-editing module to fine-tune the results. If some errors does happen for one nanowell, say over- or under- segmentation of cells or some tracking mismatches, users can trigger the re-editing module and do quick corrections of the results [3]. After the fine-tuning, the validated nanowell results are saved into the reliable nanowell repository.
19

This validated nanowell repository can be used as training set for state-of-the-art machine learning modules, which is our work in the future.References
[1] I. Liadi et al, “Individual Motile CD4+ T Cells Can Participate in Efficient Multikilling through Conjugation to Multiple Tumor Cells,” Cancer Immunology Research, 2015.[2] A. Merouane et al, “Automated Profiling of Individual Cell-cell Interactions from High-throughput Time-lapse Imaging Microscopy in Nanowell Grids,” Bioinformatics,31(19):3189–3197, 2015.[3] Andrew Ng et al, “On Spectral Clustering: Analysis and an algorithm”, NIPS, 2001.
F TIMING ProfilerParameter List:
tSeek, tContacttDeath, tEffDeathdWell No ContactdWell ContactAR No ContactAR Contact
A
B C D E
G H
I
N = 1, t = 5 min
N = 2, t = 10 min
N = 72 t = 360 minN = 71, t = 355 min
Fig. 1. TIMING Overview (A). Montage of nanowell blocks, scale bar: 500 m; (B) Snapshot of one nanowell block, scale bar: 50 m; (C) 72 time-lapse snapshots of single nanowell, scale bar: 25 m; (D) Cell segmentation result of nanowell in (C), scale bar: 25 m; (E) Effector (T cell) and Target (Cancer cell) Cell moving path; (F) TIMING profiler parameter list; (G) Feature table for all the nanowells having 1 Effector and 3 Target cells; (H) Nanowell Re-Editing Box; (I) Feature board for one single nanowell; (J) Killing summaries for all the nanowells in one given dataset.
Effector Target
J
20

STRUCTURE TENSOR TRACTOGRAPHY FOR VISUALIZING LARGE-SCALE MICROSCOPY DATA SETS
Srijani Mukherjee and David Mayerich Department of Electrical and Computer Engineering
University of HoustonHouston, TX 77204-4005
Abstract
Serial electron microscopy provides a method for imaging brain tissue in 3D at nano-scale resolution. While this provides sufficient resolution to reconstruct neuronal connections, the data sets are too dense to be amenable to modern segmentation algorithms. Current reconstructions rely on manual segmentation and crowd-sourcing. Since segmentation is currently a labor intensive process, tools that allow users to identify areas of interest in these dense data sets are tremendously useful. We propose a new method for visualizing these data sets to make them more amenable to human interpretation. We first build a structure tensor field, which can be generated out-of-core for large data sets. The processed data consists of a symmetric rank-2 tensor field describing the local structures, such as fibers and membrane surfaces. It is more robust to scaling than the raw image data, providing a method for scalable visualization. In addition, we demonstrate the use of fiber tractography to visualize the direction and flow of neuronal connections.
Introduction
The application of optic flow in estimation and segmentation have made extensive use ofthe structure tensor. The 3D structure tensor characterizes local image variation at each pixel [1].1. Structure Tensor: The structure tensor is generally used to obtain the orientation of structures within the neighborhood of location p in the given input image. The second order structure tensor T is as follows
(1)Where Tij is the (i, j)th element of . The window function is shown as w, Ii and Ij are the gradients of I along ith and jth dimensions, and r is a coordinate in the N-dimensional image.For the ease of implementation, the structure tensor S is represented as a convolution of the autocorrelation of the gradient with a window function w:
(2)
(3)(4)
2. Tractography: The tractogram (a scalar field indicating a connectivity score between voxels) is visualized by nested surface layers, providing an overview of long-range connectivity. Unique dataset features are reflected by value-based opacity, and further enhanced by depth cues. A current literature present a multi-modal visualization approach for probabilistic tractograms in an MRI-based context. It gives a multi-surface representation for the probabilistic tractograms because they convey long-range connectivity better than slice-based representations, and thus satisfy requirement.Moreover, they enable a user to obtain a good 3D impression along the view direction, and to approximate the value distribution in between.
Comment [WU1]: Move this and tractography into the introduction. In “Methods” describe the implementation. Out-of-core processing, resampling, etc.
21

Methods
3D structure tensor algorithm (3D-STA) takes a sequence of images I(x,y) as an input, generally consisting of scalar values represented by 8- or 16-bit integers. These images are stacked together to create a volumetric scalar field V(x,y,z), where x, y and z are the 3D coordinates. However, the entire volume V is likely too large to fit into memory. This problem is exacerbated by the size of the resulting structure tensor field, since each tensor requires six (6) unique values generally represented with 32-bit IEEE floating point precision. This means that the resulting tensor field is between 16 and 64 times the size of the original data. The original structure tensor field has been resampled to make further processing faster. They have been resampled by a given factor using a box filter.
Results
The given stack of images was used for building 3-dimensional structure tensor matrix corresponding to each voxel. From each matrix three eigenvectors were obtained using Eigen decomposition method. The smallest Eigenvector was used to determine the direction of the fiber and create a colormapped image based on the R-G-B value respectively.
Fig. 1. (a) Serial image image and (b) colormapped image corresponding to the smallest eigen vector computed on the structure tensor matrix.
(a) (b)Fig. 2. Fiber cluster in the (a) SEM (Serial Electron microscopy) image (b) colormap image
References1. Mayerich, D., Abbott, L., & Keyser, J. (2008). Visualization of Cellular and
Microvascular Relationships. IEEE Trans. Visual. Comput. Graphics, 14(6), 1611-1618. doi:10.1109/tvcg.2008.179
22
GENDER DIFFERENCES IN NEURAL ACTIVITY WHILE EXPERIENCING ART IN A MUSEUM SETTING
Akshay Sujatha Ravindran and Jose L. Contreras VidalLaboratory for Noninvasive Brain-Machine Interface Systems
Department of Electrical and Computer Engineering University of HoustonHouston, TX 77204-4005
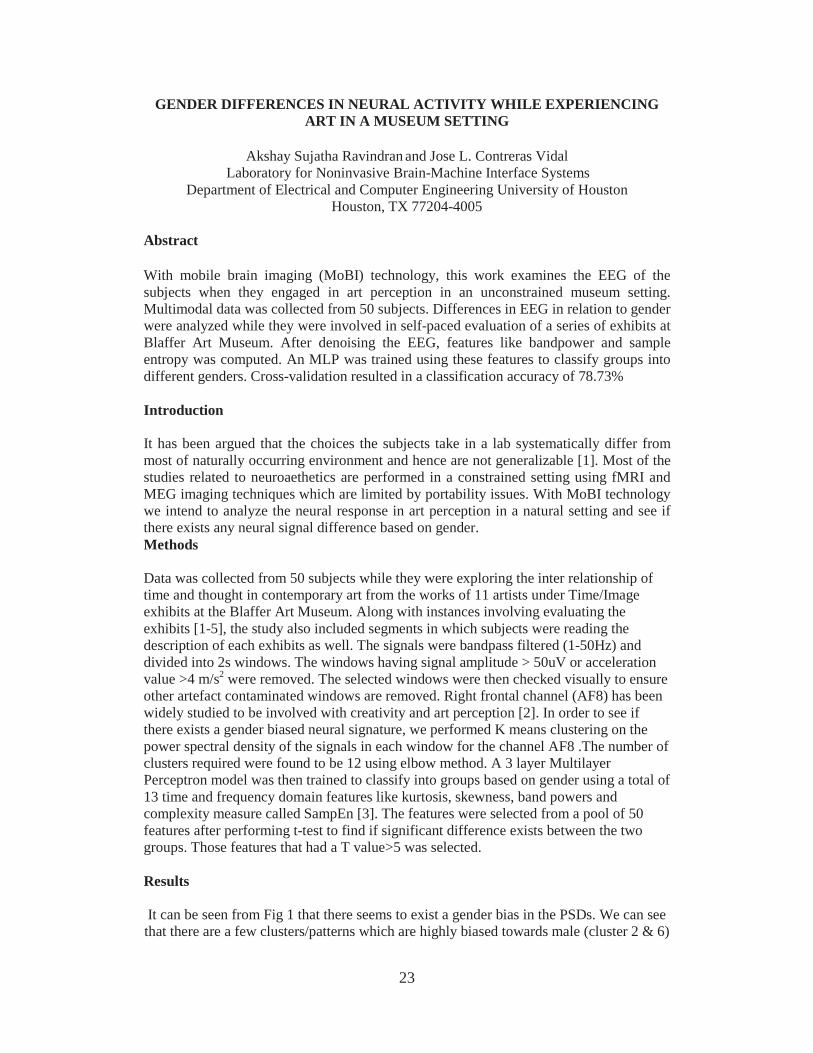
Abstract
With mobile brain imaging (MoBI) technology, this work examines the EEG of the subjects when they engaged in art perception in an unconstrained museum setting. Multimodal data was collected from 50 subjects. Differences in EEG in relation to gender were analyzed while they were involved in self-paced evaluation of a series of exhibits at Blaffer Art Museum. After denoising the EEG, features like bandpower and sample entropy was computed. An MLP was trained using these features to classify groups into different genders. Cross-validation resulted in a classification accuracy of 78.73%
Introduction
It has been argued that the choices the subjects take in a lab systematically differ from most of naturally occurring environment and hence are not generalizable [1]. Most of the studies related to neuroaethetics are performed in a constrained setting using fMRI and MEG imaging techniques which are limited by portability issues. With MoBI technology we intend to analyze the neural response in art perception in a natural setting and see if there exists any neural signal difference based on gender.Methods
Data was collected from 50 subjects while they were exploring the inter relationship of time and thought in contemporary art from the works of 11 artists under Time/Image exhibits at the Blaffer Art Museum. Along with instances involving evaluating the exhibits [1-5], the study also included segments in which subjects were reading the description of each exhibits as well. The signals were bandpass filtered (1-50Hz) and divided into 2s windows. The windows having signal amplitude > 50uV or acceleration value >4 m/s2 were removed. The selected windows were then checked visually to ensure other artefact contaminated windows are removed. Right frontal channel (AF8) has been widely studied to be involved with creativity and art perception [2]. In order to see if there exists a gender biased neural signature, we performed K means clustering on the power spectral density of the signals in each window for the channel AF8 .The number of clusters required were found to be 12 using elbow method. A 3 layer Multilayer Perceptron model was then trained to classify into groups based on gender using a total of 13 time and frequency domain features like kurtosis, skewness, band powers and complexity measure called SampEn [3]. The features were selected from a pool of 50 features after performing t-test to find if significant difference exists between the two groups. Those features that had a T value>5 was selected.
Results
It can be seen from Fig 1 that there seems to exist a gender bias in the PSDs. We can see that there are a few clusters/patterns which are highly biased towards male (cluster 2 & 6)
23

while there was some other clusters which are biased towards the female group (cluster 9 & 12). Clusters 7 & 10 are example clusters which has nearly same gender distribution. The 10 fold cross validation with 80% data used for training gave a classification accuracy of 78.73% across all exhibits. It was found that selecting Instances involving exhibit 2 and Read alone gave accuracy as high as 88.3%.
Fig. 1. Examples of significant clusters from the K-means clustering (12 cluster) of PSD for EEG in AF8channel.[A]-electrode location ;[B]-PSD plot;[C]-gender distribution in cluster across exhibits(exemplars);[D]-No. of male & female per cluster;[E]-SampEn distribution across clusters.
Discussion
It is evident from the Fig.1. C & D that gender bias is not limited to any particular exhibit which might suggest it to be a generic unique signature while evaluating exhibits. The female dominated clusters seem to have a higher gamma power and SampEn compared to that in male dominated clusters. Relatively lower SampEn in cluster 2 & 6 indicates moreregularity [3] in the signal which might suggest the people are focused and attentive to the task of viewing the exhibit. Classification gave promising results suggesting that there does exist differences in the neural signals based on gender during evaluation of art.
References
[1] Levitt, S. D., & List, J. A. (2007). What do laboratory experiments measuring social preferences reveal about the real world?. The journal of economic perspectives, 21(2), 153-174.[2] Carlsson, Ingegerd, Peter E. Wendt, and Jarl Risberg. "On the neurobiology of creativity. Differences in frontal activity between high and low creative subjects." Neuropsychologia 38.6 (2000): 873-885.[3] Pincus, Steve. "Approximate entropy (ApEn) as a complexity measure." Chaos: An Interdisciplinary Journal of Nonlinear Science 5.1 (1995): 110-117.
24

ADVANCED RECOGNITION OF TERRAIN TRANSITIONS DURING LOCOMOTION VIA NON-INVASIVE EEG
Justin A. Brantley, Trieu Phat Luu, and Jose L. Contreras-VidalDepartment of Electrical and Computer Engineering
University of HoustonHouston, TX 77204-4005
Abstract
Volitional control of lower-limb prostheses has been demonstrated using electromyography (EMG)-based controllers; however, these systems lack the ability to predict locomotion mode transitions with advanced notice. We investigated the feasibility of detecting the transition from level to stair walking from electroencephalography (EEG). We observed significant increases in activation of cortical visuomotor networks when transitioning from level-ground to stairs. Significant changes in the activations can be detected up to ~1 second in advance of state-of-the-art systems. These findings are a further step towards the development of a multimodal neural-machine interface (NMI) for intuitive and flexible control of powered prosthetic legs. This research is partlysupported by NSF awards IIS-1302339
Introduction
Currently available prosthetic devices lack the inherent ability to interpret the user’s intent during locomotion. Volitional control of lower-limb prostheses has been demonstrated using electromyography (EMG)-based controllers, in which activation of the muscles of the lower-limb can be harnessed to decipher user intent. However, although robust during continuous locomotion, EMG-based systems (which rely only on peripheral nervous signaling) lack the ability to predict locomotion mode transitions (e.g., level ground to stairs, stairs to level ground) with advanced notice. In this study, the feasibility of detecting user locomotion modes (i.e., level-ground walking vs stair ascent) from non-invasive electroencephalography (EEG) signals is investigated in able-bodied individuals.
Methods
Subjects were instrumented for full-body mobile brain-body imaging, including EEG, EMG, and motion capture, while walking on an experimental gait course involving locomotion on level-ground, stairs, and ramps (Fig. 1). A systematic EEG processing method was implemented to reduce artifacts (e.g., eye blinks/movements, muscle artifacts) and identify neural correlates of multi-terrain walking.
Results
Our results revealed the involvement of four distinct regions in the brain during the various locomotion modes: left and right occipital lobe, posterior parietal cortex, and central sensorimotor cortex. Additionally, we observed significant differences in spectral power in the occipital cluster between level-ground (LW) and stair (SA) walking, likely indicating heightened involvement of the visuomotor pathway (Fig. 2). These significant cortical activations can be detected up to ~1 second in advance of state-of-the-art myoelectric controllers.
25

Fig. 2. Time-frequency analysis of IC activations in the occipital cluster for LW to SA. A) Spectrogram of full trial B) Location of equivalent dipoles in the occipital cluster. C) Significant differences in spectral power between LW and SA. D) Spectral power extracted from different bands. E) Illustration of lower limb patterns during LW and SA walking.
Discussion
Currently available lower-limb prostheses (fully passive and microprocessor) offerlimited volitional control by the user and result in reduced overall mobility. Recent advancements in powered lower limb prostheses allow for more intelligent control and better locomotion functions in lower limb amputees. The most advanced and desirable strategy for control employs user intent detection to combine volitional and autonomous control of the device during locomotion. The incorporation of neural signals, specifically muscle and brain, may offer a viable method for volitional control by directly interpreting signals from muscle and cortical brain activations. Volitional control has been previously demonstrated by using electromyographic (EMG) signals from the lower limbs; however, this approach is limited when transitioning between terrains since the information is not available in advance of the movement. The inclusion of neural information from the brain may provide global motor information that can be used to predict the upcoming motor state in advance of the movement (i.e., transition from level ground to stairs).
In this study, we observed that activity in the visual cortex is modulated during transitions from level walking to stair ascent. Furthermore, the cortical activations signaling an oncoming transition were observed 1.27 seconds in advance of the time in which the amputee would begin walking on the new terrain. These findings have implications for developing a neural decoding paradigm that is capable of predicting, rather than responding to, the user gait intentions. Future work will focus on developing a neural-machine interface that utilizes cortical information during visual processing to assist in the prediction of terrain transitions. The addition of neural information from the brain may allow for improved transition between terrains, thus reducing the risk of falls and injury by the user.
26

THE LONG EFFECTS OF MILD TRAUMATIC BRAIN INJURY ON BRAIN ACTIVITY BASED ON THE STROOP PARADIGM
Lianyang Li1 and George Zouridakis1,2,3
1Department of Electrical and Computer Engineering2 Department of Engineering Technology
3Department of Computer ScienceUniversity of Houston,
Houston, TX 77204-4005
Abstract
In this study, we firstly compared Stroop working memory response in 13 mild traumatic brain injury (mTBI) patients and 7 normal controls, using amplitude and latency analysis. Group analysis of P300 component showed that mTBI patients exhibited statistically significant weaker response especially in the frontal, central and parietal regions, mainly differed from controls in the amplitude on the first visit and the differences disappeared after the second visit. The latency values did not show any differences. Secondly, sample entropy difference was consistent in the 3 different visit of mTBI subjects. These findings suggest that working memory ERP analysis may be used as specific biomarkers that can help with the diagnosis of and assess the efficacy of intervention in mTBI patients. Although patients have some recovery of P300 response, the mTBI still has a long lasting influence on the EEG signal.
Introduction
In our quest to understand how mTBI affects communication networks in the human brain, in our previous studies we used functional connectivity analysis of restingstate magnetoencephalographic (MEG) activity at the sensor level (Zouridakis et al., 2012; Pollonini et al., 2010, Dimitriadis et al., 2015;) and analysis of intracranial source localizations (Li, et al., 2015) to identify reliable biomarkers for mTBI characterization. In this study, we employ event-related potentials (ERPs) obtained in the context of a working memory (WM) paradigm to compare neuronal responses between mTBI patients and normal controls, which we hypothesize can be affected by brain injury. Sample entropy is a modification of approximate entropy, used for assessing the complexity of physiological time-series signals, diagnosing diseased states. Here we have used it to make analysis of EEG channels signal.
Methods
For this study we recruited 13 mTBI subjects (7 males, average age 25.6) and 7 normal controls (4 males, average age 27.2). Data were obtained at the Huntington MedicalResearch Institutes (HMRI) in Pasadena, CA, USA. In the Stroop task, subjects will see words red, green, or blue printed in red, green, or blue color. Congruent trials mean color and words match, incongruent trials mean color and word do not match. Subjects will be required to push button using the index, middle, and ring fingers of their right hand in response to different COLOR of the word. 50% of trials will be congruent and 50% of trials will be incongruent. Continuous electroencephalographic (EEG) activity was acquired using a dry electrode system. Most mTBI subjects had three recording sessions.
27

The first visit was conducted within one week after the injury, whereas the second and third visits were completed two and four weeks, respectively, after the first visit.
ERPs were preprocessed to detect and remove electrophysiological noise, such as muscle activity and eye movements. We grouped the cleaned 19 channels into five ROIs: Frontal (F3, Fz, F4), Central (C3, C4, Cz), Parietal (P3, Pz, P4), Left Lateral (F7, T7, P7), and Right Lateral (F8, T8, P8). We used a time window between 300 and 700 ms post-stimulus within which to identify the P300 component for each subject and then computed the amplitude and latency of the component in each region for all mTBI and control subjects. The average ERPs of five ROIs are shown below in Fig.1 and Fig.2,control is in blue and mTBI is in red. Based on the cleaned ERPs, we have applied sample entropy method to each channels to generate a group of entropy features to each subject. Then we have applied MANOVA and ANOVA to finish the group analysis of amplitude/latency of P300 component and sample entropy of channels.
Fig.1 Average ERP of incongruent test Fig.2 Average ERP of congruent test
Results and Discussion
The above results combined point to the amplitude being the most interesting measure. mTBI patients in general respond weaker than control, especially in the frontal, central and parietal region. The fact that mTBI mainly differed from controls in the amplitude on the first visit and the differences disappeared after the second visit confirms previous findings that patients had some recovery during the experiment. The complexity of the signals didn’t completely recover even after the third visit, which is an evidence that deficits in mTBI patients may persist for years.
References[1] Zouridakis, G., Paditar, U., Situ, N., Rezaie, R., Castillo, E., Levin, H., Papanicolaou, A.C., 2012. Functional connectivity changes in mild traumatic brain injury assessed using magnetoencephalography. J. Mech. Med. Biol. 12 (02).[2] Pollonini L, Pophale S, Situ N, Wu MH, Frye RE, Leon J, Zouridakis G. Information communication networks in severe traumatic brain injury, Brain Topogr, 2010.[3] Dimitriadis S, Zouridakisc G, Rezaie R, Babajani-Feremid A, and Papanicolaou AC, Functional Connectivity Changes Detected with Magnetoencephalography after Mild Traumatic Brain Injury, NeuroImage: Clinical, 2015.[4] Li, L., Pagnotta, M.F., Arakaki, X., Tran, T., Strickland, D., Harrington, M., Zouridakis, G., 2015. Brain activation profiles in mTBI: evidence from combined resting-state EEG and MEG activity. Conf. Proc. IEEE Eng. Med. Biol. Soc. (August 25–29,2015, accepted)
-500 0 500 1000 1500-2
0
2Frontal
-500 0 500 1000 1500-5
0
5Central
-500 0 500 1000 1500-5
0
5Parietal
-500 0 500 1000 1500-2
0
2Left Temporal
-500 0 500 1000 1500-2
0
2Right Temporal
-500 0 500 1000 1500-2
0
2Frontal
-500 0 500 1000 1500-5
0
5Central
-500 0 500 1000 1500-5
0
5Parietal
-500 0 500 1000 1500-2
0
2Left Temporal
-500 0 500 1000 1500-2
0
2Right Temporal
28

REDUCTION OF RADAR CROSS SECTION USING ACTIVE ANTENNA ELEMENTS
O. H. Council, Sohini Sengupta, D. R. Jackson, and S. A. LongDepartment of Electrical and Computer Engineering
University of HoustonHouston, TX 77204-4005
Abstract
The traditional approaches to reducing an object's radar cross section are passive in nature, such as changing the shape of an object or coating the object with a non-reflecting material. Here a new approach to solving this problem is explored, which is based on the principal of destructive interface between the reflected (return) radar signal from the object and a radiated signal that emanates from an antenna mounted on the structure. A canonical system model consisting of a sensor, feed network, and radiating element is analyzed, and results that show that under limited conditions an effective radar cross section reduction is possible.
Introduction
Examples of passive applications of traditional approaches to RCS reduction are the Lockheed-Martin F-117 fighter aircraft, the Boeing B-2 nuclear bomber and the USS Zumwalt (DDG-1000). The concept discussed in this research project is based on the principal of destructive interface between the reflected (return) radar signal and a radiated signal that emanates from an antenna mounted on the structure. By sensing the presence of the incoming signal and then radiating a canceling (nullifying) wave from a surface-mounted antenna, it is theoretical possible to cancel out the total returned wave. Figure 1 shows a functional design of a possible system that could carry out this function.
Figure 1 –Diagram of an active system for RCS reduction.
Analysis Method
The sensor, shown in Figure 1, is the input source to the system, and therefore must be characterized carefully. A simple analytic model for this sensor is based on the concept of an effective length of the sensor, together with a plane-wave analysis (based on a
Patch Sensor
AmplifierPhase shifter
Incident plane wave
29

Transverse Equivalent Network or TEN) to determine the fields in the vicinity of the sensor due to an incoming plane wave. In practice, the sensor will be connected to an isolation buffer between the sensor and amplifier, and therefore the open-circuit voltage of the sensor in the time domain when in the presence of the radiating patch and incident wave plane is important to characterize. The output voltage of the sensor in the time domain is calculated by using the simple approximate (TEN) method as well as by using full-wave commercial software such as Ansys HFSS and CST Microwave Studio.
Results and Conclusions
Figure 2 shows how the approximate analytic TEN method compares to an HFSS simulation for the output of the sensor, using a simple “tripole sensor”. The simulation is setup uses a large plate (2m x 2m) in order to simulate a near-infinite ground plane. The results show reasonable agreement between the two different methods.
Figure 2 – Results for the sensor output voltage (HFSS vs. TEN Model).
Ideally, the sensor is placed far enough away from the radiating patch antenna to minimize the coupling between the two. A more advanced sensor, called the “super sensor” is introduced to minimize this coupling.
Results will also be presented to show the RCS reduction obtained by using the system shown in Fig. 1, using the sensor to feed into an amplifier and phase shifter, which then feeds the radiating patch.
References
[1] C. A. Balanis, Antenna Theory, 4th Edition, John Wiley and Sons, 2005.
30

ASSESSMENT OF TIME REVERSAL METHODS USED FOR OPTIMIZED HYPERTHERMIA IN CANCER TREATMENT
Kuang Qin1,2 and Jarek Wosik1,2
1Department of Electrical and Computer Engineering2Texas Center for Superconductivity
University of HoustonHouston, TX 77204-4005
AbstractRf hyperthermia (HPT) and rf ablation (RFA) procedures, for which cell temperatures are increased to 41-46 °C and above 56 °C, respectively, are well recognized methods for treatment of malignant tumors. However, they suffer from lack of selectivity toward cancer tissue. It creates a need for a method, which can increase specific heating on the target and reduce significantly the non-specific heating. In this work we provide the assessment of time reversal (TR) technique used to focus rf/microwave electromagnetic waves in hyperthermia treatment of deep-seated tumors. Basically, TR takes advantage of time invariance of Maxwell equations and it utilizes the time reversal mirror (TRM) to record the EM waves emitted from a source and reemit the time-reversed version back to the source. The TR technique can be combined with MRI/CT generating permittivity maps and as a result a virtual source can be used in TR technique allowing for non-invasive focused heating of tumors. Simulations of focusing were done using both SEMCAD and CST Studio commercial software. Reverberating cavity concept was used to analyze parameters and effectiveness of the spatial and temporal focusing.
IntroductionThe existing rf focusing methods such as annular phased array and ablation techniques, are either insufficient of sufficient focusing or invasive. In recent years, time-reversal (TR) technique [1], which strategy is based on the time-reversal invariance of EM waves, have been realized very efficiently inacoustics, wireless communication, underwater communications, sub-wavelength imaging. When applied to focus cancer heating, an EM waveform originating at an internal tumor site, leads to rather complex waveforms received by each of an array of antennas completely surrounding the body due to interactions with intervening tissue as shown in Fig. 1.Some simplification can be introduced when the system is enclosed in environment with highly reflecting and/or dispersing boundaries as shown in Fig. 2. First, a pulse is
transmitted from Port 1 and the response to the pulse, after going through multiple paths in the reverberating environment, is recorded at Port 2. The response signal, known as “sona”, which has all the information about the environment. The response signal is then time-reversed at Port 2 and transmitted back to Port 1, where a
Fig. 1. Multi-channel time-reversal problem in human body.
Fig. 2. Four step TR process in reverberating environment.
31

time-reversed signal of the original signal is reconstructed. Also most of the transmitted power will concentrate in exactly the same location at where the original source was located [2].
SimulationsSimulations have been done in SEMCAD and CST Studio, both of them are FDTD based electromagnetic simulators. The geometry for the reverberating environment with scatters and two antenna ports is shown in Fig. 3. Port 1 was mounted on the front side of the 3D gigabox and Port 2 was on the right side of the box so that there are multiple paths from Port 1 to Port 2generated by the scatters in the middle. Wetransmitted a 300 ps Gaussian pulse, carrier frequency of 2.2 GHz, from Port 1, recording the response at Port 2 for a simulation time T = 400 ns. The response signal was then time-reversed and transmitted back to Port 1 to examine the temporal and spatial focusing.
Results and ConclusionWe have investigated two cases of focusing arrangement, the first one when a virtual antenna is inserted into a tumor, and the second one when the active antenna is outside of the body and passive nonlinear element is encoding the tumor position. The two commercial software packages gave the same results, showing very good temporal focusing as it is shown in Fig. 4, where power to noise ratio is approximately 13 dB.Using the time-reversal technique, we can have both temporal and spatial focusing of an active source in a reverberating environment. Also we can make TR a non-invasive
method by putting a passive nonlinear element in the system.The new frequency componentsgenerated by the nonlinear element will act the same as an active source and focusing was measured at the place where the nonlinear element was inserted.
References[1] D. Cassereau and M. Fink, "Time-reversal of ultrasonic fields. III. Theory of the closed time-reversal cavity," IEEE Trans Ultrason Ferroelectr Freq Control, vol. 39, pp. 579-92, 1992.[2] G. Lerosey, J. de Rosny, A. Tourin, A. Derode, G. Montaldo, and M. Fink, "Time Reversal of Electromagnetic Waves," Physical Review Letters, vol. 92, p. 193904, May 1, 2004.
Fig. 3. A sketch of the reverberating box with scatters. The source antenna and TR mirror antenna are marked.
Fig. 4. Simulation results for temporal focusing: (a) original signal; (b) reconstructed signal in SEMCAD; (c) reconstructed signal in CST Studio.
32

WIDEBAND LNA WITH 1.9 DB NOISE FIGURE IN 0.18 M CMOS FOR HIGH FREQUENCY ULTRASOUND IMAGING APPLICATIONS
Yuxuan Tang, Yulang Feng, Zhiheng Zuo, Qingjun Fan and Jinghong ChenDepartment of Electrical and Computer Engineering
University of HoustonHouston, TX 77204-4005
Abstract
A receiver front-end circuit for wideband high-frequency ultrasound transducer applications is presented. The receiver is specifically designed for polyvinylidene fluoride (PVDF) ultrasound transducer imaging with a typical signal bandwidth of 10-60 MHz. To achieve both low noise figure (NF) and good impedance matching (S11) performance, a noise and nonlinearity canceling technique is utilized in the LNA. The front end is designed in 0.18 m CMOS technology. Simulation results show the LNA achieves 1.9 dB NFmin, 24 dB voltage gain, and the whole receiver front end achieves 62 dB voltage gain, 60 MHz 3-dB bandwidth and 2.2-3 dB NF.
Introduction
The demand for wideband high frequency (> 20 MHz) ultrasound imaging system is ever increasing. Such imaging systems provide better spatial resolution for ophthalmology, dermatology, and intravascular applications [1]. In ultrasound imaging front end, the LNA can be implemented as either a charge sensing amplifier or a voltage amplifier. Charge sensing LNA [2] often offers better noise performance. However, it is more sensitive to parasitic capacitance at the interconnect resulting from the bond wires and I/O pads. Recently, voltage mode amplifiers employing noise and nonlinearity canceling techniques [3-5] have been developed to achieve both robust design and better noise performance. Reference [3] proposes an LNA structure utilizing a combination of a common gate amplifier (CG) with a common source amplifier (CS) for noise canceling (NC), and achieves 2.98 dB NF. However, this structure is prone to gain mismatch between the CG and CS stages. Reference [4]proposes a feedforward noise canceling technique for designing radio frequency LNAs achieving a NF of 2 dB from 2 MHz to 1.6 GHz. The core of the LNA is a resistive shunt feedback amplifier that incorporates an auxiliary amplifier for carrying out noise and nonlinearity cancellation. Apart from canceling the noise, voltage gain of the LNA can be also enhanced due to the feed-forward path.In this project, we investigate the feedforward noise-canceling technique in designing LNAs for wideband high-frequency ultrasound imaging systems. In addition to the noise-cancelling LNA, a PVDF ultrasound imaging receiver front end, including the proposed LNA, a variable gain amplifier and a low-pass filer, is also developed.
Feedforward Noise-canceling Technique
Fig. 1 shows the schematic diagram of the feedforward noise canceling. The thermal noise of transistor M1 in the shunt-feedback/matching amplifier can be referred to its Gate (node X), and will be noninverting amplified by matching amplifier and inverting amplified by auxiliary amplifier. On the other hand, the signal Vs would be inverting amplified by both the two amplifiers. The opposite sign of the signal amplification and the noise amplification makes it achievable to cancel the noise while enhancing the signal
33

gain.
RL
Rs
Rf
M1Vs
Y
X
Matching Amplifier
-AauxZ
Vnoise
NoiseSignal
Auxiliary Amplifier
Vout
Fig. 1. Schematic diagram of feedforward noise-canceling
Simulation results
10Freq (MHz)
1100 1000
2
3
4
5
6
7
NF
(dB
)
w/o NC @ SSw/o NC @ TTw/o NC @ FF
w/ NC @ SSw/ NC @ TTw/ NC @ FF
Fig. 2. NFs comparison of the proposed LNA w/ and w/o noise canceling
The NFs of the LNA with and without noise cancelling are compared in Fig. 2. With noise cancelling, the NF is improved by 3 dB over PVTs. At typical corner, the NF is less than 1.9 dB from 30 to 670 MHz.
References
[1] C.H. Hu, K. A. Snook, P.J. Cao, and K. K. Shung, “High-frequency ultrasound annular array imaging. Part II: Digital beamformer design and imaging,” IEEE Trans. Ultrason. Ferroelectr. Freq. Control,vol. 53, no. 2, pp. 309–316, Feb. 2006.[2] P. Wang, T. Ytterdal, and T Halvorsrod, “A Low Noise Single-Ended to Differential Linear Charge Sampling SC-VGA for Second Harmonic Cardiac Ultrasound Imaging,” European Conference on Circuit Theory and Design (ECCTD), pp. 1-4, Sept. 2013.[3] J. Eriksrod, T. Ytterdal “A 65nm CMOS front-end LNA for medical ultrasound imaging with feedback employing noise and distortion cancellation,” European Conference on Circuit Theory and Design (ECCTD), pp. 1-4, Sept. 2013.[4] F. Bruccoleri, E.A.M. Klumperink, and B. Nauta, “Wide-band CMOS low-noise amplifier exploiting thermal noise canceling,” IEEE J. Solid-State Circuit, vol. 39, no.2, pp. 275-282, Feb. 2004.[5] Jian-Shou. Chen, Chin. Hsia, Chih-Wen. Lu and Yuan-Ho. Chen , “A Low Noise Amplifier Employing Noise Canceling Technique for Ultrasound System Applications”, International Symposium on Instrumentation & Measurement, Sensor Network and Automation (IMSNA), vol. 1, pp. 35-38, Aug. 2012.
34

BIO-IMPEDANCE SPECTROMETER FOR ELECTRICALCHARACTERIZATION OF MITOCHONDRIA
Uday Kiran Karlapudi1,2, Joe Charlson1 , Jarek Wosik1,2, Jinghong Chen1,and Wanda Zagozdzon-Wosik1
1 Department of Electrical and Computer Engineering,2Texas Center for Superconductivity,
University of Houston
Abstract
A portable bio impedance spectrometer was designed for electrical characterization of mitochondria. This spectrometer is developed to study the integrated response of mitochondria to changes in media substrates, uncouplers, and inhibitors and allows to find correlation with respiration states detected routinely by oxygen consumption. The goal is to enhance understanding of mitochondria dysfunction through information on the inner membrane potential. The spectrometer is equipped with a setup of miniaturized four-point probes to reduce polarization effects; they are especially detrimental in low frequency operation. In comparison to other impedance analyzers, our spectrometer is handheld and low cost. The circuitry has wide bandwidth of 100 Hz to 2MHz, and wide
. The 4-point impedance probe isdesigned to fit into Oxygraph 2K apparatus used for routine measurements ofmitochondria oxygen consumption. It allows both impedance and oxygen consumption to be measured simultaneously.
Introduction
Mitochondria in cells are double membrane structures separated by the intermembrane space, which encloses the mitochondrial matrix. The nonconductive (lipid) membranes show capacitive (C) behavior in parallel with resistance (R) representing more conductive intracellular spaces. The inner mitochondrial membrane (IMM), called cristae, is folded so its area, increases its capacitance, is much larger compared to the outer membrane (OM). Since generation of ATP and many vital mitochondrial functions depend on the inner ) it is a good marker for evaluation of mitochondria healthand energetic state or dysfunction. It can also be used to investigate the activity of the proton pump, electron transport system, and the state of mitochondrial permeability.
and reperfusion injury. Mitochondrial dysfunction has been linked to many diseases including diabetes, obesity, heart failure and aging. Information about the membrane potential can be derived from dielectric spectroscopy, where an applied electric field induces a voltage at the membrane and superimposes it onto the membrane restingvoltage (membrane potential), to be then correlated with specific mitochondrial dysfunction. By measuring Bio-Impedance over a wide range of frequencies, known as Bio Impedance Spectroscopy (BIS), we can access information about the inner membrane processes. Generally current ‘I’ is used as the excitation signal. The picked-up signal then is the voltage drop V' caused by this current I on the impedance Z' of the object. From ohms law, impedance is then calculated as Z'= V'/I.
Formatted
45

Design of Bio Impedance Spectrometer
In fig 2, the microcontroller is used to program AD9833 to generate different frequenxies from 100 Hz to 2MHz. The constant voltage from AD9833 is converted to costant current of 50nA by Voltage controlled current source. This constant AC curreis injected into bio-sample by two exterior electrodes of four point probe, while the innerelectrode pair is used for measuring voltage on bio-sample of impedance Z . The voltage that appears across the load Z' is then amplified by instrumentation amplifier IA1 (with a gain of |A1|) and outputs VZ', while the voltage across the sample resistance R is also amplified by instrumentation amplifier IA2 (with a gain of |A2|) and outputs VR'. The sample resistor must be non inductive and thus the voltage on R can be regarded as in phaseVZ' = |A1| (VIN+ - VIN-) = |A1| Z' IOUT'
Fig. 2: Block diagram of bio impedance spectroscopy
The input range of the phase gain detector is 600 V to 600 mV. To increase the range of measurements, we use a variable gain amplifier which is controlled by microcontroller.
Electrodes and Measurements
Four point probe electrode, for reduction of the polarization effect, built on an elongated rod is used as an impedance probe in Oxygraph. Measurements of impedance is done simultanously with the oxygen consumption by mitochoondria subjected to various biological agents such as uncouplers or inhibitors.
Fig. 3: The 4-point probe setup allows for insertion to Oxygraph.
References[1] Y. Yang and J. Wang, “A design of bio impedance spectrometer for early detection of pressure ulcer,” in 27th Annual International Conference of the Engineering in Medicine and Biology Society, 2005, 2005.
46
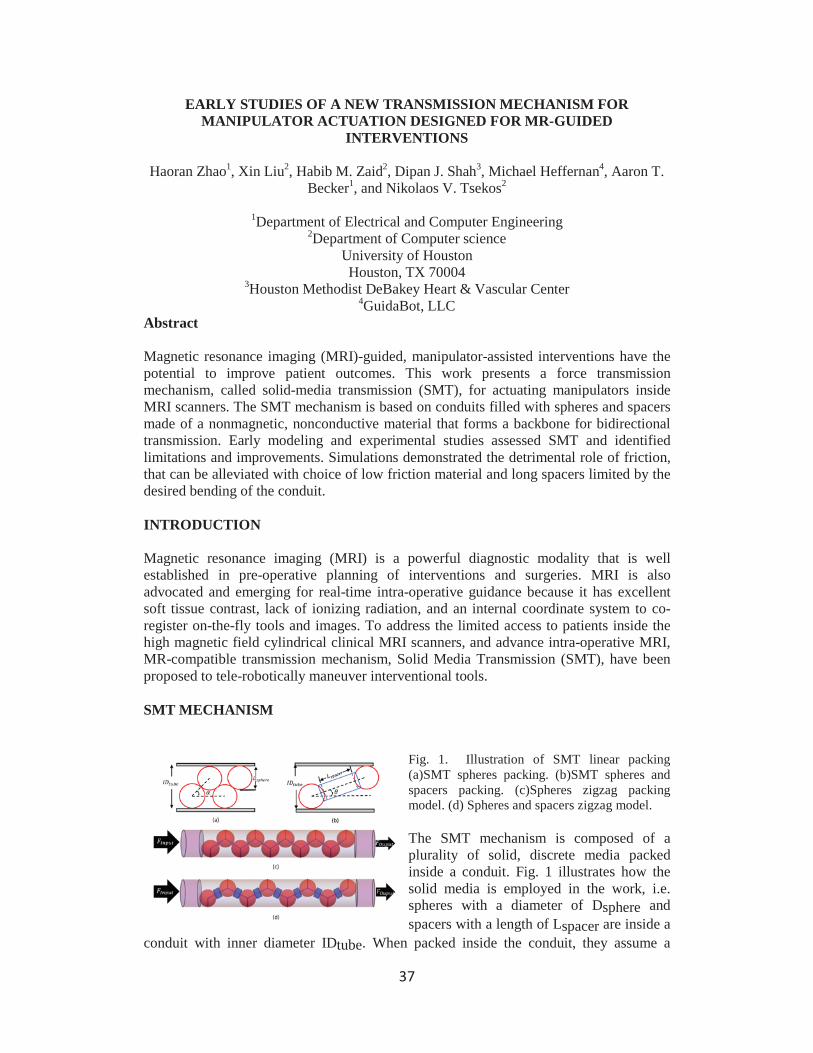
EARLY STUDIES OF A NEW TRANSMISSION MECHANISM FOR MANIPULATOR ACTUATION DESIGNED FOR MR-GUIDED
INTERVENTIONS
Haoran Zhao1, Xin Liu2, Habib M. Zaid2, Dipan J. Shah3, Michael Heffernan4, Aaron T. Becker1, and Nikolaos V. Tsekos2
1Department of Electrical and Computer Engineering2Department of Computer science
University of HoustonHouston, TX 70004
3Houston Methodist DeBakey Heart & Vascular Center4GuidaBot, LLC
Abstract
Magnetic resonance imaging (MRI)-guided, manipulator-assisted interventions have the potential to improve patient outcomes. This work presents a force transmission mechanism, called solid-media transmission (SMT), for actuating manipulators inside MRI scanners. The SMT mechanism is based on conduits filled with spheres and spacers made of a nonmagnetic, nonconductive material that forms a backbone for bidirectional transmission. Early modeling and experimental studies assessed SMT and identified limitations and improvements. Simulations demonstrated the detrimental role of friction, that can be alleviated with choice of low friction material and long spacers limited by the desired bending of the conduit.
INTRODUCTION
Magnetic resonance imaging (MRI) is a powerful diagnostic modality that is well established in pre-operative planning of interventions and surgeries. MRI is also advocated and emerging for real-time intra-operative guidance because it has excellent soft tissue contrast, lack of ionizing radiation, and an internal coordinate system to co-register on-the-fly tools and images. To address the limited access to patients inside the high magnetic field cylindrical clinical MRI scanners, and advance intra-operative MRI, MR-compatible transmission mechanism, Solid Media Transmission (SMT), have been proposed to tele-robotically maneuver interventional tools.
SMT MECHANISM
Fig. 1. Illustration of SMT linear packing (a)SMT spheres packing. (b)SMT spheres and spacers packing. (c)Spheres zigzag packing model. (d) Spheres and spacers zigzag model.
The SMT mechanism is composed of a plurality of solid, discrete media packed inside a conduit. Fig. 1 illustrates how the solid media is employed in the work, i.e. spheres with a diameter of Dsphere and spacers with a length of Lspacer are inside a
conduit with inner diameter IDtube. When packed inside the conduit, they assume a
37
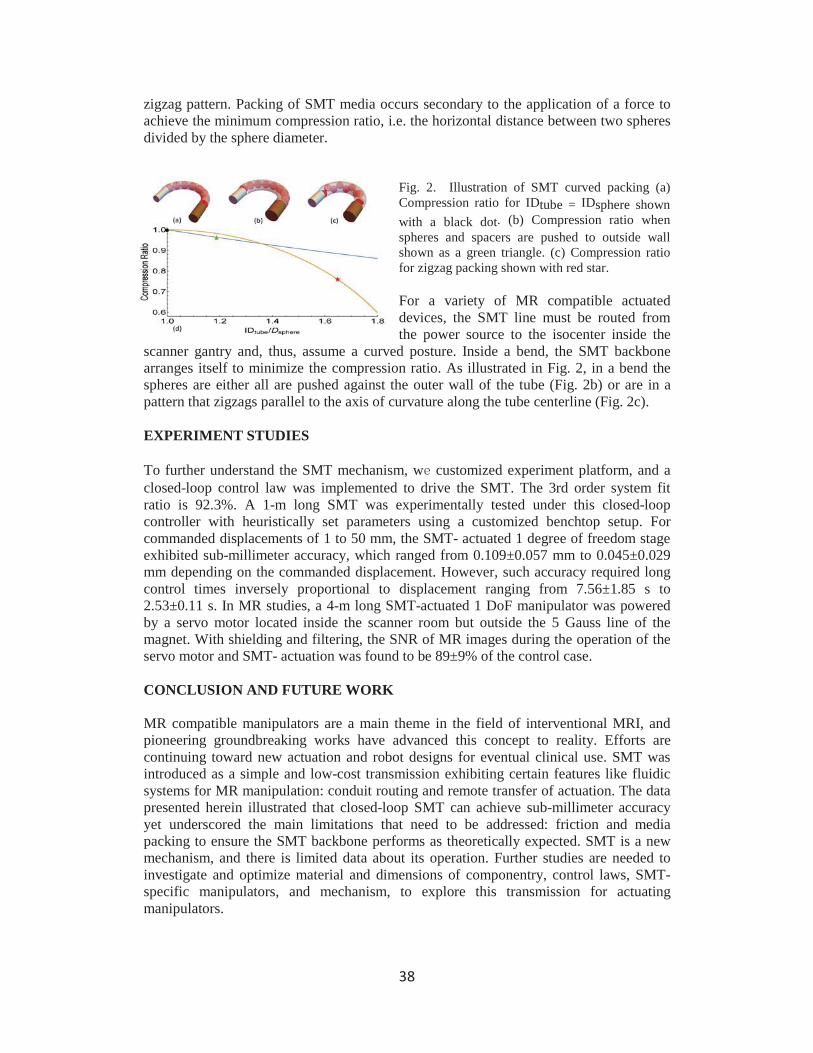
zigzag pattern. Packing of SMT media occurs secondary to the application of a force to achieve the minimum compression ratio, i.e. the horizontal distance between two spheres divided by the sphere diameter.
Fig. 2. Illustration of SMT curved packing (a)Compression ratio for IDtube = IDsphere shown with a black dot. (b) Compression ratio when spheres and spacers are pushed to outside wall shown as a green triangle. (c) Compression ratio for zigzag packing shown with red star.
For a variety of MR compatible actuated devices, the SMT line must be routed from the power source to the isocenter inside the
scanner gantry and, thus, assume a curved posture. Inside a bend, the SMT backbone arranges itself to minimize the compression ratio. As illustrated in Fig. 2, in a bend the spheres are either all are pushed against the outer wall of the tube (Fig. 2b) or are in a pattern that zigzags parallel to the axis of curvature along the tube centerline (Fig. 2c).
EXPERIMENT STUDIES
To further understand the SMT mechanism, w customized experiment platform, and aclosed-loop control law was implemented to drive the SMT. The 3rd order system fit ratio is 92.3%. A 1-m long SMT was experimentally tested under this closed-loop controller with heuristically set parameters using a customized benchtop setup. For commanded displacements of 1 to 50 mm, the SMT- actuated 1 degree of freedom stage exhibited sub-millimeter accuracy, which ranged from 0.109±0.057 mm to 0.045±0.029 mm depending on the commanded displacement. However, such accuracy required long control times inversely proportional to displacement ranging from 7.56±1.85 s to 2.53±0.11 s. In MR studies, a 4-m long SMT-actuated 1 DoF manipulator was powered by a servo motor located inside the scanner room but outside the 5 Gauss line of the magnet. With shielding and filtering, the SNR of MR images during the operation of the servo motor and SMT- actuation was found to be 89±9% of the control case.
CONCLUSION AND FUTURE WORK
MR compatible manipulators are a main theme in the field of interventional MRI, and pioneering groundbreaking works have advanced this concept to reality. Efforts are continuing toward new actuation and robot designs for eventual clinical use. SMT was introduced as a simple and low-cost transmission exhibiting certain features like fluidic systems for MR manipulation: conduit routing and remote transfer of actuation. The data presented herein illustrated that closed-loop SMT can achieve sub-millimeter accuracy yet underscored the main limitations that need to be addressed: friction and media packing to ensure the SMT backbone performs as theoretically expected. SMT is a new mechanism, and there is limited data about its operation. Further studies are needed to investigate and optimize material and dimensions of componentry, control laws, SMT-specific manipulators, and mechanism, to explore this transmission for actuating manipulators.
38

STIMULATED RAMAN HYPERSPECTRAL IMAGING BASED ON SPECTRAL SELECTION OF BROADBAND LASER PULSES
Jingting Li1 and Wei-Chuan Shih*,1,2,3
1Department of Electrical and Computer Engineering 2Department of Biomedical Engineering
3Department of Chemistry University of Houston
Houston, TX 77204-4005
Abstract
Stimulated Raman scattering (SRS) is a label-free noninvasive imaging technique for studying biological systems. By utilizing ultrafast laser pulses, SRS microscopy has the advantage of improved imaging speed compared to spontaneous Raman microscopy at the expense of reduced spectroscopic information. In this work, we show a femtosecond SRS microscope with a high speed dynamic micromirror device (DMD) based pulse shaper to achieve flexible and rapid frequency selection within the C-H stretch region near 2800 to 3100 cm-1. This technique will be applied to lipid profiling of biological material.
Introduction Coherent Raman scattering (CRS) microscopy have enabled the visualization and analysis of live biological samples where optical signals from molecular vibrations provide chemical contrast noninvasively and without fluorescent labeling. 1 High-speed CRS imaging is combined with spontaneous Raman spectral analysis proving the bands of interest in multiplex detection of CRS signals where the scanning of excitation wavelength forms a stack of spectrally resolved images.
Methods
The optical diagram is depicted in Fig. 1. The signal output from the OPO was used as the pump beam. The pump beam was directed into an in-house built grating-based pulse shaper, in which the beam is dispersed by a reflective grating, and collimated by an achromatic lens placed in a folded 4f geometry onto a digital micromirror device (DMD) (DLP9500, Texas Instruments). By moving the reflective area across the DMD, the spectral components of the pump beam can be scanned, therefore achieving spectral scanning. The depleted fundamental beam from the OPO served as the Stokes beam.
Figure 1. Optical diagram of the imaging system.
39

Results
First, we demonstrate SRS spectroscopy function in comparison with spontaneous Raman scattering. Pure dimethyl sulfoxide (DMSO) drop on a cover glass was used to test spectral scanning. The spectra acquired with the SRS system at 6 cm-1 spectral width per line pattern and a line-scan Raman microscope of 2.5 cm-1 resolution 2 are shown in Fig. 3(a), respectively. By choosing a center wavelength of the pump beam at 660 nm and the Stokes beam fixed at 820 nm, the spectral scanning range of the SRS microscope is 2800-3100 cm-1
, in which region the C-H stretching vibrations are strong and commonly used for lipidomics based on Raman spectroscopy. As shown in Fig. 3(a), two representative bands are resolved at 2920 and 3003 cm-1. The signal-to-noise ratio of the SRS spectrum could be improved by choosing DMD scan patterns with smaller spectral resolution, at the cost of longer overall acquisition time.
Next, we show the spatial scanning function performed with 10 m polystyrene (PS) beads on a cover glass. By selecting the Raman band at 2900 cm-1, the Galvo scanner
2 field of view. The scanning scheme consists of a fast axis where continuous voltage signals were input into the scanner for optimized speed and a slow axis for the step by step offset in the traverse direction of the fast axis. The bright-field image and the SRS spectral image of the PS beads are shown in Fig. 3(b-c), where the spectral image was acquired at a point scan rate of 200 Hz. The scanning rate should match the data transfer rate of the lock-in amplifier in order to avoid image distortion in the direction of the fast axis. However, the data transfer rate largely relies on the order of signal filtering of the lock-in amplifier, where higher orders of filtering outputs higher signal to noise ratio but requires longer response time.
Figure 3. (a) SRS and spontaneous Raman spectra of DMSO. (b-c) Bright-field image and SRS
References
1. Min, W.; Freudiger, C. W.; Lu, S.; Xie, X. S., Coherent nonlinear optical imaging: beyond fluorescence microscopy. Annu. Rev. Phys. Chem. 2011, 62, 507.2. Qi, J.; Shih, W. C., Performance of line-scan Raman microscopy for high-throughput chemical imaging of cell population. Applied optics 2014, 53 (13), 2881-5.
40

EXOSOME DETECTION WITH NANOPOROUS GOLD DISK VIA LOCALIZED SURFACE PLASMON RESONANCE SHIFT
N. Ngo1*, O. Zenasni2, and W. Shih1,2,3
1Materials Science and Engineering program2Department of Electrical and Computer Engineering
3Department of Chemistry
University of Houston
Houston, TX 77204-4005
Abstract
Exosomes are extracellular vesicles produced from cellular activities and carry information about their cell of origin which can serve as the target for cancer detection. Our research utilizes nanoporous gold disk (NPGD) to detect cancerous exosomes via the response of the localized surface plasmon resonance (LSPR) of the functionalized NPGD substrates.
Introduction
Early cancer detection is a crucial part for effective therapy and can significantly increase survival rate for cancer patients. Exosomes are membrane vesicles released by many cell types and can carry information about their cell of origin. This cellular specificity makes exosome a desirable target for cancer detection technology[1].
Plasmon is the collective oscillation of free electrons on the surface of metal materials with a characteristic frequency that depends on the size, morphology, composition of the materials and refractive index of the surrounding environment. Under the influence of incident electro-magnetic field with the same frequency as the plasmonic characteristic frequency, resonance happens and leads to enhanced scattering as well as absorption of the metal materials at that resonance frequency. This phenomenon is termed surface plasmon resonance (SPR). For nanoscale metallic nanostructures, the enhancement effect is localized around the nanostructure and, therefore, called localized surface plasmon resonance (LSPR). Any change in the ambient refractive index can cause a shift in the LSPR frequency.
In this research project, we use the nanoporous gold disk (NPGD) fabricated on a flat surface[2] as the template to capture and detect exosome via the change in the LSPR frequency caused by the capture of exosome onto the surface of NPGD.
41
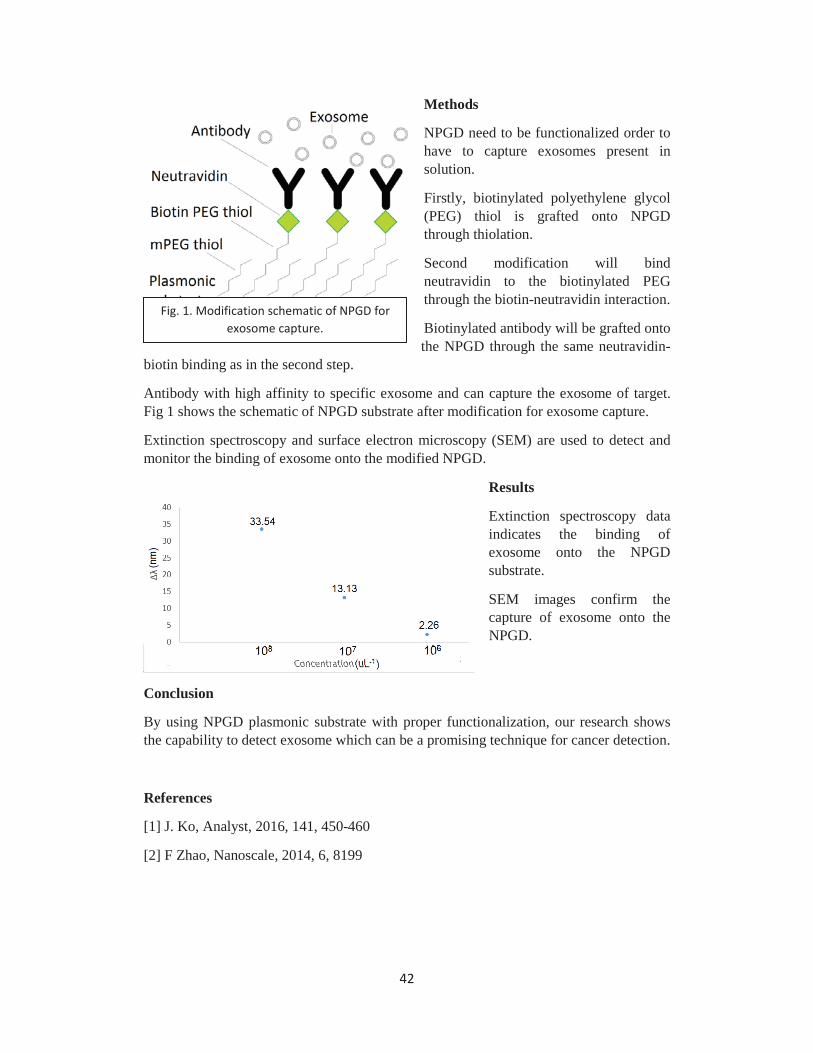
Methods
NPGD need to be functionalized order to have to capture exosomes present in solution.
Firstly, biotinylated polyethylene glycol (PEG) thiol is grafted onto NPGD through thiolation.
Second modification will bind neutravidin to the biotinylated PEGthrough the biotin-neutravidin interaction.
Biotinylated antibody will be grafted onto the NPGD through the same neutravidin-
biotin binding as in the second step.
Antibody with high affinity to specific exosome and can capture the exosome of target.Fig 1 shows the schematic of NPGD substrate after modification for exosome capture.
Extinction spectroscopy and surface electron microscopy (SEM) are used to detect and monitor the binding of exosome onto the modified NPGD.
Results
Extinction spectroscopy data indicates the binding of exosome onto the NPGD substrate.
SEM images confirm the capture of exosome onto the NPGD.
Conclusion
By using NPGD plasmonic substrate with proper functionalization, our research shows the capability to detect exosome which can be a promising technique for cancer detection.
References
[1] J. Ko, Analyst, 2016, 141, 450-460
[2] F Zhao, Nanoscale, 2014, 6, 8199
Fig. 1. Modification schematic of NPGD for exosome capture.
Fig. 2. LSPR shifts of NPGD with exosome concentrations
42
Fig. 2. LSPR shifts offfffffffff NPGDDDDDDDDDDDDDDDDDDDD wiwwwwiwiwiwiwwwiwiwwwiwiwwwwwwwiwwwiwiww ththththththththtththhththhththttthhhthttththhhtht eeeeeeeeeeeeeeeeeeeeeeeeeeexoxoxoxoxoxoxoxoxooxoxoxooxoxoxxooxooxoxoxoxxooxoxooosoooooooooooooooooooooooooooooosssssssssosssssoooossssoossooooosssoooomeeeemememeemememmmmmeeeeememeeemmmmmee concentrations

Physical Experiments for turn cost of Multicopter
An Nguyen1, Dominik Krupke2, Sándor Fekete2, Aaron T. Becker1
1 Department of Electrical and Computer Engineering,University of Houston
2Institute of Operating Systems and Computer Networks,TU Braunschweig
Abstract
Coverage algorithm is a well researched area in path planning. However, most technique focus only on distance cost, but ignore turn cost, which is significant. Introducing turn cost significantly increases computation time. Planning a coverage path accounting for turn cost is of interest to UAV flying in obstacle filled environments, or in missions where certain sub-areas are of higher interest than the rest. In collaboration with our colleagues in Germany, we perform experiments to record the energy turn cost of a multicopter in 90o and 180o turns. We then use these turn cost in a coverage algorithm, and evaluated the resulting path to show that they are shorter and less energy intensive then conventional multicopter coverage methods.
Introduction
Coverage path planning is a well researched problem with many applications in robotics. Cleaning (vacuuming) robot such as the iRobot Roomba rely on these algorithm to ensure that they cover as much area as possible before running out of battery. Our interest for this area concerns with planning a coverage path for an autonomous unmanned aerial vehicle (UAV) equipped with an electrified net to eliminate and take survey of the mosquito population in the area, see Fig. 1. However, existing methods focus on minimizing distance traveled, with minimal attention to the cost of turning the robot.In [1], Krupke et al. examined different algorithms and heuristics for planning a coverage path while accounting for turn cost. Realistic data for the energy used during the turns are needed, however. In this paper, we will measure the actual energy used while the UAV changes traveling direction, compared to a straight line path. Addtionally, with the turn cost obtained, we will use (one or more of the methods listed) to generate a flight plan to verify their algorithms.
Experiment Set up
To measure the energy cost, we use a Raspberry Pi with an ADC logging chip to log the voltage accross and current through the battery of our hexacopter during flight. The current and voltage are converted to 5V voltage level using a 180A AttoPilot power sensing module. This log can then be synchronized with the GPS log recorded by our hexacopter during the flight. See Fig. 3 for a size comparision and mounting position of
Fig. 1: Mosquito net attached to our UAV
43
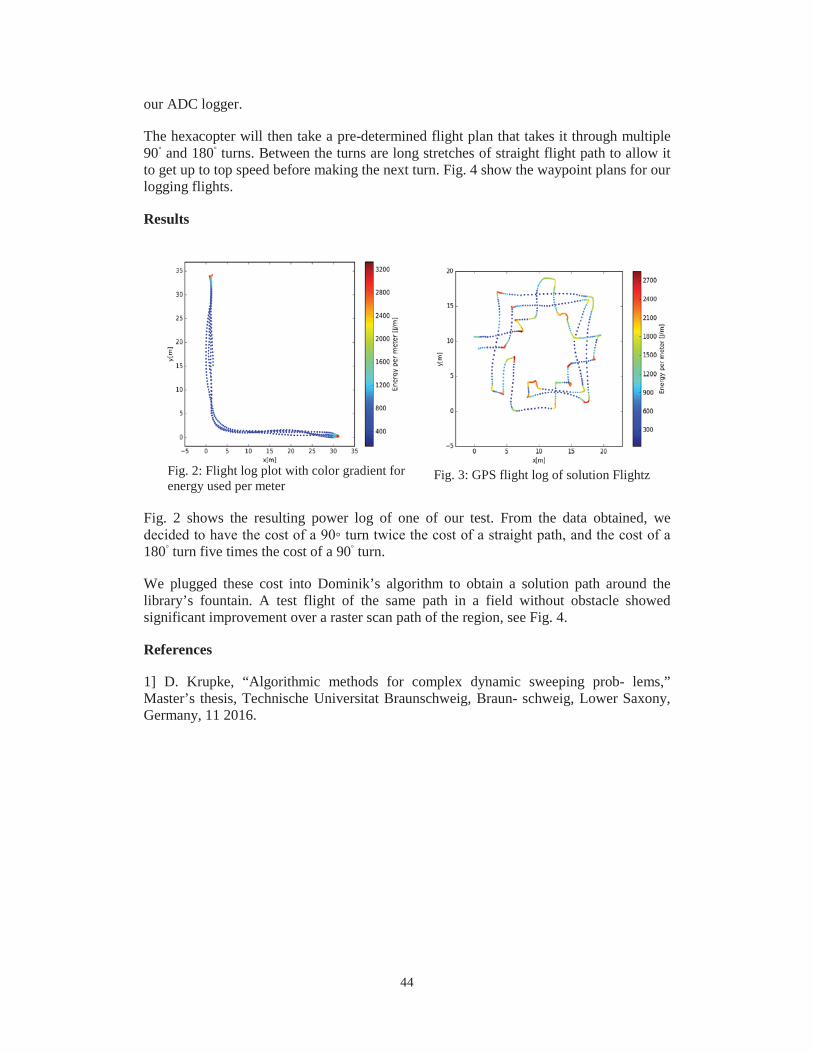
our ADC logger.
The hexacopter will then take a pre-determined flight plan that takes it through multiple 90 and 180 turns. Between the turns are long stretches of straight flight path to allow it to get up to top speed before making the next turn. Fig. 4 show the waypoint plans for our logging flights.
Results
Fig. 2 shows the resulting power log of one of our test. From the data obtained, we
180 turn five times the cost of a 90 turn.
We plugged these cost into Dominik’s algorithm to obtain a solution path around the library’s fountain. A test flight of the same path in a field without obstacle showed significant improvement over a raster scan path of the region, see Fig. 4.
References
1] D. Krupke, “Algorithmic methods for complex dynamic sweeping prob- lems,” Master’s thesis, Technische Universitat Braunschweig, Braun- schweig, Lower Saxony, Germany, 11 2016.
Fig. 2: Flight log plot with color gradient for energy used per meter
Fig. 3: GPS flight log of solution Flightz
44

Development Of Multi-Contact Probes With Thin Film Conductor Wiring On Optical Fiber Substrates
Tamanna Afrin Tisa1, Apeksha Awale1, Mufaddal Gheewala1, Pratik Motwani1, Rebecca Kusko1, Madhuri Manjunath1, Venu Jonnalagadda1, Navjot Randhawa1, Gopathy
Purushothaman2, John Dani3 Wei-Chuan Shih1, John Wolfe1
1 Electrical & Computer Engineering, University of Houston, Houston, Tx 770042 Parallon (HCA, Inc), Franklin TN 37067
3 Department of Neuroscience, University of Pennsylvania, Philadelphia
Abstract
Lithography for forming micron-scale integrated structures on optical fibers requires a) a conformal resist process, b) a large depth-of-field, and c) a technique for registering the layers of the device. Our approach uses ion beam proximity lithography, where a broad beam of energetic light ions illuminates a stencil mask and transmitted beamlets transfer the mask pattern to resist on fiber. After fabricating the probes, comparisons were made between the impedance spectrum of a single gold electrode as-manufactured and after 3 week life test. High quality recordings of photostimulated neural activity were acquired in the primary visual cortex of a bush baby.
Introduction
The function of a neuron depends on its microcircuitry – the inputs it receives from local and long-range connections and the outputs it sends to other neurons [1]. Mapping these connections is typically done by stimulating a population of neurons chemically, electrically, or optically, and recording the induced extracellular action potentials using implanted neural probes [2, 3]. Optogenetics uses genetic manipulation to insert opsin-containing ion channels into a target population of neurons. Then, light can be used to optically stimulate and/or silence spiking activity with very high cellular specificity and spatio-temporal resolution. In this paper, we discuss the fabrication of a novel multi-contact neural probe with integrated, thin film conductor and dielectric coatings on the cylindrical surface of fine optical fibers. The use of optical fibers as probe substrateprovides high intensity, multi-spectral light delivery with essentially no coupling loss, as well as the strength and stiffness required for deep-brain applications.
Methods: Multi-electrode probe fabrication
The circuit has 2-layers; a) a conductor layer containing the electrode pads and the thin-film traces which connect them to the electronics interface, and b) an insulating layer with openings or vias where the pads make electrical contact to cerebro-spinal fluid. Our approach uses ion beam proximity lithography, where a broad beam of energetic light ions illuminates a stencil mask and transmitted beamlets transfer the mask pattern to resist on a fiber. Mask-to-fiber alignment is accomplished using a micromachined silicon-jig formed by two families of intersecting V-grooves anisotropically etched into opposite sides of a silicon wafer (100). The window formed by the intersection of the top and bottom grooves defines the width of the resist line. Metal lines are formed by DC-magnetron sputtering and ion milling. The cross-linked resist that remains after the last lithography step forms the protective, insulating jacket of the finished probe. Probes have been fabricated on 50 m, 65 m and
45
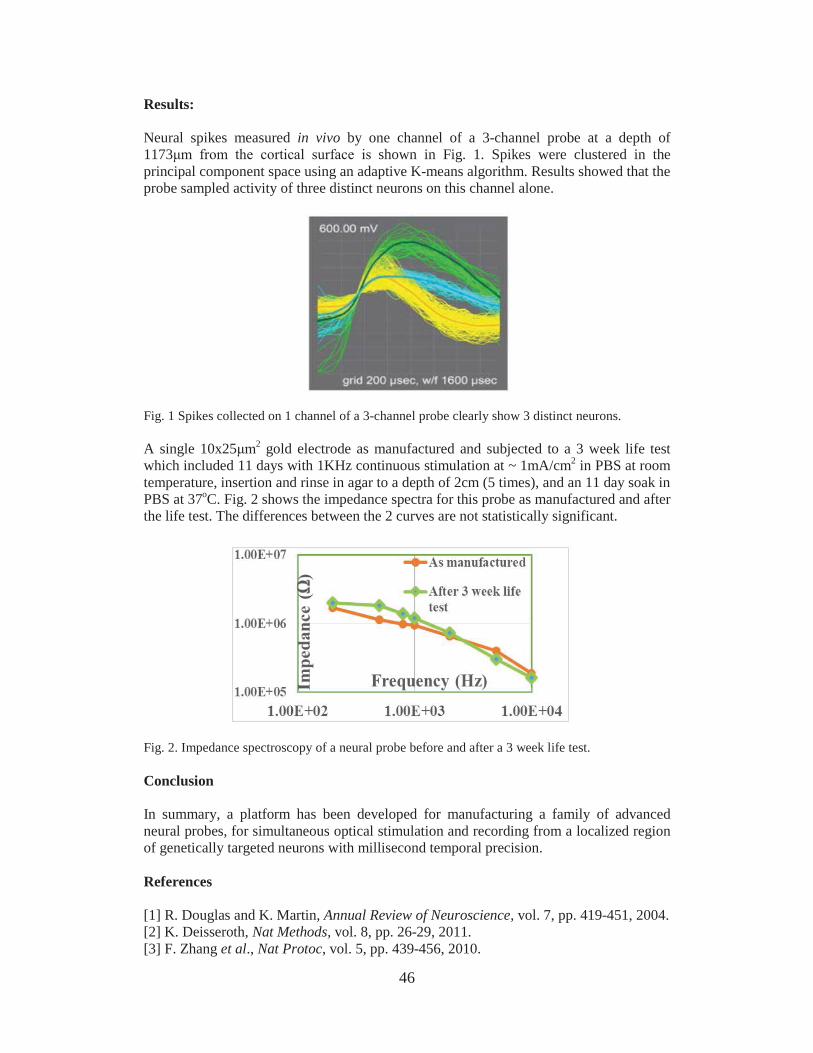
Results:
Neural spikes measured in vivo by one channel of a 3-channel probe at a depth of 1173 shown in Fig. 1. Spikes were clustered in the principal component space using an adaptive K-means algorithm. Results showed that the probe sampled activity of three distinct neurons on this channel alone.
Fig. 1 Spikes collected on 1 channel of a 3-channel probe clearly show 3 distinct neurons.
A single 10x25 2 gold electrode as manufactured and subjected to a 3 week life test which included 11 days with 1KHz continuous stimulation at ~ 1mA/cm2 in PBS at room temperature, insertion and rinse in agar to a depth of 2cm (5 times), and an 11 day soak in PBS at 37oC. Fig. 2 shows the impedance spectra for this probe as manufactured and after the life test. The differences between the 2 curves are not statistically significant.
Fig. 2. Impedance spectroscopy of a neural probe before and after a 3 week life test.
Conclusion
In summary, a platform has been developed for manufacturing a family of advanced neural probes, for simultaneous optical stimulation and recording from a localized region of genetically targeted neurons with millisecond temporal precision.
References
[1] R. Douglas and K. Martin, Annual Review of Neuroscience, vol. 7, pp. 419-451, 2004.[2] K. Deisseroth, Nat Methods, vol. 8, pp. 26-29, 2011.[3] F. Zhang et al., Nat Protoc, vol. 5, pp. 439-456, 2010.
46

DEVELOPMENT OF REUSABLE, FLEXIBLE ELECTROSTATIC LENSES FOR NANOPANTOGRAPHY
Prithvi Basu1*, Ryan Sawadichai2, Ya Ming2, Vincent M. Donnelly2,Demetre J. Economou2 and Paul Ruchhoeft1
1 Department of Electrical and Computer Engineering2 Department of Chemical and Biomolecular Engineering
University of HoustonHouston, TX 77204-4005
Abstract
Nanopantography is a method for forming nano-sized patterns simultaneously over large areas. In this process, a broad beam of ions is extracted from a source and drifts towards an array of micron-scale electrostatic lenses. When a DC voltage is applied to the lens electrode, the ions entering each lens converge to a small focal point on the substrate. This spot size is about 100 times smaller than the diameter of the lens opening and 3nm trenches have been successfully etched into silicon using this technique [1]. By controlling the tilt of the substrate with respect to the ion beam, the focused ion spots move across the surface and can be used to write a desired pattern in parallel over the entire substrate.
Introduction
One of the challenges with this method is that the lens array must first be manufactured on a silicon wafer, which increases the cost of the process and limits the types of materials that can be patterned. To overcome this limitation, we are developing removable and reusable electrostatic lens arrays which are capable of writing nanopatterns not only on a silicon substrate but also on 2-D materials, such as graphene. The electrostatic lenses developed in this work are made from free standing membranes that are similar to stencil masks. The SU-8 membranes are typically 1cm × 1cm in size and one micron thick, and are supported by an acrylic frame. A 30nm thick gold film on the membrane surface is used as the conducting electrode. For the initial development, the lens array consists of 1 m diameter circles (etched openings) on a 2 m pitch. When the DC voltage of about 100 volts is applied, lens structure clamps to the silicon wafer and the spacing can be controlled with great precision. The force that clamps down the lens is approximately calculated to be around 0.50 atmospheres.
Method
In the first step we are printing the lens patterns on PMMA with a proximity printer (atom beam lithography). After patterning and developing, the acrylic frame is bonded and the lenses are processed by an argon milling step to transfer the patterns through a copper-gold bilayer and a reactive ion etch step in fluorine plasma to etch the features through 1 m thick SU-8. Next, the conducting epoxy is filled in the 1mm frame holes in order to provide an electrical connection for the electrostatic chucking and finally the SU-8 membranes are released in TMAH solution. The process flow diagram of the lens fabrication steps is given in Figure 1.
47

Figure 1: Process flow diagram of SU-8 lens fabrication
Results
The SEM image of a 1 m lens opening and a SU-8 lens structure is given in Figure 2.
(a) (b)
Figure 2: (a) SEM image of 1 m lens openings and (b) Image of SU-8 lens structure
References
[1] Siyuan Tian, Vincent M. Donnelly, Paul Ruchhoeft, and Demetre J. Economou, “Sub-10 nm nanopantography,” Appl. Phys. Lett., vol. 107, pp. 193109(2)- 193109(4), Nov. 2015.[2] Siyuan Tian, Vincent M. Donnelly, and Demetre J. Economou, “Transfer of nanopantography-defined patterns using highly selective plasma etching,” Journal of Vacuum Science & Technology B., vol. 33, pp. 030602-1 - 030602-4, Apr. 2015.
48

GENERATING SYNTHETIC MICROVASCULAR MODEL FOR MICROFLUIDICS
Jiaming Guo1, Paul Ruchhoeft1, and David Mayerich1
1 Department of Electrical and Computer EngineeringUniversity of Houston
Houston, TX 77204-4005
Abstract
Recent innovations allow researchers to build 3D synthetic microvascular models from real images. Due to the complexity of the interconnected nature of the microvascular network, generating a complete subnetwork is impractical. Current simulations are therefore limited to small sub-segments of a tissue sample. There are two major properties of microvasculature: geometric structure and fluid flow. While a method of fabricating microfluidics devices from microvascular Images has been demonstrated [1,2], the resulting models do not exhibit the same flow characteristics of the original sample. We propose a method to accurately simulate fluid flow in these synthetic microvascular models.
Introduction
Generally, blood diseases and cancer alter the blood vessel through complex changes in the network, thus drastically impacting the hematologic system. For example, angiogenesis might change the blood flow thoroughly through individual connections and pressure changes. Incorporating these flow changes into microvascular is therefore critical for accurate modeling of tissue. In this paper, we propose an algorithm to accurately simulate fluid flow in both 2D and 3D case with both synthetic and realmicrovascular networks. In addition, we provide a tool to do real time visualization of the network flow characteristics.
Analysis
At the microscopic scale, the fluid Reynolds number drops significantly, makingviscosity the dominant force. Therefore, when modeling flow in microvascular networks,the nonlinear Navier-Stokes equations simplify into a linear form. In order to do verification, we provide a method to generate user-define synthetic connections between vessels while keeping the inner network constant. Finally, a modified mask is constructed that allows printing of a single microfluidics device that simulates both the structure and flow of an imaged network.
Methods
We employed fluid dynamics equations, including Bernoulli's Equation and Hagen-Poiseuille's Equation, to calculate pressure drop and hydraulic resistance. On solving the linear hydraulic circuit, we also employed circuit analysis techniques and rules, such asOhm's Law and Kirchhoff's Law, to facilitate flow analysis. On building synthetic connections between inlets and outlets, we introduced "pool" and "bus" source concepts and applied space filling curve algorithm to do automated connection.
Finally, we use GPU computing to calculate the flow dynamics in real-time and visualize
49

the network and its flow properties using OpenGL. Furthermore, the calculation of volume flow rate and distance field include a significant amount of computation, making it generally impractical using a single thread. However, these calculations can be highly parallelized by (a) computing the flow rate for each edge independently and (b) updating the distance field for each pixel independently.
Results
Fig. 1. (Left) 2D flow simulation result. Brewer colormapping for visualizing velocity difference. (Right) 3D flow simulation result.
Fig. 2. 3D synthetic connection between inlets and outlets using Hilbert curve.
References[1] Heintz, K. A., Bregenzer, M. E., Mantle, J. L., Lee, K. H., West, J. L., Slater, J. H. Fabrication of 3D Biomimetic Microfluidic Networks in Hydrogels. Adv. Healthc. Mater.(2016).[2] Heintz, K. A., Mayerich, D., Slater, J. H. Image-guided, Laser-based Fabrication of Vascular-derived Microfluidic Networks. J Vis Exp. 2017 Jan 3 ; (119).
50

PATH PLANNING AND AGGREGATION FOR A MICROROBOT SWARM IN VASCULAR NETWORKS USING A GLOBAL INPUT
Li Huang1, Louis Rogowski2, Min Jun Kim2, and Aaron T. Becker1
1 Department of Electrical and Computer Engineering, University of Houston2 Department of Mechanical Engineering, Southern Methodist University
Abstract
Microrobots have great potential for non-invasive surgery applications. Motivated by studies proposing MRI-guided drug delivery to tumor cells using magnetic micro carriers, this paper studies two major challenges of this problem: microrobot swarm trajectory generation and swarm aggregation using a global input. We propose an augmented RRT for trajectory generation to reduce environment interference, and a divide-and-conquer algorithm for swarm aggregation to improve performance. Simulations demonstrate the utility of these approaches in comparison to alternate heuristics. Our trajectory generation and aggregation strategies are implemented on a swarm of ferromagnetic microparticles in oil using a 6-coil electromagnetic system with image feedback.
Introduction
Microrobots have great potential to be used in noninvasive surgery for drug delivery. Traditional drug delivery circulates the human body indiscriminatingly, which is why chemotherapy kills healthy and tumor cells alike. To reduce toxic drug exposure to healthy cells, targeted drug delivery seeks to steer chemotherapy directly to diseased tissue. Many methods for drug delivery have been explored, including beaded delivery formulations, liposomal delivery systems, encapsulated chemotherapy in nanoparticles, and magnetic micro-carriers navigated by magnetic fields.
Swarm Path Planning
We introduce an obstacle-weighted rapidly-exploring random tree (RRT) planner to explore the environment, and discover collision-free routes to the goal location.
Fig. 1. (a) RRT (original): yellow dots are configurations of RRT, and red dots are abandoned extensions within the blue obstacle. Trajectory generation relies on the shortest paths to the goal. (b) Obstacle-weighted RRT: green dots are near-medial-axis configurations, yellow dots in the shadow are tree nodes affected by obstacles, and red dots inside the obstacle are retracted to the boundary (black dots). New paths tend to avoid near-obstacle regions, and approach near-medial-axis space.
51
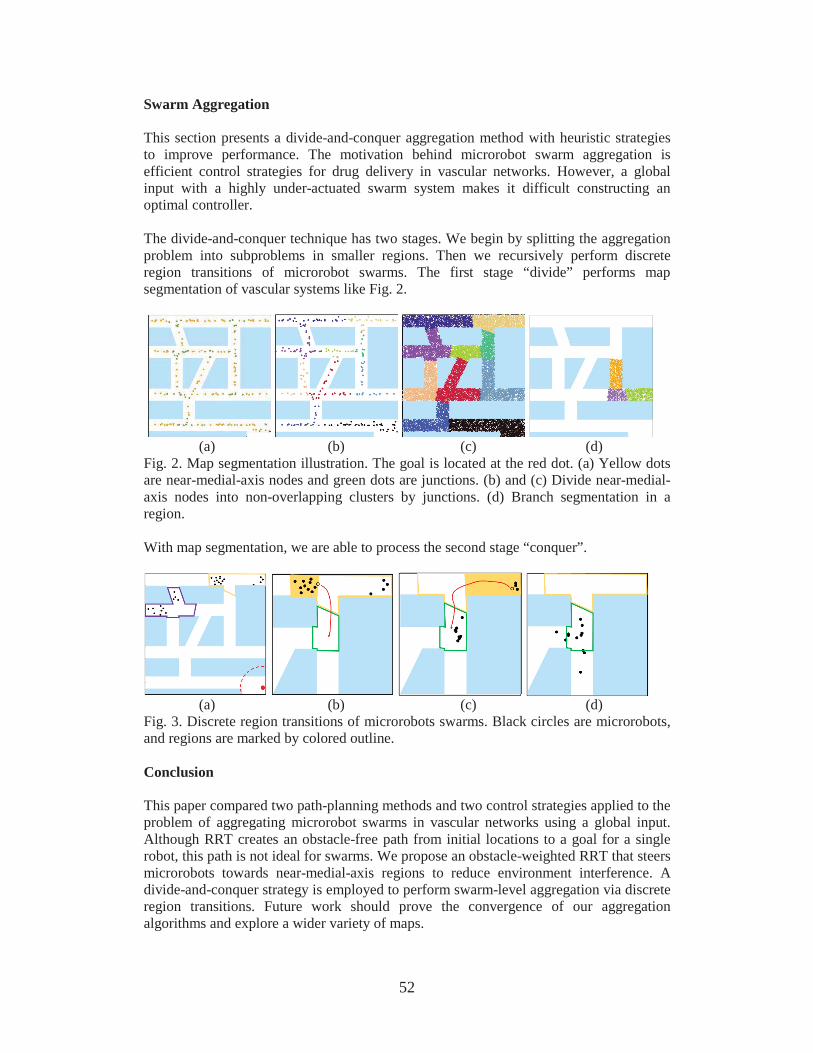
Swarm Aggregation
This section presents a divide-and-conquer aggregation method with heuristic strategies to improve performance. The motivation behind microrobot swarm aggregation is efficient control strategies for drug delivery in vascular networks. However, a global input with a highly under-actuated swarm system makes it difficult constructing an optimal controller.
The divide-and-conquer technique has two stages. We begin by splitting the aggregation problem into subproblems in smaller regions. Then we recursively perform discrete region transitions of microrobot swarms. The first stage “divide” performs map segmentation of vascular systems like Fig. 2.
(a) (b) (c) (d)Fig. 2. Map segmentation illustration. The goal is located at the red dot. (a) Yellow dotsare near-medial-axis nodes and green dots are junctions. (b) and (c) Divide near-medial-axis nodes into non-overlapping clusters by junctions. (d) Branch segmentation in a region.
With map segmentation, we are able to process the second stage “conquer”.
(a) (b) (c) (d)Fig. 3. Discrete region transitions of microrobots swarms. Black circles are microrobots, and regions are marked by colored outline.
Conclusion
This paper compared two path-planning methods and two control strategies applied to the problem of aggregating microrobot swarms in vascular networks using a global input. Although RRT creates an obstacle-free path from initial locations to a goal for a single robot, this path is not ideal for swarms. We propose an obstacle-weighted RRT that steers microrobots towards near-medial-axis regions to reduce environment interference. A divide-and-conquer strategy is employed to perform swarm-level aggregation via discrete region transitions. Future work should prove the convergence of our aggregation algorithms and explore a wider variety of maps.
52

PARALLEL SELF-ASSEMBLY UNDER UNIFORM CONTROL INPUTS
Sheryl Manzoor1, Samuel Sheckman2, Jarrett Lonsford1, Hoyeon Kim2, Minjun Kim2, and Aaron T. Becker1
1 Department of Electrical and Computer EngineeringUniversity of Houston
Houston, TX 77204-40052 Lyle School of Engineering
Southern Methodist UniversityDallas, TX 75205
Abstract
This work presents fundamental progress on parallel self-assembly, controlled by a uniform global, external force. Consider a 2D grid world, in which all obstacles and particles are unit squares, and for each actuation, robots move maximally until they collide with an obstacle or another robot. The presented algorithm designs an obstacle layout which generates copies of the input 2D structure when actuated. We analyze spatial and time complexity of the factory layouts. We present hardware results on both a macro-scale, gravity-based system and a milli-scale, magnetically actuated system.
Introduction
One of the exciting new directions of robotics is the design and development of micro-and nanorobot systems, with the goal of letting a massive swarm of robots perform complex operations in a complicated environment. Due to scaling issues, individual control of the involved robots becomes physically impossible therefore, current micro and nanorobot systems with many robots are steered and directed by an external force that acts as a common control signal.
The ability to create microrobots, and control algorithms capable of autonomous manipulation and assembly of small scale components into functional materials is currently a major manufacturing challenge. Recently, some groups have begun to develop cell safe magnetically actuated micro robotic systems for cell patterning, yet their methodis limited in that these systems are manually controlled, not automated, and suffer from low spatial resolution. In this paper, we seek to combine the use of microscale hybrid organic/inorganic actuators along with novel swarm control algorithms for mask free programmable patterning and micro-assembly. Specifically, this paper applies swarm control and particle logic computations to magnetically actuate artificial cells, to use them as micro-scale robotic swarms that create complex, high resolution, 2D patterns and assemblies.
Method
We have designed factories that build arbitrary-shaped 2D polyominoes. A polyomino is a 2D geometric figure formed by joining one or more equal squares edge to edge. Polyominoes have four-point connectivity. We first assign species to individual tiles of the polyomino, second discover a build path, and finally build an assembly line of factory components that each add one tile to a partially assembled polyomino and pass the polyomino to the next component.
53

Experiments
To demonstrate parallel self-assembly, we developed two platforms at two size scales, a centimeter scale demonstration board using gravity as the external force and magnetic attraction between red and blue particles for assembly, and a microscale magnetic control stage with alginate micro-particles.
Fig. 1. (a) Parallel self-assembly on micro-scale: showing construction of a micro-robotic polyomino. (b) A seven-tile factory. Each particle is actuated simultaneously by the same global field. The factory is designed so each clockwise control input assembles another component.
References
[1] B. R. Donald, C. G. Levey, I. Paprotny, and D. Rus, “Planning and control for micro-assembly of structures composed of stress engineered MEMS microrobots,” The International Journal of Robotics Research, vol. 32, no. 2, pp. 218–246, 2013. [Online].Available: http://ijr.sagepub.com/content/32/2/218.abstract[2] P.-T. Chiang, J. Mielke, J. Godoy, J. M. Guerrero, L. B. Alemany, C. J. Villag´omez, A. Saywell, L. Grill, and J. M. Tour, “Toward a light-driven motorized Nano-car: Synthesis and initial imaging of singlemolecules,” ACS Nano, vol. 6, no. 1, pp. 592–597, Feb. 2011.[3] H.-W. Tung, D. R. Frutiger, S. Pan`e, and B. J. Nelson, “Polymer based wireless resonant magnetic microrobots,” in IEEE International Conference on Robotics and Automation, May 2012, pp. 715–720.
54

ALGORITHMS FOR SHAPING A PARTICLE SWARM WITH A SHARED CONTROL INPUT USING BOUNDARY INTERACTION
Shiva Shahrokhi, Arun Mahadev, and Aaron T. BeckerDepartment of Electrical and Computer Engineering
University of HoustonHouston, TX 77204-4005
Abstract
There are driving applications for large populations of tiny robots in robotics, biology, and chemistry. These robots often lack onboard computation, actuation, and communication. Instead, these particles carry some payload and the particle swarm is controlled by a shared, global control input such as a uniform magnetic gradient. This paper provides position control algorithms that only require interactions with the boundaries assuming particles in contact with the boundaries have zero velocity if the global control input pushes the particle into the wall. This paper provides a shortest-path algorithm for positioning a two-particle swarm, and a generalization to positioning an n-particle swarm.
Introduction
Particle swarms propelled by a global field, where each particle receives the same control input, are common in applied mathematics, biology, and computer graphics. As a current example, micro- and nano-robots can be manufactured in large numbers. Someday large swarms of robots will be remotely guided to assemble structures in parallel and through the human body to cure disease, heal tissue, and prevent infection. For each task, large numbers of micro robots are required to deliver sufficient payloads, but the small size of these robots makes it difficult to perform onboard computation. Instead, these robots are often controlled by a global, broadcast signal. The tiny robots themselves are often just rigid bodies, and it may be more accurate to define the system, consisting of particles, a global control field, and sensing, as the robot. Such systems are severely underactuated, having 2 degrees of freedom in the shared control input, but 2n degrees of freedom for the particle swarm. Techniques are needed that can handle this underactuation. In previous work, we showed that the 2D position of each particle in such a swarm is controllable if the workspace contains a single obstacle the size of one particle.
Positioning is a foundational capability for a robotic system, but requiring a single, small, rigid obstacle suspended in the middle of the workspace is often an unreasonable constraint, especially in 3D. This paper relaxes that constraint, and provides position control algorithms that only require interactions with the boundaries. We assume that particles in contact with the boundaries have zero velocity if the global control input pushes the particle into the wall.
Algorithm
Our algorithm uses wall-friction to arbitrarily position two robots in a rectangular workspace. Fig. 1 shows a Mathematica implementation of the algorithm.
Assume two robots are initialized at r1 and r2 with corresponding goal destinations g1 and g2. The solution is a best-first search algorithm that maintains a list of possible paths
55

(moves), sorted according to an admissible heuristic on path length. The algorithm works by expanding the path with the shortest estimated length. Expanding a path means either moving directly to the goal, or pushing one robot to a wall and adjusting the relative position of the other robot. As soon as the goal is reached, the algorithm returns this shortest path.
Fig. 1. Positioning particles that receive the same control inputs, but cannot move while a control input pushes them into a boundary. The shortest path consists of moving with some angle to the wall until the blue robot contacts the top wall, then moving the magenta robot until the particles reach the desired relative spacing, then moving both robots to the goal positions.
Conclusion
This paper presented techniques for controlling the position of a swarm of robots using uniform global inputs and interaction with boundary friction forces. The paper provided algorithms for precise position control, as well as robust and efficient covariance control. Extending algorithms 1 and 3 to 3D is straightforward but increases the complexity. Addition- ally, this paper assumed friction was sufficient to completely stop particles in contact with the boundary. The algorithms require retooling to handle small friction coefficients. The algorithms assumed a rectangular workspace. This is a reasonable assumption for artificial environments, but in vivo environments are curved. A best-first search program could still work, but it cannot take advantage of the 4-fold rotational symmetry as in a rectangular environment.
56

MAXIMIZING SWARM COVERAGE:HUNTING FOR MEMBERS OF A MOVING POPULATION
Mary C. Burbage* and Aaron T. BeckerDepartment of Electrical and Computer Engineering
University of HoustonHouston, TX 77204-4005
Abstract
We explore search methods for finding and removing members of a large population of mobile particles in two different environments. One environment is bounded with walls that retain a portion of the swarm, and the other attracts the particles into a normal distribution at the center of the space. We treat particle motion as a Markov process and test six different search patterns with several parameter variations. We find that a two-step greedy algorithm has the best performance in all cases but second best performance varies with the parameters of the swarm and the search.
Introduction
We consider the problem of planning a coverage path for a robot such that it encounters each member of a population of mobile particles in a workspace. Once each particle is encountered, it is removed from the population. For stationary particles and unconstrained time, any path that visits every location in the workspace will cover the entire population in a single pass [1, 2]. When the particles are mobile, they may move while the robot moves, possibly moving into space that has already been covered. For unconstrained time, full spatial coverage is still satisfactory because it can be repeated until the robot has encountered every particle. What we seek is the best path for covering a population of mobile particles when the time is so limited that the whole workspace cannot be covered.
Methods
We build two environments: (1) a walled environment that starts with a uniform distribution with uniform transition probabilities except in the cells along the walls, which have a lower probability of moving away from the walls and back into the interior of the space ("sticky walls") and (2) an unbounded environment with something attractive in the center that causes the swarm to form a normal distribution around it. We treat the movement of the particle swarm as a Markov process [3], using transition matrices to hold the probabilities for particles moving from one cell of the workspace to another. We calculate these transition matrices directly from the movement of the particles for environment 1 and from the desired stationary distribution for environment 2. Fig. 1shows the stationary distributions of the two environments.
We test six path-planning methods. Sketches of these are shown in Fig. 2. The Wall-Following, Lawn-Mowing, Hybrid, and Square Spiral paths are pre-planned before the robot begins searching and run as indicated by the arrows in the diagrams. The 1- and 2-Step Greedy plans use sensing feedback to select the most rewarding move looking forward either one or two moves, respectively. For the particle motion, we build a Markov process. We then simulate the paths with variations in particle speed, wall stickiness, distribution standard deviation, robot speed, and search time.
57
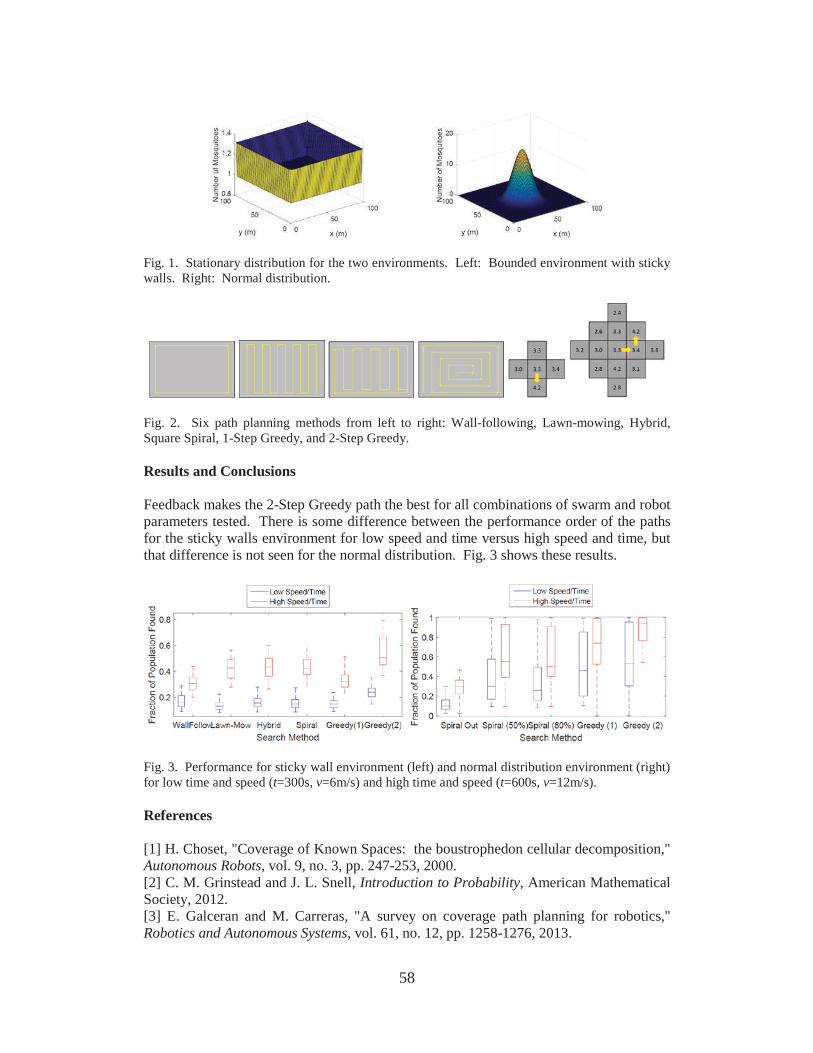
Fig. 1. Stationary distribution for the two environments. Left: Bounded environment with sticky walls. Right: Normal distribution.
Fig. 2. Six path planning methods from left to right: Wall-following, Lawn-mowing, Hybrid, Square Spiral, 1-Step Greedy, and 2-Step Greedy.
Results and Conclusions
Feedback makes the 2-Step Greedy path the best for all combinations of swarm and robot parameters tested. There is some difference between the performance order of the paths for the sticky walls environment for low speed and time versus high speed and time, but that difference is not seen for the normal distribution. Fig. 3 shows these results.
Fig. 3. Performance for sticky wall environment (left) and normal distribution environment (right) for low time and speed (t=300s, v=6m/s) and high time and speed (t=600s, v=12m/s).
References
[1] H. Choset, "Coverage of Known Spaces: the boustrophedon cellular decomposition," Autonomous Robots, vol. 9, no. 3, pp. 247-253, 2000.[2] C. M. Grinstead and J. L. Snell, Introduction to Probability, American Mathematical Society, 2012.[3] E. Galceran and M. Carreras, "A survey on coverage path planning for robotics," Robotics and Autonomous Systems, vol. 61, no. 12, pp. 1258-1276, 2013.
58

GLOBALLY CONTROLLED SWARM FOR MULT-ROBOT COVERAGE
Arun V. Mahadev 1*, Dominik Krupke 2 , S´andor P. Fekete2, Aaron T. Becker1
1 Department of Electrical and Computer EngineeringUniversity of Houston
Houston, TX 77204-40052 Dept. of Computer Science
TU BraunschweigM¨uhlenpfordtstr.23, 38106 Braunschweig, Germany
Abstract
We propose a novel approach to mapping tissue and vascular systems without the use of contrast agents, based on moving and measuring magnetic particles. To this end, we consider a swarm of particles in a 2D grid that can be tracked and controlled by an external agent. Control inputs are applied uniformly so that each particle experiences the same applied forces. We introduce benchmarking algorithms for mappingand coverage.
Introduction
In MR imaging, some tissues have poor contrast, which means that the boundaries between tissue types cannot be determined. To discover tissue boundaries, particulate solutions of a contrast agent are used to illuminate regions of interest. Many contrast agents such as gadolinium chelates are toxic, and prolonged exposure causes medical complications [1]. So, we explore using magnetic microparticles to map a region.
Fig.1. Mapping a 2D environment with 500 free cells using n = 4 (top) and n = 300 (bottom) particles
Fig. 1 represents the complete mapping of a workspace using a large number of particles. At the initial step, all particles (red circles) are in free cells (white squares) and are surrounded by blue squares that represent the unknown frontier cells. By commanding the particles to take one step in a particular direction, we can categorize the the frontier cells in this direction as either obstacle or free.
MethodsWe describe two algorithms of increasing complexity for 2D mapping. The map M is a matrix the size of the work space. Each cell of M holds one of five values that denote: Particle, Frontier, Unknown, Freespace and Obstacle.
59
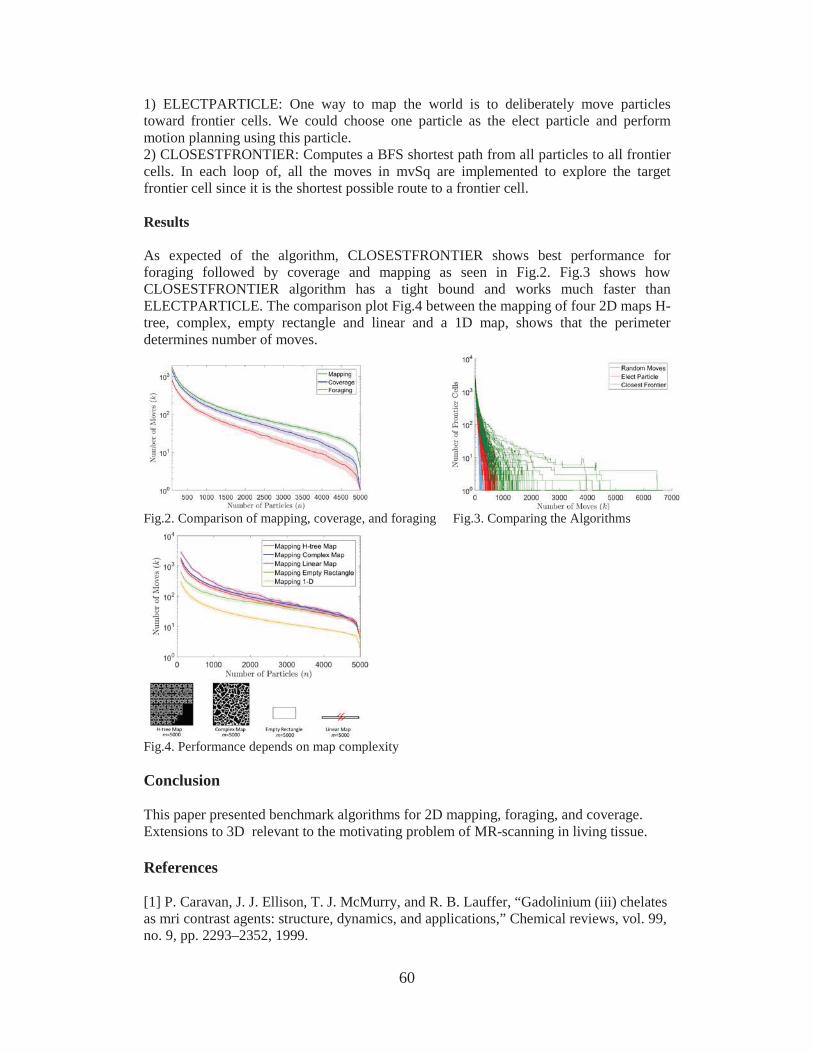
1) ELECTPARTICLE: One way to map the world is to deliberately move particles toward frontier cells. We could choose one particle as the elect particle and perform motion planning using this particle. 2) CLOSESTFRONTIER: Computes a BFS shortest path from all particles to all frontier cells. In each loop of, all the moves in mvSq are implemented to explore the target frontier cell since it is the shortest possible route to a frontier cell.
Results
As expected of the algorithm, CLOSESTFRONTIER shows best performance for foraging followed by coverage and mapping as seen in Fig.2. Fig.3 shows how CLOSESTFRONTIER algorithm has a tight bound and works much faster than ELECTPARTICLE. The comparison plot Fig.4 between the mapping of four 2D maps H-tree, complex, empty rectangle and linear and a 1D map, shows that the perimeter determines number of moves.
Fig.2. Comparison of mapping, coverage, and foraging Fig.3. Comparing the Algorithms
Fig.4. Performance depends on map complexity
Conclusion
This paper presented benchmark algorithms for 2D mapping, foraging, and coverage.Extensions to 3D relevant to the motivating problem of MR-scanning in living tissue.
References
[1] P. Caravan, J. J. Ellison, T. J. McMurry, and R. B. Lauffer, “Gadolinium (iii) chelates as mri contrast agents: structure, dynamics, and applications,” Chemical reviews, vol. 99, no. 9, pp. 2293–2352, 1999.
60

FLUORESCENCE IMAGING WITH DOTLENS ON A SMARTPHONE
Yulung Sung and Wei-Chuan ShihDepartment of Electrical and Computer Engineering
University of HoustonHouston, TX 77204-4005
Abstract
The powerful computational capabilities, high quality imaging sensors, and networking functions render smartphones an incredible platform for scientific and medical imaging with far-reaching implications. We present a robust and simple fluorescence imaging attachment that works in tandem with a DotLens on any mobile device to enable the binding fluorescence detection of single bacteria viability. The system is 3D printed and has a resolution of 2 m and limit-of-detection size of 50 nm on an 8MP smartphone camera.
Introduction
DotLens is an inkjet-printed lens attachment that attaches onto a smartphone camera like a contact lens and enables imaging resolutions of 2 m. Although its direct application in bright-field microscopy has its own merits, fluorescence microscopy enables true molecular identification through selective staining. The system relies on a smartphone (Lumia 640) running stock camera app. The DotLens is self-attached onto the smartphone camera, and the attachments necessary for dark-field illumination, fluorescence excitation, and sample positioning are 3D printed. We utilize total-internal-reflection induced evanescent wave scattering, with the camera positioned at a 90-degreeangle to the light illumination to ensure only scattered light caused by the presence of a sample on the waveguide enters the smartphone camera. The setup is shown in Fig. 1, a modifiable phone/tablet mount enables the system to be translated to any arbitrary device.Fluorescence considerations are shown In Fig. 2 for commonly used bacteria viability dyes SYTO 9 and propidium iodide (PI) dyes.
Fig. 1: Smartphone fluorescence microscope setup: DotLens attached to phone, (1) adapter connects system to phone, (2) ring blocks stray light, (3-4) barrel focusing
mechanism and sample holder, (5) ambient light blocker, (6) illumination. Sample isslotted into 4 and 6.
61

Fig. 2: Fluorescence considerations: (solid patch) LED response, (lines) fluorescence excitation/emission response.
Results
Binding fluorescence of nucleic acid stains in bacteria enabled viability characterization of a host of different bacteria on a glass slide, as well as directly on a fingerprint. SYTO 9 and Propidium iodide (PI) are both nucleic acid stains, with the former being membrane permeant, and the latter membrane impermeant. The discrete color channels (green vs red) for SYTO 9 and PI enable live/dead cell identification based on fluorescenceimaging. When compared with a desktop microscope, we demonstrate that viability of single bacteria that are sufficiently separated can be determined with a smartphone, asshown in Fig. 3.
Fig. 3: Binding fluorescence for bacteria viability characterization. Each number (1-4) indicate a single bacterium respectively.
Conclusions
The fluorescence smartphone microscope setup with a DotLens enabled a resolution of 2m and limit of detection of 50 nm. The low-cost 3D setup enabled clear binding
fluorescence for single bacteria viability characterization, and may enable the creation of low-cost kits for bacteria/parasite monitoring in a mass scale.
References[1] Sung, Y.L., Jeang, J., Lee, C.H. and Shih, W.C., 2015. Fabricating optical lenses by inkjet printing and heat-assisted in situ curing of polydimethylsiloxane for smartphone microscopy. Journal of biomedical optics, 20(4), pp.047005-047005.[2] Boulos, L., Prevost, M., Barbeau, B., Coallier, J., & Desjardins, R. (1999). LIVE/DEAD® BacLight™: application of a new rapid staining method for direct enumeration of viable and total bacteria in drinking water. Journal of microbiological Methods, 37(1), 77-86.
62

HIGH-THROUGHPUT AND HIGH QUALITY MID-INFRARED SPECTROSCOPIC IMAGING USING DISCRETE FREQUENCY LASER
SCANNING AND TIME-DELAYED INTEGRATION
Shihao Ran1 and David Mayerich1 1 Department of Electrical and Computer Engineering
University of Houston Houston, TX 77204-4005
Abstract
Infrared spectroscopic imaging has been receiving attention due to the potential to provide quantitative molecular information about a tissue sample without destroying it. Most current IR imaging systems rely on Fourier Transform Infrared (FTIR) spectroscopy, requiring an interferometer to differentiate frequencies. These instruments are too slow to be clinically viable. There has been a recent push to overcome this limit by using newer quantum cascade laser (QCL) sources. We propose a simple technique utilizing time-delayed integration (TDI) algorithm to fully utilize the throughput of a focal-plane array (FPA) detector while eliminating fringing artifacts. Introduction
It has been a growing-potential application to obtain high-quality molecular and structural information from biological samples in many areas of clinical and biomedical research. Newly emerged vibrational molecular imaging methods, using mid-infrared source to do absorbance imaging, for instance, have established label-free, noninvasive techniques to extract biomedical information from micrometer-thick samples. No prior knowledge of the composition of the sample or chemical staining is needed since many molecular functional groups have their specific resonant frequencies in IR region, so called "finger print" region [1]. However, because of the spatial coherence of QCL source, it will end up with generating fringing artifacts while imaging and these effects can hardly be eliminated by post-processing [2]. In this manuscript, we propose a system based on DFIR coupled with tunable QCL and a software controlled precise 3D stage which moves the sample vertically. Combined with time-delay integration (TDI) algorithm and liquid nitrogen-cooled mercury cadmium telluride (MCT) focal plane array (FPA) detector, our system is capable of high-throughput IR imaging while eliminating fringing artifacts from the coherent QCL source. Instrumentation
As shown in Figure 1, we have developed a custom IR molecular imaging system integrated with a four channel QCL with pulsed tuning range from 5.10 µm to 10.99 µm, maximum peak power 500 mW and pulse repetition rate from 0.1 kHz to 1 MHz. Because of the invisibility of QCL emission, a HeNe alignment is added into the system to overlap with invisible QCL beam to make optical alignment easier by make it passing through a beam splitter. Planar mirrors M1 and M2 guide the two overlapped beams into sample plane. Sample is taken by a high resolution (0.1 µm) 3D stage to move vertically during imaging. The image is then collected by a 0.56 NA BD-2 glass AR coated objective. The final image out from objective is then focused onto a SBF161 128 × 128 pixel focal plane array (FPA) mercury cadmium telluride (MCT) detector, resulting with a pixel size of 6.25 µm. MCT detectors have much higher responding time
63

(microseconds) compares to uncooled IR bolometer or thermal cameras which can only be operated in millisecond level. Thus far faster imaging speed is achieved.
Fig. 1. System Diagram. The QCL-based DFIR imaging system is coupled to a 4 channel ultra-broadly tunable mid-IR external-cavity pulsed quantum cascade laser and a SBF161 128 × 128 pixel focal plane array (FPA) mercury cadmium telluride (MCT) detector. Results and Discussion
Fig. 2. Left side, (A) SU-8 on BaF2 substrate USAF target imaged by (A) QCL-based DFIR microscope, (B) Spero IR microscope from Daylight Solution and (C) Agilent 600 series FTIR Spectrometer, all of them are imaged under 1508 wavenumber with USAF group 1 element 5. The white scale bar displayed denotes 100 µm. Right side, (A) Target region spectra comparison between QCL-based DFIR system (red line), Spero IR imaging system (green line) and FTIR system (white line). (B)Background region spectra comparison. In this manuscript, we come up with a QCL-based DFIR imaging system coupled with high-throughput MCT FPA detector. Fast-speed hyperspectral imaging is achieved while providing surpassed imaging resolution and signal to noise ratio compares to best commercial FTIR imaging system. Combined with time delay integration algorithm, fringing-artifact-free imaging is accomplished even with coherent source compared with Spero system. Fringing artifact induced by coherent light source is eliminated only along one dimension in this manuscript, however, future work can be done towards adding a galvo scan mirror to raster scan the focused laser beam along vertical direction corresponds to the stage to get higher SNR. References
[1] M. J. Baker, J. Trevisan, P. Bassan, R. Bhargava and H. J. Butler, Nature Protocols, 2014, 9, 1771–1791. [2] K. Yeh, S. Kenkel, J.-N. Liu and R. Bhargava, Analytical Chemistry, 2015, 87, 485–493.
64

MOVING MILLIROBOTS THROUGH TISSUE USING MAGNETIC HAMMER ACTUATION
Ashwin Ramakrishnan1, Julien Leclerc2, and Aaron T. Becker2
1 Department of Mechanical Engineering2 Department of Electrical and Computer Engineering
University of HoustonHouston, TX 77204-4005
Abstract
Millirobots propelled by magnetic fields show promise for minimally invasive surgery or drug delivery. MRI scanners can generate magnetic gradients to apply propulsive forces on ferromagnetic objects. However, MRI gradient values are insufficient for tissuepenetration. Our poster presents a millirobot design and control methods to produce pulsed forces. A ferromagnetic sphere inside a hollow robot body can move back and forth between a spring and an impact rod. Repeated impacts result in large pulsed forces. Analytical, numerical and experimental results are presented.
Introduction
Magnetic gradient forces can be used to steer and propel untethered millirobots with ferromagnetic components, through passageways in the human body. One method to do this is by varying the current in electromagnets around the body [1]. This method has been used to move ferromagnetic objects within an MRI scanner, which produces constant magnetic gradient forces. The forces within an MRI are sufficient to navigate through blood vessels [2], but are inadequate for tissue penetration [3]. To enable tissue penetration with the available forces in an MRI, we convert the kinetic energy of a moving ferromagnetic sphere into pulsed forces through repeated impacts on a hard surface. We present the design of this magnetic hammer millirobot and test three control strategies to vary the frequency and duty cycle of the input magnetic gradient force. The average impact velocity is highest in an ideally closed-loop system with sensing at both ends, and is three times lower for an open-loop system with no sensing. A partially-closed loop system with only impact-end sensing can perform as well as an ideally closed-loop system, for low values of Coulomb friction. Results from experiments performed on a custom magnetic test bed are also presented.
Millirobot Design
A ferromagnetic sphere can move back and forth inside a hollow tube (See Figure 1).There is a spring at the posterior end which reverses the direction of sphere motion with a minimal loss of momentum. The sphere transfers its momentum to tissue through repeated impacts on the rod at the anterior end. All robot components except the sphere are non-magnetic.
Control Strategies and Implementation
The average impact velocity over 1000 impacts was highest in an ideally closed-loop system with sensors at either end (See Figure 2). In this system, the direction of the magnetic gradient force is always in the same direction as the motion of the sphere. Theimpact velocity initially increases and saturates, reaching a resonant value.
65
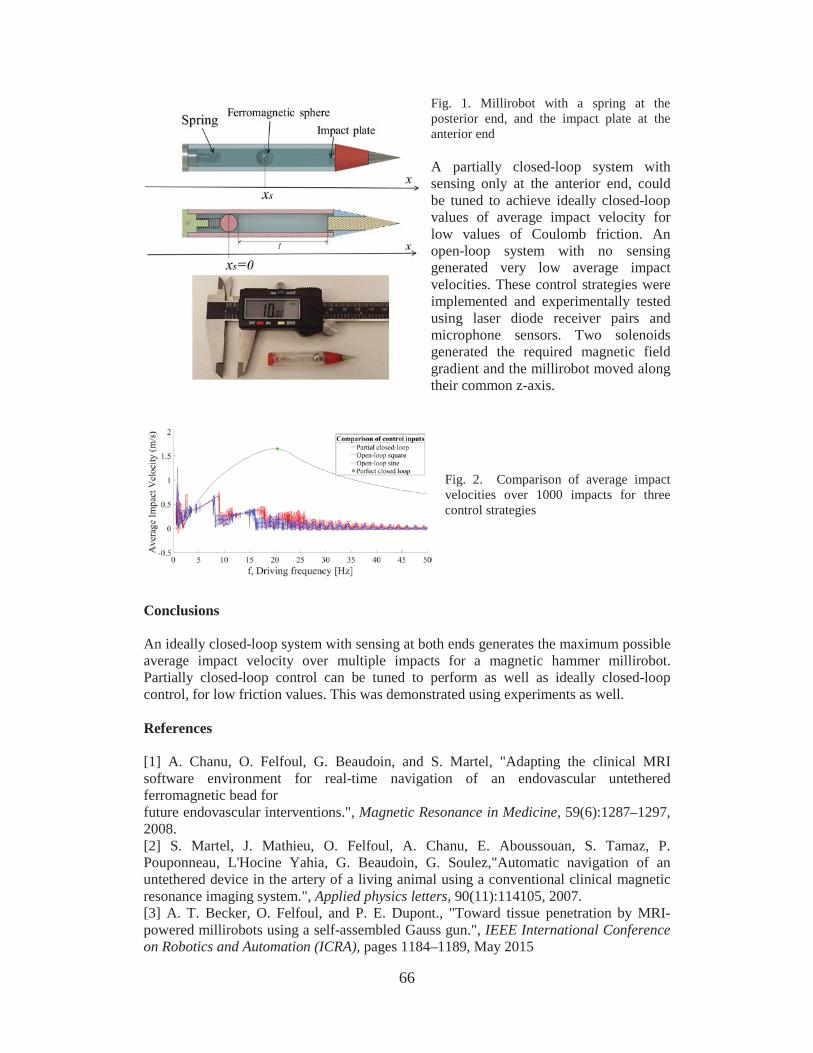
Fig. 1. Millirobot with a spring at the posterior end, and the impact plate at the anterior end
A partially closed-loop system with sensing only at the anterior end, could be tuned to achieve ideally closed-loop values of average impact velocity for low values of Coulomb friction. An open-loop system with no sensing generated very low average impact velocities. These control strategies were implemented and experimentally tested using laser diode receiver pairs and microphone sensors. Two solenoids generated the required magnetic field gradient and the millirobot moved along their common z-axis.
Fig. 2. Comparison of average impact velocities over 1000 impacts for three control strategies
Conclusions
An ideally closed-loop system with sensing at both ends generates the maximum possible average impact velocity over multiple impacts for a magnetic hammer millirobot.Partially closed-loop control can be tuned to perform as well as ideally closed-loop control, for low friction values. This was demonstrated using experiments as well.
References
[1] A. Chanu, O. Felfoul, G. Beaudoin, and S. Martel, "Adapting the clinical MRIsoftware environment for real-time navigation of an endovascular untethered ferromagnetic bead forfuture endovascular interventions.", Magnetic Resonance in Medicine, 59(6):1287–1297, 2008.[2] S. Martel, J. Mathieu, O. Felfoul, A. Chanu, E. Aboussouan, S. Tamaz, P.Pouponneau, L'Hocine Yahia, G. Beaudoin, G. Soulez,"Automatic navigation of anuntethered device in the artery of a living animal using a conventional clinical magnetic resonance imaging system.", Applied physics letters, 90(11):114105, 2007.[3] A. T. Becker, O. Felfoul, and P. E. Dupont., "Toward tissue penetration by MRI-powered millirobots using a self-assembled Gauss gun.", IEEE International Conference on Robotics and Automation (ICRA), pages 1184–1189, May 2015
66
ELECTROLESS ATOMIC LAYER DEPOSITION OF PT2+ ON CU NANOWIRES
Dhaivat J. Solanki1 and Stanko R. Brankovic2
1 Materials Engineering Program2 Department of Electrical and Computer Engineering
University of HoustonHouston, TX 77204-4005
Abstract
Electroless deposition is technique in which metal ions are chemically reduced to produce coating from aqueous solution. With V2+ ion serving as reducing agent, a monolayer of Pb (as surfactant) is deposited on Cu surface which is replaced by Pt2+ ions from separatesolution. Selective deposition of Pt2+ on Cu over SiO2 background is demonstrated. Pd wetting layer is used to improve morphology of Pt deposit. XPS analysis indicate deposition of Pt2+ on Cu nanowires, traces of Pb and V are not observed. Statistical image processing algorithm is used to determine surface roughness from AFM images. The difference in morphology of surface is characterized by SEM.
Introduction
Platinum is widely used in chemical, petroleum reforming, pharmaceutical, catalyst,nitric acid synthesis, electronic and many other technologies [1]. For majority of applications, precise control over morphology and thickness of Platinum deposition is essential. Relatively high surface free energy and interatomic bond energy (307 kJ/mol) of Platinum results in island (Volmer Weber) growth mode during thin film deposition. Traditional vapor phase ALD delivers uneven thickness of deposit [2]. Here proposed mechanism involves combination of Electroless UPD and surface limited redox replacement (SLRR) to ensure conformal atomic layer by layer deposition. Since proposed solution based ALD method is electroless, it is very useful for intricate designed substrate for selective deposition.
Experimental Method
Cu nanowires surface is prepared by Plasma Ashing with O2 to remove ~2 nm photoresist from surface. First step of Electroless ALD is Electroless Underpotential deposition (UPD) of Pb monolayer on Cu nanowires. Vanadium is used to reduce Leadon Cu substrate. Deposition of Pb monolayer is proved by comparison of open circuit potential measurement and cyclic voltammetry for Cu substrate. The second part involves Surface Limited Redox Replacement (SLRR) [3]. Monolayer of Pb is replaced by Pt ions present in solution. Sodium citrate is used as additive during SLRR. Pd is used to prevent galvanic corrosion of Cu by Pt in first five ALD cycles. Total 60 ALD cycles are performed.
Results and Conclusion
Presence of Pt on Cu nanowires is confirmed by XPS. Traces of Pb, V and Pd is not observed on the surface. Cu nanowires surface morphology is studied before and after deposition by SEM analysis. 100% coverage of Pt with conformal growth is observed. Selectivity of Pt deposition on Cu over background of SiO2 is achieved. AFM is used to study surface roughness of deposition with help of statistical image processing algorithm.
67

We are planning to design Electroless ALD method to deposit Pt on Ru substrate for future research.
Fig. 1. SEM images comparison before and after Electroless ALD.
Acknowledgement
We wish to thank Lam Research for funding the project.
References[1] J. Zhang, Y. Mo, M. B. Vukmirovic, R. Klie, K. Sasaki, and R. R. Adzic, “Platinum Monolayer Electrocatalysts for O2 Reduction: Pt Monolayer on Pd(111) and on Carbon-Supported Pd Nanoparticles,” J. Phys. Chem. B, 108 (30), pp. 10955-10964, June 2004.[2] Shuifen Xie, Sang-Il Choi, Ning Lu, Luke T. Roling, Jeffrey A. Herron, Lei Zhang, Jinho Park, Jinguo Wang, Moon J. Kim, Zhaoxiong Xie, Manos Mavrikakis, and Younan Xia, “Atomic Layer-by-Layer Deposition of Pt om Pd Nanocubes for Catalysts with Enhanced Activity and Durability toward Oxygen Reduction,” Nano Lett., 14 (6), pp. 3570-3576, May 2014.[3] Brankovic Stanko R., and Giovanni Zangari. "Electrochemical Surface Professes and Opportunities for Material Synthesis." Electrochemical Engineering Across Scales: From Molecules to Processes. Vol. 15, Willey-VCH, 2015. p. 59-107. Print.
Before E-less ALD After E-less ALD
Before E-less ALD After E-less ALD
68

FABRICATION OF MULTI-POINT SIDE-FIRING OPTICAL FIBER BY LASER MICRO-ABLATION
Hoang Nguyen1, Arnob M Parvez2, Aaron T Becker2, John C Wolfe, Matthew K Hogan5,Philip J Horner5, and Wei-Chuan Shih1,2,3,4*
1Program of Materials Sceince & Engineering2 Department of Electrical and Computer Engineering
3 Department of Biomedical Engineering4Department of Chemistry
University of HoustonHouston, TX 77204-4005
5Houdton Methodist Research InstituteHouston, TX 77030
Abstract
A multi-point, side-firing design enables an optical fiber to output light at multiple desired locations along its axis can provide advantages over traditional fibers, especially in applications requiring fiber bundles such as brain stimulation or remote sensing. This paper demonstrates that continuous wave laser micro-ablation can controllably create conical-shaped cavities for outputting light. Experimental data shows that a single side window on a 730increased to more than 19% on a 65 m fiber with side windows created using femtosecond (fs) laser ablation and chemical etching.
Introduction
Optical fibers are currently the primary method to transmit light over long distances with negligible loss. Advantages over other signal transferring cables include being impervious to electromagnetic interference, having faster speed, and less signal attenuation. Optical fibers have also had a profound impact on many biomedical applications, including endoscopy, phototherapy, and optogenetics. However, traditional optical fiber design uses a linear, end-to-end approach in which light are coupled at one end and transmitted to the other end. Multiple light entry/exit points currently require a large cable bundle, which may cause permanent damage to the tissue during insertion. Therefore, a multi-point, side-firing optical fiber configuration would be more practical. Such a configuration could provide light distribution to a relatively large and targeted region to treat cancer in soft-laser therapy [1]. For example, the fiber can be placed under the skin to irradiate along a sub-surface blood vessel. The side-firing configuration could also transmit light to hard-to-reach areas such as diseased tissues along sidewalls of tubular structures in the human body [2]. In optogenetics studies, the use of normal optical fibers is limited, since they can only transmit light to a single target. That drawback can be overcome by using multi-point side-firing fibers, which provide 3D control of light delivery to stimulate selected neurons.Inspired by a medical need for precision light-delivery in small areas, several techniques have been developed to build side-firing fibers. Light exit points can be controlled using metal reflectors coated on the fiber’s distal end to deflect the emanating light [2]. In another method, the fiber tip is beveled to refract light in different directions [2]. Other side-firing methods include surface-emitting fiber lasers [9], side-glowing fibers, and tilted fiber Bragg grating. Overall, most of these fabrication methods are still relatively complex, time-consuming, and expensive. Devices such as side-emitting fibers and side
69

glowing fibers have low output efficiency and poor localization of the illumination area. Recent efforts have focused on forming cavities on the fiber bodies to alter light propagation inside the fiber core. For example, laser ablation was employed to pattern microstructures such as micro-holes and micro-channels on the side of both plastic and glass optical fibers for sensor applications. Mechanical drilling or laser-assisted chemical etching can also provide similar micro-scale side holes on plastic optical fibers. Theseapproaches illustrate the potential for three-dimensional light distribution alongside the fiber body, but this capability has not been fully investigated. This report shows laser ablation can be finely tuned to fabricate specific window geometries on the fiber body. This enables customized configurations of multi-point, side-firing, three-dimensional light distribution.
Results
Fig. 1. SEM image of light window fabricated by 50 W CW laser. a) Top view of side window with buffer and
cladding layers intact; b) Cross section of the side window without the buffer
and cladding layers.
Fig. 2. The crater-shaped window causes the input light incident angle to exceed the TIR critical angle, thus part of the input light refracts through the
fiber; top right: side-firing beam profile in acridine orange solution.
Fig. 3. -firing optical fiber with three windows tested in agar model of brain tissue; b) Side-view of
the same fiber inserted in a swine brain slice shows a large illuminated volume
inside the tissue; c) Side-view of unmodified 65 m fiber in a swine brain slice shows smaller illuminated volume
localized at the tip of the fiber. Illumination sites in the swine brain
were observed through ~ 0.5 cm layer of brain tissue.
Conclusion
In conclusion, this letter presents a 3D, multi-point, side-firing optical fiber to control the launch direction and distribution of light in brain tissue. It can be used effectively as a light delivery device for optogenetics stimulation and for soft-laser therapy.
References
1. J. Spigulis, J. Lazdins, D. Pfafrods, and M. Stafeckis, “Side-emitting optical fibres for clinical applications”, Med. Biol. Eng. Comput. 34, 285-286 (1996).C. F. B. van Swol, R. M. Verdaasdonk, R. J. van Vliet, D. G. Molenaar, and T. A. Boon, “Side-firing devices for laser prostatectomy”, World J. Urol 13, 88-93 (1995)
a)
a) b) c)
a) b)
70

MECHANICAL MILLING INDUCED BAND GAP CHANGE IN PSEUDOBOEHMITE AND PSEUDOBOEHMITE DOPED WITH CR3+
W. Yang1, S. Brankovic1, and F. C. Robles Hernández2
1 Department of Electrical and Computer Engineering2 Department of Mechanical Engineering Technology
University of HoustonHouston, TX 77204-4005
Abstract
Here we found an environmentally friendly and cost effective way to synthesize high purity sapphire and ruby by pseudoboehmite (PB) for optical and laser applications,respectively. Then high-resolution XPS was applied to study the effects of mechanical milling on band gap of PB or PB doped with Cr3+. The trend of changing band gap as a function of milling time was decreasing and then increasing after 20h for both of PB and Cr doped PB. FTIR result demonstrates the changes in band gap are mainly attributed to the elimination of water in the PB and its partial transformation into Al2O3.
Introduction
S -Al2O3 single crystal) or ruby -Al2O3 doped with Cr3+) has excellent optical, chemical and mechanical properties; it has been widely applied in light emitting diodes (LED), semiconductor device, solid lasers, precision optics and infrared windows[1]. The development of high purity sapphire and ruby gains a lot of interest in recent years. PB is a soft material, poorly crystalline with water interlay in its structure[2]. In mechanical milling process, it can lose its water content and transform to other crystalline alumina ( -Al2O3 or -Al2O3). PB can also absorb the mechanical milling energy, form new grain boundaries, thus its grains size would be changed. Both of the crystalline structure and grain size can change the PB’s band gap that plays a key role on deciding material’s optical property[3, 4]. It is necessary to find the effect of the mechanical milling process on the band gap of PB. Additionally, mechanical milling process is environmentally friendly, relatively low temperature, simple, cost effective andwith potential for industrial scalability.
Methods and Analysis
In this report it is presented the influence of mechanical milling on band gap of PB as well as a mixture between PB and Cr2O3. We first synthesized PB by wet chemical method, and then milled it in a stainless steel Spex mill machine. After mechanical milling, the samples’ band gap determination was carried by means of high-resolution X-ray photoelectron spectroscopy (XPS)[5]. The result shows the bandgap of the raw PB is 7.2ev, when the PB is milled for up to 30h the bandgap decreases to 6.1ev. Further milling has the opposite effect and 50h of milling the bandgap increases to 6.8ev. The trend for the pure PB and the PB doped with Cr2O3 is comparable. XRD data shows that the grain size of the PB decreases from 7.0 nm to 4.0 nm in 20h milling process, and then increased from 4.0nm (20h) to 6.5 nm (30h). In the mechanical milling process the grain size decreases (as shown in XRD data), the band gap should increase. However the trend of band gap changing is opposite, it means that grain size change has less or no effect on the band gap change. FTIR result demonstrates that those changes in bandgap are mainly
71

attributed to the elimination of water in the pseudoboehmite and its partial transformation into Al2O3.
0 10 20 30 40 506.06.26.46.66.87.07.27.47.67.88.08.28.48.68.89.09.29.4
O1s Al 2p
Band
gap
(ev)
Milling time (h)
Fig. 1. Band gap of the pseudoboehmite with milling time of 0 hr, 1hr, 2hr, 10hr, 20hr, 30hr and 50hr.
Conclusion
In the present work we demonstrated the effects of mechanical milling on bandgap of PB that is partially transformed into sapphire or PB doped with Cr3+ (e.g. Cr2O3) to synthesize ruby. The XPS data shows that the band gap of PB or PB doped with Cr3+
decrease from 0h to 30h, and then increase from 30h to 50h. FTIR result shows that those changes in bandgap are mainly attributed to the elimination of water in the pseudoboehmite and its partial transformation into Al2O3.
References
[1] Zhou, Y., et al.,“Characterization of sapphire chemical mechanical polishingperformances using silica with different sizes and their removal mechanisms,"Colloids and Surfaces A: Physicochemical and Engineering Aspects, vol. 513, pp.153-159, 2017.
[2] Baker, B.R. and R.M. Pearson,"Water content of pseudoboehmite: A new model forits structure,"Journal of Catalysis, vol.33, pp. 265-278,1974.
[3] Filatova, E.O. and A.S. Konashuk, "Interpretation of the Changing the Band Gap ofAl2O3 Depending on Its Crystalline Form: Connection with Different LocalSymmetries,"The Journal of Physical Chemistry C, vol.119, pp 20755-20761, 2015.
[4] Yang, S., D. Prendergast, and J.B. Neaton, "Strain-Induced Band Gap Modificationin Coherent Core/Shell Nanostructures," Nano Letters, vol. 10, pp 3156-3162, 2010.
[5] M.T. Nichols et all, "Measurement of bandgap energies in low-k organosilicates,"Journal of Applied Physics, vol. 115, pp 094105, 2014.
72

ENHANCING INTERFACIAL STABILITY OF SODIUM METAL ANODE WITH SOLID POLYMER-SULFIDE COMPOSITE ELECTROLYTE
Ye Zhang1 and Yan Yao*,1,2
1 Department of Electrical and Computer Engineering and Materials Science and Engineering Program
2 Texas Center for Superconductivity at the University of Houston, Houston, TX 77204
Abstract
The interfacial stability between Na and the solid-state electrolyte is crucial for the performance of the all solid-state sodium batteries (ASSSB). Despite the high ionic conductivity of Na3SbS4 (NSS), it is not stable with Na metal. The decomposition of NSS results in a significant increase of interfacial resistance. To stabilize the interface, a cellulose-supported PEO polymer (CPEO) was applied between NSS and Na. The symmetric cell with CPEO/NSS electrolyte shows a stable voltage profile over 800 hoursunder 0.1 mA cm-2 at 60 . This simple and scalable polymer coating approach offers a new perspective for ASSSBs.
Introduction
Rechargeable Sodium batteries have received growing interest as an alternative to lithium batteries for large scale energy storage application in the view of the high abundance and cost effectiveness of sodium source. However, the use of Na metal as anode material in organic electrolyte has been proven problematic because of the flammable electrolyte and uncontrolled Na dendrite growth. 1-4 The rise of solid state electrolytes (SSEs) with highNa-ion conductivity has held much promise for the realization of sodium metal batteries.Compared to the organic electrolyte, the non-flammable inorganic SSE is mechanically favorable to suppress Na dendrite growth which eliminates the safety concern of metal batteries. 5 The recently reported tetragonal phase Na3SbS4 (NSS) with a high ionic conductivity up to 3 mS·cm-1 at room temperature represents one of the fastest Na-ion conductors so far. 6
Despite their high Na-ion conductivity, the overall performance of ASSSB remains unsatisfactory which is ascribe to the unstable interface between the Na metal and SSE.Recently, Goodenough et al. proposed a polymer/ceramic electrolyte/polymer sandwich electrolyte for both lithium and sodium solid batteries. 7,8 The polymer film can serve as an effective protection layer to stabilize the interface between SSE and Na.
Results and Discussion
In this report, we investigated the interfacial stability of the NSS with Na metal. Theoretical calculation confirms that NSS is only stable with Na within a narrow electrochemical window (1.5-1.6 V vs. Na/Na+). And the experimental results showthat the NSS will decompose to Na3Sb and Na2S during the electrochemical process. To improve the interfacial stability, A cellulose poly(ethyleneoxide) (PEO) composite (CPEO) is built as a protection layer at the NSS/Na interface, as is shown in the schematic diagram in figure 1. The laminated CPEO/NSS electrolyte combines the merits of the high ionic conductivity of sulfide electrolyte and electrochemical stability of
73

polymer, resulting in an 800 hours’ stable Na stripping/plating in the symmetric cell test under a current density of 0.1 mA cm-2 at 60 .
Figure 1. Schematic of symmetric cell with CPEO/NSS electrolyte and its Galvanostatic cycling curve.
Reference
[1] Ellis, B. L.; Nazar, L. F. Current Opinion in Solid State & Materials Science 2012,16 (4), 168–177.
[2] Yabuuchi, N.; Kubota, K.; Dahbi, M.; Komaba, S. Chem. Rev. 2014, 114 (23), 11636–11682.
[3] Hu, P.; Wang, X.; Ma, J.; Zhang, Z.; He, J.; Wang, X.; Shi, S.; Cui, G.; Chen, L. Nano Energy 2016, 26 (C), 382–391.
[4] Kim, H.; Kim, H.; Ding, Z.; Lee, M. H.; Lim, K.; Yoon, G.; Kang, K. Adv. Energy Mater. 2016, 6 (19), 1600943–38.
[5] Jung, Y. S.; Oh, D. Y.; Nam, Y. J.; Park, K. H. Isr. J. Chem. 2015, 55 (5), 472–485.
[6] Zhang, L.; Zhang, D.; Yang, K.; Yan, X.; Wang, L.; Mi, J.; Xu, B.; Li, Y. Adv. Sci.2016, 3 (10), 1600089–6.
[7] Zhou, W.; Wang, S.; Li, Y.; Xin, Sen; Manthiram, A.; Goodenough, J. B. J. Am. Chem. Soc. 2016, 138 (30), 9385–9388.
[8] Zhou, W.; Li, Y.; Xin, Sen; enough, J. B. G. ACS Central Science 2017, 1–6.
74

(110) CUBIC AND (100) RHOMBOHEDRAL GE CRYSTAL FORMATION ON GLASS USING AL-INDUCED CRYSTALLIZATION
Kaveh Shervin, Khim Kharel and Alexandre Freundlich*
Center for Advanced Materials, University of Houston, Houston, Texas
Abstract
We have experimentally looked into the physics of low temperature (<400C) amorphous Ge crystallization using AIC favoring the formation of highly oriented large grain Ge crystals towards (110) or (100) suitable for solar cell applications. We have investigated the effects of experimental parameters such as Al and Ge layers thicknesses, interfacial oxide layer (between Al and Ge) and annealing conditions on defining the Ge dominant orientation. We have studied the playing role of Al thickness on tuning Ge dominant orientation and subsequently achieved (110)-oriented cubic Ge on glass. The optoelectronic properties of the films have been investigated using Photoluminescence.Furthermore, we show the possibility of obtaining a novel rhombohedric (100) Ge.
Introduction
Highly orientation-controlled and large grain Ge polycrystalline (>10 microns) films on inexpensive substrates could serve as templates for development of high efficiency inexpensive III-V Photovoltaics [1]. AIC has been initially studied for the fabrication of inexpensive large grain poly-Si on glass [2-3] and subsequently they been investigated for the fabrication of inexpensive solar cells on glass or alternative substrates [4-5]. The outcome of these studies has been relatively successful for the understanding of the exchange layer mechanism, yet not for controlling the crystal orientation and the use in solar cells. Recently, AIC has derived an increasing interest into the fabrication highly textured large grain poly-Ge on inexpensive substrates in the similar way as Si [6-7]. The Al-Ge lower eutectic temperature, at 424 °C, suits even better for the fabrication of poly-crystalline films on glass based substrates with low melting point. Also, Ge has the eminent benefit of lattice matched to GaAs over Si for photovoltaic devices. In this regard, recently successful efforts have been reported on achieving (111) oriented large grain (>100 microns) Ge on glass. However, (111) oriented large grain poly-Ge films do not serve the purpose for stacking lattice matched GaAs multi-junction solar cells on Ge. Therefore, we have investigated the parameters being able to alter the formation of normally achieved (111) preferential orientation.
Experimental details
We have used two different substrates including double-side polished fused quartz glassand SiO2 deposited on (111)-oriented Si, called as SiO2/Si. We have used a vacuum evaporation system at room temperature deposition. Al layer was first deposited on substrate with the thicknesses varied from 50 nm to 300 nm. Following Al deposition, majority of samples were exposed in air between 30 minutes and several days for the formation of natively grown AlOx. Ge was successively deposited at the same condition as Al with thicknesses varying from 50 nm to 200 nm. Fig. 1 illustrates the schematic preparation of polycrystalline Ge thin films on glass and SiO2/Si substrates using AIC process. In the next stage, samples were annealed in N2 ambient. The samples were annealed from 1 hour to 10 hours at temperature ranging from 250C to 400 C. During the annealing, Ge atoms initiate to recrystallize towards the formation of grains
75

and consequently a poly-Ge layer on the substrate, seen from the back of glass substratesin Fig. 2 (B). The Al layer formed on top was ultimately etched in dilute HF.
Fig.1. Schematic of the preparation of samples on both glass and SiO2 substrates.Results and discussion The a-Ge crystallization at nucleation sites depends on the physical parameters including surface free energy and the energy of Ge atoms diffused. By fine tuning of annealing conditions and layer thickness it is theoretically and experimentally possible to choose between nucleation sites thereby crystal orientation. Fig. 2 (A) compares the XRD results for samples only differing from their Al thickness. The Ge thickness was kept almost the same about 100 nm. However, Al thickness varied from 50nm to 300nm. Comparing XRD results suggests that the sample with very thin Al layer registered an outstanding dominant peak at (110) location other than normally achieved (111) obtained for the sample with the same Al thickness as Ge (100 nm). We are also reporting for the interesting results on the samples revealing near single crystalline (100) orientation not in normally achieved cubic system, yet in Rhombohedric structure. The 10K Photoluminescence studies on the poly-Ge after Al layer removal, revealed a considerable peak about the cubic Ge peak at 0.78 ev, Fig. 2 (C).
Fig. 2. (A) XRD of the samples annealed for 1 hour at 400C, Al thickness ranging from 50nm to 300nm; (B) Polycrystalline Ge evolution seen from the back of samples deposited on glass. (C)
Photoluminescence at 10K from the poly-Ge layer after the Al layer was removed.References
[1]M. Kurosawa et al. Solid. State. Electron., vol. 60, no. 1, pp. 7–12, Jun. 2011.[2] O. Nast et al. Appl. Phys. Lett., v. 73, no. 22, pp. 3214–3216, 1998.[3] Z. Wang et al. Nano Lett., vol. 12, no. 12, pp. 6126–6132, 2012.[4] O. Nast et al. Sol. Energy Mater. Sol. Cells, vol. 65, no. 1, pp. 385–392, 2001.[5] B. Rauet al. pp. 778–779, 2005.[6] L. R. Muniz et al. J. Phys. Condense Matter, vol. 19, no. 7, p. 076206, Feb. 2007.
Annealing
Etching Al and AlOx
AlOx
Ala-Ge Al
Poly-Ge
Layer-exchange
Glass or SiO2/Si(111)
Poly-Ge
ngng Glass or SiO2/Si(111)
x Glass or
SiO2/Si(111)
0.65 0.70 0.75 0.80 0.85 0.90 0.950.0
0.5
1.0
1.5
2.0
Energy (ev)
T=10 K
Inte
nsity
(arb
. Uni
ts)
Inte
nsity
(arb
. Uni
ts)
Cubic Ge
0.78 ev
(B)
(C)
(A)
76
[7] K. Toko et al. CrystEngComm, vol. 16, no. 13, p. 2578, 2014.

CHICKEN EGG SHELLS AS ROBUST, REPRODUCIBLE, AND LOW-COST SERS SUBSTRATES
Md Masud Parvez Arnob1 and Wei-Chuan Shih1,2
1 Department of Electrical and Computer Engineering2 Program of Materials Science and Engineering
University of HoustonHouston, TX 77204-4005
Abstract
Naturally formed submicron features on the three different egg shell regions, outer shell (OS), inner shell (IS), and shell membrane (SM), are sputter coated with gold and characterized for SERS performance.
Introduction
Surface-enhanced Raman scattering (SERS) has gained significant attention as an emerging analytical tool since its discovery [1]. So far, SERS works utilized the electron-beam lithography, chemical etching, colloid immobilization, annealing of metal-ion-implanted silicon, and nanosphere lithography for making the substrates [2]. However, these techniques require significant laboratory infrastructures and sophisticated preparation procedures. Hence, the identification of alternative techniques is of immense interest despite the obvious scientific challenges. Here we use egg shell, a daily waste material, to make SERS substrates.
Methods
Egg outer shell, inner shell, and shell membrane are sputter coated (3 × 10⁻⁶ Torr, Denton Desk II/Denton Vacuum LLC) with gold and characterized by a custom-built line scan Raman system.
Results
Figure 1 shows the SEM images of three different egg shell regions. Both outer shell and inner shell regions are made of 80-100 nm aggregated nanospheres. The shell membrane is made of interwoven and coalescing nanofibers (~ 2 m).
77
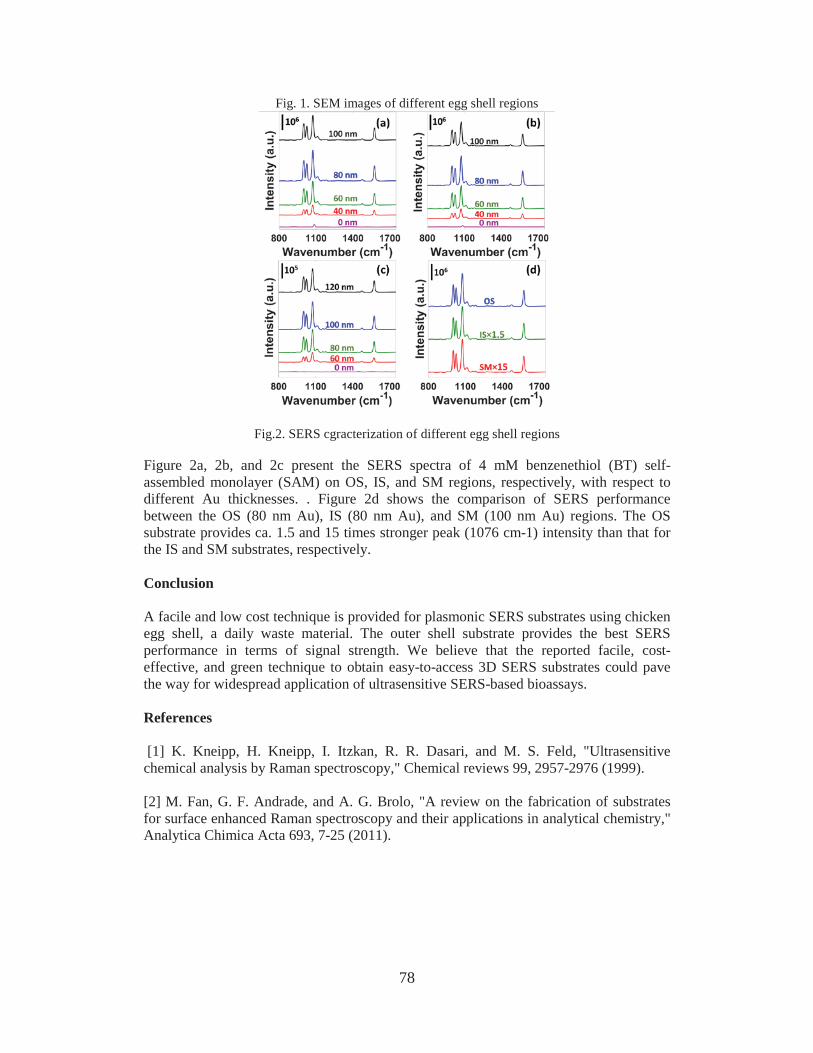
Fig. 1. SEM images of different egg shell regions
Fig.2. SERS cgracterization of different egg shell regions
Figure 2a, 2b, and 2c present the SERS spectra of 4 mM benzenethiol (BT) self-assembled monolayer (SAM) on OS, IS, and SM regions, respectively, with respect to different Au thicknesses. . Figure 2d shows the comparison of SERS performance between the OS (80 nm Au), IS (80 nm Au), and SM (100 nm Au) regions. The OS substrate provides ca. 1.5 and 15 times stronger peak (1076 cm-1) intensity than that for the IS and SM substrates, respectively.
Conclusion
A facile and low cost technique is provided for plasmonic SERS substrates using chicken egg shell, a daily waste material. The outer shell substrate provides the best SERS performance in terms of signal strength. We believe that the reported facile, cost-effective, and green technique to obtain easy-to-access 3D SERS substrates could pave the way for widespread application of ultrasensitive SERS-based bioassays.
References
[1] K. Kneipp, H. Kneipp, I. Itzkan, R. R. Dasari, and M. S. Feld, "Ultrasensitive chemical analysis by Raman spectroscopy," Chemical reviews 99, 2957-2976 (1999).
[2] M. Fan, G. F. Andrade, and A. G. Brolo, "A review on the fabrication of substrates for surface enhanced Raman spectroscopy and their applications in analytical chemistry," Analytica Chimica Acta 693, 7-25 (2011).
78

INTERACTION OF ORGANIC CATION WITH WATER MOLECULE IN PEROVSKITE CH3NH3PBI3: FROM DYNAMIC ORIENTATIONAL DISORDER
TO HYDROGEN BONDING
Zhuan Zhu1, Viktor G. Hadjiev2,3, Yaoguang Rong1, Rui Guo1,4, Bo Cao5, Zhongjia Tang6, Fan Qin7, Yang Li1, Yanan Wang8,1, Fang Hao1, Swaminathan Venkatesan1, Wenzhi Li4, Steven
Baldelli6, Arnold M. Guloy6, Hui Fang9, Yandi Hu5, Yan Yao1,3,7, Zhiming Wang8 and Jiming Bao1,6,7,8,10
1Department of Electrical and Computer Engineering, 2Texas Center for Superconductivity, 3Department of Mechanical Engineering, 5Department of Civil and Environmental Engineering, 6Department of Chemistry, 7Materials Engineering Program, 10Center for Advanced Materials,
University of Houston, Houston, TX 77204, USA4Department of Physics, Florida International University, Miami, Florida 33199, USA
8Institute of Fundamental and Frontier Sciences, University of Electronic Science and Technology of China, Chengdu, Sichuan 610054, China
9Department of Physics, Sam Houston State University, Huntsville, TX 77341, USA
Abstract
Microscopic understanding of interaction between H2O and CH3NH3PbI3 is essential to improve the efficiency and stability of perovskite solar cells. A complete picture of perovskite from initial physical uptake of water molecules to final chemical transition to its monohydrate is obtained with in-situ infrared spectroscopy, mass monitoring and X-ray diffraction. Despite strong affinity of CH3NH3
+ to water, CH3NH3PbI3 absorbs almost no water from ambient air. The hydrogen bonding is not established until the phase transition. The apparent inertness of H2O along with high stability of perovskite in ambient provides a solid foundation for its long-term application in solar cells and opto-electronics.
Introduction
Organic-inorganic hybrid perovskite CH3NH3PbI3 has shown a great potential for high efficiency low-cost solar cells and optoelectronic devices, but its chemical stability in ambient environments has hindered large-scale commercial application. CH3NH3PbI3was found to be very sensitive to environment, especially to water or moisture: the dark film of CH3NH3PbI3 turned yellow because of its decomposition to PbI2. In this work, we present a more complete picture of interaction of water with perovskite using first-principles vibrational dynamics and a comprehensive set of techniques which enable us to monitor in-situ the lattice vibrations, lattice structure and moisture uptake when perovskite is exposed to an environment with controlled humidity.
Experiment and Results
CH3NH3PbI3 thin films, single crystals, and its monohydrate (i.e. CH3NH3PbI3·H2O)were synthesized. It was first confirmed by XRD that the CH3NH3PbI3·H2O is the immediate hydrate of CH3NH3PbI3 under moisture treatment and such transition is reversible. FTIR was used to investigate the interaction between water molecule and CH3NH3PbI3 in situ. Fig. 1 shows the evolution of IR spectrum of CH3NH3PbI3·H2Owhen it was left in ambient air. As can been see, the CH3NH3PbI3·H2O gradually lost its crystalline water and the FTIR spectrum became identical to CH3NH3PbI3. This indicates that the monohydrate is metastable in ambient air and will convert back to perovskite.
79

Fig. 1. Evolution of IR spectrum of CH3NH3PbI3·H2O in ambient air
Although the transformation between CH3NH3PbI3·H2O and CH3NH3PbI3 is reversible, FTIR reveals a big difference between hydration and dehydration. Fig. 2 shows the evolution of FTIR spectrum when the decomposed monohydrate is exposed to the moist N2. In contrast to the dehydration process shown in Fig. 1, CH3NH3PbI3·H2O is not formed until about 300 seconds later despite rapid appearance of water absorption band at 3500 cm-1. This observation indicates that adsorbed water molecules do not transform perovskite to monohydrate immediately, while in the reverse dehydration process, water molecules do not stay with perovskite when monohydrate is decomposed. The phase transition to monohydrate is marked by the emergence of two sharp peaks on the top of broad band at 3500 cm-1, the relatively broad 1632 cm-1 band also diminishes. We can say that the transformation from CH3NH3PbI3 to CH3NH3PbI3·H2O requires two stages: initial physical water uptake and subsequent chemical phase transition.
Fig. 2. Evolution of IR spectrum of dehydrated monohydrate exposing to moisture
Conclusions
In conclusion, our study provides a better understanding of the water-perovskite Interaction. Water molecules penetrate CH3NH3PbI3 lattice and share the space with CH3NH3
+ up to 1:1 ratio. The interaction between CH3NH3+ and H2O through hydrogen
bonding is not established until the phase transition to CH3NH3PbI3·H2O. The lack of interaction in water-infiltrated perovskite is a result of dynamic orientational disorder imposed by tetragonal lattice symmetry.
References
[1] Z. Zhu, et al., "Interaction of organic cation with water molecule in perovskite MAPbI3: from dynamic orientational disorder to hydrogen bonding." Chem. Mater, vol. 28, pp. 7385-7393, 2016.[2] H. Snaith, "Perovskites: the emergence of a new era for low-cost, high-efficiency solar cells." JPCL, vol. 4, pp. 3623-3630, 2013.
80

DIRECT FABRICATION OF NANO-POROUS GOLD DISKS ON POLYDIMETHYLSILOXANE
Ibrahim Misbah1and Wei-Chuan Shih1,2,3,4*
1 Department of Electrical and Computer Engineering2 Program of Materials Science & Engineering
3 Department of Biomedical Engineering4Department of Chemistry
University of HoustonHouston, TX 77204-4005
Abstract
Nanoporous gold disks (NPGDs) architecture provides advantages over the commercially available SERs substrates and has found numerous application in the field of sensing. This paper demonstrates the fabrication of nanoporous gold disks on Polydimethylsiloxane (PDMS) substrate by spin coating. NPGDs fabricated on PDMS will find its application as a stretchable plasmonics substrate. NPGDs fabricated on PDMS requires higher oxygen plasma etching time than the traditional glass based fabrication process. The alloy disks fabricated on PDMS before dealloying shows the familiar two peaks. After dealloying, the fabricated NPGDs with 60nm thickness shows an extinction peak around ~930nm.
Introduction
Metal nanostructures exhibits plasmonic property that has wide applications ranging from optics and biomedicine to catalysis. Nanoporous gold disks has found intense research interest in recent years because of its bigger surface area, strong catalytic function, and plasmonic properties [1]. The plasmonic properties such as surface plasmon resonance (SPR) and localized surface plasmon resonance (LSPR) are dependent on the composition, shape and size. Previously, the substrates that has been used for fabrication of NPGDs were glass and silicon. In this work, we fabricate NPGDs on PDMS. PDMS is a mineral-organic polymer structure having carbon and silicon from the siloxane family.When PDMS is cured it becomes a hydrophobic elastomer. The elastic flexibility of PDMS coupled with the LSPR property of NPGDs should open another dimension in the application of NPGDs.
Fabrication Procedure
A spin coater was used to realize the PDMS membrane. At first the monomer and curing agent were mixed in the ratio of 10:1 in volume and were then degassed. Next, spin coating with a rotation speed of 4000 rpm for 5 minutes produced the uniform membrane. The glass slide containing the PDMS membrane were then thermally treated for curing at 150° C temperature for curing. After that 5 nm Ti and 3 nm of Au were deposited using the E-beam Evaporator to act as the adhesion layer. Co-Sputtering Deposition of gold and silver were done to deposit 80nm of alloy film in the ratio of 28-72. A monolayer of polystyrene beads of 460nm diameter were deposited. Oxygen plasma etching of 8 minutes 30 seconds were used at 200mTorr pressure. It should be noted here that it is one
81

of the crucial step in NPGDs fabrication on PDMS. Glass and Silicon substrates requires half of that time to etch the polystyrene beads away from each other. The alloy film not covered by polystyrene beads were ion milled in Argon gas for 120s. Polystyrene Beads were removed using sonication in water. Glass slides here provides the necessary support required for the removal of polystyrene beads. The alloy disks were then dissolved in 70% conc. Nitric Acid for 60s to finally realize the NPGDs on PDMS substrate.
Characterization
The SEM images of the NPGD and the array of NPGDs fabricated on PDMS are shown in Figure 1. We can see the porous structure in Fig. 1a . Figure 1b. shows the regular hexagonal semi-random array of NPGDs.
Fig. 1. (a) Single NPGDs with Nanoporous structure. (b) NPGDs on a semi-random array.
Fig 2 shows the extinction spectrum of the fabricated NPGDs. One extinction peak at ~915nm can be observed from the PDMS substrate. When a sample in the glass is fabricated in the exact same procedure it showed an extinction peak at 960nm. The apparent shift in extinction is due to the fact the glass substrate has a higher refractive index than PDMS.
Fig. 2. Extinction Spectrum of NPGDs
References
[1] Fusheng Zhao, Jianbo Zeng, Md Masud Parvez Arnob, Po Sun, Ji Qi, Pratik Motwani, Mufaddal Gheewala, Chien-Hung Li, Andrew Paterson, Uli Strych, Balakrishnan Raja, Richard C Willson, John C Wolfe, T Randall Lee, Wei-Chuan Shih, "Monolithic NPG nanoparticles with large surface area, tunable plasmonics, and high-density internal hot-spots", Nanoscale Vol. 6, Issue 14 , Pages 8199-8207.
82

ULTRA-FAST ENERGY STORAGE PROPERTIES OF CONJUGATED REDOX POLYMER: A MECHANISM STUDY
Fang Hao1 and Yan Yao1,2*1 Department of Electrical and Computer Engineering and Materials Science and
Engineering Program, University of Houston, Houston, Texas 77204, USA.2 Texas Center for Superconductivity at University of Houston, Houston, Texas 77204,
USA.
Abstract
We demonstrate that the polymer with higher conjugation degree offers faster energy storage capability and delivers 80% of its theoretical capacity at a rate of 50C. We also elucidate the underlying mechanism of charge storage in polymer cathode electrode by evaluating redox activity, electron conductivity, and ion transport. The result proves that both higher electron conductivity and faster ion transport from higher conjugated polymer contribute to faster charge storage properties.
Introduction
Lightweight, flexible, and wearable batteries are receiving active research attention inrecent years.[1] Organic polymers are among the most suitable materials for thisapplication as being intrinsically flexible, non-toxic, and potentially inexpensive.[2]
Organic polymer electrode materials, especially n-type cation-storing ones, traditionallyhad poor stability, low capacity, and slow electrode kinetics.[3] We have recently reported
-conjugated redox polymers with high cycling stability, high capacity utilization, andultra-fast energy storage capability.[4] The polymer electrodes deliver 80% of itstheoretical capacity at a rate of 50C even with a high active mass ratio of 80 wt.%, whichis unusually high for organic electrode materials. There is no established theory as forhow such performance can be achieved and optimized via molecular design andmicrostructure engineering.
Results and Discussion
In this work, we set out to scrutinize the charge storage mechanism of conjugated redoxpolymers and investigate the influence of molecular electronic structure and electrodemicrostructure on electrochemical performance. We have designed and synthesized aseries of polymers with largely similar structure but varying degree of conjugation in thebackbone, consisting of -conjugated TVT (dithienylvinylene) and the -nonconjugated TET (dithienylethane) comonomers as shown in Fig. 1.[5] The polymers are evaluated aspositive electrode materials for rechargeable Li cells. The morphology, redox reactionkinetics, electron conductivity, and ion transport of the polymers are measured andcorrelated to the cell performance. It is found that the identical functional groups in thesepolymers ensure that regardless of the degree of conjugation, the redox reaction of thepolymers proceed at similar rates, and the ion diffusion in the bulk material also happensat comparable rates. The electronic conductivity of the electrochemically reducedpolymers increases by 100-fold as the -conjugation degree of the polymers increases,agreeing with our previous observation based upon chemically doped polymers. The -conjugation degree of the molecular structures also determines the structural order and themicromorphology of the polymers. The electrochemical surface area of the polymerelectrode is continuously altered by the -conjugation degree, which in turn impacts the
83

ion diffusion model in the electrode. This study elucidates the underlying mechanism ofcharge storage in polymer electrode materials and provides guidance for furtheradvancing these materials high-energy/power energy storage applications.
Fig. 1. Structure of PNDI-TVTx copolymers. X indicates the nominal molar fraction percentage of the conjugated TVT versus non-conjugated TET units
References
[1] Ren, J., Zhang, Y., Bai, W., Chen, X., Zhang, Z., Fang, X., Weng, W., Wang, Y. and Peng, H. Angew. Chem., 2014, 126, 7998–8003.[2] Armand, M., Tarascon, J.-M. Nature, 2008, 451, 652-657.[3] Novak, P., Muller, K., Santhanam, K., Hass, O. Chem. Rev., 1997, 97, 207-281[4] Liang, Y., Chen, Z., Jing, Y., Rong, Y., Facchetti, A., Yao, Y. J. Am. Chem. Soc., 2015, 137(15), 4956-4959.[5] Erdmann, T., Fabiano, S., Milian-Medina, B., Hanifi, D., Chen, Z., Berggren, M., Gierschner, J., Salleo, A., Kiriy, A., Voit, B., Facchetti, A. Adv. Mater., 2016, 28, 9169-9174.
N
N
S
O S
N
N
S
S
O
O OR
R
O O
OOR
RR = C10H21
C8H17
TVT
TETx'
y
x' + y = 1
PNDI-TVTx (x = x' 100)
(Conjugated)
(Non-conjugated)
n
84

TOWARDS A FULL AQUEOUS CALCIUM-ION BATTERY FOR GRID ENERGY STORAGE
Saman Gheytani1 and Yan Yao1,2*1 Department of Electrical and Computer Engineering,
2 Texas Center for SuperconductivityUniversity of Houston
Abstract
Here, we introduce a new type of safe, fast, low-cost, and long-life aqueous electrolyte battery as a potential candidate for grid-scale electric energy storage. Using a redox-active and water-insoluble polyimide-based anode, (PNDIE) and calcinated cupper hexaferrocyanide (Ca-CuFePBA) as the cathode, we fabricated an aqueous rechargeable calcium-ion battery. Through the experiment confirmation, a highly reversible reaction with fast kinetics are presented during the storage of calcium ions by the anode and cathode electrodes. The rational combination of these two materials provides a high-rate and high-efficiency battery which can represents a promising prospect to meet the required power, cycle life, and energy efficiency arises from grid energy storage applications.
Introduction
In contrast to the battery used in portable electronic devices, the cost and safety are relatively more important in large-scale stationary energy storage systems, compared to the key factors such as energy density and cyclability.1 Divalent ion batteries have attracted more interest recent years which carry plus-two charges per single ion.2 Abundant calcium cations have been identified as a promising and low-cost candidate ion for transport of multiple electrons. However, a key issue toward multivalent ion insertion is the ion mobility in the host materials. We demonstrate the reversible electrochemical storage of Ca-ions by PNDIE as the anode electrode and a Prussian blue analog (PBA), as the cathode electrode into the aqueous electrolyte (Fig. 1). PNDIE and CuFePBA materials are both low cost, easy to prepare and environmentally friendly, offering an attractive chemistry for large-scale electric storage application.
Experiment Set up
PNDIE and CuFePBA both were prepared by a dehydration condensation reaction a simple co-precipitation method.3 The electrochemical investigation on the cathode and anode electrodes were performed in the three-electrode half-cell configuration using activated carbon as the counter electrode, Ag/AgCl as the reference electrode, and 2.5M
Fig. 1: Schematic illustrations of PNDIE//CaxCuHCF aqueous rechargeable calcium-ion battery operation
Discharge
e
PNDIE CuHCF
Ca2+
+
85

Ca(NO3)2 as the electrolyte (pH=4.7). For the full-cell measurement, the as-prepared cathode electrodes have been fully calcinated by applying a cathodic polarization before coupling with PNDIE anode.
Results
The electrochemical characterization revealed that the PNDIE can undergo an electrochemical enolization reaction through a reversible Ca2+ association–disassociation with the carbonyl groups of the imide molecules, delivering a high capacity at suitable anodic working potentials. Moreover, the intrinsic stability and insolubility of the PNDIE ensures that it is not dissolved in the electrolyte, and thus allows an excellent cycling stability and a high coulomb efficiency of 99.2%. Our elemental analysis also confirmed that calcium ions can be inserted into the open structure of CuFePBA upon its reduction and removed from the structure during the oxidation process both in a reversible manner. Based on these two chemistries, we have demonstrated the fabrication of an aqueous Ca-ion battery by coupling PNDIE and calcinated CaxCuFePBA as cathode electrode. In conclusion, a full Ca-ion battery using CaxCuFePBA cathode and PNDIE anode delivers a discharge voltage of 1.18 V and energy density of 47 Wh/Kg with excellent cycling (Fig. 2&3). The battery electrodes also fabricated based on low-cost and scalable synthesis procedures and they all are environment-friendly.
References
1. Dunn, B.; Kamath, H.; Tarascon, J.-M., Electrical Energy Storage for the Grid: A Battery of Choices. Science 2011, 334 (6058), 928-935.2. Wood Iii, D. L.; Li, J.; Daniel, C., Prospects for reducing the processing cost of lithium ion batteries. Journal of Power Sources 2015, 275, 234-242.3. Wessells, C. D.; Huggins, R. A.; Cui, Y., Copper hexacyanoferrate battery electrodes with long cycle life and high power. Nature Communications 2011, 2,550.
Fig. 2: Voltage profile of CaxCuFePBA//PNDIE full cell at1C current rate.
0.0 0.5 1.0 1.5 2.0 2.5 3.0 3.5 4.00.0
0.3
0.6
0.9
1.2
1.5
1.8
PNDIE II 2.5M Ca(NO3)2 II Ca-CuHCF
Volta
ge (V
)
Time (hour)
Fig. 3: The cycling performance of CaxCuFePBA//PNDIE full cell at 10C current rate
0 200 400 600 800 10000
10
20
30
40
Coul
ombi
c ef
ficie
ncy
(%)
Charge Discharge
Spec
ific c
apac
ity (m
Ah/g
)
Cycle number
80
85
90
95
100
86

FAST GPU-BASED SNAKES FOR MASSIVE 2D/3D IMAGES
M. Lotfollahi and D. MayerichDepartment of Electrical and Computer Engineering
University of HoustonHouston, TX 77204-4005
Abstract
Snakuscules are simple region-based active contours parameterized by two points that act as extremely fast and simple two-dimensional blob detectors. While this method has applications in cell localization and counting, this framework is still too slow for large 2D images and video. In addition, calculating the necessary integral makes 3D application impractical. We overcome this challenge using Monte Carlo sampling combined with GPU computing to significantly reduce computation time.
Introduction
The region-based snake defines a pair of concentric disks by two points shown in Fig.1.The snake minimizes an energy functional that balances the weighted inner area against the weighted outer area. It favors a high contrast between the image values averaged over the inner disk. The weights are directly set to the image values, with the positive sign for the annulus and negative sign for the disk [1].
(1)
where is an image, is the outer radius with the center and determines the constant ratio of disks. In order to minimize (1) in a
uniform area, , two energy subterms should cancel each other which results in . To avoid snake from expanding or shrinking forever, energy should be normalized to be independent of its external radius by .
The final energy is simplified by replacing integral with sigma and defined as:(2)
Where and function is a differentiable weight function shown in Fig.2. The snake evolves by movements of and on opposite direction of in order to minimize energy using gradient descent.
Materials and methods
Regarding cell counting, snakes can congregate on the image with no hideouts. They are evolving independently to find their close light blob. It can be done more efficient and faster using GPU-framework by assigning one snake to one thread to grow. Eventually, energy of snakes with overlaps are compared and the one with lower energy survives.
87

Figure 1: Snake defined by 2 points p and q Figure 2: weight function
In order to speed up calculation of contour evolution, Monte Carlo integration is used to estimate the integral values. Samples are chosen randomly inside the disk and annulus using uniform distribution. Therefore, sum over all points in the contour is replaced with average sum of samples. The more samples, the more accurate and closer result to real integrals.
Results
The method is applied on a DAPI stained rat brain tissue. The final configuration with/without Monte Carlo sampling is shown in Fig.3.
Figure 3: The result of snake evolution. Left: GPU implementation, Right: GPU implementation combined with Monte Carlo integration using 1000 samples.
Based on the profiling result, GPU accelerates computations by 50 times in compare with running as sequential. Also, Monte Carlo integration using 1000 samples decreases GPU running time by 4.
Conclusion
The result demonstrates that GPU implementation and Monte Carlo sampling make the algorithm more efficient and practical for large 2D and 3D images by decreasing the computation time.
References
[1] T.Philippe, and M.Unser. "Snakuscules." IEEE Transactions on image processing 17.4 (2008): 585-593.
88

AUTHOR INDEX
Name Page Poster
Abolhassani, Mehdi 3 A2
Akdogan, Mehmet Emin 3 A2
Arnob, Masud Parvez 69, 77 D2, D6
Awale, Apeksha 45 C1
Baldelli, Steven 79 D7
Bao, Jiming 79 D7
Basu, Prithvi 47 C2
Becker, Aaron T. 37, 43, 51, 53, 55, 57, 59 B8, B11, C4, C5, C6, C7, C8,
65, 69 C11, D2
Brankovic, Stanko R. 67, 71 D1, D3
Brantley, Justin A. 25 B2
Burbage, Mary C. 57 C7
Cao, Bo 79 D7
Charlson, Joe 35 B7
Chen, Jinghong 33, 35 B6, B7
Contreras-Vidal, Jose L. 23, 25 B1, B2
Council, O. H. 29 B4
Dani, John 45 C1
Donnelly, Vincent M. 47 C2
Economou, Demetre J. 47 C2
Fan, Qingjun 33 B6
Fang, Hui 79 D7
Fekete, Sándor 43, 59 B11, C8
Feng, Yulang 33 B6
Freundlich, Alexandre 75 D5

AUTHOR INDEX
Name Page Poster
Fu, Xin 7 A4
Gheewala, Mufaddal 45 C1
Gheytani, Saman 85 D10
Goli, Preetham 5 A3
Gu, Yunan 9 A5
Guloy, Arnold M. 79 D7
Guo, Jiaming 49 C3
Guo, Rui 79 D7
Hadjiev, Viktor G. 79 D7
Han, Zhu 9, 11 A5, A6
Hao, Fang 79, 83 D7, D9
Heffernan, Michael 37 B8
Hogan, Matthew K. 69 D2
Horner, Philip J. 69 D2
Hu, Yandi 79 D7
Huang, Li 51 C4
Huang, Qicheng 1 A1
Jackson, D. R. 29 B4
Jonnalagadda, Venu 45 C1
Karlapudi, Uday Kiran 35 B7
Kaushik, Rajashekara 1 A1
Kharel, Khim 75 D5
Kim, Hoyeon 53 C5
Kim, Min Jun 51, 53 C4, C5
Krupke, Dominik 43, 59 B11, C8

AUTHOR INDEX
Name Page Poster
Kusko, Rebecca 45 C1
Leclerc, Julien 65 C11
Li, Jiabing 17 A9
Li, Jingting 39 B9
Li, Lianyang 27 B3
Li, Wenzhi 79 D7
Li, Yang 79 D7
Liu, Xin 37 B8
Long, S. A. 29 B4
Lonsford, Jarrett 53 C5
Lotfollahi, M. 87 A12
Lu, Hengyang 19 A10
Luu, Trieu Phat 25 B2
Mahadev, Arun V. 55, 59 C6, C8
Manjunath, Madhuri 45 C1
Mankar, Rupali 15 A8
Manzoor, Sheryl 53 C5
Mayerich, David 13, 15, 17, 21, 49, 63, 87 A7, A9, A11, C3, C10, A12
Ming, Ya 47 C2
Misbah, Ibrahim 81 D8
Motwani, Pratik 45 C1
Mukherjee, Srijani 21 A11
Ngo, N. 41 B10
Nguyen, An 43 B11
Nguyen, Hoang 69 D2
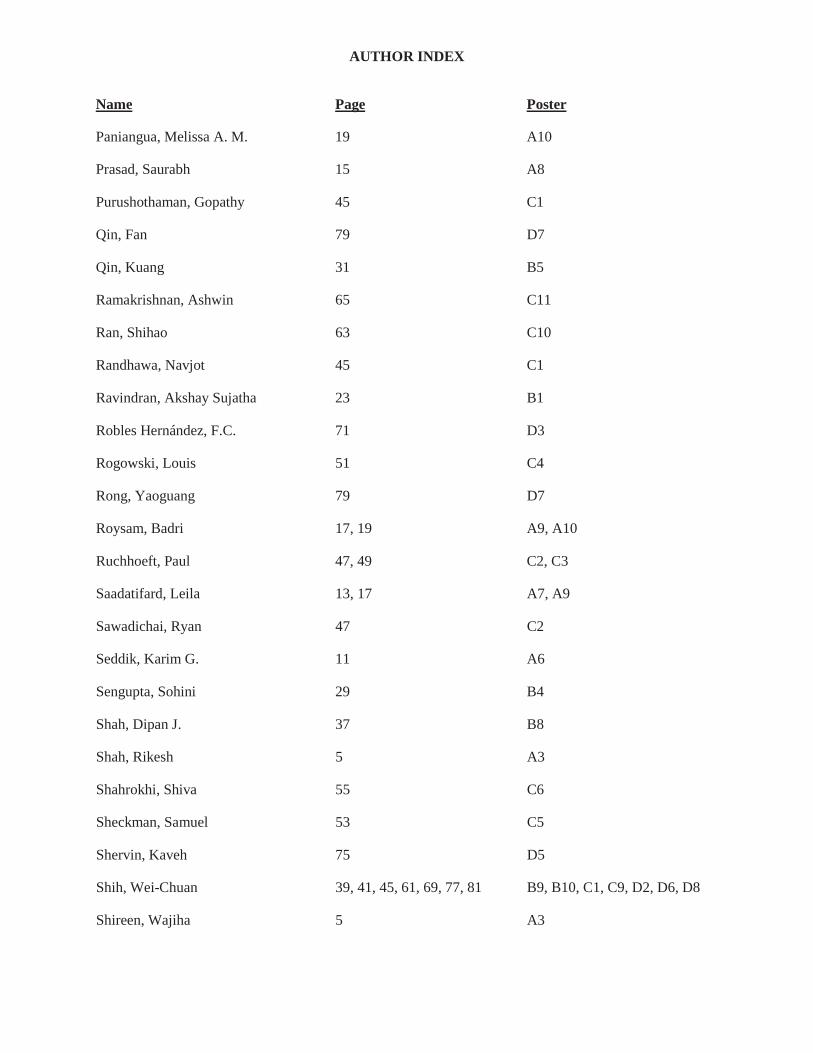
AUTHOR INDEX
Name Page Poster
Paniangua, Melissa A. M. 19 A10
Prasad, Saurabh 15 A8
Purushothaman, Gopathy 45 C1
Qin, Fan 79 D7
Qin, Kuang 31 B5
Ramakrishnan, Ashwin 65 C11
Ran, Shihao 63 C10
Randhawa, Navjot 45 C1
Ravindran, Akshay Sujatha 23 B1
Robles Hernández, F.C. 71 D3
Rogowski, Louis 51 C4
Rong, Yaoguang 79 D7
Roysam, Badri 17, 19 A9, A10
Ruchhoeft, Paul 47, 49 C2, C3
Saadatifard, Leila 13, 17 A7, A9
Sawadichai, Ryan 47 C2
Seddik, Karim G. 11 A6
Sengupta, Sohini 29 B4
Shah, Dipan J. 37 B8
Shah, Rikesh 5 A3
Shahrokhi, Shiva 55 C6
Sheckman, Samuel 53 C5
Shervin, Kaveh 75 D5
Shih, Wei-Chuan 39, 41, 45, 61, 69, 77, 81 B9, B10, C1, C9, D2, D6, D8
Shireen, Wajiha 5 A3

AUTHOR INDEX
Name Page Poster
Solanki, Dhaivat J. 67 D1
Song, Lingyang 11 A6
Sultan, Radwa 11 A6
Sung, Yulung 61 C9
Tan, Jingweijia 7 A4
Tang, Yuxuan 33 B6
Tang, Zhongjia 79 D7
Tisa, Tamanna Afrin 45 C1
Tsekos, Nikolaos V. 37 B8
Varadarajan, Navin 17, 19 A9, A10
Venkatesan, Swaminathan 79 D7
Walsh, Michael 15 A8
Wang, Yanan 79 D7
Wang, Zhiming 79 D7
Wolfe, John C. 45, 69 C1, D2
Wosik, Jarek 31, 35 B5, B7
Yan, Kaige 7 A4
Yang, W. 71 D3
Yao, Yan 73, 79, 83, 85 D4, D7, D9, D10
Zagozdzon-Wosik, Wanda 35 B7
Zaid, Habib M. 37 B8
Zenasni, O. 41 B10
Zhang, Huaqing 9 A5
Zhang, Xingyao 7 A4
Zhang, Yanru 9 A5

AUTHOR INDEX
Name Page Poster
Zhang, Ye 73 D4
Zhao, Haoran 37 B8
Zhu, Zhuan 79 D7
Zouridakis, George 27 B3
Zuo, Zhiheng 33 B6