ebd, lbd, lsb and seb users manual 2013 · the lbd and ebd are edgewise bargraphs and the ebd can...
TRANSCRIPT


2
Contents How to Use This Manual …………………………………………………………... 1. Overview of Features and Functionality 1.1 Introduction …………………………………………………………….. 1.2 Features ………………………………………………………………… 1.3 Functional Overview …………………………………………………… 1.4 Common Questions ……………………………………………………..
1.5 Revision History ……………………………………………………...... 2. Typical Connections 2.1 Wiring Diagrams ……………………………………………………...... 2.2 Connecting Power and Signal ………………………………………….. 2.3 Control, Communication and Power Outputs ………………………….. 3. Serial Communications 3.1 Serial Communications Port Settings ………………………………….. 3.2 Connecting to the Unit …………………………………………………. 3.3 Sending Serial Commands ……………………………………………... 3.4 Command Set …………………………………………………………... 4. Calibration and Linearization 4.1 Analog Input Field Calibration ………………………………………… 4.2 Analog Input Full Factory Calibration …………………………………. 4.3 Analog Output Calibration ……………………………………………... 4.4 Linearization Tables and Polynomials …………………………………. 5. Installation 5.1 LBD & EBD Installation ………………………………………………. 5.2 LSB & SEB Installation ………………………………………………... 6. Quick Reference 6.1 Troubleshooting ………………………………………………………... 6.2 ASCII Table ……………………………………………………………. 6.3 Mechanical Drawings ………………………………………………….. 6.4 Ordering Information …………………………………………………...
3
4 4 4 5 5
6 7 7
9 9 9
10
15 15 18 19
20 21
21 22 22 23

3
HOW TO USE THIS MANUAL
This manual details the operation of all models LBD, EBD, LSB, and SEB pictured on the front cover. Due to the variety of options and displays that can be ordered, portions of this manual that do not apply to your specific unit may be skipped. Material is presented in five sections: Introduction, Hardware Options, General Operation, Mechanical and Ordering Information.
Introduction - This section covers the basics of using the meters. All information necessary to unpack the unit and establish communications can be found here. Also covered is the basic command format and operating mode characteristics.
Hardware Options - Connection diagrams for all options are located here. The easy to read diagrams show how to connect inputs, outputs, communication lines, and power supplies.
General Operation - All data handling operations are covered in this section. From analog inputs (A/D) to analog outputs (DAC), linearization to tare, bang-bang control, this section covers the bulk of the functions and operating methods.
Reference - Connection/wiring diagrams, a troubleshooting guide, command list, ASCII codes, application notes, and technical data can be found in this section.
Mechanical - Here you’ll find the mounting and mechanical specifications. The ordering information is also included for you to check your model number versus features included.
Should any problems arise while setting up the controller, please refer to the troubleshooting section found at the end of this manual.
The information provided in this manual is copyrighted by OTEK Corporation. This documentation is licensed and not sold.
OTEK Corporation reserves the right to make changes to any product without further notice to improve reliability, function, or design. OTEK Corporation devices are not authorized for use as components in life support devices.
Copyright © OTEK Corporation, September 1, 2016. All rights reserved.
Printed in the United States of America.
4
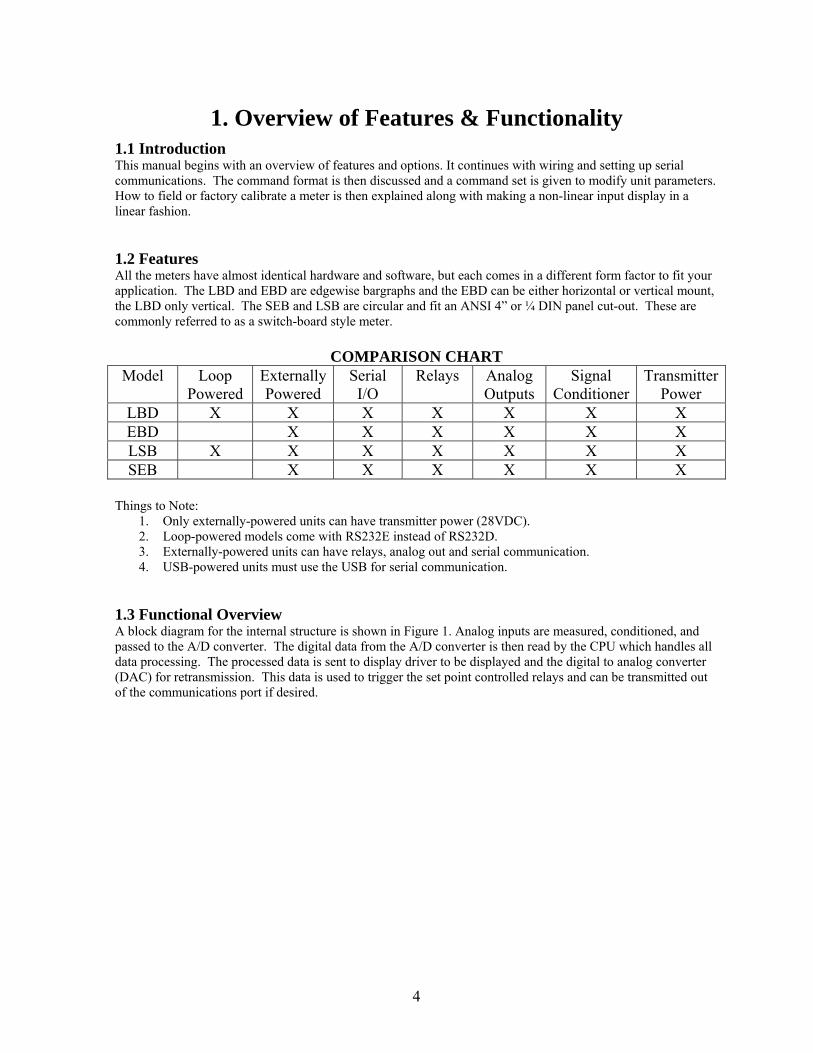
1. Overview of Features & Functionality 1.1 Introduction This manual begins with an overview of features and options. It continues with wiring and setting up serial communications. The command format is then discussed and a command set is given to modify unit parameters. How to field or factory calibrate a meter is then explained along with making a non-linear input display in a linear fashion. 1.2 Features All the meters have almost identical hardware and software, but each comes in a different form factor to fit your application. The LBD and EBD are edgewise bargraphs and the EBD can be either horizontal or vertical mount, the LBD only vertical. The SEB and LSB are circular and fit an ANSI 4” or ¼ DIN panel cut-out. These are commonly referred to as a switch-board style meter.
COMPARISON CHART Model Loop
Powered Externally Powered
Serial I/O
Relays Analog Outputs
Signal Conditioner
Transmitter Power
LBD X X X X X X X EBD X X X X X X LSB X X X X X X X SEB X X X X X X
Things to Note:
1. Only externally-powered units can have transmitter power (28VDC). 2. Loop-powered models come with RS232E instead of RS232D. 3. Externally-powered units can have relays, analog out and serial communication. 4. USB-powered units must use the USB for serial communication.
1.3 Functional Overview A block diagram for the internal structure is shown in Figure 1. Analog inputs are measured, conditioned, and passed to the A/D converter. The digital data from the A/D converter is then read by the CPU which handles all data processing. The processed data is sent to display driver to be displayed and the digital to analog converter (DAC) for retransmission. This data is used to trigger the set point controlled relays and can be transmitted out of the communications port if desired.

5
Figure 1: A simplified internal structure of the controller
1.4 Common Questions What are its applications? It is extremely versatile, use it for:
Loop powered monitoring of process variables Bang-bang (on/off) control Process control Proportional control Smart remote display Part of a DCS/SCADA
Do I have to learn a programming language to use the controller? No. Your model can ship from the factory preconfigured so all you need to do is hook it up. If changes need to be done in the field, all settings are user-configurable with an easy command structure. Connecting to the unit can be done through HyperTerminal™ or any terminal emulator. 1.5 Revision History Date Edition Description Software Edition November 2005 1st New Publication 1.0 February 2009 2nd Updated Entire Manual EBD&SEB 2.3, LSB 2.X January 2010 3rd Update Manual for TBD EBD&SEB 2.7 ,LSB 2.X April 2012 4th Updated Entire Manual EBD&SEB 2.7, LSB 2.X August 2013 4th Typical Connections, Order Info. EBD&SEB 2.7 LSB 2.X September 2013 4th Updated 2.24 & Typ. Conn EBD&SEB 2.7 LSB 2.X March 2015 4th Updated Sect. 2.2.2 EBD&SEB 2.7 LSB 2.X

6
2. Typical Connections WARNING! Please refer to your model number and the ordering information found at the end of this manual to determine your power and signal input. Connecting the wrong power or signal to the meter can potentially damage the instrument. 2.1 Wiring Diagrams
Figure 2: Connection Diagrams

7
2.2 Connecting Power and Signal Please refer to the ordering information found at the end of this manual to correctly determine your power and signal type. Before connecting, always turn off the power source or the loop! 2.2.1 Loop-Powered: (Only for LCD models.) The unit derives its power from the
Loop. Serial communication is RS232E. LBD LSB + Loop TS1:1 TS2:3 - Loop TS1:2 TS2:4
2.2.2 External Power 5VDC:
LBD & EBD LSB & SEB + Signal TS1:4 TS2:1 - Signal TS1:3 TS2:2 + 5VDC TS1:1 TS2:4 5VDC Return TS1:2 TS2:3
2.2.3 External Power 10-32VDC or 18-72VDC:
LBD & EBD LSB & SEB + Signal TS1:4 TS2:1 - Signal TS1:3 TS2:2 + VDC TS5:1 TS1:1 - VDC (Return) TS5:2 TS1:3
2.2.4 External Power 100-240VAC (47-63Hz):
LBD & EBD LSB & SEB + Signal TS1:4 TS2:1 - Signal TS1:3 TS2:2
AC HIGH TS5:1 TS1:1 AC LOW TS5:2 TS3:3
2.2.5 USB Power: Connect type B USB cable to meter and type A to computer.
LBD & EBD LSB & SEB + Signal TS1:4 TS2:1 - Signal TS1:3 TS2:2 + 5VDC USB:1 USB:1 Ground USB:4 USB:4
2.2.6 Power Output for 4-20mA transmitter:
LBD & EBD LSB & SEB + Loop Out (+28VDC) TS1:3 TS1:2
+ Loop In TS1:4 TS1:1 Power connections remain the same as in previous sections.
2.2.6 Intrinsically Safe by Design not certified (I.S.):
Same as 2.2.1. Limited to 28VDC and 36mADC. 2.3 Control, Communication and Power Outputs Please refer to the ordering information found at the end of this manual to correctly determine your control, communication and power outputs, if present.
2.3.1 Isolated Analog Output: The analog output has a 1K Ω load maximum for current output and a 10K Ω minimum for voltage output. Current or voltage output is selectable through internal jumpers.
LBD & EBD LSB & SEB

8
+ Loop / +VDC TS2:1 TS2:5 - Loop / -VDC TS2:2 TS2:6
2.3.2 Relay Outputs: N.O. = Normally Open contact, C = Common and N.C. = Normally Closed Contact. Maximum load is 1A Resistive@120VAC or 100mA@30VDC, internally transorb protected.
LBD & EBD LSB & SEB RELAY 1 N.O. TS4:1 TS3:1 RELAY 1 C TS4:2 TS3:2 RELAY 1 N.C. TS4:3 TS3:3 RELAY 2 N.O. TS4:4 TS3:4 RELAY 2 C TS4:5 TS3:5 RELAY 2 N.C. TS4:6 TS3:6 RELAY 3 N.O. TS4:7 TS3:7 RELAY 3 C TS4:8 TS3:8 RELAY 3 N.C. TS4:9 TS3:9 RELAY 4 N.O. TS4:10 TS3:10 RELAY 4 C TS4:11 TS3:11 RELAY 4 N.C. TS4:12 TS3:12
2.3.3 Open Collector Transistors (O.C.T): Normally “OFF”, these transistors have a max sink current of 100mA and a max collector voltage of 30VDC. Total max current available from meter is 100mA@5VDC. All emitters are common to ground.
LBD & EBD LSB & SEB O.C.T. #1 TS4:1 TS3:1 O.C.T. #2 TS4:2 TS3:2 O.C.T. #3 TS4:3 TS3:3 O.C.T. #4 TS4:4 TS3:4 GROUND TS4:11 TS3:11 +5VDC TS4:12 TS3:12
2.3.4 RS485: Always terminate bus with 120 ohm resistor across A & B on first and last units.
LBD & EBD LSB & SEB A RS485:2 TS2:7 B RS485:1 TS2:8 GROUND RS485:3 TS2:9
2.3.4 RS232 & USB: Per industry standard.

9
3. Serial Communications The meter offers several options for communication. Please refer to the ordering information found at the end of this manual to correctly determine your communication option. 3.1 Serial Communications Port Settings The meter supports the use of RS-232D or E, RS-485 and USB. The factory preset communication settings are: 9600 baud, 1 start bit, 8 data bits, no parity, 1 stop bit, no flow control (8N1). A terminal emulator works best if set to TTY emulation. 3.2 Connecting to the Unit With the serial communication lines properly connected and your terminal emulator powered connected, apply power to the unit. The following power-on message will be transmitted: LBD/EBD by OTEK VERSION X.X ADDRESS: “000” Warming-up…done * If this message does not appear, check to make sure the proper connections have been made to the unit. Also make sure the proper baud rate, flow control and COM port settings are selected in any communication software being used. If necessary, hardware flow control may be used with serial communications. The RTS and CTS lines on the DB9 connecter will need to be shorted together. This simulates hardware handshaking but handshake signals are not being generated. The PC will send and receive serial data as if the unit was generating the proper signals. 3.3 Sending Serial Commands All commands sent to the unit must be preceded by the letter ‘S’ and the unit’s address. Since each controller can be assigned a unique address, multiple units can be on the same communication lines without interfering with each other. The current address for the unit is shown in its power-on message and is by default “000”. Commands are not case-sensitive, and ASCII characters are automatically converted to uppercase. A command will be processed after a Carriage Return (<CR>) is sent. Commands that are accepted and understood by the unit will be answered with an ‘*’. Commands not accepted or not understood will be answered with a ‘?’ after the <CR>. The following command format is used to send commands to the meter: S<ADDRESS><COMMAND><PARAMETER> For example, to change the unit’s address, use the following command: S000ADDR123 This would change the unit’s address from the default of “000” to “123”. Before changing anything, print the unit’s present configuration for reference. You can do this by giving the following command: S<ADDRESS><SHOW> To save the unit’s current configuration, a write command must be sent. After the write command, all previous settings will be overwritten, so make sure the unit is behaving in the desired manner before issuing a write command.

10
3.4 Command Set COMMAND WHAT IT DOES EXAMPLE ADDR[address] This command changes the unit’s address.
The address must be in ASCII and have a minimum of two and a maximum of six characters. If the command is given without an argument, the address is changed to NULL meaning the unit has no address. Leading zeros are stripped from the assigned address. Note: the unit will always respond to “000” the default address.
S000ADDR045 This command changes the units address from 000 to 45. The unit will now only respond when S45 or S000 precedes a command. S45ADDR This sets the unit’s address to NULL. Even though the address is now NULL ‘S’ must still precede every command sent to the unit.
AVG1[sample] This command is used to average x number of samples before displaying them or sending them over the serial port. Valid arguments are 0, 4 and 16.
S000AVG0 This turns the built in averaging off. S000AVG4 This activates the running averager for 4 samples.
BAUD[baudrate] This command changes the baud rate of the unit. After execution of this command the unit changes its baud rate immediately, so the subsequent commands must be sent with the new baud rate. The default baud rate is 9600, and valid arguments are 1200, 2400, 4800, 9600, 19200 or 19.2K. Don’t forget to change your PC’s baud rate.
S000BAUD19.2K This changes the unit’s baud rate from 9600 to 19200.
BFS1 This command controls the bargraphs full scale or the maximum value the bargraph can display. This command only affects the bargraph. See DMODE for different bargraph display options.
S000BFS1 5 This command will change the bargraph full scale to 5.
BZ1 This command controls the bargraphs zero location. By default, it is 0, but changing it to 0.2 would mean that the bargraph will only start lighting when 0.2 is exceeded. This command only affects the bargraph.
S000BZ1.2 This command will change the bargraph starting point to 0.2.
CH1[ON/OFF] This command turns the A/D input on or off. With the input off, the CHN1 command can be used to remotely control the unit.
S000CH1OFF Unit can now display ASCII Strings.
CHN1[XXXX] This command will display an alphanumeric value that is 4 characters long. Note: If the character is invalid (cannot be shown on 7 segments) the LBD will not accept it.
S000CHN1PASS This command will display the word PASS on the display.

11
DCOLOR1[COLOR] This command changes the color of the
bargraph or backlight when a limit is not being exceeded. It works as the color when the unit is in a normal state. The colors are RED, AMBER, GREEN
S000DCOLOR1RED This will change the bargraph display color to red, when a limit is not being exceeded.
DEFAULT This command resets the unit back to its factory defaults. This command has no arguments. Note: Print “show” before you do default.
S000DEFAULT WARNING! This will reset the unit and erase the EEPROM data. All user settings will be lost upon execution of this command.
DELAY[limit][n] This command controls the amount of time a limit must be exceeded before the relay will activate. The value can be set in 100mS increments. 0 <= N <= 255
S000DELAYHH14 The HiHi limit will have to be exceeded for more than 400mS for the relay to toggle and the bargraph color to change.
DFIX1[n] This command sets the decimal point on the display. Valid arguments are 0, 1, 2, 3 and 4.
S000DFIX1 This will select the first decimal point on the display (1XXX.X).
DH1[n] This command will set the DAC hi limit. This is the value in mA that the DAC is not allowed to exceed. N <= 24mA
S000DH119 This will set the DAC hi limit to 19mA, the DAC will not be allowed to exceed this value.
DIAG This command runs the diagnostic test on the display. This command does not have any arguments.
S000DIAG This will test the display by running through a display diagnostic.
DINT (Only for LED Versions)
This command controls the display intensity. Valid Arguments are 0-9.
S000DINT5 This would set the display intensity to %50.
DL1[n] This command will set the DAC low limit. This is the value in mA that the DAC is not allowed to go below. N >= 0mA
S000DL12 This will set the DAC low limit to 2mA, the DAC will not be allowed to go below this value.
DLFLASH This command will turn on the display flashing if a limit is exceeded.
S000DLFLASH Limit flashing is on.
DLNFLASH This command will turn off the display flashing if a limit is exceeded.
S000DLNFLASH Limit flashing is off
DLIM[on/off] This command turns the limit marks for the bargraph on or off.
S000DLIMON Limit marks are displayed.
DMODE1[mode] This command changes the format of the bargraph. “BOT” is a bottom-to-top display, “TOP” is a top-to-bottom display and “BI” is a bidirectional display with the bargraph 0 being in the center.
S000DMODE1BI This will set the display format to bidirectional.
DOFFSET1[n] This command is used to offset the DAC output. By default, this is 0mA, and 4-20mA in equals 4-20mA out. -1999 <= n <= 9999 DAC output = (DSCALE)(INPUT)+DOFFSET)
S000DOFFSET14 This command will offset the DAC 4mA. If your output is 4mA after this command it would be 8mA.
DSCALE1[n] This command is used to scale the DAC output. By default this is 1 and 4-20mA in equals 4-20mA out. -1999 <= n <= 9999 DAC output = (DSCALE)(INPUT)+DOFFSET)
S000DSCALE12 This command will scale the DAC by a factor of 2. If your output was 4mA after this command it would be 8mA

12
DSYM[ON/OFF] This command is for EBD & SEB bargraphs only. If set to on, the bargraph will change to the limit color. If set to off, the bargraph will only change to the limit color after the set point.
S000DSYMON This will have the unit’s entire bargraph change to the limit color.
HELP When this command is sent to the unit, it will respond with a list of valid commands. This command does not have any arguments.
S000HELP The unit will respond with a list of all commands.
H1[n] This command sets the Hi limit. -1999 <= n <= 9999 HH > H > L > LL
S000H180 This changes the Hi limit value to 80.
HD1[color] This command changes the Hi limit alarm color. When the limit is exceeded, this is the color the bargraph (or backlight) display will change to. color = red, amber, green
S000HD1AMBER This command will change the Hi limit color changing to amber.
HH1[n] This command sets the HiHi limit. -1999 <= n <= 9999 HH > H > L > LL
S000HH190 This changes the HiHi limit value to 90.
HHD1[color] This command changes the HiHi limit alarm color. When the limit is exceeded, this is the color the bargraph (or backlight) display will change to. color = red, amber, green
S000HHD1RED This command will change the hi limit color changing to red.
HOLD[ON/OFF]
This command holds the last displayed value by turning off the A/D converter. Valid commands are ON or OFF.
S000HOLDON This command will cause the unit to hold the last value on the display.
HYST1[n] This command sets the limit hysteresis. This is mainly used for the relay outputs with a noisy signal input. The hysteresis is a dead zone around the limit that the value must exceed before the limit actions will be triggered. The hysteresis is defined in counts. 0 <= n <= 9999
S000HYST1.25 This will change the limit hysteresis to .25. This means that the limit will have to be exceeded by .25 counts before the relay will activate.
L1[n] This command sets the Low limit. -1999 <= n <= 9999 HH > H > L > LL
S000L120 This changes the Low limit value to 20.
LD1[color] This command changes the Low limit alarm color. When the limit is exceeded this is the color the bargraph (or backlight) display will change to. color = red, amber, green
S000LD1AMBER This command will change the Low limit color changing to amber.

13
LIN1[n] This command turns on the internal
linearization for thermocouple or user-defined tabled and polynomials. Valid inputs are OFF, TZ, RTDC, ANSI, PZ, JC, KC and TC. TZ=user table PC=user polynomial RTDC=0.00385 (DIN) PT100 ANIS=0.00392 TC JC=type J degrees C TC=type K degrees C
S000LIN1ANSI This command will change the Linearization to ANSI RTD. To display degree F instead of C do the following. Set scale to 1.8 and offset 32. S000SCALE11.8 S000Offset132
LL1[n] This command sets the LowLow limit. -1999 <= n <= 9999 HH > H > L > LL
S000LL110 This changes the LowLow limit value to 10.
LLD1[color] This command changes the LowLow limit alarm color. When the limit is exceeded, this is the color the bargraph (or backlight) display will change to. color = red, amber, green
S000LLD1RED This command will change the LowLow limit color changing to red.
LIM[ON/OFF] This command will turn the limit checking on or off. If limit checking is turned off the bargraph won’t change color and the relays will not change state.
S000LIMOFF This turns off limit checking.
LOC This command is the equivalent to ECHO ON; the unit will send back everything that is transmitted to it.
S000LOC This command will cause the unit to echo back everything that is sent to it.
NET This command is the equivalent to ECHO OFF; the unit will only respond when it is directly queried
S000NET This command will cause the unit to only respond when it is directly queried.
OFFSET1[n] This command adds the offset specified to the value processed by the A/D conversion. This command can be used just like the hardware offset. Valid arguments are any number in the range -1999 to 9999. Offset will also accept the decimal representation of a fraction.
S000OFFSET100 This will offset the number displayed by positive 100
PEAK[ON/OFF] This command turns peak detection on or off. With peak detection off, the display constantly changes to reflect the changing A/D result. When peak detection is on, the unit will only display the peak value i.e. the highest value currently detected. Valid arguments are ON or OFF. When you use the command SHOW and peak is on, the peak value will be shown. NOTE: For faster sampling rates, contact OTEK.
S000PEAKON The unit will now only display the largest value thus far obtained from the A/D conversion.

14
POLL[ON/OFF] This command is used to enable/disable
the polling for status command. If poll is off, then a continuous serial representation of the LCD information is being broadcast (in a RS-485 network no polling “POLLOFF” is not advised, the constant transmission of data will overwhelm the network). If poll is on, then the unit is awaiting the status command to send data to the serial port. Valid arguments are ON and OFF (see status command).
S000POLLON This command will cease the constant broadcast of serial data from the unit. The unit will still accept all commands but will only send A/D information when the status command is used.
SCALE1[n] This command scales the output displayed on the LCD using a multiplying factor. This can be used in a similar way as the hardware scale. The final result is in the form:
(A/D result) * (scale) = displayed value
Valid arguments are -1999 to 9999.
S000SCALE2 This command will multiply the final A/D result by a factor of 2 and display it on the LCD.
SETA[n][x] This command sets the coefficients of the user polynomial. The polynomial is of the form: OUTPUT = A9X
9 + A8X8 + A7X
7 + A6X6 +
A5X5 + A4X
4 + A3X3 + A2X
2 + A1X + A0
S000SETA012.3 This would set the A0 term of the polynomial to 2.3.
SETX[n][x] This command sets the nth variable to the value specified by x in the X portion of the X-Y table.
S000SETX0 1 This command will set the first x value in the table to 1.
SETY[n][y] This command sets the nth variable to the value specified by y in the Y portion of the X-Y table.
S000SETY0 1 This command will set the first y value in the table to 1.
SHOW This command will show the settings for all user-programmable features on the unit. The command accepts no arguments.
S000SHOW The unit will then respond with a listing off all programmed settings and their current value.
SHOWPOLY This command will show the current user polynomial.
S000SHOWPOLY
SHOWTABLE This command will show the current X-Y table.
S000SHOWTABLE
STATUS[n] This command triggers the unit to send the last ‘n’ numbers processed by the A/D conversion. The valid inputs are in the range from 1 to 9.
S000STATUS4 After executing this command the unit will send back the last 4 values processed by the A/D conversion. (See POLL)

15
TARE1[ON/OFF] This is the tare value subtracted from the
processes A/D conversion. When tare is on, the current processed value is taken as the tare value. From this point on, the tare value is subtracted from every processed A/D value. When tare is off, the subtraction no longer occurs. Valid arguments are ON or OFF.
S000TAREON If the current A/D value was 200 and a subsequent value after the command was issued was 400 then the unit would show and transmit 200.
WRITE This command writes the current configuration data to the EEPROM. This allows the unit to go back to the user- programmed settings when power is lost. If this command is not issued after user configurable settings have been changed, the next time the unit is powered down, these settings will be lost. There are no arguments for this command.
S000WRITE This command saves the user configurable settings to EEPROM. These settings are address, baud, averaging, echo, tare, scale, offset, polling and decimal point.
4. Calibration and Linearization
The meter has 2 potentiometers found on the back of the unit that can be used to tweak the zero and span. If you are unable to calibrate using the potentiometers, a Full Factory Calibration may need to be done. 4.1 Analog Input Field Calibration The following procedure explains how to calibrate using the potentiometers.
1) Apply your zero signal and adjust the zero potentiometer so the meter reads the desired value. In the case of a 4-20mA loop, your zero value is usually 4mA. 2) Apply your full-scale signal and adjust the span potentiometer so the meter reads the desired full- scale value. 3) Check your zero and repeat steps 1-3 if necessary.
4.2 Analog Input Full Factory Calibration
4.2.1 Overview for Calibration The meter has 1 analog input channel. This analog input has 2 sets of calibration data; factory calibration and user calibration. If either of these is incorrect, then the unit will not display the correct information. Both factory and user calibration use the following linear equation to scale and offset the reading:
Y = (m*X) + b
In this equation, X is your input, m is the scale factor, b is the offset and Y is the output. So the equation would then look like this to more closely correspond to the meter’s command terminology:
(Value Displayed) = ( (Scale) * (input) ) + Offset
For example if you have a 4-20mA input and you want this to equal 0-100% then:
Scale = 6.25 Offset = -25

16
(4*6.25) -25 = 0 (20 * 6.25) -25 = 100
The downloadable Excel spreadsheet from our website will help you to easily calculate the scale and offset values needed. Otherwise, the following examples serve as an explanation for how to calculate the values by hand.
To communicate with the meter, you will need a computer with a terminal emulation program. Windows comes standard with HyperTerminal, but there are many programs available. The communication settings for the HI-Q are 9600 baud, 8 data bits, no parity bit, 1 stop bit and no flow control. Usually, if you are connecting to the DB-9 in the back of the computer, this is Com Port 1.
Before we begin, it is a good idea to write down the old calibration so we have a known point we can get back too. The following command will display the calibration information:
S000show
4.2.1 Checking Factory Calibration To check the factory calibration we will need to clear out the old user calibration settings. The syntax for commands issued to the meter is as follows: S<address><command><channel><value> The following 2 commands will clear out the user calibration data: S000scale11 //sets user scale factor for channel 1 to 1 S000offset10 //sets user offset for channel 1 to 0 We now need to check the factory calibration. Apply an input to channel 1. In this example, our input is 4-20mA. At 4mA, the meter should display 4, and at 20mA, the meter should display 20. If these values are accurate, you can skip to the next step “Setting User Calibration.” Otherwise, we will need to do a Factory Calibration which is covered in the following section. 4.2.2. Setting Factory Calibration The following 2 commands will clear out the factory calibration data for channel 1: S000gaco11 //sets factory scale factor for channel 1 to 1 S000ofco10 //sets factory offset for channel 1 to 0
To calculate the new gaco (gain coefficient) and ofco (offset coefficient) values, use the following table and system of equations.
Signal IN Displayed Value Y1 X1 Y2 X2
GACO = (Y1-Y2)/(X1-X2) OFCO = Y1-(GACO*X1)

17
Example: 1) Apply a 4mA signal to the meter. Let the unit stabilize and then write down the value displayed in the table. For this example we use 0.4. 2) Apply a 20mA signal to the meter, let the unit stabilize and then write down the value displayed in the table. For this example we use 1.0.
Signal IN Displayed Value 4 0.4
20 1.0 3) Solve the system of equations to find GACO and OFCO GACO = (4-20)/(0.4-1) = 26.6667 OFCO = 4 – (26.6667 * 0.4) = -6.6667 4) The following 2 commands will set the factory calibration values: S000GACO1<calculated value> S000OFCO1<calculated value> 5) If you now apply a 4-20mA signal, the meter should display 4-20. If it doesn’t, the factory calibration will need to be repeated. 6) We now need to save the current calibration. This is done using the write command: S000write The unit will respond with an ‘*’ when the calibration is saved. 4.2.3 Setting User Calibration The first step is to clear out the old user-calibration values. The following 2 commands will clear out the user calibration data: S000scale11 //sets user scale factor for channel 1 to 1 S000offset10 //sets user offset for channel 1 to 0 To calculate the new scale and offset values, use the following table and system of equations.
Desired Display Value Displayed Value Y1 X1 Y2 X2
SCALE = (Y1-Y2)/(X1-X2) OFFSET = Y1-(SCALE*X1) Example: 1) Apply a 4mA signal to the meter. Let the unit stabilize and then write down the value displayed in the table. For this example, we use 4. 2) Apply a 20mA signal to the meter. Let the unit stabilize and then write down the value displayed in the table. For this example, we use 20.
Desired Display Value Displayed Value 0 4
100 20 3) Solve the system of equations to find SCALE and OFFSET SCALE = (0-100)/(4-20) = 6.25

18
OFFSET = 0 – (6.25 * 4) = -25 4) The following 2 commands will set the user calibration values: S000SCALE1<calculated value> S000OFFSET1<calculated value> 5) If you now apply a 4-20mA signal, the meter should display 0-100 or your desired engineering units. If it doesn’t, the user calibration will need to be repeated. 6) We now need to save the current calibration. This is done using the write command: S000write The unit will respond with an ‘*’ when the calibration is saved.
4.3 Analog Output Calibration Your meter is configured from the factory so that zero to full-scale corresponds to 4-20mA or 0-5VDC for your analog output. This output should rarely need adjustment unless your analog input display range has changed. The following procedure outlines how to recalibrate the analog output. The first step is to clear out the old calibration values. The following 2 commands will clear out the calibration data: S000dscale11 //sets user dscale factor for channel 1 to 1 S000doffset10 //sets user doffset for channel 1 to 0 With the calibration data cleared, the meter should have close to a one-to-one ratio between displayed value and analog output. The analog output can put out at most 24mA. Because of this limitation, care needs to be taken to exceed this value while calibrating. To calculate the new scale and offset values, use the following table and system of equations:
Desired Output Actual Output Y1 X1 Y2 X2
DSCALE = (Y1-Y2)/(X1-X2) DOFFSET = Y1-(SCALE*X1) Example: 1) Apply a 4mA signal to the meter. Let the unit stabilize and then write down the value for the analog output in the table. For this example, we use 2mA. 2) Apply a 20mA signal to the meter. Let the unit stabilize and then write down the value displayed in the table. For this example, we use 20.
Desired Output Actual Output 4 2
20 10 3) Solve the system of equations to find DSCALE and DOFFSET DSCALE = (4-20)/(2-10) = 2 DOFFSET = 4 – (2 * 2) = 0 4) The following 2 commands will set the user calibration values: S000DSCALE1<calculated value> S000DOFFSET1<calculated value>

19
5) If you now apply a 4-20mA signal, the meter should output 4-20mA or your desired output range. If it doesn’t the output calibration will need to be repeated. 6) We now need to save the current calibration. This is done using the write command: S000write The unit will respond with an ‘*’ when the calibration is saved. 4.4 Linearization Tables and Polynomials Inputs from non-linear sources such as thermocouples, RTDs and horizontal cylindrical tanks can be manipulated to provide linear output values. The controllers have two methods of providing linearization: lookup tables and polynomials. Lookup tables compare input values to sets of desired input/output results and determine the output value through interpolation. Polynomials linearize data by passing the input value through the ninth order equation: Y = A9X
9 + A8X8 + A7X
7 + A6X6 + A5X
5 + A4X4 + A3X
3 + A2X2 + A1X + A0
The linearization method used by the meter is determined with the LIN command: LIN1[OFF,PZ,TZ,SENSOR TYPE]
TZ = user table PZ = user polynomial RTDC = 0.00385 (DIN) PT100 ANSI = 0.00392 TC JC = type J degrees C TC = type K degrees C
All built-in temperature linearization is in degrees C. To display degrees F instead of C, do the following: Set scale to 1.8 and offset to 32.
4.4.1 The user-defined polynomial (PZ) is a 9th order polynomial defined by its coefficients. The current values of these coefficients can be viewed with the SHOWPOLY command. To change an individual coefficient, use the SETA command:
SETA[n][m] Where ‘n’ is the coefficient to set and ‘m’ is the value.
4.4.2 The user-defined table (TZ) is a set of 25(X,Y) points which are used to interpolate input data for linearization. The current user table can be seen with the SHOWTABLE command. The X coordinates correspond to inputs values for the table, whereas the y coordinates represent the displayed value. To enter or modify a table entry use the SETX and SETY commands.
SETX[n][m] Where ‘n’ is the table entry and ‘m’ is the value.
SETY[n][m] Where ‘n’ is the table entry and ‘m’ is the value.

20
In order to process inputs quickly, the meter requires the X coordinates to be in ascending order. The first X coordinate that is smaller than the previous X coordinate will mark the end of the table. This is useful for defining tables less than 25 points. For example, to use a 3 point table, the following coordinated could be entered:
Coordinate Number X Y 0 4 0 1 12 10 2 20 100 3 0 0
The following table shows the input to output correlation from the above table:
INPUT OUTPUT 4 0 8 5 12 10 16 55 20 100
5. Installation 5.1 LBD & EBD Installation
1) Make the panel cutout per below drawing. For units with trim plates add 0.2” to each side of unit, cutout dimensions remain the same.
2) Remove the front filter (4 allen screws). 3) The two allen head screws, one each on top and on bottom, will tighten the mounting tabs.
4) With the mounting tabs hidden in the pockets on the unit, insert the unit into the panel cutout and gently tighten the 2 allen screws. The tabs should rotate out of the pockets and hold the meter firmly against the panel. 5) Replace the filter and 4 allen screws. 6) Connect the meter per the typical connections.

21
5.2 LSB & SEB Installation 1) You can mount the unit in a standard ANSI4 (4” diameter hole and 4 mounting holes) cutout, a ¼ DIN (92x92mm) panel cutout or use the below drawing:
2) Use the included hardware (4 locknuts, plastic spacers and washers) to secure the unit to your panel in the following manner:
Separate the unit from the backboard if you have not already done this. Install the front of the meter in the panel with the 4 studs sticking through the panel. Install the gasket on the back of the panel. Install plastic spacers if needed. Install backboard. Install washers and locknuts.
3) Connect the meter per the typical connections.
6. Quick Reference 6.1 Troubleshooting
SYMPTOM SOLUTION No startup message on serial port
Check power connections. Make sure the TXD, RXD or D-, D+ lines are wired properly. Verify communications protocol for baud rate, parity, number of start/data/stop bits.
Garbage appears instead of a startup message
Check communications protocol for proper baud rate, parity, number of start/data/stop bits. Standard settings are 8N1, 9600 baud.
Characters sent to unit appear twice on terminal
Turn off LOCAL ECHO.
After the startup message, the unit does not respond to commands
Make sure the RXD or D- line is properly connected. Check communications software for proper settings. Be sure to use ‘S’ + the units address when sending commands.
Analog input always reads zero or doesn’t change
Check connections between unit and input signal. Check Typical Connections for signal input location.

22
6.2 Accepted ASCII TABLE This table shows the ASCII equivalent of decimal and hexadecimal inputs that the meter can understand and display. Some values not shown are understood by the meter but cannot be displayed on the 7 segment display. Both the upper and lowercase decimal and hexadecimal values are shown for the alphabetic characters but only the ASCII characters shown will be displayed (the displayed characters are not case sensitive).
Decimal Hexa-
decimal ASCII Decimal
Hexa-decimal
ASCII Decimal Hexa-
decimal ASCII
48 30 65 97 41 61 76 108 4C 6C 49 31 66 98 42 62 78 110 4E 6E 50 32 67 99 43 63 79 111 4F 6F 51 33 68 100 44 64 80 112 50 70 42 34 69 101 45 65 82 114 52 72 53 35 70 102 46 66 83 116 53 73 54 36 71 103 47 67 84 117 54 74 55 37 72 104 48 68 85 118 55 75 56 38 73 105 49 69 87 120 58 78 57 39 74 106 4A 6A 88 121 59 79 -
6.3 Mechanical Drawings
LBD & EBD Mechanical
LSB & SEB Mechanical

23
6.4 Ordering Information

24
6.4 Ordering Information Cont.

25
6.4 Ordering Information Cont.

26
6.4 Ordering Information Cont.