ebay news 2003 7 24 earnings
TRANSCRIPT

eBAY INC. ANNOUNCES SECOND QUARTER 2003 FINANCIAL RESULTS
-- Company Reports Record Net Revenues of $509.3 Million, Up 91% Year-over-Year -- -- Raises 2003 Net Revenue and EPS Guidance --
-- Announces a Two-for-One Stock Split --
San Jose, CA, July 24, 2003 – eBay Inc. (Nasdaq: EBAY; www.ebay.com), the world’s online marketplace, reported financial results for its quarter ended June 30, 2003. eBay reported record consolidated Q2-03 net revenues of $509.3 million, up 91% year-over-year; record operating income of $152 million, up 91% year-over-year; and record pro forma operating income of $168.7 million, up 109% year-over-year . Operating income was 30% of net revenues and pro forma operating income was 33% of net revenues. Consolidated net income in Q2-03 was a record $109.7 million, or $0.33 per diluted share. eBay’s pro forma consolidated net income, excluding certain items, was a record $120.9 million, or $0.37 per diluted share. These results exceeded the company’s guidance of $500 million for net revenues, $0.30 for GAAP earnings per diluted share and $0.33 for pro forma earnings per diluted share. In addition, eBay’s Board of Directors has approved a two-for-one split of all outstanding shares of the company's common stock, payable August 28, 2003 to stockholders of record on August 4, 2003. “Q2 was another great quarter for eBay,” said Meg Whitman, President and CEO of eBay. “Our thriving community of buyers and sellers continues to spread the word that eBay is a great place to trade, build a business, make friends and have fun.” Key Financial and Operating Metrics Consolidated Net Revenues - Consolidated net revenues totaled a record $509.3 million, which represented an increase of 91% from the $266.3 million reported in Q2-02. Transaction Revenues - Consolidated net transaction revenues totaled a record $496.9 million, which represented an increase of 111% from the $235.3 million reported in Q2-02.
• eBay U.S. Net Transaction Revenues - eBay U.S. net transaction revenues totaled $242.4
million in Q2-03, reflecting 45% year-over-year growth.
• eBay International Net Transaction Revenues - eBay International net transaction revenues totaled $155.2 million in Q2-03, representing 146% year-over-year growth.
– 1 –

eBay Announces Q2-03 Earnings (cont’d)
• Payments Net Transaction Revenues – Payments net transaction revenues totaled $99.4
million in Q2-03.
Confirmed Registered Users - Cumulative confirmed registered users at the end of Q2-03 were a record 75.3 million, an increase of 6.5 million sequentially and a 51% increase over the 49.7 million users reported at the end of Q2-02. Active Users - Active users, the number of users on the eBay platform who bid, bought or listed over the trailing twelve months, increased to 34.1 million, a 57% increase over the 21.8 million active users for the same period a year ago. Listings - Listings totaled a record 225 million in Q2-03, 55% higher than the 145 million in Q2-02. Gross Merchandise Sales (GMS) - GMS, the total value of items sold, was a record $5.6 billion, representing a 66% year-over-year increase from the $3.4 billion reported in Q2-02. Total Payment Volume (TPV) – TPV was $2.8 billion in Q2-03, up from TPV of $2.6 billion in Q1-03. Gross Profit - Gross profit was a record $410.1 million, or 81% of net revenues, which was down from the 83% level reported in Q2-02, reflecting the increased contribution of the lower margin PayPal business. Operating Income - Operating income was a record $152.0 million or 30% of net revenues and a 91% increase over the $79.4 million reported in Q2-02. Pro forma operating income increased 109% year-over-year to $168.7 million, or 33% of net revenues, versus 30% in Q2-02. GAAP Net Income - GAAP net income increased 102% year-over-year, to a record $109.7 million, or $0.33 per diluted share. Pro Forma Net Income - Pro forma net income increased 124% year-over-year, to a record $120.9 million, or $0.37 per diluted share. Operating and Free Cash Flows - Operating cash flows totaled a record $208.7 million, a 125% increase from the $92.8 million reported in Q2-02. Free cash flows totaled $22.6 million, a 25% decrease from the $30.1 million reported in Q2-02, reflecting the purchase of additional facilities in San Jose, California. Key Category Performance - Based on Q2-03 GMS, eBay has nine categories that deliver more than $1 billion in worldwide annualized GMS: eBay Motors at $6.3 billion; Consumer Electronics at $2.0 billion; Computers at $2.0 billion; Books/Movies/Music at $1.6 billion; Sports at $1.5 billion; Clothing and Accessories at $1.3 billion; Collectibles at $1.1 billion; Toys at $1.0 billion; and Home & Garden at $1.0 billion.
– 2 –

eBay Announces Q2-03 Earnings (cont’d) Fixed Price Trading - eBay’s fixed price trading contributed approximately $1.51 billion or 27% of total GMS during Q2-03, primarily from eBay’s “Buy It Now” feature. Pure fixed price, which allows sellers to offer items for a set price rather than in an auction format, accounted for 11% of eBay’s global GMS. eBay Stores - eBay hosts approximately 110,000 stores, with slightly more outside the US than on eBay.com. EachNet – On July 16, 2003, eBay increased its investment in EachNet Inc., which in cooperation with local subsidiaries operates the leading e-commerce company in China. eBay paid approximately $150 million in cash to acquire the remaining outstanding stock of EachNet Inc. Consolidated Financial and Operating Summary eBay reported record consolidated net revenues of $509.3 million in Q2-03, representing a 91% year-over-year increase. Excluding PayPal, eBay’s Q2-03 net revenues totaled $407.7 million, representing a 53% year-over-year increase. PayPal’s Q2-03 total net revenues were $101.5 million, representing an 89% year-over-year increase compared to the $53.8 million PayPal reported in Q2-02. As expected, revenues from third party advertisers and end-to-end services declined 43% year over year to $12.4 million and now represent approximately 2% of net revenues. Consolidated revenues reflected a foreign exchange benefit in Q2-03 in the amount of approximately $6.9 million, based on Q1-03 weighted average foreign exchange rates. Gross profit as a percentage of net revenues was 81%, which was consistent with the 81% level reported in Q1-03, but down from the 83% level reported in Q2-02. The reported gross profit percentage reflects an improvement in US and International segments offset by an increased contribution of the PayPal business, which has a lower gross margin structure. Sales and marketing expenses totaled $134.6 million, or 26% of net revenues, consistent with the 26% reported in Q1-03 and down from the 30% reported in Q2-02. The sequential dollar increase of $10.9 million in sales and marketing expense during the quarter was attributed to the company’s expanded marketing programs and growth in sales and marketing headcount. Product development costs totaled $38.8 million, or approximately 8% of net revenues, up from the 7% of net revenues reported in Q1-03 and down from the 9% of net revenues reported in Q2-02. The incremental product development expense reflects an actual sequential spending increase, offset by $12.3 million of required capitalization for major site and other product development efforts.
– 3 –

eBay Announces Q2-03 Earnings (cont’d) General and administrative costs totaled $69.5 million, or about 14% of net revenues, up from the 13% of net revenues reported for Q1-03 and consistent with the 14% of net revenues reported for Q2-02. Included in general and administrative costs were PayPal’s transaction losses, which represented approximately 0.32% of PayPal’s total payment volume. The incremental general and administration costs primarily reflect an increase in legal costs, headcount, and the impact of a weakening dollar on Euro denominated expenses in the quarter. Income from operations totaled $152.0 million during Q2-03, a 91% increase over the $79.4 million reported in Q2-02. On a pro forma basis, income from operations totaled $168.7 million, or 33% of Q2-03 consolidated net revenues, comparing favorably to the $80.7 million and 30% of net revenues reported in Q2-02. Net interest and other income totaled $10.9 million in Q2-03, up from the $7.4 million reported in Q1-03, reflecting a larger investment base. On a pro forma basis, net interest and other income increased to $9.9 million from $7.7 million in Q1-03. The Q2-03 effective tax rate for both GAAP and pro forma was 32%, consistent with the 32% effective tax rate in Q1-03 and a decrease from the 38% rate in Q2-02. The lower effective tax rate reflects the increased profit contribution from the company’s international operations. eBay’s balance sheet remains strong. At the end of Q2-03, the company had $2.5 billion in aggregate corporate cash and investments and total assets of more than $5.0 billion. The company reported $208.7 million in operating cash flows, 125% higher than the $92.8 million reported in Q2-02, primarily reflecting increased profitability. Capital expenditures increased in Q2-03 to $186.1 million from $43.9 million in Q1-03, reflecting the $125 million purchase of new facilities in San Jose, California. As a result, free cash flows during Q2-03 totaled $22.6 million, 25% lower than the $30.1 million reported in Q2-02. Business Outlook Net Revenues – The company now expects that revenues for 2003 could be as high as $2.075 billion, $25 million higher than the company’s most recent guidance. This higher revenue outlook derives from the strength of eBay’s US, International and Payments businesses. From a quarterly perspective, eBay expects consolidated net revenue to be approximately $515 million in Q3-03, and approximately $575 million in Q4-03. eBay’s guidance is based on an assumed quarterly weighted average translation of 1.14 US dollars per Euro.
– 4 –

eBay Announces Q2-03 Earnings (cont’d) GAAP Diluted EPS – eBay now estimates that earnings per diluted share for the full year 2003 could be as high as $1.31, $0.05 higher than the company’s most recent guidance. From a quarterly perspective, eBay estimates GAAP earnings per diluted share to be $0.29 in Q3-03 and $0.36 in Q4-03. This guidance includes a $0.02 decrease in Q3-03 and $0.01 decrease in Q4-03 from the acquisition of EachNet, which closed on July 16, 2003. Pro Forma Diluted EPS – eBay now estimates that pro forma earnings per diluted share for the full year 2003 could be as high as $1.47, $0.06 higher than the company’s most recent guidance. This guidance includes a $0.02 decrease in Q3-03 and $0.01 decrease in Q4-03 from the acquisition of EachNet, which closed on July 16, 2003. eBay now believes that amortization of intangible assets, stock-based compensation expenses and other pro forma items primarily related to the PayPal acquisition, as well as the related tax impact of these items, will range between $13.0 million to $18.0 million per quarter through 2003. From a quarterly perspective, eBay estimates pro forma earnings per diluted share to be $0.34 in Q3-03 and $0.40 in Q4-03. Effective Tax Rate – eBay’s current estimate for its effective tax rate is 32% for 2003. Capital Expenditures – eBay expects capital expenditures to be approximately $80 million in Q3-03 and $76 million in Q4-03, reflecting expected spending in technology, facilities, and PayPal. This implies an increase in 2003 capital expenditure guidance of approximately $11 million to $385 million from our prior guidance of $374 million. Stock Split – eBay’s Board of Directors approved a two-for-one split of all outstanding shares of the company's common stock, payable August 28, 2003 to stockholders of record on August 4, 2003. Legal Settlement We have reached a settlement with the US Attorney for the Eastern District of Missouri on the issue of PayPal’s services to online gambling merchants, which were discontinued following PayPal’s acquisition by eBay, as previously disclosed, for a payment of $10 million. The settlement amount will be included as an adjustment to our purchase price of PayPal and not as a charge against earnings. Non-GAAP Measures To supplement our consolidated financial statements presented in accordance with GAAP, eBay uses non-GAAP measures of gross profit, operating income, net income, earnings per share, and cash flows, which are adjusted from results based on GAAP to exclude certain expenses, gains and losses. These non-GAAP measures are provided to enhance the user’s overall understanding of our current financial performance and our prospects for the future. Specifically, we believe the non-GAAP results provide useful information to both management and investors by excluding certain expenses, gains and losses that may not be indicative of our core operating results. In addition, because we have historically reported certain non-GAAP results to investors, we believe the inclusion of non-GAAP measures provides consistency in our financial reporting. These measures should be considered in addition to results prepared in accordance with generally accepted
– 5 –

eBay Announces Q2-03 Earnings (cont’d) accounting principles, but should not be considered a substitute for or superior to GAAP results. Consistent with our historical practice, the non-GAAP measures included in this press release have been reconciled to the nearest GAAP measure. About eBay eBay is the world’s online marketplace™. Founded in 1995, eBay created a powerful platform for the sale of goods and services by a passionate community of individuals and businesses. On any given day, there are millions of items across thousands of categories for sale on eBay. eBay enables trade on a local, national and international basis with customized sites in markets around the world. Forward-Looking Statements This press release contains forward-looking statements relating to the future performance of eBay and its consolidated subsidiaries. Those statements involve risks and uncertainties, and our actual results could differ materially from those discussed. Factors that could cause or contribute to such differences include, but are not limited to: our need to manage an increasingly large company with a broad range of businesses; our ability to deal with the increasingly competitive environment for online trading, both in specific vertical categories and generally; our ability to manage the integration of PayPal and the litigation, regulatory, credit card association, and other risks specific to PayPal; our need to manage our other regulatory, tax, and litigation risks even as our product offerings expand and our services are offered in more jurisdictions, including, most recently, China; our ability to upgrade and develop our systems, infrastructure and customer service capabilities to accommodate growth at a reasonable cost; our ability to maintain site stability on all of our sites; our ability to continue to expand our model to new types of merchandise and sellers; our ability to continue to expand outside of the US; fluctuations in foreign exchange rates; the success of our commercial partners and commercial relationships; and the costs and benefits of announced and prospective joint ventures, acquisitions and other commercial transactions.
More information about factors that could affect our operating results is included under the captions “Risk Factors That May Affect Results of Operations and Financial Condition” and “Management's Discussion and Analysis of Financial Condition and Results of Operations” in our annual report on Form 10-K and quarterly reports on Form 10-Q, copies of which may be obtained by visiting our investor relations site at www.shareholder.com/ebay. All forward-looking statements in this release are based on information available to us on the date hereof, and we assume no obligation to update such statements.
###
Investor Relations Contacts: David Joseph 408-376-7057 Tracey Ford 408-376-7205 Media Relations Contact: Kevin Pursglove 408-376-7458 Investor Information Request: 408-376-7493 or email to [email protected] Company News: http://www.businesswire.com
– 6 –

eBay Inc. Unaudited Condensed Consolidated Balance Sheet
(U.S. Dollars In Thousands)
December 31,
2002 June 30,
2003 ASSETS Current assets: Cash and cash equivalents...................................................................................... $ 1,109,313 $ 1,391,557 Short-term investments .......................................................................................... 89,690 332,012 Accounts receivable, net ........................................................................................ 131,453 164,621 Funds receivable .................................................................................................... 41,014 83,063 Other current assets ................................................................................................ 96,988 92,941 Total current assets................................................................................................ 1,468,458 2,064,194 Long-term investments ........................................................................................... 470,227 609,634 Restricted cash and investments.............................................................................. 134,644 127,069 Property and equipment, net ................................................................................... 218,028 403,295 Goodwill ................................................................................................................. 1,456,024 1,487,018 Intangible assets, net ............................................................................................... 279,465 257,889 Deferred tax assets .................................................................................................. 84,218 75,873 Other assets............................................................................................................. 13,380 18,007
$ 4,124,444 $ 5,042,979
LIABILITIES AND STOCKHOLDERS’ EQUITY Current liabilities: Accounts payable ................................................................................................... $ 47,424 $ 64,666 Funds payable and amounts due to customers........................................................ 50,396 100,192 Accrued expenses and other current liabilities ....................................................... 199,323 223,089 Deferred revenue and customer advances .............................................................. 18,846 21,485 Short-term debt ...................................................................................................... 2,970 3,586 Income taxes payable ............................................................................................. 67,265 89,510 Total current liabilities .......................................................................................... 386,224 502,528 Long-term debt ....................................................................................................... 13,798 12,384 Deferred tax liabilities............................................................................................. 111,843 102,028 Other liabilities ....................................................................................................... 22,874 19,253 Minority interests .................................................................................................... 33,232 44,023 Total liabilities ....................................................................................................... 567,971 680,216 Total stockholders’ equity....................................................................................... 3,556,473 4,362,763
$ 4,124,444 $ 5,042,979
– 7 –
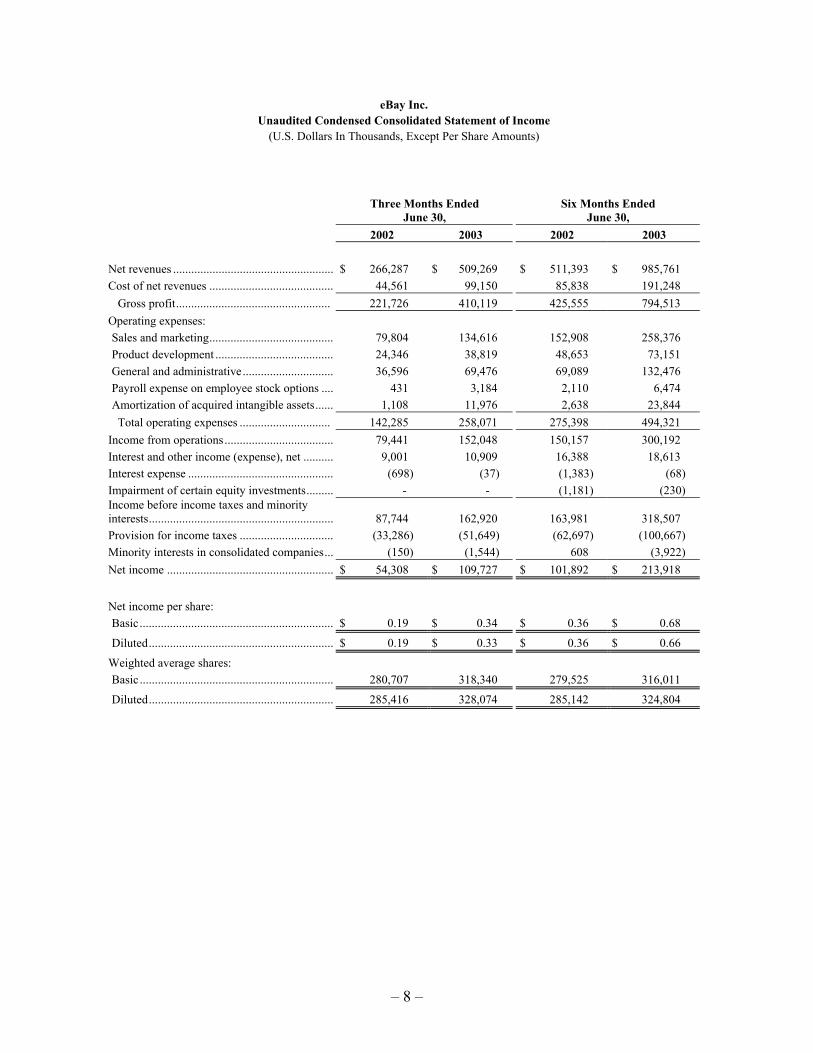
eBay Inc. Unaudited Condensed Consolidated Statement of Income
(U.S. Dollars In Thousands, Except Per Share Amounts)
Three Months Ended
June 30, Six Months Ended
June 30, 2002 2003 2002 2003 Net revenues ..................................................... $ 266,287 $ 509,269 $ 511,393 $ 985,761 Cost of net revenues ......................................... 44,561 99,150 85,838 191,248 Gross profit................................................... 221,726 410,119 425,555 794,513 Operating expenses: Sales and marketing......................................... 79,804 134,616 152,908 258,376 Product development ....................................... 24,346 38,819 48,653 73,151 General and administrative.............................. 36,596 69,476 69,089 132,476 Payroll expense on employee stock options .... 431 3,184 2,110 6,474 Amortization of acquired intangible assets...... 1,108 11,976 2,638 23,844 Total operating expenses .............................. 142,285 258,071 275,398 494,321 Income from operations.................................... 79,441 152,048 150,157 300,192 Interest and other income (expense), net .......... 9,001 10,909 16,388 18,613 Interest expense ................................................ (698) (37) (1,383) (68) Impairment of certain equity investments......... - - (1,181) (230) Income before income taxes and minority interests............................................................. 87,744 162,920 163,981 318,507 Provision for income taxes ............................... (33,286) (51,649) (62,697) (100,667) Minority interests in consolidated companies... (150) (1,544) 608 (3,922) Net income ....................................................... $ 54,308 $ 109,727 $ 101,892 $ 213,918
Net income per share: Basic................................................................ $ 0.19 $ 0.34 $ 0.36 $ 0.68
Diluted............................................................. $ 0.19 $ 0.33 $ 0.36 $ 0.66
Weighted average shares: Basic................................................................ 280,707 318,340 279,525 316,011
Diluted............................................................. 285,416 328,074 285,142 324,804
– 8 –

eBay Inc.
Unaudited Pro Forma Condensed Consolidated Statement of Income (U.S. Dollars In Thousands, Except Per Share Amounts)
Three Months Ended Three Months Ended June 30, 2002 June 30, 2003
Reported Pro Forma
Entries Pro Forma Reported Pro Forma
Entries Pro Forma Net revenues............................................................ $ 266,287 $ - $ 266,287 $ 509,269 $ - $ 509,269 Cost of net revenues................................................ 44,561 298 (a) 44,859 99,150 (64) (a) 99,086 Gross profit ................................................... 221,726 (298) 221,428 410,119 64 410,183 Operating expenses: Sales and marketing ............................................ 79,804 113 (a) 79,917 134,616 (280) (a) 134,336 Product development .......................................... 24,346 82 (a) 24,428 38,819 (358) (a) 38,461 General and administrative ................................. 36,596 (168) (a) 36,428 69,476 (797) (a) 68,679 Payroll expense on employee stock options........ 431 (431) (b) - 3,184 (3,184) (b) - Amortization of acquired intangible assets ......... 1,108 (1,108) (c) - 11,976 (11,976) (c) - Total operating expenses............................... 142,285 (1,512) 140,773 258,071 (16,595) 241,476 Income from operations .......................................... 79,441 1,214 80,655 152,048 16,659 168,707 Interest and other income (expense), net................. 9,001 (1,584) (d) 7,417 10,909 (979) (d) 9,930 Interest expense....................................................... (698) - (698) (37) - (37) Impairment of certain equity investments ............... - - - - - - Income before income taxes and minority interests 87,744 (370) 87,374 162,920 15,680 178,600 Provision for income taxes...................................... (33,286) 17 (e) (33,269) (51,649) (4,479) (e) (56,128) Minority interests in consolidated companies ......... (150) (150) (1,544) - (1,544) Net income.............................................................. $ 54,308 $ (353) $ 53,955 $ 109,727 $ 11,201 $ 120,928 Net income per share: Basic ................................................................... $ 0.19 $ 0.19 $ 0.34 $ 0.38 Diluted ................................................................ $ 0.19 $ 0.19 $ 0.33 $ 0.37 Weighted average shares: Basic ................................................................... 280,707 280,707 318,340 318,340 Diluted ................................................................ 285,416 285,416 328,074 328,074 Operating Margin ......................................................... 30% - 30% 30% 3% 33% Notes: (a) Non-cash stock based compensation expense (b) Employer payroll taxes on employee exercises of non-qualified stock options (c) Amortization of acquired intangible assets (d) Gain on recovery of fully reserved receivables (e) Incremental income taxes associated with certain pro forma entries
– 9 –

eBay Inc. Unaudited Pro Forma Condensed Consolidated Statement of Income
(U.S. Dollars In Thousands, Except Per Share Amounts) Six Months Ended Six Months Ended June 30, 2002 June 30, 2003
Reported Pro Forma
Entries Pro Forma Reported Pro Forma
Entries Pro Forma Net revenues............................................................ $ 511,393 $ - $ 511,393 $ 985,761 $ - $ 985,761 Cost of net revenues ................................................ 85,838 270 (a) 86,108 191,248 (148) (a) 191,100 Gross profit .................................................. 425,555 (270) 425,285 794,513 148 794,661 Operating expenses: Sales and marketing ............................................ 152,908 67 (a) 152,975 258,376 (698) (a) 257,678 Product development........................................... 48,653 (29) (a) 48,624 73,151 (875) (a) 72,276 General and administrative.................................. 69,089 (442) (a) 68,647 132,476 (2,050) (a) 130,426 Payroll expense on employee stock options ........ 2,110 (2,110) (b) - 6,474 (6,474) (b) - Amortization of acquired intangible assets.......... 2,638 (2,638) (c) - 23,844 (23,844) (c) - Total operating expenses.............................. 275,398 (5,152) 270,246 494,321 (33,941) 460,380 Income from operations........................................... 150,157 4,882 155,039 300,192 34,089 334,281 Interest and other income (expense), net ................. 16,388 (1,584) (d) 14,804 18,613 (979) (d) 17,634 Interest expense ....................................................... (1,383) - (1,383) (68) - (68)Impairment of certain equity investments ............... (1,181) 1,181 (e) - (230) 230 (e) - Income before income taxes and minority interests. 163,981 4,479 168,460 318,507 33,340 351,847 Provision for income taxes ...................................... (62,697) (1,274) (f) (63,971) (100,667) (10,130) (f) (110,797)Minority interests in consolidated companies.......... 608 (590) (g) 18 (3,922) - (3,922)Net income ............................................................. $ 101,892 $ 2,615 $ 104,507 $ 213,918 $ 23,210 $ 237,128 Net income per share: Basic................................................................... $ 0.36 $ 0.37 $ 0.68 $ 0.75 Diluted................................................................ $ 0.36 $ 0.37 $ 0.66 $ 0.73 Weighted average shares: Basic................................................................... 279,525 279,525 316,011 316,011 Diluted................................................................ 285,142 285,142 324,804 324,804 Operating Margin 29% 1% 30% 30% 4% 34% Notes: (a) Non-cash stock based compensation expense (b) Employer payroll taxes on employee exercises of non-qualified stock options (c) Amortization of acquired intangible assets (d) Gain on recovery of fully reserved receivables (e) Impairment of certain equity investments (f) Incremental income taxes associated with certain pro forma entries (g) Minority interest attributable to impairment of certain equity investments
– 10 –

eBay Inc.
Unaudited Condensed Consolidated Statement of Cash Flows (U.S. Dollars In Thousands)
Three Months Ended
June 30, Six Months Ended
June 30, 2002 2003 2002 2003
Cash flows from operating activities: Net income........................................................................................ $ 54,308 $ 109,727 $ 101,892 $ 213,918 Adjustments:
Provision for doubtful accounts and authorized credits ............ 4,073 10,496 12,221 19,633 Provision for transaction losses................................................. - 9,080 - 18,073 Depreciation and amortization .................................................. 18,377 38,507 31,388 70,527 Stock-based compensation ........................................................ (776) 1,499 137 3,771 Tax benefit on the exercise of employee stock options............. 33,011 33,703 62,422 75,043 Impairment of certain equity investments ................................. - - 1,181 230 Minority interests and other ...................................................... (1,870) 2,379 (3,912) 4,157 Changes in assets and liabilities:
Accounts receivable .......................................................... (6,391) (20,252) (34,223) (55,076)Funds receivable ............................................................... - 822 - (42,049)Other current assets ........................................................... (11,050) 1,620 (12,611) 2,878 Other non-current assets.................................................... (3,241) (5,743) (2,023) (4,603)Deferred tax assets, net ..................................................... 1,558 (1,475) (853) (859)Accounts payable .............................................................. 2,002 10,407 2,509 17,233 Due to customers and funds payable ................................. - 2,915 - 49,796 Accrued expenses and other liabilities .............................. (2,945) (3,528) 18,096 1,376 Deferred revenue and customer advances ......................... 5,567 863 6,299 2,607 Income taxes payable ........................................................ 217 17,662 2,590 22,033
Net cash provided by operating activities ................................................. 92,840 208,682 185,113 398,688 Cash flows from investing activities:
Purchases of property and equipment ............................................... (62,724) (186,079) (74,218) (229,987)Purchases of investments .................................................................. (100,150) (727,391) (308,395) (862,544)Maturities and sales of investments .................................................. 66,449 271,014 266,958 489,374 Proceeds from sale of subsidiary and property and equipment ......... 2,883 - 2,883 -Acquisitions, net of cash acquired .................................................... (11,053) - (54,610) (4,389)
Net cash provided by (used in) investing activities................................... (104,595) (642,456) (167,382) (607,546) Cash flows from financing activities:
Proceeds from issuance of common stock, net.................................. 41,440 255,588 68,444 472,973 Principal payments on long-term debt .............................................. (111) (491) (3,407) (798)
Net cash provided by financing activities ................................................. 41,329 255,097 65,037 472,175 Effect of exchange rate changes on cash and cash equivalents................. 10,442 15,816 10,130 18,927 Net increase in cash and cash equivalents ................................................ 40,016 (162,861) 92,898 282,244 Cash and cash equivalents at beginning of period .................................... 576,851 1,554,418 523,969 1,109,313 Cash and cash equivalents at end of period .............................................. $ 616,867 $ 1,391,557 $ 616,867 $ 1,391,557 Net cash provided by operating activities ................................................. $ 92,840 $ 208,682 $ 185,113 $ 398,688 Less: Purchases of property and equipment............................................. (62,724) (186,079) (74,218) (229,987)Free cash flow........................................................................................... $ 30,116 $ 22,603 $ 110,895 $ 168,701
– 11 –

eBay Inc. Unaudited Summary of Consolidated Net Revenues (U.S. Dollars In Thousands, Except Percentages) Net Revenues by Type Three Months Ended
June 30,
2002 September 30,
2002 December 31,
2002 March 31,
2003 June 30,
2003 Transaction U.S...................................................................... $167,489 $182,209 $211,388 $234,876 $242,385 Current quarter vs prior quarter............... 7% 9% 16% 11% 3% Current quarter vs prior year quarter ...... 48% 53% 58% 49% 45%
International ....................................................... 63,099 75,296 107,366 137,504 155,155 Current quarter vs prior quarter............... 22% 19% 43% 28% 13% Current quarter vs prior year quarter ...... 152% 163% 173% 166% 146%
Payments ............................................................ 4,719 6,094 77,703 93,179 99,363 Current quarter vs prior quarter............... (1%) 29% 1175% 20% 7% Current quarter vs prior year quarter ...... 22% 26% 1281% 1847% 2006%
Total transaction................................................. 235,307 263,599 396,457 465,559 496,903 Current quarter vs prior quarter............... 10% 12% 50% 17% 7% Current quarter vs prior year quarter ...... 66% 73% 122% 118% 111%
3rd party advertising U.S....................................................................... 15,490 14,148 7,062 5,492 6,848 Current quarter vs prior quarter................ (15%) (9%) (50%) (22%) 25% Current quarter vs prior year quarter ....... (14%) (40%) (74%) (70%) (56%)
International ........................................................ 1,210 898 1,716 1,313 1,432 Current quarter vs prior quarter................ 46% (26%) 91% (23%) 9% Current quarter vs prior year quarter ....... 37% (42%) 110% 59% 18%
Payments ............................................................. - - 1,478 2,027 2,160 Current quarter vs prior quarter................ N/A N/A N/A 37% 7% Current quarter vs prior year quarter ....... N/A N/A N/A N/A N/A
Total 3rd party advertising.................................. 16,700 15,046 10,256 8,832 10,440 Current quarter vs prior quarter................ (12%) (10%) (32%) (14%) 18% Current quarter vs prior year quarter ....... (11%) (40%) (64%) (54%) (37%)
End-to-end services U.S....................................................................... 5,091 6,096 5,591 2,101 1,926 Current quarter vs prior quarter................ 5% 20% (8%) (62%) (8%) Current quarter vs prior year quarter ....... (44%) (22%) 27% (57%) (62%)
Payments ............................................................. - - 587 - - Current quarter vs prior quarter................ N/A N/A N/A (100%) N/A Current quarter vs prior year quarter ....... (100%) (100%) 607% N/A N/A
Total end-to-end services.................................... 5,091 6,096 6,178 2,101 1,926 Current quarter vs prior quarter................ 5% 20% 1% (66%) (8%) Current quarter vs prior year quarter ....... (46%) (25%) 38% (57%) (62%)
Offline net revenues ................................................... 9,189 4,038 1,037 - - Current quarter vs prior quarter................ 22% (56%) (74%) (100%) N/A Current quarter vs prior year quarter ....... (16%) (55%) (87%) (100%) (100%)
Total net revenues ...................................................... $266,287 $288,779 $413,928 $476,492 $509,269
Current quarter vs prior quarter................ 9% 8% 43% 15% 7% Current quarter vs prior year quarter ....... 47% 49% 89% 94% 91%
– 12 –

eBay Inc. Unaudited Summary of Consolidated Net Revenues (U.S. Dollars In Thousands, Except Percentages)
Net Revenues by Segment Three Months Ended
June 30,
2002 September 30,
2002 December 31,
2002 March 31,
2003 June 30,
2003 U.S. ............................................................................... $197,259 $206,491 $225,078 $242,469 $251,159 Current quarter vs prior quarter ......................... 5% 5% 9% 8% 4% Current quarter vs prior year quarter ................. 31% 30% 30% 29% 27% International ............................................................... 64,309 76,194 109,082 138,817 156,587 Current quarter vs prior quarter ......................... 22% 18% 43% 27% 13% Current quarter vs prior year quarter ................. 148% 152% 172% 164% 143% Payments...................................................................... 4,719 6,094 79,768 95,206 101,523 Current quarter vs prior quarter ......................... (1%) 29% 1209% 19% 7% Current quarter vs prior year quarter ................. 12% 18% 1297% 1889% 2051%
Total net revenues ...................................................... $266,287 $288,779 $413,928 $476,492 $509,269
Current quarter vs prior quarter ......................... 9% 8% 43% 15% 7% Current quarter vs prior year quarter ................. 47% 49% 89% 94% 91%
Net Revenues by Geography Three Months Ended
June 30,
2002 September 30,
2002 December 31,
2002 March 31,
2003 June 30,
2003 U.S. net revenues ....................................................... $201,978 $212,585 $290,583 $319,170 $331,322 Current quarter vs prior quarter ......................... 5% 5% 37% 10% 4% Current quarter vs prior year quarter ................. 30% 29% 62% 66% 64% % of total .............................................................. 76% 74% 70% 67% 65% International net revenues........................................ 64,309 76,194 123,345 157,322 177,947 Current quarter vs prior quarter ......................... 22% 18% 62% 28% 13% Current quarter vs prior year quarter ................. 148% 152% 208% 199% 177% % of total .............................................................. 24% 26% 30% 33% 35%
Total net revenues ..................................................... $266,287 $288,779 $413,928 $476,492 $509,269
Current quarter vs prior quarter ......................... 9% 8% 43% 15% 7% Current quarter vs prior year quarter ................. 47% 49% 89% 94% 91%
– 13 –

eBay Inc. eBay Unaudited Supplemental Operating Data
(In Millions, Except Percentages)
Three Months Ended
June 30,
2002 September 30,
2002 December 31,
2002 March 31,
2003 June 30,
2003
Confirmed Registered Users .................................. 49.7 54.9 61.7 68.8 75.3
Current quarter vs prior quarter ....................... 8% 10% 12% 12% 9%Current quarter vs prior year quarter ............... 46% 46% 46% 49% 51%
Active Users (1) ........................................................ 21.8 24.2 27.7 31.1 34.1
Current quarter vs prior quarter ....................... 10% 11% 14% 12% 10%Current quarter vs prior year quarter ............... 49% 52% 56% 57% 57%
Number of Listings .................................................. 145.2 159.6 195.5 219.7 225.0
Current quarter vs prior quarter ....................... 5% 10% 22% 12% 2%Current quarter vs prior year quarter ............... 47% 47% 55% 59% 55%
Gross Merchandise Sales ........................................ $3,395 $3,766 $4,600 $5,317 $5,635
Current quarter vs prior quarter ....................... 9% 11% 22% 16% 6%Current quarter vs prior year quarter ............... 51% 60% 68% 71% 66%
(1) Defined as all users, excluding Half.com and Internet Auction, who bid, bought, or listed an item within the previous twelve month period.
– 14 –
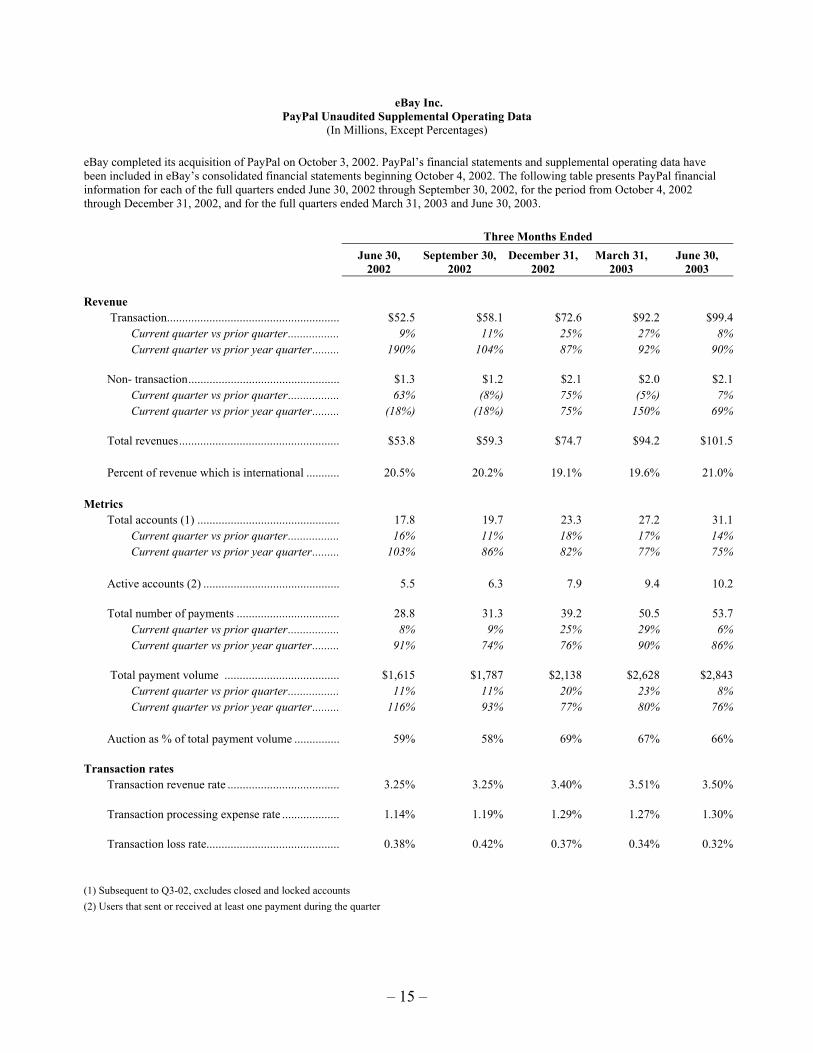
eBay Inc. PayPal Unaudited Supplemental Operating Data
(In Millions, Except Percentages) eBay completed its acquisition of PayPal on October 3, 2002. PayPal’s financial statements and supplemental operating data have been included in eBay’s consolidated financial statements beginning October 4, 2002. The following table presents PayPal financial information for each of the full quarters ended June 30, 2002 through September 30, 2002, for the period from October 4, 2002 through December 31, 2002, and for the full quarters ended March 31, 2003 and June 30, 2003. Three Months Ended
June 30,
2002 September 30,
2002 December 31,
2002 March 31,
2003 June 30,
2003 Revenue
Transaction......................................................... $52.5 $58.1 $72.6 $92.2 $99.4 Current quarter vs prior quarter................. 9% 11% 25% 27% 8%Current quarter vs prior year quarter......... 190% 104% 87% 92% 90%
Non- transaction.................................................. $1.3 $1.2 $2.1 $2.0 $2.1
Current quarter vs prior quarter................. 63% (8%) 75% (5%) 7%Current quarter vs prior year quarter......... (18%) (18%) 75% 150% 69%
Total revenues..................................................... $53.8 $59.3 $74.7 $94.2 $101.5
Percent of revenue which is international ........... 20.5% 20.2% 19.1% 19.6% 21.0% Metrics
Total accounts (1) ............................................... 17.8 19.7 23.3 27.2 31.1 Current quarter vs prior quarter................. 16% 11% 18% 17% 14%Current quarter vs prior year quarter......... 103% 86% 82% 77% 75%
Active accounts (2) ............................................. 5.5 6.3 7.9 9.4 10.2 Total number of payments .................................. 28.8 31.3 39.2 50.5 53.7
Current quarter vs prior quarter................. 8% 9% 25% 29% 6%Current quarter vs prior year quarter......... 91% 74% 76% 90% 86%
Total payment volume ...................................... $1,615 $1,787 $2,138 $2,628 $2,843
Current quarter vs prior quarter................. 11% 11% 20% 23% 8%Current quarter vs prior year quarter......... 116% 93% 77% 80% 76%
Auction as % of total payment volume ............... 59% 58% 69% 67% 66% Transaction rates
Transaction revenue rate ..................................... 3.25% 3.25% 3.40% 3.51% 3.50% Transaction processing expense rate ................... 1.14% 1.19% 1.29% 1.27% 1.30% Transaction loss rate............................................ 0.38% 0.42% 0.37% 0.34% 0.32%
(1) Subsequent to Q3-02, cxcludes closed and locked accounts (2) Users that sent or received at least one payment during the quarter
– 15 –

eBay Inc. Guidance Summary
(In Millions, Except Per Share Amounts and Percentages)
The guidance provided below and elsewhere in this press release involves risks and uncertainties, and our actual results could differ materially from this guidance. Some of the factors that could affect our operating results are set forth under the caption "Forward-Looking Statements" above in this press release. More information about factors that could affect our operating results is included under the captions “Risk Factors That May Affect Results of Operations and Financial Condition” and “Management's Discussion and Analysis of Financial Condition and Results of Operations” in our annual report on Form 10-K and quarterly reports on Form 10-Q, copies of which may be obtained by visiting our investor relations site at www.shareholder.com/ebay. The guidance below is based on information available to us on the date hereof, and we assume no obligation to update it.
Three months ending September 30, 2003 GAAP Adjustments Pro Forma Net revenue ......................................... $ 515 - $ 515 Operating margin............................... 28% 3% (a) 31% Diluted EPS ........................................ $ 0.29 $ 0.05 (b) $ 0.34 Three months ending December 31, 2003 GAAP Adjustments Pro Forma Net revenue ......................................... $ 575 - $ 575 Operating margin............................... 31% 3% (a) 34% Diluted EPS ........................................ $ 0.36 $ 0.04 (b) $ 0.40 (a) Pro forma guidance reflects estimated quarterly adjustments for amortization of acquired intangible
assets of approximately $13 million, cumulative effect of the adoption of Financial Interpretation No. 46 on depreciation relating to our San Jose facility of approximately $6 million, payroll taxes on employee stock options of approximately $4 million, stock based compensation of approximately $1 million, and other adjustments estimated to result in an operating margin adjustment of 3% for the three months ending September 30, 2003, and for the three months ending December 31, 2003.
(b) Net of tax, the above pro forma items are estimated to result in a $0.05 per diluted share adjustment for the three months ending September 30, 2003 and a $0.04 per share adjustment for the three months ending December 31, 2003.
– 16 –