eba report - high earner results - 2010 and 2011 data · template used for the data collection:...
TRANSCRIPT

High Earners 2010 and 2011 data
EBA Report
High Earners
2010 and 2011 data

Contents
2
1 Introduction 3
2 Template 4
3 2010 data 5
4 2011 data 15

3
Introduction
Directive 2010/76/EC (CRDIII) introduced the requirement that home Member State
competent authorities have to collect information on the number of individuals per
credit institution in pay brackets of at least EUR 1 million, including the business area
involved and the main elements of salary, bonus, long-term award and pension contribution. That information shall be forwarded to the EBA, which shall disclose it on
an aggregate home Member State basis in a common reporting format. To facilitate the
data collection, in 2012 the EBA published Guidelines on the data collection exercise for
High Earners, which includes the template used for the data collection.
Within this report the EBA presents the results of the data collection exercise regarding
High Earners. According to the mandate, the report contains the aggregation of data
regarding High Earners for 2010 and 2011 respectively, showing the number of High
Earners for each Member State and the amount of remuneration received, separated
into business areas and including the main elements of remuneration for each year.
National competent authorities have collected the data on High Earners from
institutions on a consolidated basis, but have separated the data into figures for each
Member State. All figures received from national competent authorities have been
aggregated by EBA and represent the remuneration paid to High Earners in the given Member State, including remuneration paid to staff by a subsidiary or branch of a EU
parent institution which is located in another Member State.
All but one Member State of the European Union have participated in this exercise.
Poland will comply with the respective EBA guidelines and will submit data from 2012
onwards. Hungary and Norway have reported data for 2011 only, and for this reason the
2010 figures include only High Earners which have been reported by other Member
States. Data from EEA countries was available from Norway for 2011.

Template used for the data collection: EBA/GL/2012/5 - ANNEX - Information on the remuneration of high earners
Name of the institution/group:
Member state to which the data relate:
Performance year for which remuneration is
awarded (Year N):
Business areas: Investment banking1 Retail banking2
Asset management3 All other4
Total number5of individuals # # # #
Of which: Number of "Identified Staff"6 # # # #
Total fixed7 remuneration € mn € mn € mn € mn
Total variable8 remuneration € mn € mn € mn € mn
Of which: Total discretionary pension benefits9 € mn € mn € mn € mn
Of which: Total variable remuneration deferred
in Year N10
€ mn € mn € mn € mn
Footnote: Staff reported in the column "all other" consist of ... [to be completed as per footnote 4 below]
1.Incl. corporate finance advice services, private equity, capital markets, trading and sales.
2.Incl. total lending activity (to individuals and enterprises).
3.Incl. portfolio management, managing of UCITS and other forms of asset management.
4.This column should include high earners that cannot be allocated to one of the designated business areas. In this case, institutions should add a footnote
(see end of the table) explaining in which areas these high earners work.
5.The numbers of staff provided should be expressed in full time equivalents (FTEs) and be based on year‐end numbers.
6.Identified staff according to paragraph 16 of the CEBS Guidelines on Remuneration Policies and Practices.
7. Fixed remuneration according to paragraph 11 of the CEBS Guidelines on Remuneration Policies and Practices.
8. Variable remuneration according to paragraph 11 of the CEBS Guidelines on Remuneration Policies and Practices. This includes deferred and non‐
deferred variable remuneration. This also includes discretionary pension benefits, amounts regarding guaranteed variable remuneration and severance
payments.
9. Discretionary pension benefits according to section 3.1.2 of the CEBS Guidelines on Remuneration Policies and Practices.
10.Deferred remuneration according to section 4.1.1 of CEBS Guidelines on Remuneration Policies and Practices.
4

5
2010
Derived metrics for AUSTRIA for 2010
Total Monetary Amount in Euro per business area
Business Area
Metric
Investment banking Retail banking As
mana
set Other business Total
gement areas
Number of high earners 3 1 0 10 14
Number of high earners that are identified staff 2 0 0 9 11
Total fixed remuneration 1,686,000 771,426 0 9,056,845 11,514,271
Total variable remuneration 2,565,000 270,005 0 7,871,667 10,706,672
Total amount of variable remuneration deferred
in Year N
1,220,000
150,005
0
3,408,667
4,778,672
Total amount of discretionary pension benefits 0 0 0 0 0
Average Total Remuneration per Individual 1,417,000 1,041,431 . 1,692,851 1,587,210
Ratio variable/fixed remuneration in % 152% 35% . 87% 93%
Ratio variable/total remuneration in % 60% 26% . 46% 48%
Ratio of deferred variable/total variable 48% 56% . 43% 45%
Derived metrics for BELGIUM for 2010 Total Monetary Amount in Euro per business area
Business Area
Metric
Investment banking Retail banking As
mana
set Other business Total
gement areas
Number of high earners 6 2 0 5 13
Number of high earners that are identified staff 6 0 0 5 11
Total fixed remuneration 1,376,062 1,462,458 0 4,950,000 7,788,520
Total variable remuneration 5,775,000 1,853,435 0 2,610,000 10,238,435
Total amount of variable remuneration deferred
in Year N
3,316,650
870,475
0
1,360,000
5,547,125
Total amount of discretionary pension benefits 0 0 0 0 0
Average Total Remuneration per Individual 1,191,844 1,657,947 . 1,512,000 1,386,689
Ratio variable/fixed remuneration in % 420% 127% . 53% 131%
Ratio variable/total remuneration in % 81% 56% . 35% 57%
Ratio of deferred variable/total variable
remuneration in %
57%
47%
.
52%
54%
Derived metrics for BULGARIA for 2010 Total Monetary Amount in Euro per business area
Business Area
Metric
Investment banking Retail banking Asset Other business
Total management areas
Number of high earners 0 0 0 0 0
Number of high earners that are identified staff 0 0 0 0 0
Total fixed remuneration 0 0 0 0 0
Total variable remuneration 0 0 0 0 0
Total amount of variable remuneration deferred
in Year N
0
0
0
0
0
Total amount of discretionary pension benefits 0
0 0 0 0
Average Total Remuneration per Individual . . . . .
Ratio variable/fixed remuneration in % . . . . .
Ratio variable/total remuneration in % . . . . .
Ratio of deferred variable/total variable
remuneration in %
.
.
.
.
.

6
Metric
Investment banking Retail banking As
mana
set Other business Total
gement areas
Number of high earners 0 1 0 2 3
Number of high earners that are identified staff 0 1 0 2 3
Total fixed remuneration 0 1,150,000 0 1,300,000 2,450,000
Total variable remuneration
Total amount of variable remuneration deferred
in Year N
0
0
0
0
0
0
1,000,000
.
1,000,000
.
Total amount of discretionary pension benefits 0 0 0 0 0
Average Total Remuneration per Individual . 1,150,000 0 1,150,000 1,150,000
Ratio variable/fixed remuneration in % . . . 77% 41%
Ratio variable/total remuneration in % . . . 43% 29%
Ratio of deferred variable/total variable . . . . .
Derived metrics for CYPRUS for 2010
Derived metrics for CZECH REPUBLIC for 2010
Total Monetary Amount in Euro per business area
Business Area
Total Monetary Amount in Euro per business area
Business Area
Metric
Investment banking Retail banking Asset Other business
Total management areas
Number of high earners 0 0 0 0 0
Number of high earners that are identified staff 0
0 0 0 0
Total fixed remuneration 0 0 0 0 0
Total variable remuneration 0 0 0 0 0
Total amount of variable remuneration deferred
in Year N
0
0
0
0
0
Total amount of discretionary pension benefits 0
0 0 0 0
Average Total Remuneration per Individual . . . . .
Ratio variable/fixed remuneration in % . . . . .
Ratio variable/total remuneration in % . . . . .
Ratio of deferred variable/total variable
remuneration in %
.
.
.
.
.
Derived metrics for DENMARK for 2010 Total Monetary Amount in Euro per business area
Business Area
Metric
Investment banking Retail banking m
Asset Other business Total
anagement areas
Number of high earners 19 1 1 8 29
Number of high earners that are identified staff 17 1 0 8 26
Total fixed remuneration 8,507,035 1,000,000 16,617 7,890,898 17,414,550
Total variable remuneration 16,733,268 200,000 1,408,583 7,331,415 25,673,266
Total amount of variable remuneration deferred
in Year N
9,656,756
200,000
0
300,000
10,156,756
Total amount of discretionary pension benefits 21,249 0 0 0 21,249
Average Total Remuneration per Individual 1,328,437 1,200,000 1,425,200 1,902,789 1,485,787
Ratio variable/fixed remuneration in % 197% 20% 8477% 93% 147%
Ratio variable/total remuneration in % 66% 17% 99% 48% 60%
Ratio of deferred variable/total variable
remuneration in %
58%
100%
0%
4%
40%

7
Derived metrics for ESTONIA for 2010
Total Monetary Amount in Euro per business area
Business Area
Metric
Investment banking Retail banking Asset Other business
Total management areas
Number of high earners 0 0 0 0 0
Number of high earners that are identified staff 0 0 0 0 0
Total fixed remuneration 0 0 0 0 0
Total variable remuneration 0 0 0 0 0
Total amount of variable remuneration deferred
in Year N
0
0
0
0
0
Total amount of discretionary pension benefits 0 0 0 0 0
Average Total Remuneration per Individual . . . . .
Ratio variable/fixed remuneration in % . . . . .
Ratio variable/total remuneration in % . . . . .
Ratio of deferred variable/total variable
remuneration in %
.
.
.
.
.
Derived metrics for FINLAND for 2010
Total Monetary Amount in Euro per business area
Business Area
Metric
Investment banking Retail banking Asset Other business
Total management areas
Number of high earners 2 0 1 2 5
Number of high earners that are identified staff 2
0 1 2 5
Total fixed remuneration 800,000 0 200,000 1,600,000 2,600,000
Total variable remuneration 1,400,000 0 800,000 800,000 3,000,000
Total amount of variable remuneration deferred
in Year N
800,000
0
0
600,000
1,400,000
Total amount of discretionary pension benefits 0
0 0 0 0
Average Total Remuneration per Individual 1,100,000 . 1,000,000 1,200,000 1,120,000
Ratio variable/fixed remuneration in % 175% . 400% 50% 115%
Ratio variable/total remuneration in % 64% . 80% 33% 54%
Ratio of deferred variable/total variable
remuneration in %
57%
.
0%
75%
47%
Derived metrics for FRANCE for 2010 Total Monetary Amount in Euro per business area
Business Area
Metric
Investment banking Retail banking Asset Other business
Total management areas
Number of high earners 220 5 17 50 292
Number of high earners that are identified staff 151 4 8 33 196
Total fixed remuneration 46,845,179 2,060,740 3,987,053 20,185,822 73,078,794
Total variable remuneration 345,025,031 4,191,192 25,414,555 74,752,962 449,383,740
Total amount of variable remuneration deferred
in Year N
229,452,018
1,305,669
13,419,544
37,170,648
281,347,879
Total amount of discretionary pension benefits 0 0 0 0 0
Average Total Remuneration per Individual 1,781,228 1,250,386 1,729,506 1,898,776 1,789,255
Ratio variable/fixed remuneration in % 737% 203% 637% 370% 615%
Ratio variable/total remuneration in % 88% 67% 86% 79% 86%
Ratio of deferred variable/total variable
remuneration in %
67%
31%
53%
50%
63%

8
Derived metrics for GERMANY for 2010
Total Monetary Amount in Euro per business area
Business Area
Metric
Investment banking Retail banking management areas
Total
Number of high earners 1 0 0 0 1
Number of high earners that are identified staff 0 0 0 0 0
Total fixed remuneration 260,000 0 0 0 260,000
Total variable remuneration 1,372,000 0 0 0 1,372,000
Total amount of variable remuneration deferred
in Year N
971,000
.
.
.
971,000
Total amount of discretionary pension benefits 0 0 0 0 0
Average Total Remuneration per Individual 1,632,000 . . . 1,632,000
Ratio variable/fixed remuneration in % 528% . . . 528%
Ratio variable/total remuneration in % 84% . . . 84%
Ratio of deferred variable/total variable 71% . . . 71%
Metric
Investment banking Retail banking m
Asset Other business Total
anagement areas
Number of high earners 123 6 5 61 195
Number of high earners that are identified staff 49 6 2 41 98
Total fixed remuneration 38,475,755 3,236,000 7,066,004 36,581,940 85,359,699
Total variable remuneration 190,187,998 5,686,000 5,320,415 97,205,342 298,399,755
Total amount of variable remuneration deferred
in Year N
122,013,173
433,000
3,631,207
59,197,670
185,275,050
Total amount of discretionary pension benefits 0 0 0 301,000 301,000
Average Total Remuneration per Individual 1,859,055 1,487,000 2,477,284 2,193,234 1,967,997
Ratio variable/fixed remuneration in % 494% 176% 75% 266% 350%
Ratio variable/total remuneration in % 83% 64% 43% 73% 78%
Ratio of deferred variable/total variable
remuneration in %
64%
8%
68%
61%
62%
Derived metrics for GREECE for 2010
Total Monetary Amount in Euro per business area
Business Area
Metric
Investment banking Retail banking Asset Other business
Total management areas
Number of high earners 0 0 0 0 0
Number of high earners that are identified staff 0 0 0 0 0
Total fixed remuneration 0 0 0 0 0
Total variable remuneration 0 0 0 0 0
Total amount of variable remuneration deferred
in Year N
0
0
0
0
0
Total amount of discretionary pension benefits 0
0 0 0 0
Average Total Remuneration per Individual . . . . .
Ratio variable/fixed remuneration in % . . . . .
Ratio variable/total remuneration in % . . . . .
Ratio of deferred variable/total variable
remuneration in %
.
.
.
.
.
Derived metrics for HUNGARY for 2010*
Total Monetary Amount in Euro per business area
Business Area
Asset Other business
* Hungary did not collect information on High Earners for 2010, data shown in this table was reported from other Member States
9
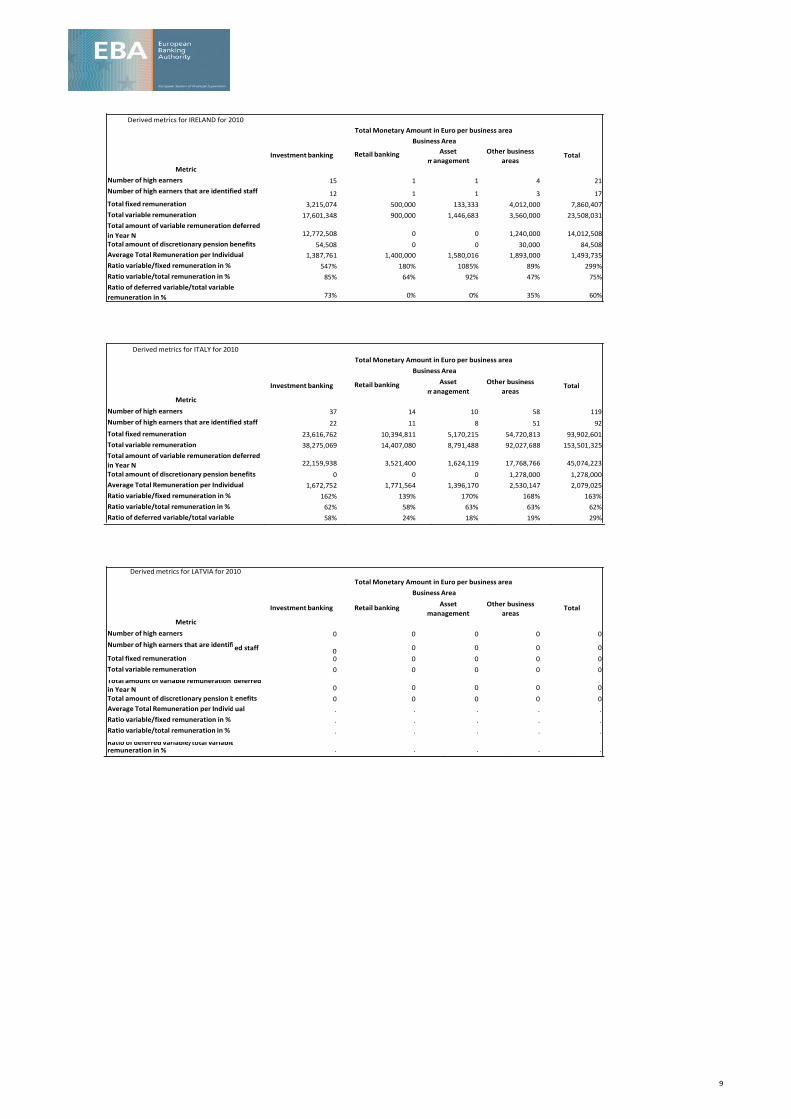
Derived metrics for IRELAND for 2010
Total Monetary Amount in Euro per business area
Business Area
Metric
Investment banking Retail banking m
Asset Other business Total
anagement areas
Number of high earners 15 1 1 4 21
Number of high earners that are identified staff 12 1 1 3 17
Total fixed remuneration 3,215,074 500,000 133,333 4,012,000 7,860,407
Total variable remuneration 17,601,348 900,000 1,446,683 3,560,000 23,508,031
Total amount of variable remuneration deferred
in Year N
12,772,508
0
0
1,240,000
14,012,508
Total amount of discretionary pension benefits 54,508 0 0 30,000 84,508
Average Total Remuneration per Individual 1,387,761 1,400,000 1,580,016 1,893,000 1,493,735
Ratio variable/fixed remuneration in % 547% 180% 1085% 89% 299%
Ratio variable/total remuneration in % 85% 64% 92% 47% 75%
Ratio of deferred variable/total variable
remuneration in %
73%
0%
0%
35%
60%
Derived metrics for ITALY for 2010
Total Monetary Amount in Euro per business area
Business Area
Metric
Investment banking Retail banking m
Asset Other business Total
anagement areas
Number of high earners 37 14 10 58 119
Number of high earners that are identified staff 22 11 8 51 92
Total fixed remuneration 23,616,762 10,394,811 5,170,215 54,720,813 93,902,601
Total variable remuneration 38,275,069 14,407,080 8,791,488 92,027,688 153,501,325
Total amount of variable remuneration deferred
in Year N
22,159,938
3,521,400
1,624,119
17,768,766
45,074,223
Total amount of discretionary pension benefits 0 0 0 1,278,000 1,278,000
Average Total Remuneration per Individual 1,672,752 1,771,564 1,396,170 2,530,147 2,079,025
Ratio variable/fixed remuneration in % 162% 139% 170% 168% 163%
Ratio variable/total remuneration in % 62% 58% 63% 63% 62%
Ratio of deferred variable/total variable 58% 24% 18% 19% 29%
Derived metrics for LATVIA for 2010 Total Monetary Amount in Euro per business area
Business Area
Metric
Investment banking Retail banking Asset Other business
Total management areas
Number of high earners 0 0 0 0 0
Number of high earners that are identifi ed staff 0 0 0 0 0
Total fixed remuneration 0 0 0 0 0
Total variable remuneration 0 0 0 0 0
Total amount of variable remuneration in Year N
deferred 0 0 0 0 0
Total amount of discretionary pension b
Average Total Remuneration per Individ
Ratio variable/fixed remuneration in %
Ratio variable/total remuneration in %
enefits 0
ual .
.
.
0
.
.
.
0
.
.
.
0
.
.
.
0
.
.
.
Ratio of deferred variable/total variable remuneration in % . . . . .

Derived metrics for LITHUANIA for 2010
Total Monetary Amount in Euro per business area
Business Area
10
Metric
Investment banking Retail banking Asset Other business
Total management areas
Number of high earners 0 0 0 0 0
Number of high earners that are identified staff 0 0 0 0 0
Total fixed remuneration 0 0 0 0 0
Total variable remuneration 0 0 0 0 0
Total amount of variable remuneration deferred
in Year N
0
0
0
0
0
Total amount of discretionary pension benefits 0 0 0 0 0
Average Total Remuneration per Individual . . . . .
Ratio variable/fixed remuneration in % . . . . .
Ratio variable/total remuneration in % . . . . .
Ratio of deferred variable/total variable
remuneration in %
.
.
.
.
.
Derived metrics for LUXEMBOURG for 2010
Total Monetary Amount in Euro per business area
Business Area
Metric
Investment banking Retail banking Asset Other business
Total management areas
Number of high earners 0 0 2 4 6
Number of high earners that are identified staff 0 0 2 3 5
Total fixed remuneration 0 0 1,270,000 2,057,000 3,327,000
Total variable remuneration 0 0 1,550,000 6,110,000 7,660,000
Total amount of variable remuneration deferred
in Year N
0
0
700,000
1,780,000
2,480,000
Total amount of discretionary pension benefits 0
0 0 0 0
Average Total Remuneration per Individual . . 1,410,000 2,041,750 1,831,167
Ratio variable/fixed remuneration in % . . 122% 297% 230%
Ratio variable/total remuneration in % . . 55% 75% 70%
Ratio of deferred variable/total variable
remuneration in %
.
.
45%
29%
32%
Derived metrics for MALTA for 2010 Total Monetary Amount in Euro per business area
Business Area
Metric
Investment banking Retail banking Asset Other business
Total management areas
Number of high earners 0 0 0 0 0
Number of high earners that are identified staff 0 0 0 0 0
Total fixed remuneration 0 0 0 0 0
Total variable remuneration 0 0 0 0 0
Total amount of variable remuneration deferred
in Year N
0
0
0
0
0
Total amount of discretionary pension benefits 0
0 0 0 0
Average Total Remuneration per Individual . . . . .
Ratio variable/fixed remuneration in % . . . . .
Ratio variable/total remuneration in % . . . . .
Ratio of deferred variable/total variable
remuneration in %
.
.
.
.
.

Derived metrics for NETHERLANDS for 2010
Total Monetary Amount in Euro per business area
Business Area
11
Metric
Investment banking Retail banking m
Asset Other business Total
anagement areas
Number of high earners 2 1 1 1 5
Number of high earners that are identified staff 2 1 1 1 5
Total fixed remuneration 600,000 1,100,000 900,000 1,400,000 4,000,000
Total variable remuneration 1,700,000 400,000 400,000 100,000 2,600,000
Total amount of variable remuneration deferred
in Year N
900,000
200,000
300,000
100,000
1,500,000
Total amount of discretionary pension benefits 0 0 0 0 0
Average Total Remuneration per Individual 1,150,000 1,500,000 1,300,000 1,500,000 1,320,000
Ratio variable/fixed remuneration in % 283% 36% 44% 7% 65%
Ratio variable/total remuneration in % 74% 27% 31% 7% 39%
Ratio of deferred variable/total variable
remuneration in %
53%
50%
75%
100%
58%
Metric
Investment banking Retail banking As
mana
set Other business Total
gement areas
Number of high earners 0 1 0 1 2
Number of high earners that are identified staff 0 0 0 1 1
Total fixed remuneration 0 502,000 0 774,892 1,276,892
Total variable remuneration 0 949,000 0 870,647 1,819,647
Total amount of variable remuneration deferred
in Year N
0
107,000
0
732,296
839,296
Total amount of discretionary pension benefits 0 0 0 0 0
Average Total Remuneration per Individual . 1,451,000 . 1,645,539 1,548,270
Ratio variable/fixed remuneration in % . 189% . 112% 143%
Ratio variable/total remuneration in % . 65% . 53% 59%
Ratio of deferred variable/total variable
remuneration in %
.
11%
.
84%
46%
Metric
Investment banking Retail banking Asset Other business
Total management areas
Number of high earners 12 3 7 21 43
Number of high earners that are identified staff 3 0 0 3 6
Total fixed remuneration 4,956,000 1,984,266 2,040,000 15,063,000 24,043,266
Total variable remuneration 14,595,920 2,154,610 13,883,000 17,873,000 48,506,530
Total amount of variable remuneration deferred
in Year N
4,321,954
827,305
3,459,000
7,156,138
15,764,397
Total amount of discretionary pension benefits 0 0 0 235,000 235,000
Average Total Remuneration per Individual 1,629,327 1,379,625 2,274,714 1,568,381 1,687,205
Ratio variable/fixed remuneration in % 295% 109% 681% 119% 202%
Ratio variable/total remuneration in % 75% 52% 87% 54% 67%
Ratio of deferred variable/total variable
remuneration in %
30%
38%
25%
40%
32%
Derived metrics for NORWAY for 2010**
Total Monetary Amount in Euro per business area
Business Area
** Norway did not collect information on High Earners for 2010, data shown in this table was reported from other Member States
Derived metrics for POLAND for 2010*** Total Monetary Amount in Euro per business area
Business Area
*** Poland did not collect information on High Earners for 2010, data shown in this table was reported from other Member States

12
Derived metrics for PORTUGAL for 2010
Total Monetary Amount in Euro per business area
Business Area
Metric
Investment banking Retail banking As
mana
set Other business Total
gement areas
Number of high earners 1 12 0 0 13
Number of high earners that are identified staff 1 12 0 0 13
Total fixed remuneration 329,977 5,512,823 0 0 5,842,800
Total variable remuneration 1,240,525 11,956,680 0 0 13,197,205
Total amount of variable remuneration deferred
in Year N
0
335,000
0
0
335,000
Total amount of discretionary pension benefits 556,542 3,479,659 0 0 4,036,201
Average Total Remuneration per Individual 1,570,502 1,455,792 . . 1,464,616
Ratio variable/fixed remuneration in % 376% 217% . . 226%
Ratio variable/total remuneration in % 79% 68% . . 69%
Ratio of deferred variable/total variable
remuneration in %
0%
3%
.
.
3%
Derived metrics for ROMANIA for 2010
Total Monetary Amount in Euro per business area
Business Area
Metric
Investment banking Retail banking Asset Other business
Total management areas
Number of high earners 0 0 0 1 1
Number of high earners that are identified staff 0 0 0 1 1
Total fixed remuneration 0 0 0 1,184,038 1,184,038
Total variable remuneration 0 0 0 400,000 400,000
Total amount of variable remuneration deferred
in Year N
0
0
0
233,333
233,333
Total amount of discretionary pension benefits 0
0 0 0 0
Average Total Remuneration per Individual 0 0 0 1,584,038 1,584,038
Ratio variable/fixed remuneration in % . . . 34% 34%
Ratio variable/total remuneration in % . . . 25% 25%
Ratio of deferred variable/total variable
remuneration in %
.
.
.
58%
58%
Derived metrics for SLOVAKIA for 2010 Total Monetary Amount in Euro per business area
Business Area
Metric
Investment banking Retail banking Asset Other business
Total management areas
Number of high earners 0 0 1 0 1
Number of high earners that are identified staff 0 0 1 0 1
Total fixed remuneration 0 0 0 0 0
Total variable remuneration 0 0 1,024,000 0 1,024,000
Total amount of variable remuneration deferred
in Year N
0
0
0
0
0
Total amount of discretionary pension benefits 0
0 0 0 0
Average Total Remuneration per Individual . . 1,024,000 . 1,024,000
Ratio variable/fixed remuneration in % . . . . .
Ratio variable/total remuneration in % . . 100% . 100%
Ratio of deferred variable/total variable
remuneration in %
.
.
0%
.
0%

13
Derived metrics for SLOVENIA for 2010
Total Monetary Amount in Euro per business area
Business Area
Metric
Investment banking Retail banking Asset Other business
Total management areas
Number of high earners 0 0 0 0 0
Number of high earners that are identified staff 0 0 0 0 0
Total fixed remuneration 0 0 0 0 0
Total variable remuneration 0 0 0 0 0
Total amount of variable remuneration deferred
in Year N
0
0
0
0
0
Total amount of discretionary pension benefits 0 0 0 0 0
Average Total Remuneration per Individual . . . . .
Ratio variable/fixed remuneration in % . . . . .
Ratio variable/total remuneration in % . . . . .
Ratio of deferred variable/total variable
remuneration in %
.
.
.
.
.
Derived metrics for SPAIN for 2010
Total Monetary Amount in Euro per business area
Business Area
Metric
Investment banking Retail banking m
Asset Other business Total
anagement areas
Number of high earners 54 21 1 57 133
Number of high earners that are identified staff 31 19 0 42 92
Total fixed remuneration 18,812,664 15,359,000 649,000 56,493,000 91,313,664
Total variable remuneration 79,030,794 33,618,000 1,330,000 94,871,000 208,849,794
Total amount of variable remuneration deferred
in Year N
29,464,736
6,624,000
0
15,060,000
51,148,736
Total amount of discretionary pension benefits 4,347,000 1,200,000 1,125,000 4,756,000 11,428,000
Average Total Remuneration per Individual 1,811,916 2,332,238 1,979,000 2,655,509 2,256,868
Ratio variable/fixed remuneration in % 420% 219% 205% 168% 229%
Ratio variable/total remuneration in % 81% 69% 67% 63% 70%
Ratio of deferred variable/total variable
remuneration in %
37%
20%
0%
16%
24%
Derived metrics for SWEDEN for 2010 Total Monetary Amount in Euro per business area
Business Area
Metric
Investment banking Retail banking Asset Other business
Total management areas
Number of high earners 10 0 0 4 14
Number of high earners that are identified staff 6
0 0 4 10
Total fixed remuneration 3,371,161 0 0 4,975,964 8,347,125
Total variable remuneration 7,170,000 0 0 1,140,000 8,310,000
Total amount of variable remuneration deferred
in Year N
2,590,000
0
0
1,040,000
3,630,000
Total amount of discretionary pension benefits 0
0 0 0 0
Average Total Remuneration per Individual 1,054,116 . . 1,528,991 1,189,795
Ratio variable/fixed remuneration in % 213% . . 23% 100%
Ratio variable/total remuneration in % 68% . . 19% 50%
Ratio of deferred variable/total variable
remuneration in %
36%
.
.
91%
44%

14
Derived metrics for UNITED KINGDOM for 2010
Total Monetary Amount in Euro per business area
Business Area
Metric
Investment banking Retail banking Asset Other business
Total management areas
Number of high earners 1,934 71 162 358 2,525
Number of high earners that are identified staff 556 44 72 164 836
Total fixed remuneration 627,552,897 21,143,428 48,401,974 120,710,533 817,808,832
Total variable remuneration 4,061,704,281 76,846,410 282,942,587 578,813,541 5,000,306,819
Total amount of variable remuneration deferred
in Year N
2,605,264,012
47,708,406
135,140,583
284,072,418
3,072,185,419
Total amount of discretionary pension benefits 15,118,095 2,806,260 361,249 2,547,844 20,833,448
Average Total Remuneration per Individual 2,424,642 1,380,139 2,045,337 1,953,978 2,304,204
Ratio variable/fixed remuneration in % 647% 363% 585% 480% 611%
Ratio variable/total remuneration in % 87% 78% 85% 83% 86%
Ratio of deferred variable/total variable
remuneration in %
64%
62%
48%
49%
61%

15
2011
Derived metrics for AUSTRIA for 2011
Total Monetary Amount in Euro per business area
Business Area
Metric
Investment banking Retail banking m
Asset Other business Total
anagement areas
Number of high earners 2 2 1 5 10
Number of high earners that are identified staff 2 2 1 5 10
Total fixed remuneration 1,040,000 1,858,741 380,000 6,453,308 9,732,049
Total variable remuneration 1,440,000 1,642,000 1,109,765 4,811,010 9,002,775
Total amount of variable remuneration deferred
in Year N
1,340,000
1,127,000
1,048,002
3,426,604
6,941,606
Total amount of discretionary pension benefits 0 0 0 0 0
Average Total Remuneration per Individual 1,240,000 1,750,371 1,489,765 2,252,864 1,873,482
Ratio variable/fixed remuneration in % 138% 88% 292% 75% 93%
Ratio variable/total remuneration in % 58% 47% 74% 43% 48%
Ratio of deferred variable/total variable
remuneration in %
93%
69%
94%
71%
77%
Derived metrics for BELGIUM for 2011 Total Monetary Amount in Euro per business area
Business Area
Metric
Investment banking Retail banking Asset Other business
Total management areas
Number of high earners 4 0 0 4 8
Number of high earners that are identified staff 2 0 0 4 6
Total fixed remuneration 1,300,000 0 0 3,990,000 5,290,000
Total variable remuneration 4,474,000 0 0 1,790,000 6,264,000
Total amount of variable remuneration deferred 1,300,000 0 0 780,000 2,080,000
Total amount of discretionary pension benefits 0 0 0 0 0
Average Total Remuneration per Individual 1,443,500 . . 1,445,000 1,444,250
Ratio variable/fixed remuneration in % 344% . . 45% 118%
Ratio variable/total remuneration in % 77% . . 31% 54%
Ratio of deferred variable/total variable
remuneration in %
29%
.
.
44%
33%
Derived metrics for BULGARIA for 2011 Total Monetary Amount in Euro per business area
Business Area
Metric
Investment banking Retail banking Asset Other business
Total management areas
Number of high earners 0 0 0 0 0
Number of high earners that are identified staff 0 0 0 0 0
Total fixed remuneration 0 0 0 0 0
Total variable remuneration 0 0 0 0 0
Total amount of variable remuneration deferred
in Year N
0
0
0
0
0
Total amount of discretionary pension benefits 0
0 0 0 0
Average Total Remuneration per Individual . . . . .
Ratio variable/fixed remuneration in % . . . . .
Ratio variable/total remuneration in % . . . . .
Ratio of deferred variable/total variable
remuneration in %
.
.
.
.
.

16
Derived metrics for CYPRUS for 2011
Total Monetary Amount in Euro per business area
Business Area
Metric
Investment banking Retail banking Asset Other business
Total management areas
Number of high earners 0 0 0 4 4
Number of high earners that are identified staff 0 0 0 4 4
Total fixed remuneration 0 0 0 3,663,297 3,663,297
Total variable remuneration 0 0 0 2,717,210 2,717,210
Total amount of variable remuneration deferred
in Year N
0
0
0
167,640
167,640
Total amount of discretionary pension benefits 0 0 0 0 0
Average Total Remuneration per Individual . . . 1,595,127 1,595,127
Ratio variable/fixed remuneration in % . . . 74% 74%
Ratio variable/total remuneration in % . . . 43% 43%
Ratio of deferred variable/total variable . . . 6% 6%
Derived metrics for CZECH REPUBLIC for 2011 Total Monetary Amount in Euro per business area
Business Area
Metric
Investment banking Retail banking Asset Other business
Total management areas
Number of high earners 0 0 0 0 0
Number of high earners that are identified staff 0
0 0 0 0
Total fixed remuneration 0 0 0 0 0
Total variable remuneration 0 0 0 0 0
Total amount of variable remuneration deferred
in Year N
0
0
0
0
0
Total amount of discretionary pension benefits 0
0 0 0 0
Average Total Remuneration per Individual . . . . .
Ratio variable/fixed remuneration in % . . . . .
Ratio variable/total remuneration in % . . . . .
Ratio of deferred variable/total variable
remuneration in %
.
.
.
.
.
Derived metrics for DENMARK for 2011 Total Monetary Amount in Euro per business area
Business Area
Metric
Investment banking Retail banking m
Asset Other business Total
anagement areas
Number of high earners 21 2 2 8 33
Number of high earners that are identified staff 18 2 1 8 29
Total fixed remuneration 11,711,441 1,909,024 800,000 15,174,492 29,594,957
Total variable remuneration 13,378,706 601,225 1,600,000 3,434,265 19,014,196
Total amount of variable remuneration deferred
in Year N
6,576,312
436,080
500,000
97,216
7,609,608
Total amount of discretionary pension benefits 229,863 0 0 0 229,863
Average Total Remuneration per Individual 1,194,769 1,255,125 1,200,000 2,326,095 1,473,005
Ratio variable/fixed remuneration in % 114% 31% 200% 23% 64%
Ratio variable/total remuneration in % 53% 24% 67% 18% 39%
Ratio of deferred variable/total variable
remuneration in %
49%
73%
31%
3%
40%

17
Derived metrics for ESTONIA for 2011
Total Monetary Amount in Euro per business area
Business Area
Metric
Investment banking Retail banking Asset Other business
Total management areas
Number of high earners 0 0 0 0 0
Number of high earners that are identified staff 0 0 0 0 0
Total fixed remuneration 0 0 0 0 0
Total variable remuneration 0 0 0 0 0
Total amount of variable remuneration deferred
in Year N
0
0
0
0
0
Total amount of discretionary pension benefits 0 0 0 0 0
Average Total Remuneration per Individual . . . . .
Ratio variable/fixed remuneration in % . . . . .
Ratio variable/total remuneration in % . . . . .
Ratio of deferred variable/total variable
remuneration in %
.
.
.
.
.
Derived metrics for FINLAND for 2011
Total Monetary Amount in Euro per business area
Business Area
Metric
Investment banking Retail banking Asset Other business
Total management areas
Number of high earners 1 0 1 1 3
Number of high earners that are identified staff 1 0 1 1 3
Total fixed remuneration 400,000 0 200,000 800,000 1,400,000
Total variable remuneration 700,000 0 800,000 400,000 1,900,000
Total amount of variable remuneration deferred
in Year N
400,000
0
0
300,000
700,000
Total amount of discretionary pension benefits 0
0 0 0 0
Average Total Remuneration per Individual 1,100,000 . 1,000,000 1,200,000 1,100,000
Ratio variable/fixed remuneration in % 175% . 400% 50% 136%
Ratio variable/total remuneration in % 64% . 80% 33% 58%
Ratio of deferred variable/total variable
remuneration in %
57%
.
0%
75%
37%
Derived metrics for FRANCE for 2011 Total Monetary Amount in Euro per business area
Business Area
Metric
Investment banking Retail banking Asset Other business
Total management areas
Number of high earners 101 5 13 43 162
Number of high earners that are identified staff 63 4 5 35 107
Total fixed remuneration 27,550,663 2,531,439 3,781,150 20,500,869 54,364,121
Total variable remuneration 130,454,066 3,136,596 17,652,364 51,516,399 202,759,425
Total amount of variable remuneration deferred
in Year N
91,655,288
490,748
8,503,474
28,177,479
128,826,989
Total amount of discretionary pension benefits 0 0 0 101,590 101,590
Average Total Remuneration per Individual 1,564,403 1,133,607 1,648,732 1,674,820 1,587,182
Ratio variable/fixed remuneration in % 474% 124% 467% 251% 373%
Ratio variable/total remuneration in % 83% 55% 82% 72% 79%
Ratio of deferred variable/total variable
remuneration in %
70%
16%
48%
55%
64%

18
Derived metrics for GERMANY for 2011
Total Monetary Amount in Euro per business area
Business Area
Metric
Investment banking Retail banking As
mana
set Other business Total
gement areas
Number of high earners 1 3 0 4 8
Number of high earners that are identified staff 1 3 0 4 8
Total fixed remuneration 242,000 957,000 0 1,795,000 2,994,000
Total variable remuneration 1,001,000 2,860,000 0 4,915,000 8,776,000
Total amount of variable remuneration deferred
in Year N
901,000
1,405,000
0
2,399,000
4,705,000
Total amount of discretionary pension benefits 0 0 0 0 0
Average Total Remuneration per Individual 1,243,000 1,272,333 . 1,677,500 1,471,250
Ratio variable/fixed remuneration in % 414% 299% . 274% 293%
Ratio variable/total remuneration in % 81% 75% . 73% 75%
Ratio of deferred variable/total variable
remuneration in %
90%
49%
.
49%
54%
Metric
Investment banking Retail banking m
Asset Other business Total
anagement areas
Number of high earners 90 10 6 64 170
Number of high earners that are identified staff 59 10 5 50 124
Total fixed remuneration 32,663,213 6,110,000 6,832,067 40,373,778 85,979,058
Total variable remuneration 115,525,754 12,582,000 5,293,194 92,620,296 226,021,244
Total amount of variable remuneration deferred
in Year N
92,591,875
1,063,000
3,457,117
59,782,806
156,894,798
Total amount of discretionary pension benefits 0 0 0 0 0
Average Total Remuneration per Individual 1,646,544 1,869,200 2,020,877 2,078,032 1,835,296
Ratio variable/fixed remuneration in % 354% 206% 77% 229% 263%
Ratio variable/total remuneration in % 78% 67% 44% 70% 72%
Ratio of deferred variable/total variable
remuneration in %
80%
8%
65%
65%
69%
Derived metrics for GREECE for 2011
Total Monetary Amount in Euro per business area
Business Area
Metric
Investment banking Retail banking Asset Other business
Total management areas
Number of high earners 1 0 0 1 2
Number of high earners that are identified staff 0 0 0 1 1
Total fixed remuneration 310,000 0 0 2,023,000 2,333,000
Total variable remuneration 1,125,000 0 0 630,000 1,755,000
Total amount of variable remuneration deferred
in Year N
393,750
0
0
0
393,750
Total amount of discretionary pension benefits 0
0 0 0 0
Average Total Remuneration per Individual 1,435,000 . . 2,653,000 2,044,000
Ratio variable/fixed remuneration in % 363% . . 31% 75%
Ratio variable/total remuneration in % 78% . . 24% 43%
Ratio of deferred variable/total variable
remuneration in %
35%
.
.
0%
22%
Derived metrics for HUNGARY for 2011* Total Monetary Amount in Euro per business area
Business Area
* Hungary started to collect information in 2011, the figures for 2010 were reported from other Member States only

19
Derived metrics for IRELAND for 2011 Total Monetary Amount in Euro per business area
Business Area
Metric
Investment banking Retail banking Asset Other business
Total management areas
Number of high earners 14 0 3 4 21
Number of high earners that are identified staff 12 0 1 4 17
Total fixed remuneration 3,605,459 0 685,000 2,373,000 6,663,459
Total variable remuneration 15,369,657 0 3,398,987 3,630,000 22,398,644
Total amount of variable remuneration deferred
in Year N
11,899,665
0
2,891,682
2,100,000
16,891,347
Total amount of discretionary pension benefits 87,548
0 0 30,000 117,548
Average Total Remuneration per Individual 1,355,365 . 1,361,329 1,500,750 1,383,910
Ratio variable/fixed remuneration in % 426% . 496% 153% 336%
Ratio variable/total remuneration in % 81% . 83% 60% 77%
Ratio of deferred variable/total variable
remuneration in %
77%
.
85%
58%
75%
Derived metrics for ITALY for 2011 Total Monetary Amount in Euro per business area
Business Area
Metric
Investment banking Retail banking Asset Other business
Total management areas
Number of high earners 32 14 9 41 96
Number of high earners that are identified staff 21 11 5 34 71
Total fixed remuneration 22,887,115 11,590,692 4,235,963 44,339,206 83,052,976
Total variable remuneration 31,000,900 11,494,301 12,613,824 19,892,938 75,001,963
Total amount of variable remuneration deferred
in Year N
14,490,840
4,394,300
7,427,824
6,710,805
33,023,769
Total amount of discretionary pension benefits 0 0 0 546,000 546,000
Average Total Remuneration per Individual 1,684,000 1,648,928 1,872,199 1,566,638 1,646,406
Ratio variable/fixed remuneration in % 135% 99% 298% 45% 90%
Ratio variable/total remuneration in % 58% 50% 75% 31% 47%
Ratio of deferred variable/total variable
remuneration in %
47%
38%
59%
34%
44%
Derived metrics for LATVIA for 2011 Total Monetary Amount in Euro per business area
Business Area
Metric
Investment banking Retail banking Asset Other business
Total management areas
Number of high earners 0 0 0 0 0
Number of high earners that are identified staff 0 0 0 0 0
Total fixed remuneration 0 0 0 0 0
Total variable remuneration 0 0 0 0 0
Total amount of variable remuneration deferred
in Year N
0
0
0
0
0
Total amount of discretionary pension benefits 0
0 0 0 0
Average Total Remuneration per Individual . . . . .
Ratio variable/fixed remuneration in % . . . . .
Ratio variable/total remuneration in % . . . . .
Ratio of deferred variable/total variable
remuneration in %
.
.
.
.
.

20
Derived metrics for LITHUANIA for 2011
Total Monetary Amount in Euro per business area
Business Area
Metric
Investment banking Retail banking Asset Other business
Total management areas
Number of high earners 0 0 0 0 0
Number of high earners that are identified staff 0 0 0 0 0
Total fixed remuneration 0 0 0 0 0
Total variable remuneration 0 0 0 0 0
Total amount of variable remuneration deferred
in Year N
0
0
0
0
0
Total amount of discretionary pension benefits 0
0 0 0 0
Average Total Remuneration per Individual . . . . .
Ratio variable/fixed remuneration in % . . . . .
Ratio variable/total remuneration in % . . . . .
Ratio of deferred variable/total variable
remuneration in %
.
.
.
.
.
Derived metrics for LUXEMBOURG for 2011 Total Monetary Amount in Euro per business area
Business Area
Metric
Investment banking Retail banking Asset Other business
Total management areas
Number of high earners 1 0 2 7 10
Number of high earners that are identified staff 1 0 2 6 9
Total fixed remuneration 328,199 0 2,340,000 3,786,000 6,454,199
Total variable remuneration 677,994 0 1,480,000 8,016,000 10,173,994
Total amount of variable remuneration deferred
in Year N
406,796
0
760,000
2,837,000
4,003,796
Total amount of discretionary pension benefits 0
0 0 0 0
Average Total Remuneration per Individual 1,006,193 . 1,910,000 1,686,000 1,662,819
Ratio variable/fixed remuneration in % 207% . 63% 212% 158%
Ratio variable/total remuneration in % 67% . 39% 68% 61%
Ratio of deferred variable/total variable
remuneration in %
60%
.
51%
35%
39%
Derived metrics for MALTA for 2011 Total Monetary Amount in Euro per business area
Business Area
Metric
Investment banking Retail banking Asset Other business
Total management areas
Number of high earners 0 0 0 0 0
Number of high earners that are identified staff 0 0 0 0 0
Total fixed remuneration 0 0 0 0 0
Total variable remuneration 0 0 0 0 0
Total amount of variable remuneration deferred
in Year N
0
0
0
0
0
Total amount of discretionary pension benefits 0
0 0 0 0
Average Total Remuneration per Individual . . . . .
Ratio variable/fixed remuneration in % . . . . .
Ratio variable/total remuneration in % . . . . .
Ratio of deferred variable/total variable
remuneration in %
.
.
.
.
.

Derived metrics for NETHERLANDS for 2011
Total Monetary Amount in Euro per business area
Business Area
21
Metric
Investment banking Retail banking Asset Other business
Total management areas
Number of high earners 15 0 0 4 19
Number of high earners that are identified staff 12 0 0 4 16
Total fixed remuneration 4,387,000 0 0 4,000,000 8,387,000
Total variable remuneration 11,484,000 0 0 800,000 12,284,000
Total amount of variable remuneration deferred
in Year N
5,897,000
0
0
500,000
6,397,000
Total amount of discretionary pension benefits 0 0 0 0 0
Average Total Remuneration per Individual 1,058,067 . . 1,200,000 1,087,947
Ratio variable/fixed remuneration in % 262% . . 20% 146%
Ratio variable/total remuneration in % 72% . . 17% 59%
Ratio of deferred variable/total variable
remuneration in %
51%
.
.
63%
52%
Metric
Investment banking Retail banking Asset Other business
Total management areas
Number of high earners 1 0 0 3 4
Number of high earners that are identified staff 0 0 0 3 3
Total fixed remuneration 200,000 0 0 1,441,556 1,641,556
Total variable remuneration 1,010,000 0 0 3,540,500 4,550,500
Total amount of variable remuneration deferred
in Year N
310,000
0
0
1,711,000
2,021,000
Total amount of discretionary pension benefits 0 0 0 0 0
Average Total Remuneration per Individual 1,210,000 . . 1,660,685 1,548,014
Ratio variable/fixed remuneration in % 505% . . 246% 277%
Ratio variable/total remuneration in % 83% . . 71% 73%
Ratio of deferred variable/total variable
remuneration in %
31%
.
.
48%
44%
Metric
Investment banking Retail banking m
Asset Other business Total
anagement areas
Number of high earners 14 4 3 15 36
Number of high earners that are identifi ed staff 10 4 3 15 32
Total fixed remuneration 5,970,000 2,544,000 1,690,000 12,773,703 22,977,703
Total variable remuneration 16,938,950 2,160,375 1,990,550 9,154,662 30,244,537
Total amount of variable remuneration in Year N
deferred 7,785,300 1,130,225 1,111,830 5,616,997 15,644,352
Total amount of discretionary pension b enefits 0 0 0 154,000 154,000
Average Total Remuneration per Individ ual 1,636,354 1,176,094 1,226,850 1,461,891 1,478,396
Ratio variable/fixed remuneration in % 284% 85% 118% 72% 132%
Ratio variable/total remuneration in % 74% 46% 54% 42% 57%
Ratio of deferred variable/total variable remuneration in % 46% 52% 56% 61% 52%
Derived metrics for NORWAY for 2011** Total Monetary Amount in Euro per business area
Business Area
**Norway started to collect information in 2011, the figures for 2010 were reported from other Member States only
Derived metrics for POLAND for 2011***
Total Monetary Amount in Euro per business area
Business Area
*** Poland did not collect information on High Earners for 2011, data shown in this table was reported from other Member States only

22
Derived metrics for PORTUGAL for 2011 Total Monetary Amount in Euro per business area
Business Area
Metric
Investment banking Retail banking As
mana
set Other business Total
gement areas
Number of high earners 1 10 0 0 11
Number of high earners that are identified staff 1 10 0 0 11
Total fixed remuneration 451,000 4,751,664 0 0 5,202,664
Total variable remuneration 1,395,010 11,079,556 0 0 12,474,566
Total amount of variable remuneration deferred
in Year N
311,926
3,166,760
0
0
3,478,686
Total amount of discretionary pension benefits 807,084 5,060,620 0 0 5,867,704
Average Total Remuneration per Individual 1,846,010 1,583,122 . . 1,607,021
Ratio variable/fixed remuneration in % 309% 233% . . 240%
Ratio variable/total remuneration in % 76% 70% . . 71%
Ratio of deferred variable/total variable
remuneration in %
22%
29%
.
.
28%
Derived metrics for ROMANIA for 2011 Total Monetary Amount in Euro per business area
Business Area
Metric
Investment banking Retail banking Asset Other business
Total management areas
Number of high earners 0 0 0 0 0
Number of high earners that are identified staff 0 0 0 0 0
Total fixed remuneration 0 0 0 0 0
Total variable remuneration 0 0 0 0 0
Total amount of variable remuneration deferred
in Year N
0
0
0
0
0
Total amount of discretionary pension benefits 0
0 0 0 0
Average Total Remuneration per Individual . . . . .
Ratio variable/fixed remuneration in % . . . . .
Ratio variable/total remuneration in % . . . . .
Ratio of deferred variable/total variable
remuneration in %
.
.
.
.
.
Derived metrics for SLOVAKIA for 2011 Total Monetary Amount in Euro per business area
Business Area
Metric
Investment banking Retail banking Asset Other business
Total management areas
Number of high earners 0 0 1 1 2
Number of high earners that are identified staff 0 0 1 1 2
Total fixed remuneration 0 0 180,000 0 180,000
Total variable remuneration 0 0 1,821,000 1,619,000 3,440,000
Total amount of variable remuneration deferred
in Year N
0
0
0
0
0
Total amount of discretionary pension benefits 0
0 0 0 0
Average Total Remuneration per Individual . . 2,001,000 1,619,000 1,810,000
Ratio variable/fixed remuneration in % . . 1012% . 1911%
Ratio variable/total remuneration in % . . 91% 100% 95%
Ratio of deferred variable/total variable
remuneration in %
.
.
0%
0%
0%
23
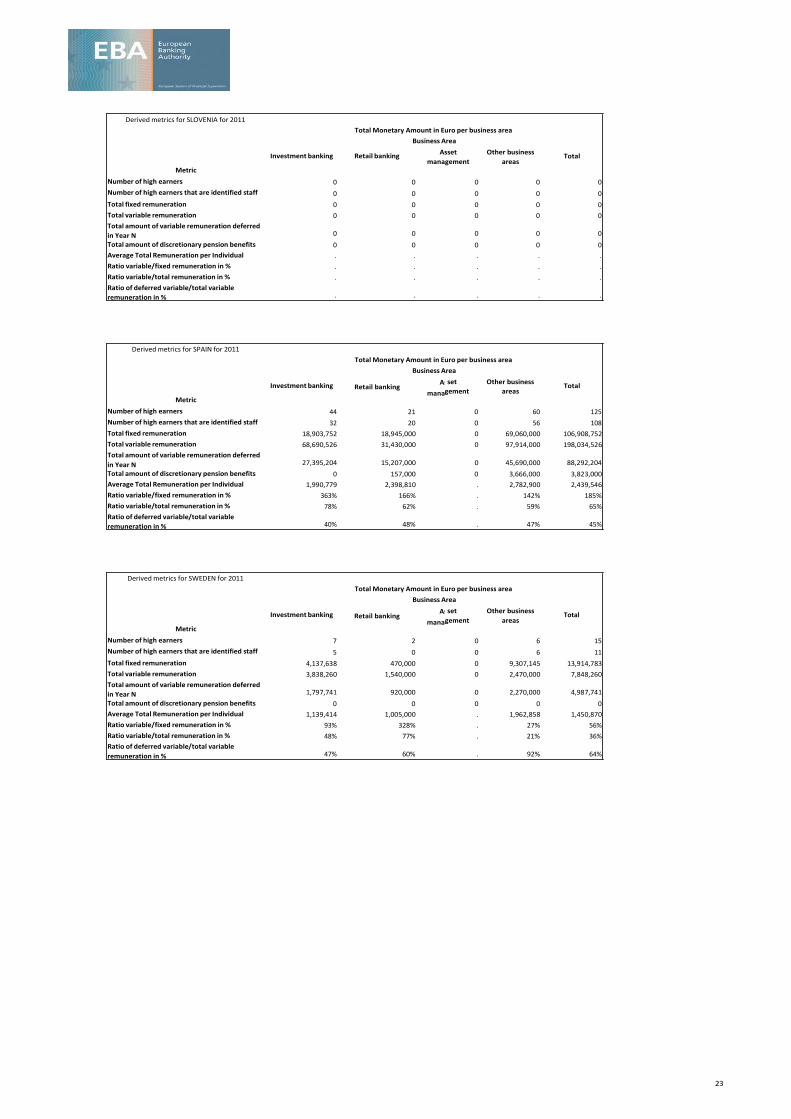
Derived metrics for SLOVENIA for 2011
Total Monetary Amount in Euro per business area
Business Area
Metric
Investment banking Retail banking Asset Other business
Total management areas
Number of high earners 0 0 0 0 0
Number of high earners that are identified staff 0 0 0 0 0
Total fixed remuneration 0 0 0 0 0
Total variable remuneration 0 0 0 0 0
Total amount of variable remuneration deferred
in Year N
0
0
0
0
0
Total amount of discretionary pension benefits 0
0 0 0 0
Average Total Remuneration per Individual . . . . .
Ratio variable/fixed remuneration in % . . . . .
Ratio variable/total remuneration in % . . . . .
Ratio of deferred variable/total variable
remuneration in %
.
.
.
.
.
Derived metrics for SPAIN for 2011 Total Monetary Amount in Euro per business area
Business Area
Metric
Investment banking Retail banking As
mana
set Other business Total
gement areas
Number of high earners 44 21 0 60 125
Number of high earners that are identified staff 32 20 0 56 108
Total fixed remuneration 18,903,752 18,945,000 0 69,060,000 106,908,752
Total variable remuneration 68,690,526 31,430,000 0 97,914,000 198,034,526
Total amount of variable remuneration deferred
in Year N
27,395,204
15,207,000
0
45,690,000
88,292,204
Total amount of discretionary pension benefits 0 157,000 0 3,666,000 3,823,000
Average Total Remuneration per Individual 1,990,779 2,398,810 . 2,782,900 2,439,546
Ratio variable/fixed remuneration in % 363% 166% . 142% 185%
Ratio variable/total remuneration in % 78% 62% . 59% 65%
Ratio of deferred variable/total variable
remuneration in %
40%
48%
.
47%
45%
Derived metrics for SWEDEN for 2011 Total Monetary Amount in Euro per business area
Business Area
Metric
Investment banking Retail banking As
mana
set Other business Total
gement areas
Number of high earners 7 2 0 6 15
Number of high earners that are identified staff 5 0 0 6 11
Total fixed remuneration 4,137,638 470,000 0 9,307,145 13,914,783
Total variable remuneration 3,838,260 1,540,000 0 2,470,000 7,848,260
Total amount of variable remuneration deferred
in Year N
1,797,741
920,000
0
2,270,000
4,987,741
Total amount of discretionary pension benefits 0 0 0 0 0
Average Total Remuneration per Individual 1,139,414 1,005,000 . 1,962,858 1,450,870
Ratio variable/fixed remuneration in % 93% 328% . 27% 56%
Ratio variable/total remuneration in % 48% 77% . 21% 36%
Ratio of deferred variable/total variable
remuneration in %
47%
60%
.
92%
64%

24
Derived metrics for UNITED KINGDOM for 2011
Total Monetary Amount in Euro per business area
Business Area
Metric
Investment banking Retail banking Asset Other business
Total management areas
Number of high earners 1,809 85 182 360 2,436
Number of high earners that are identified staff 697 41 87 175 1,000
Total fixed remuneration 506,043,777 25,894,646 48,304,513 204,262,233 784,505,169
Total variable remuneration 1,992,881,855 68,849,368 163,182,709 493,053,777 2,717,967,709
Total amount of variable remuneration deferred
in Year N
1,327,316,281
45,803,974
84,661,277
320,187,582
1,777,969,114
Total amount of discretionary pension benefits 5,400,257 656,734 568,506 4,017,145 10,642,642
Average Total Remuneration per Individual 1,381,385 1,114,635 1,162,018 1,936,989 1,437,797
Ratio variable/fixed remuneration in % 394% 266% 338% 241% 346%
Ratio variable/total remuneration in % 80% 73% 77% 71% 78%
Ratio of deferred variable/total variable
remuneration in %
67%
67%
52%
65%
65%

European Banking Authority
Tower 42 - 25, Old Broad Street ● London EC2N 1 HQ - United Kingdom