eba report high earners 2012
TRANSCRIPT
EBA REPORTHigh Earners2012 data

Table of contents
1 Introduction 3
2 Template 4
3 2012 data 5
Page 2 of 16
Introduction
2012 report on the data collection exercise for high earners
Directive 2010/76/EC (CRDIII) introduced the requirement that home Member State competent authorities have to collect information on the number of individuals per credit institution in pay brackets of at least EUR 1 million, including the business area involved and the main elements of salary, bonus, long-term award and pension contribution. That information shall be forwarded to the EBA, which shall disclose it on an aggregate home Member State basis in a common reporting format. To facilitate the data collection, the EBA published 'Guidelines on the data collection exercise for High Earners' in 2012, which include the template used for the data collection.
Within this report the EBA presents the results of the data collection exercise regarding High Earners. According to the mandate, the report contains the aggregated data regarding High Earners for 2012, showing the number of High Earners for each Member State and the amount of remuneration awarded, separated into business areas and including the main elements of remuneration for each financial year.
National competent authorities have collected the data on High Earners from institutions on a consolidated basis, but have separated the data into figures for each Member State. All figures received from national competent authorities have been aggregated by the EBA and represent the remuneration paid to High Earners in the given Member State, including remuneration paid to staff by a subsidiary or branch of a EU parent institution which is located in another Member State, the data should also comprise branches of third country institutions. All but one Member States of the European Union have participated in this exercise. Croatia was not yet covered by the scope of the data collection exercise. The data for Poland contain in 2012 for the first time data reported by the polish authorities. Data from EEA countries was available from Iceland and Norway.
Page 3 of 16
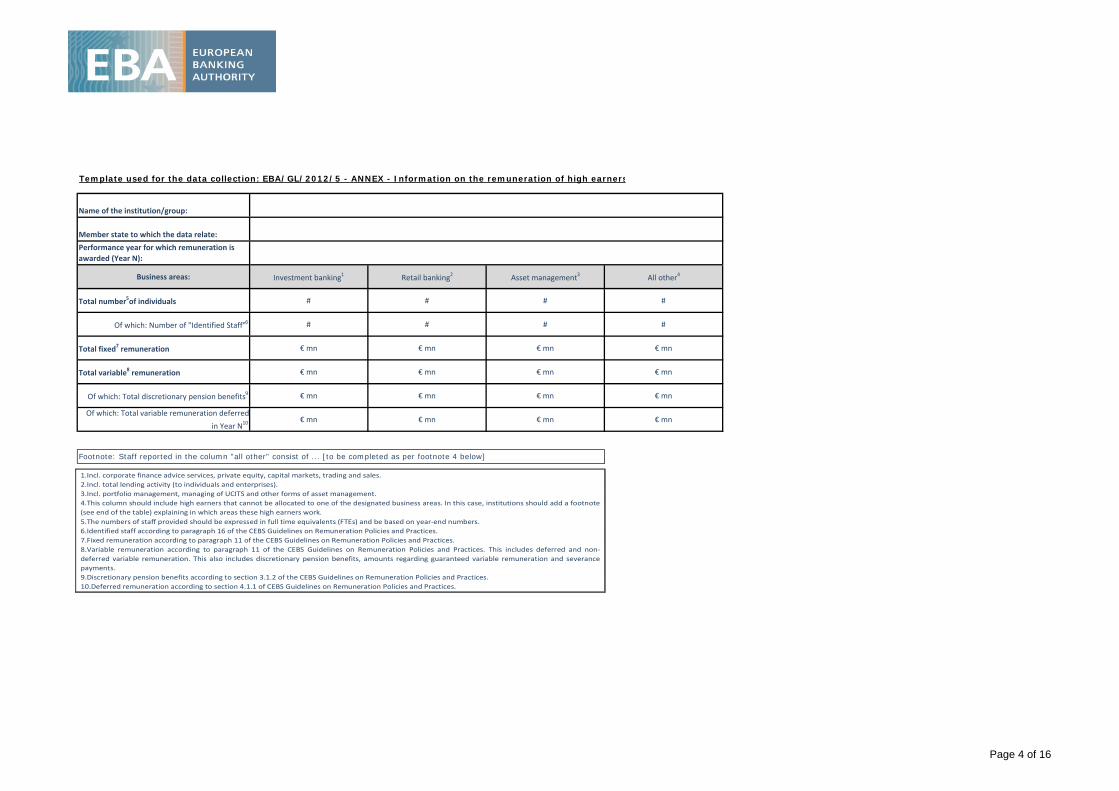
Template used for the data collection: EBA/GL/2012/5 - ANNEX - Information on the remuneration of high earners
Name of the institution/group:
Member state to which the data relate:
Performance year for which remuneration is
awarded (Year N):
Business areas: Investment banking1 Retail banking2 Asset management3 All other4
Total number5of individuals # # # #
Of which: Number of "Identified Staff"6 # # # #
Total fixed7 remuneration € mn € mn € mn € mn
Total variable8 remuneration € mn € mn € mn € mn
Of which: Total discretionary pension benefits9 € mn € mn € mn € mn
Of which: Total variable remuneration deferred
in Year N10 € mn € mn € mn € mn
Footnote: Staff reported in the column "all other" consist of ... [to be completed as per footnote 4 below]
1.Incl. corporate finance advice services, private equity, capital markets, trading and sales.
2.Incl. total lending activity (to individuals and enterprises).
3.Incl. portfolio management, managing of UCITS and other forms of asset management.
4.This column should include high earners that cannot be allocated to one of the designated business areas. In this case, institutions should add a footnote
(see end of the table) explaining in which areas these high earners work.
5.The numbers of staff provided should be expressed in full time equivalents (FTEs) and be based on year‐end numbers.
6.Identified staff according to paragraph 16 of the CEBS Guidelines on Remuneration Policies and Practices.
7.Fixed remuneration according to paragraph 11 of the CEBS Guidelines on Remuneration Policies and Practices.
8.Variable remuneration according to paragraph 11 of the CEBS Guidelines on Remuneration Policies and Practices. This includes deferred and non‐
deferred variable remuneration. This also includes discretionary pension benefits, amounts regarding guaranteed variable remuneration and severance
payments.
9.Discretionary pension benefits according to section 3.1.2 of the CEBS Guidelines on Remuneration Policies and Practices.
10.Deferred remuneration according to section 4.1.1 of CEBS Guidelines on Remuneration Policies and Practices.
Page 4 of 16
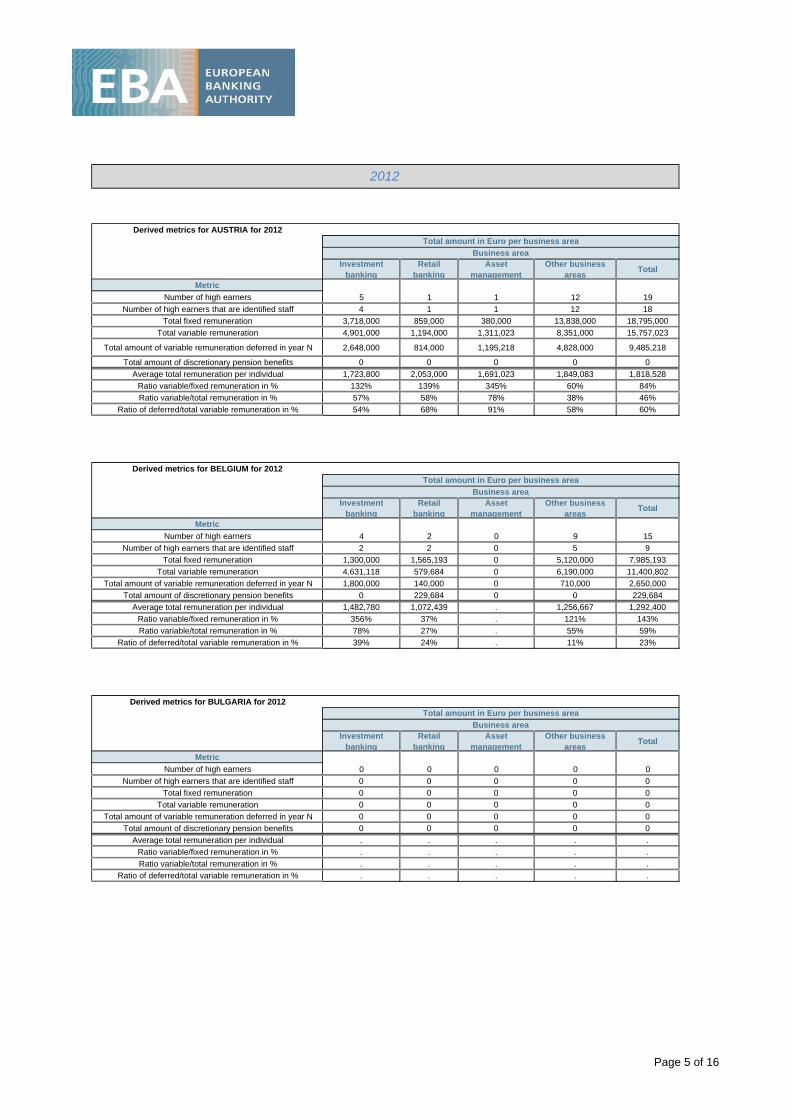
Derived metrics for AUSTRIA for 2012
Investment banking
Retail banking
Asset management
Other business areas
Total
Metric
Number of high earners
Number of high earners that are identified staff 4 1 1 12 18
Total fixed remuneration 3,718,000 859,000 380,000 13,838,000 18,795,000
Total variable remuneration 4,901,000 1,194,000 1,311,023 8,351,000 15,757,023
Total amount of variable remuneration deferred in year N 2,648,000 814,000 1,195,218 4,828,000 9,485,218
Total amount of discretionary pension benefits 0 0 0 0 0
Average total remuneration per individual 1,723,800 2,053,000 1,691,023 1,849,083 1,818,528
Ratio variable/fixed remuneration in % 132% 139% 345% 60% 84%
Ratio variable/total remuneration in % 57% 58% 78% 38% 46%
Ratio of deferred/total variable remuneration in % 54% 68% 91% 58% 60%
Derived metrics for BELGIUM for 2012
Investment banking
Retail banking
Asset management
Other business areas
Total
Metric
Number of high earners
Number of high earners that are identified staff 2 2 0 5 9
Total fixed remuneration 1,300,000 1,565,193 0 5,120,000 7,985,193
Total variable remuneration 4,631,118 579,684 0 6,190,000 11,400,802
Total amount of variable remuneration deferred in year N 1,800,000 140,000 0 710,000 2,650,000
Total amount of discretionary pension benefits 0 229,684 0 0 229,684
Average total remuneration per individual 1,482,780 1,072,439 . 1,256,667 1,292,400
Ratio variable/fixed remuneration in % 356% 37% . 121% 143%
Ratio variable/total remuneration in % 78% 27% . 55% 59%
Ratio of deferred/total variable remuneration in % 39% 24% . 11% 23%
Derived metrics for BULGARIA for 2012
Investment banking
Retail banking
Asset management
Other business areas
Total
Metric
Number of high earners
Number of high earners that are identified staff 0 0 0 0 0
Total fixed remuneration 0 0 0 0 0
Total variable remuneration 0 0 0 0 0
Total amount of variable remuneration deferred in year N 0 0 0 0 0
Total amount of discretionary pension benefits 0 0 0 0 0
Average total remuneration per individual . . . . .
Ratio variable/fixed remuneration in % . . . . .
Ratio variable/total remuneration in % . . . . .
Ratio of deferred/total variable remuneration in % . . . . .
Total amount in Euro per business area
Business area
4 2 0 9 15
2012
Total amount in Euro per business area
Business area
5 1 1 12 19
Total amount in Euro per business area
Business area
0 0 0 0 0
Page 5 of 16
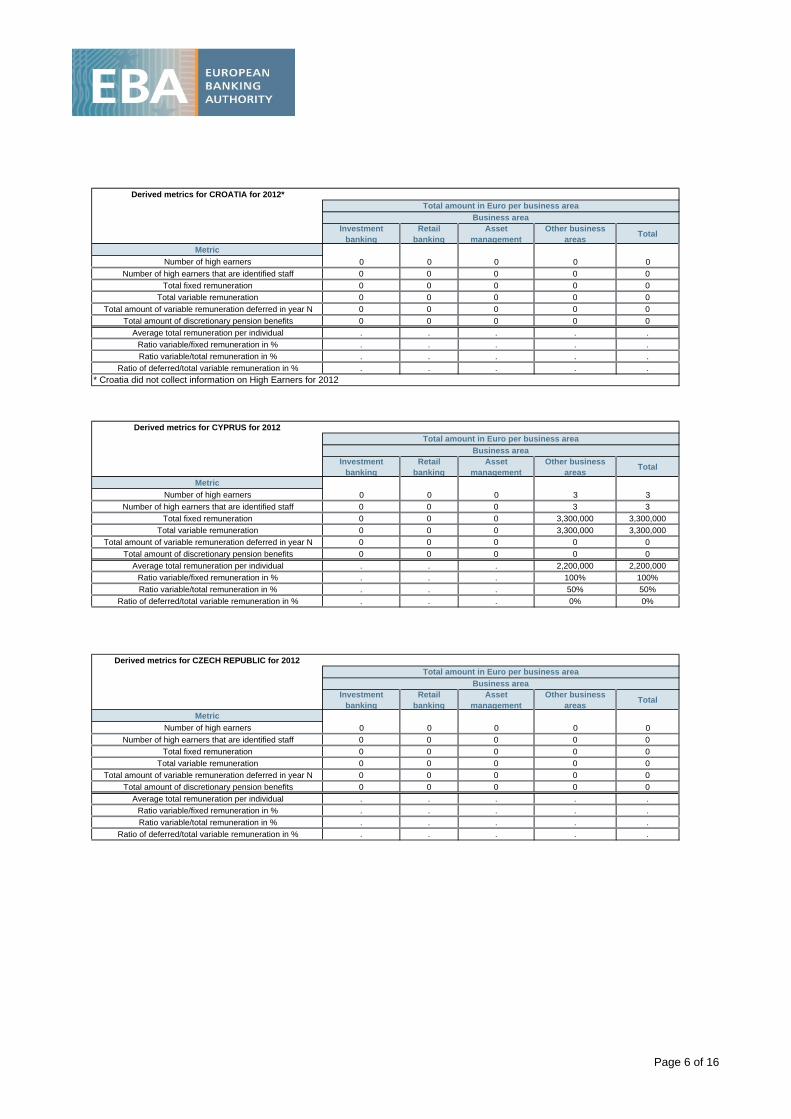
Derived metrics for CROATIA for 2012*
Investment banking
Retail banking
Asset management
Other business areas
Total
Metric
Number of high earners
Number of high earners that are identified staff 0 0 0 0 0
Total fixed remuneration 0 0 0 0 0
Total variable remuneration 0 0 0 0 0
Total amount of variable remuneration deferred in year N 0 0 0 0 0
Total amount of discretionary pension benefits 0 0 0 0 0
Average total remuneration per individual . . . . .
Ratio variable/fixed remuneration in % . . . . .
Ratio variable/total remuneration in % . . . . .
Ratio of deferred/total variable remuneration in % . . . . .
* Croatia did not collect information on High Earners for 2012
Derived metrics for CYPRUS for 2012
Investment banking
Retail banking
Asset management
Other business areas
Total
Metric
Number of high earners
Number of high earners that are identified staff 0 0 0 3 3
Total fixed remuneration 0 0 0 3,300,000 3,300,000
Total variable remuneration 0 0 0 3,300,000 3,300,000
Total amount of variable remuneration deferred in year N 0 0 0 0 0
Total amount of discretionary pension benefits 0 0 0 0 0
Average total remuneration per individual . . . 2,200,000 2,200,000
Ratio variable/fixed remuneration in % . . . 100% 100%
Ratio variable/total remuneration in % . . . 50% 50%
Ratio of deferred/total variable remuneration in % . . . 0% 0%
Derived metrics for CZECH REPUBLIC for 2012
Investment banking
Retail banking
Asset management
Other business areas
Total
Metric
Number of high earners
Number of high earners that are identified staff 0 0 0 0 0
Total fixed remuneration 0 0 0 0 0
Total variable remuneration 0 0 0 0 0
Total amount of variable remuneration deferred in year N 0 0 0 0 0
Total amount of discretionary pension benefits 0 0 0 0 0
Average total remuneration per individual . . . . .
Ratio variable/fixed remuneration in % . . . . .
Ratio variable/total remuneration in % . . . . .
Ratio of deferred/total variable remuneration in % . . . . .
Total amount in Euro per business area
Business area
0 0 0 0 0
Total amount in Euro per business area
Business area
0 0 0 0 0
Total amount in Euro per business area
Business area
0 0 0 3 3
Page 6 of 16
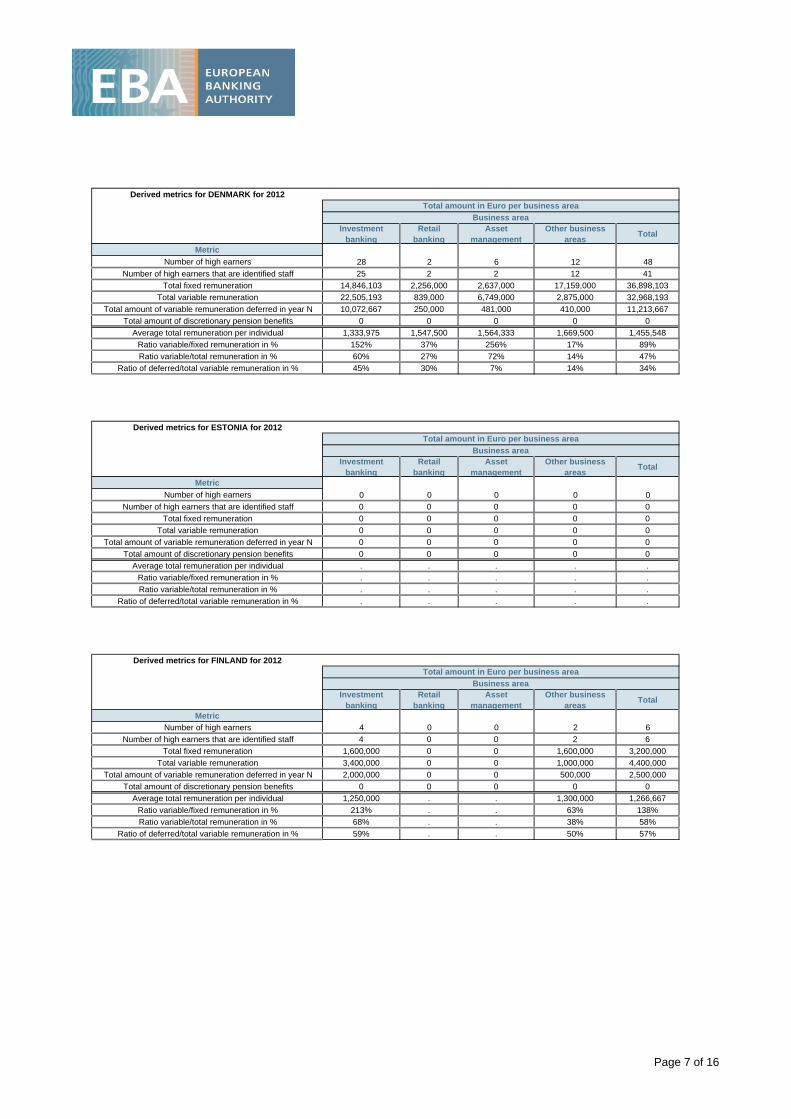
Derived metrics for DENMARK for 2012
Investment banking
Retail banking
Asset management
Other business areas
Total
Metric
Number of high earners
Number of high earners that are identified staff 25 2 2 12 41
Total fixed remuneration 14,846,103 2,256,000 2,637,000 17,159,000 36,898,103
Total variable remuneration 22,505,193 839,000 6,749,000 2,875,000 32,968,193
Total amount of variable remuneration deferred in year N 10,072,667 250,000 481,000 410,000 11,213,667
Total amount of discretionary pension benefits 0 0 0 0 0
Average total remuneration per individual 1,333,975 1,547,500 1,564,333 1,669,500 1,455,548
Ratio variable/fixed remuneration in % 152% 37% 256% 17% 89%
Ratio variable/total remuneration in % 60% 27% 72% 14% 47%
Ratio of deferred/total variable remuneration in % 45% 30% 7% 14% 34%
Derived metrics for ESTONIA for 2012
Investment banking
Retail banking
Asset management
Other business areas
Total
Metric
Number of high earners
Number of high earners that are identified staff 0 0 0 0 0
Total fixed remuneration 0 0 0 0 0
Total variable remuneration 0 0 0 0 0
Total amount of variable remuneration deferred in year N 0 0 0 0 0
Total amount of discretionary pension benefits 0 0 0 0 0
Average total remuneration per individual . . . . .
Ratio variable/fixed remuneration in % . . . . .
Ratio variable/total remuneration in % . . . . .
Ratio of deferred/total variable remuneration in % . . . . .
Derived metrics for FINLAND for 2012
Investment banking
Retail banking
Asset management
Other business areas
Total
Metric
Number of high earners
Number of high earners that are identified staff 4 0 0 2 6
Total fixed remuneration 1,600,000 0 0 1,600,000 3,200,000
Total variable remuneration 3,400,000 0 0 1,000,000 4,400,000
Total amount of variable remuneration deferred in year N 2,000,000 0 0 500,000 2,500,000
Total amount of discretionary pension benefits 0 0 0 0 0
Average total remuneration per individual 1,250,000 . . 1,300,000 1,266,667
Ratio variable/fixed remuneration in % 213% . . 63% 138%
Ratio variable/total remuneration in % 68% . . 38% 58%
Ratio of deferred/total variable remuneration in % 59% . . 50% 57%
Total amount in Euro per business area
Business area
0 0 0 0 0
Total amount in Euro per business area
Business area
28 2 6 12 48
Total amount in Euro per business area
Business area
4 0 0 2 6
Page 7 of 16
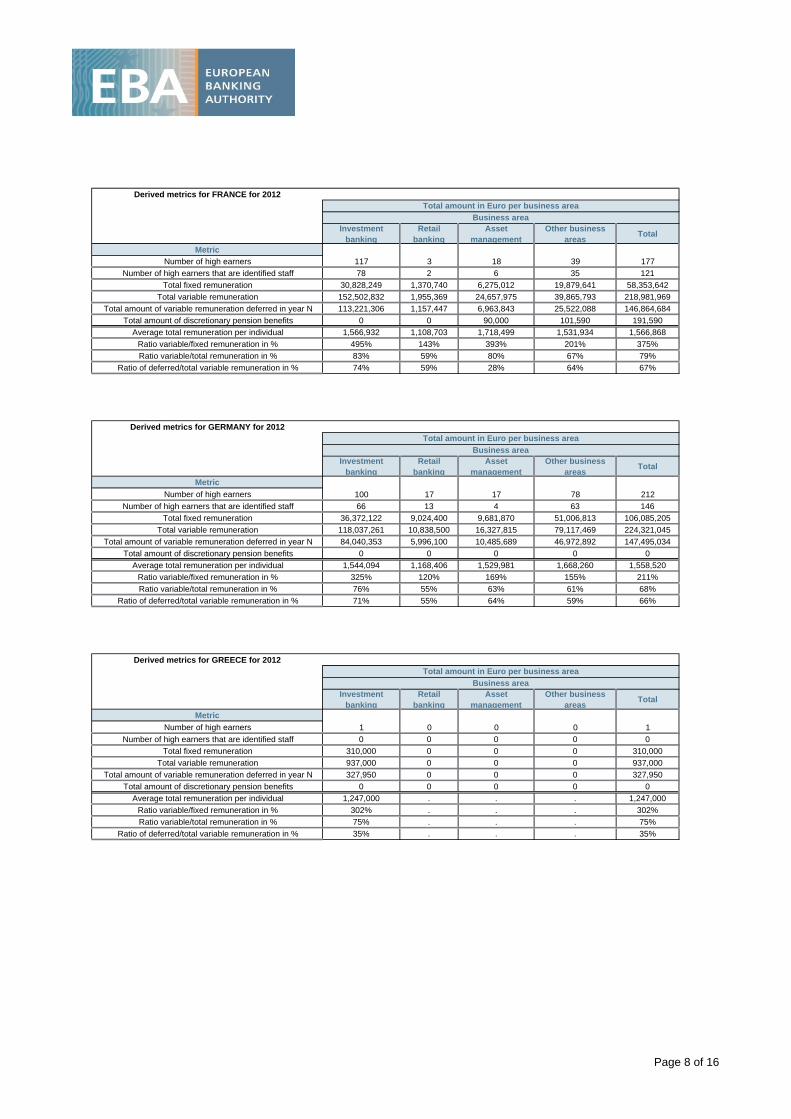
Derived metrics for FRANCE for 2012
Investment banking
Retail banking
Asset management
Other business areas
Total
Metric
Number of high earners
Number of high earners that are identified staff 78 2 6 35 121
Total fixed remuneration 30,828,249 1,370,740 6,275,012 19,879,641 58,353,642
Total variable remuneration 152,502,832 1,955,369 24,657,975 39,865,793 218,981,969
Total amount of variable remuneration deferred in year N 113,221,306 1,157,447 6,963,843 25,522,088 146,864,684
Total amount of discretionary pension benefits 0 0 90,000 101,590 191,590
Average total remuneration per individual 1,566,932 1,108,703 1,718,499 1,531,934 1,566,868
Ratio variable/fixed remuneration in % 495% 143% 393% 201% 375%
Ratio variable/total remuneration in % 83% 59% 80% 67% 79%
Ratio of deferred/total variable remuneration in % 74% 59% 28% 64% 67%
Derived metrics for GERMANY for 2012
Investment banking
Retail banking
Asset management
Other business areas
Total
Metric
Number of high earners
Number of high earners that are identified staff 66 13 4 63 146
Total fixed remuneration 36,372,122 9,024,400 9,681,870 51,006,813 106,085,205
Total variable remuneration 118,037,261 10,838,500 16,327,815 79,117,469 224,321,045
Total amount of variable remuneration deferred in year N 84,040,353 5,996,100 10,485,689 46,972,892 147,495,034
Total amount of discretionary pension benefits 0 0 0 0 0
Average total remuneration per individual 1,544,094 1,168,406 1,529,981 1,668,260 1,558,520
Ratio variable/fixed remuneration in % 325% 120% 169% 155% 211%
Ratio variable/total remuneration in % 76% 55% 63% 61% 68%
Ratio of deferred/total variable remuneration in % 71% 55% 64% 59% 66%
Derived metrics for GREECE for 2012
Investment banking
Retail banking
Asset management
Other business areas
Total
Metric
Number of high earners
Number of high earners that are identified staff 0 0 0 0 0
Total fixed remuneration 310,000 0 0 0 310,000
Total variable remuneration 937,000 0 0 0 937,000
Total amount of variable remuneration deferred in year N 327,950 0 0 0 327,950
Total amount of discretionary pension benefits 0 0 0 0 0
Average total remuneration per individual 1,247,000 . . . 1,247,000
Ratio variable/fixed remuneration in % 302% . . . 302%
Ratio variable/total remuneration in % 75% . . . 75%
Ratio of deferred/total variable remuneration in % 35% . . . 35%
Total amount in Euro per business area
Business area
117 3 18 39 177
Total amount in Euro per business area
Business area
1 0 0 0 1
Total amount in Euro per business area
Business area
100 17 17 78 212
Page 8 of 16
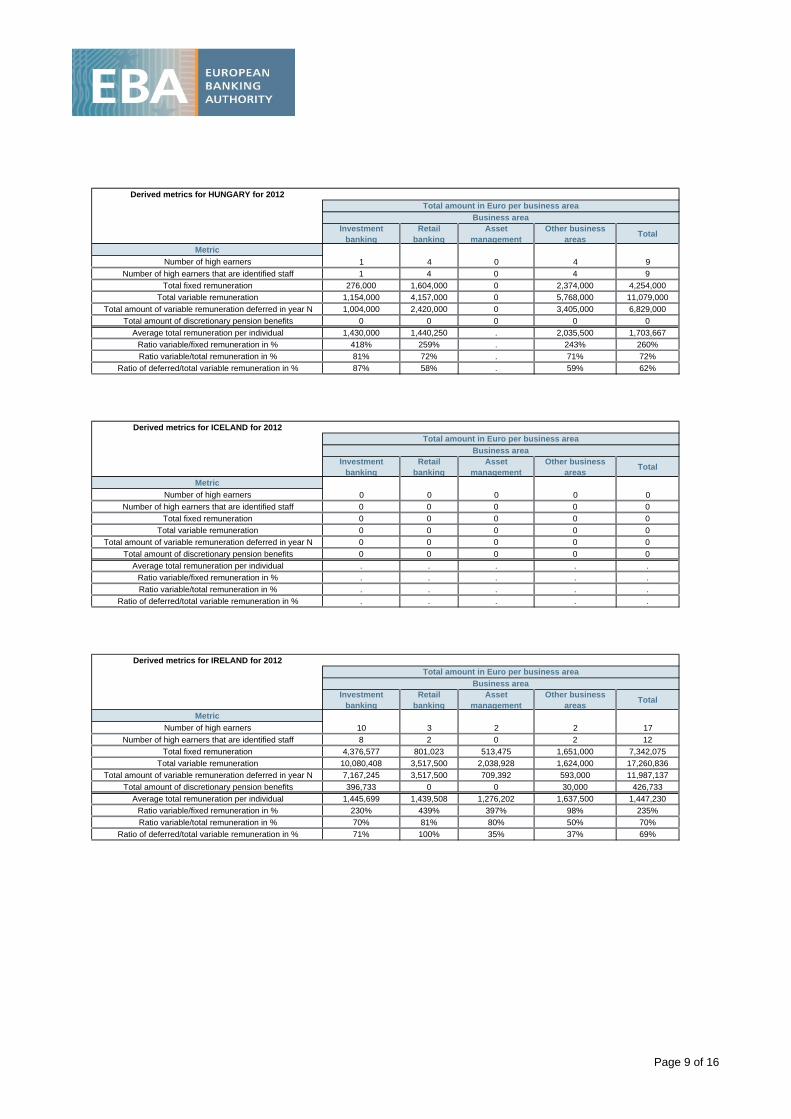
Derived metrics for HUNGARY for 2012
Investment banking
Retail banking
Asset management
Other business areas
Total
Metric
Number of high earners
Number of high earners that are identified staff 1 4 0 4 9
Total fixed remuneration 276,000 1,604,000 0 2,374,000 4,254,000
Total variable remuneration 1,154,000 4,157,000 0 5,768,000 11,079,000
Total amount of variable remuneration deferred in year N 1,004,000 2,420,000 0 3,405,000 6,829,000
Total amount of discretionary pension benefits 0 0 0 0 0
Average total remuneration per individual 1,430,000 1,440,250 . 2,035,500 1,703,667
Ratio variable/fixed remuneration in % 418% 259% . 243% 260%
Ratio variable/total remuneration in % 81% 72% . 71% 72%
Ratio of deferred/total variable remuneration in % 87% 58% . 59% 62%
Derived metrics for ICELAND for 2012
Investment banking
Retail banking
Asset management
Other business areas
Total
Metric
Number of high earners
Number of high earners that are identified staff 0 0 0 0 0
Total fixed remuneration 0 0 0 0 0
Total variable remuneration 0 0 0 0 0
Total amount of variable remuneration deferred in year N 0 0 0 0 0
Total amount of discretionary pension benefits 0 0 0 0 0
Average total remuneration per individual . . . . .
Ratio variable/fixed remuneration in % . . . . .
Ratio variable/total remuneration in % . . . . .
Ratio of deferred/total variable remuneration in % . . . . .
Derived metrics for IRELAND for 2012
Investment banking
Retail banking
Asset management
Other business areas
Total
Metric
Number of high earners
Number of high earners that are identified staff 8 2 0 2 12
Total fixed remuneration 4,376,577 801,023 513,475 1,651,000 7,342,075
Total variable remuneration 10,080,408 3,517,500 2,038,928 1,624,000 17,260,836
Total amount of variable remuneration deferred in year N 7,167,245 3,517,500 709,392 593,000 11,987,137
Total amount of discretionary pension benefits 396,733 0 0 30,000 426,733
Average total remuneration per individual 1,445,699 1,439,508 1,276,202 1,637,500 1,447,230
Ratio variable/fixed remuneration in % 230% 439% 397% 98% 235%
Ratio variable/total remuneration in % 70% 81% 80% 50% 70%
Ratio of deferred/total variable remuneration in % 71% 100% 35% 37% 69%
Total amount in Euro per business area
Business area
0 0 0 0 0
Total amount in Euro per business area
Business area
1 4 0 4 9
Total amount in Euro per business area
Business area
10 3 2 2 17
Page 9 of 16
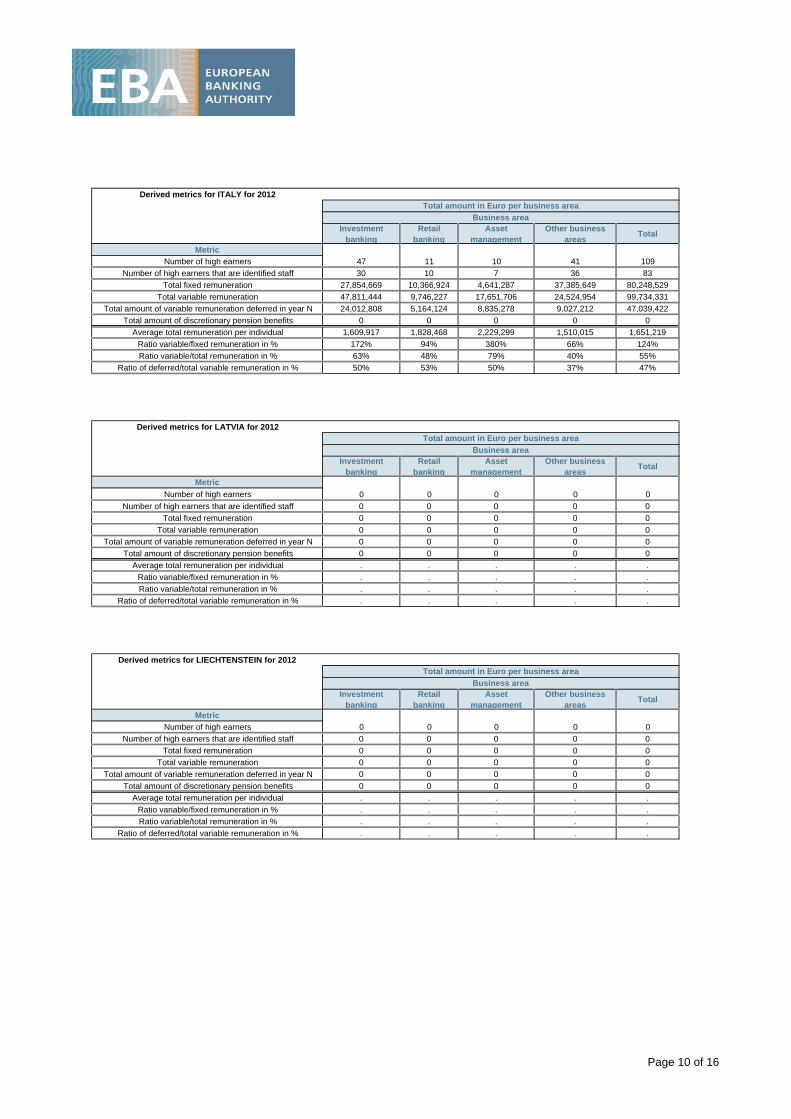
Derived metrics for ITALY for 2012
Investment banking
Retail banking
Asset management
Other business areas
Total
Metric
Number of high earners
Number of high earners that are identified staff 30 10 7 36 83
Total fixed remuneration 27,854,669 10,366,924 4,641,287 37,385,649 80,248,529
Total variable remuneration 47,811,444 9,746,227 17,651,706 24,524,954 99,734,331
Total amount of variable remuneration deferred in year N 24,012,808 5,164,124 8,835,278 9,027,212 47,039,422
Total amount of discretionary pension benefits 0 0 0 0 0
Average total remuneration per individual 1,609,917 1,828,468 2,229,299 1,510,015 1,651,219
Ratio variable/fixed remuneration in % 172% 94% 380% 66% 124%
Ratio variable/total remuneration in % 63% 48% 79% 40% 55%
Ratio of deferred/total variable remuneration in % 50% 53% 50% 37% 47%
Derived metrics for LATVIA for 2012
Investment banking
Retail banking
Asset management
Other business areas
Total
Metric
Number of high earners
Number of high earners that are identified staff 0 0 0 0 0
Total fixed remuneration 0 0 0 0 0
Total variable remuneration 0 0 0 0 0
Total amount of variable remuneration deferred in year N 0 0 0 0 0
Total amount of discretionary pension benefits 0 0 0 0 0
Average total remuneration per individual . . . . .
Ratio variable/fixed remuneration in % . . . . .
Ratio variable/total remuneration in % . . . . .
Ratio of deferred/total variable remuneration in % . . . . .
Derived metrics for LIECHTENSTEIN for 2012
Investment banking
Retail banking
Asset management
Other business areas
Total
Metric
Number of high earners
Number of high earners that are identified staff 0 0 0 0 0
Total fixed remuneration 0 0 0 0 0
Total variable remuneration 0 0 0 0 0
Total amount of variable remuneration deferred in year N 0 0 0 0 0
Total amount of discretionary pension benefits 0 0 0 0 0
Average total remuneration per individual . . . . .
Ratio variable/fixed remuneration in % . . . . .
Ratio variable/total remuneration in % . . . . .
Ratio of deferred/total variable remuneration in % . . . . .
Total amount in Euro per business area
Business area
47 11 10 41 109
Total amount in Euro per business area
Business area
0 0 0 0 0
Total amount in Euro per business area
Business area
0 0 0 0 0
Page 10 of 16
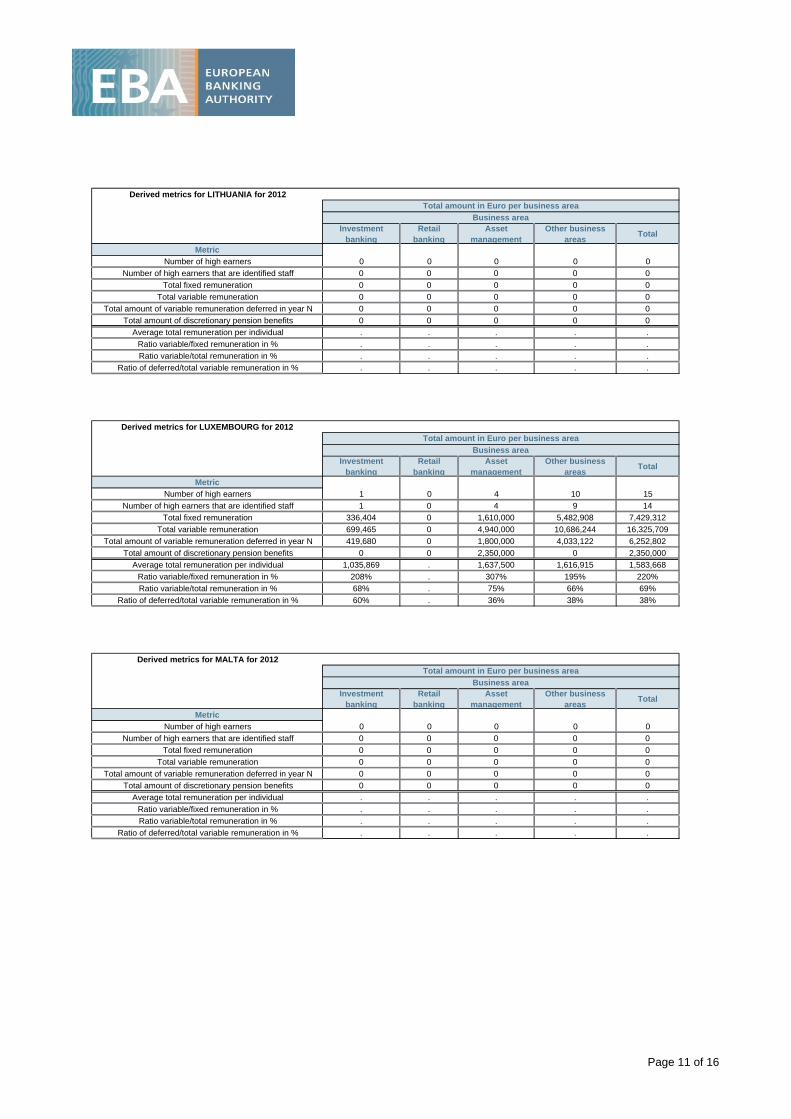
Derived metrics for LITHUANIA for 2012
Investment banking
Retail banking
Asset management
Other business areas
Total
Metric
Number of high earners
Number of high earners that are identified staff 0 0 0 0 0
Total fixed remuneration 0 0 0 0 0
Total variable remuneration 0 0 0 0 0
Total amount of variable remuneration deferred in year N 0 0 0 0 0
Total amount of discretionary pension benefits 0 0 0 0 0
Average total remuneration per individual . . . . .
Ratio variable/fixed remuneration in % . . . . .
Ratio variable/total remuneration in % . . . . .
Ratio of deferred/total variable remuneration in % . . . . .
Derived metrics for LUXEMBOURG for 2012
Investment banking
Retail banking
Asset management
Other business areas
Total
Metric
Number of high earners
Number of high earners that are identified staff 1 0 4 9 14
Total fixed remuneration 336,404 0 1,610,000 5,482,908 7,429,312
Total variable remuneration 699,465 0 4,940,000 10,686,244 16,325,709
Total amount of variable remuneration deferred in year N 419,680 0 1,800,000 4,033,122 6,252,802
Total amount of discretionary pension benefits 0 0 2,350,000 0 2,350,000
Average total remuneration per individual 1,035,869 . 1,637,500 1,616,915 1,583,668
Ratio variable/fixed remuneration in % 208% . 307% 195% 220%
Ratio variable/total remuneration in % 68% . 75% 66% 69%
Ratio of deferred/total variable remuneration in % 60% . 36% 38% 38%
Derived metrics for MALTA for 2012
Investment banking
Retail banking
Asset management
Other business areas
Total
Metric
Number of high earners
Number of high earners that are identified staff 0 0 0 0 0
Total fixed remuneration 0 0 0 0 0
Total variable remuneration 0 0 0 0 0
Total amount of variable remuneration deferred in year N 0 0 0 0 0
Total amount of discretionary pension benefits 0 0 0 0 0
Average total remuneration per individual . . . . .
Ratio variable/fixed remuneration in % . . . . .
Ratio variable/total remuneration in % . . . . .
Ratio of deferred/total variable remuneration in % . . . . .
Total amount in Euro per business area
Business area
1 0 4 10 15
Total amount in Euro per business area
Business area
0 0 0 0 0
Total amount in Euro per business area
Business area
0 0 0 0 0
Page 11 of 16
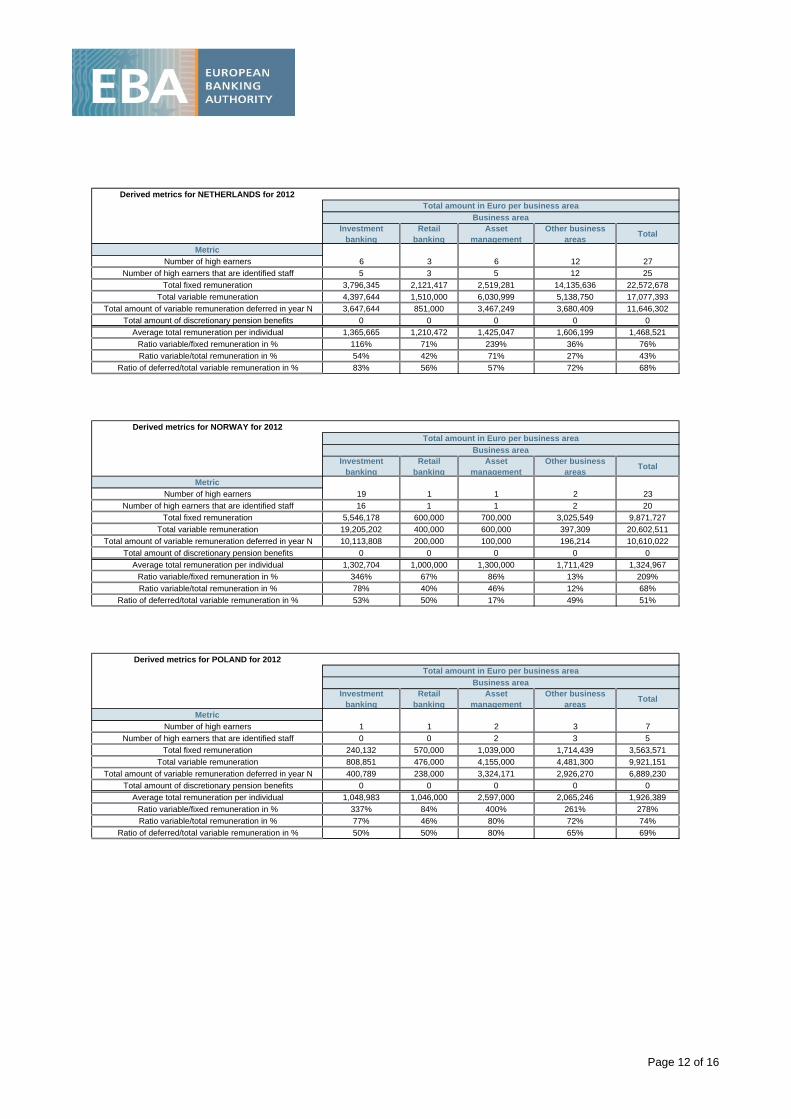
Derived metrics for NETHERLANDS for 2012
Investment banking
Retail banking
Asset management
Other business areas
Total
Metric
Number of high earners
Number of high earners that are identified staff 5 3 5 12 25
Total fixed remuneration 3,796,345 2,121,417 2,519,281 14,135,636 22,572,678
Total variable remuneration 4,397,644 1,510,000 6,030,999 5,138,750 17,077,393
Total amount of variable remuneration deferred in year N 3,647,644 851,000 3,467,249 3,680,409 11,646,302
Total amount of discretionary pension benefits 0 0 0 0 0
Average total remuneration per individual 1,365,665 1,210,472 1,425,047 1,606,199 1,468,521
Ratio variable/fixed remuneration in % 116% 71% 239% 36% 76%
Ratio variable/total remuneration in % 54% 42% 71% 27% 43%
Ratio of deferred/total variable remuneration in % 83% 56% 57% 72% 68%
Derived metrics for NORWAY for 2012
Investment banking
Retail banking
Asset management
Other business areas
Total
Metric
Number of high earners
Number of high earners that are identified staff 16 1 1 2 20
Total fixed remuneration 5,546,178 600,000 700,000 3,025,549 9,871,727
Total variable remuneration 19,205,202 400,000 600,000 397,309 20,602,511
Total amount of variable remuneration deferred in year N 10,113,808 200,000 100,000 196,214 10,610,022
Total amount of discretionary pension benefits 0 0 0 0 0
Average total remuneration per individual 1,302,704 1,000,000 1,300,000 1,711,429 1,324,967
Ratio variable/fixed remuneration in % 346% 67% 86% 13% 209%
Ratio variable/total remuneration in % 78% 40% 46% 12% 68%
Ratio of deferred/total variable remuneration in % 53% 50% 17% 49% 51%
Derived metrics for POLAND for 2012
Investment banking
Retail banking
Asset management
Other business areas
Total
Metric
Number of high earners
Number of high earners that are identified staff 0 0 2 3 5
Total fixed remuneration 240,132 570,000 1,039,000 1,714,439 3,563,571
Total variable remuneration 808,851 476,000 4,155,000 4,481,300 9,921,151
Total amount of variable remuneration deferred in year N 400,789 238,000 3,324,171 2,926,270 6,889,230
Total amount of discretionary pension benefits 0 0 0 0 0
Average total remuneration per individual 1,048,983 1,046,000 2,597,000 2,065,246 1,926,389
Ratio variable/fixed remuneration in % 337% 84% 400% 261% 278%
Ratio variable/total remuneration in % 77% 46% 80% 72% 74%
Ratio of deferred/total variable remuneration in % 50% 50% 80% 65% 69%
Total amount in Euro per business area
Business area
6 3 6 12 27
Total amount in Euro per business area
Business area
1 1 2 3 7
Total amount in Euro per business area
Business area
19 1 1 2 23
Page 12 of 16
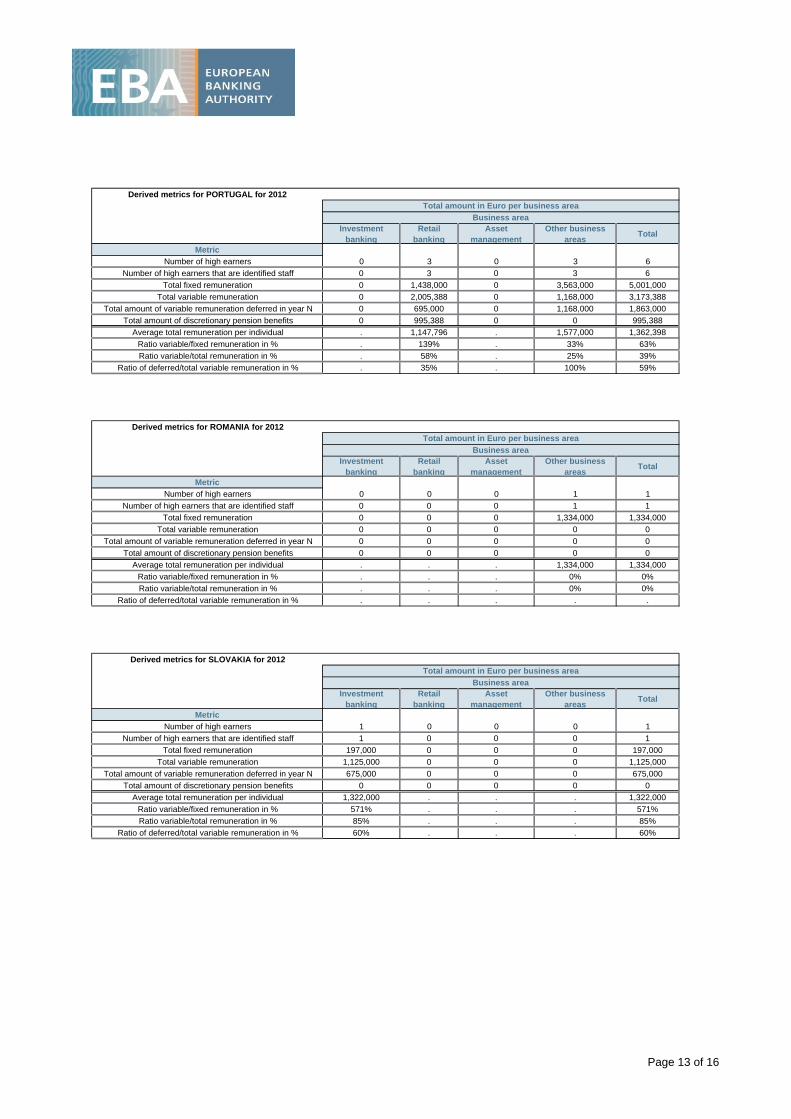
Derived metrics for PORTUGAL for 2012
Investment banking
Retail banking
Asset management
Other business areas
Total
Metric
Number of high earners
Number of high earners that are identified staff 0 3 0 3 6
Total fixed remuneration 0 1,438,000 0 3,563,000 5,001,000
Total variable remuneration 0 2,005,388 0 1,168,000 3,173,388
Total amount of variable remuneration deferred in year N 0 695,000 0 1,168,000 1,863,000
Total amount of discretionary pension benefits 0 995,388 0 0 995,388
Average total remuneration per individual . 1,147,796 . 1,577,000 1,362,398
Ratio variable/fixed remuneration in % . 139% . 33% 63%
Ratio variable/total remuneration in % . 58% . 25% 39%
Ratio of deferred/total variable remuneration in % . 35% . 100% 59%
Derived metrics for ROMANIA for 2012
Investment banking
Retail banking
Asset management
Other business areas
Total
Metric
Number of high earners
Number of high earners that are identified staff 0 0 0 1 1
Total fixed remuneration 0 0 0 1,334,000 1,334,000
Total variable remuneration 0 0 0 0 0
Total amount of variable remuneration deferred in year N 0 0 0 0 0
Total amount of discretionary pension benefits 0 0 0 0 0
Average total remuneration per individual . . . 1,334,000 1,334,000
Ratio variable/fixed remuneration in % . . . 0% 0%
Ratio variable/total remuneration in % . . . 0% 0%
Ratio of deferred/total variable remuneration in % . . . . .
Derived metrics for SLOVAKIA for 2012
Investment banking
Retail banking
Asset management
Other business areas
Total
Metric
Number of high earners
Number of high earners that are identified staff 1 0 0 0 1
Total fixed remuneration 197,000 0 0 0 197,000
Total variable remuneration 1,125,000 0 0 0 1,125,000
Total amount of variable remuneration deferred in year N 675,000 0 0 0 675,000
Total amount of discretionary pension benefits 0 0 0 0 0
Average total remuneration per individual 1,322,000 . . . 1,322,000
Ratio variable/fixed remuneration in % 571% . . . 571%
Ratio variable/total remuneration in % 85% . . . 85%
Ratio of deferred/total variable remuneration in % 60% . . . 60%
Total amount in Euro per business area
Business area
0 0 0 1 1
Total amount in Euro per business area
Business area
0 3 0 3 6
Total amount in Euro per business area
Business area
1 0 0 0 1
Page 13 of 16
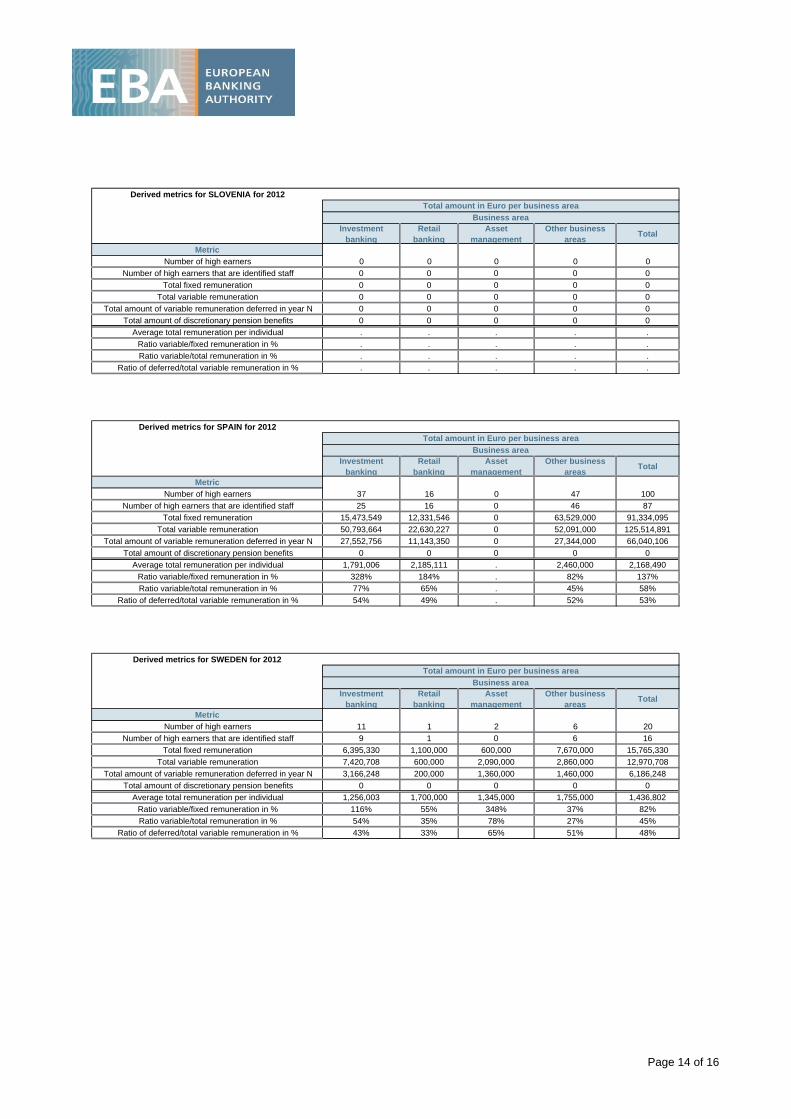
Derived metrics for SLOVENIA for 2012
Investment banking
Retail banking
Asset management
Other business areas
Total
Metric
Number of high earners
Number of high earners that are identified staff 0 0 0 0 0
Total fixed remuneration 0 0 0 0 0
Total variable remuneration 0 0 0 0 0
Total amount of variable remuneration deferred in year N 0 0 0 0 0
Total amount of discretionary pension benefits 0 0 0 0 0
Average total remuneration per individual . . . . .
Ratio variable/fixed remuneration in % . . . . .
Ratio variable/total remuneration in % . . . . .
Ratio of deferred/total variable remuneration in % . . . . .
Derived metrics for SPAIN for 2012
Investment banking
Retail banking
Asset management
Other business areas
Total
Metric
Number of high earners
Number of high earners that are identified staff 25 16 0 46 87
Total fixed remuneration 15,473,549 12,331,546 0 63,529,000 91,334,095
Total variable remuneration 50,793,664 22,630,227 0 52,091,000 125,514,891
Total amount of variable remuneration deferred in year N 27,552,756 11,143,350 0 27,344,000 66,040,106
Total amount of discretionary pension benefits 0 0 0 0 0
Average total remuneration per individual 1,791,006 2,185,111 . 2,460,000 2,168,490
Ratio variable/fixed remuneration in % 328% 184% . 82% 137%
Ratio variable/total remuneration in % 77% 65% . 45% 58%
Ratio of deferred/total variable remuneration in % 54% 49% . 52% 53%
Derived metrics for SWEDEN for 2012
Investment banking
Retail banking
Asset management
Other business areas
Total
Metric
Number of high earners
Number of high earners that are identified staff 9 1 0 6 16
Total fixed remuneration 6,395,330 1,100,000 600,000 7,670,000 15,765,330
Total variable remuneration 7,420,708 600,000 2,090,000 2,860,000 12,970,708
Total amount of variable remuneration deferred in year N 3,166,248 200,000 1,360,000 1,460,000 6,186,248
Total amount of discretionary pension benefits 0 0 0 0 0
Average total remuneration per individual 1,256,003 1,700,000 1,345,000 1,755,000 1,436,802
Ratio variable/fixed remuneration in % 116% 55% 348% 37% 82%
Ratio variable/total remuneration in % 54% 35% 78% 27% 45%
Ratio of deferred/total variable remuneration in % 43% 33% 65% 51% 48%
37 16 0 47
Business area
0 0 0 0 0
Total amount in Euro per business area
Business area
Total amount in Euro per business area
Business area
11 1 2 6 20
100
Total amount in Euro per business area
Page 14 of 16
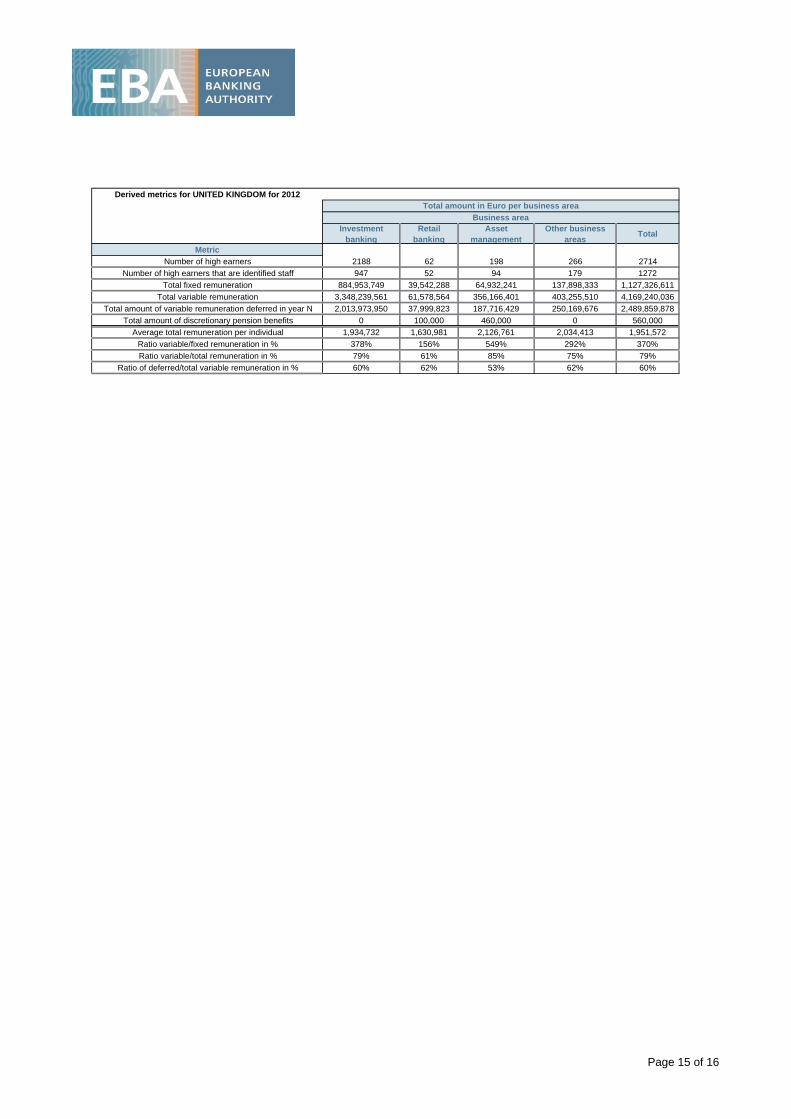
Derived metrics for UNITED KINGDOM for 2012
Investment banking
Retail banking
Asset management
Other business areas
Total
Metric
Number of high earners
Number of high earners that are identified staff 947 52 94 179 1272
Total fixed remuneration 884,953,749 39,542,288 64,932,241 137,898,333 1,127,326,611
Total variable remuneration 3,348,239,561 61,578,564 356,166,401 403,255,510 4,169,240,036
Total amount of variable remuneration deferred in year N 2,013,973,950 37,999,823 187,716,429 250,169,676 2,489,859,878
Total amount of discretionary pension benefits 0 100,000 460,000 0 560,000
Average total remuneration per individual 1,934,732 1,630,981 2,126,761 2,034,413 1,951,572
Ratio variable/fixed remuneration in % 378% 156% 549% 292% 370%
Ratio variable/total remuneration in % 79% 61% 85% 75% 79%
Ratio of deferred/total variable remuneration in % 60% 62% 53% 62% 60%
Total amount in Euro per business area
Business area
2188 62 198 266 2714
Page 15 of 16

1
EUROPEAN BANKING AUTHORITY_____________________________Tower 42, 25 Old Broad StreetLondon EC2N 1HQ_____________________________Tel: +44 2073821770Fax: +44 207382177‐1/2_____________________________E‐mail: [email protected]://www.eba.europa.eu_____________________________