eazybi remote community day 2020 opening · using charts i timeline chart customization using...
TRANSCRIPT

Remote Community Day 2020
Raimonds Simanovskis

Raimonds Simanovskis
Founder & CEO


eazyBI Remote Community Day 2020

Agenda8:00 PDT | 11:00 EDT Opening Keynote: Latest eazyBI Features & Future Plans Raimonds Simanovskis
8:30 PDT | 11:30 EDT eazyBI + Confluence: The First Date Zane Baranovska, Martins Vanags
9:00 PDT | 12:00 EDT 30-min Break
9:30 PDT | 12:30 EDT Jira Admin’s Journey to eazyBI Gerda Zandersone
10:00 PDT | 13:00 EDT How to Create Smart Reports Without MDX Ilze Leite-Apine
10:30 PDT | 13:30 EDT Behind Complex Filters Daina Tupule
11:00 PDT | 14:00 EDT 30-min Break
11:30 PDT | 14:30 EDT Things to Know About the Burn-Down Chart Janis Plume
12:00 PDT | 15:00 EDT Don’t Make Me Think About UI Janis Liepa
12:20 PDT | 15:20 EDT Managing a Remote Team: eazyBI Experience Raimonds Simanovskis, Ilze Leite-Apine
13:00 PDT | 16:00 EDT Wrap Up & Closing

eazybi-community.slack.com

community.eazybi.com

eazyBI Team

Team Names 2020

Latest Features


eazyBI 5.1 Features Highlights
• DevOps metrics from Bitbucket pull requests,Bamboo builds, Jira incidents
• Predefined Time dimension calculated members Current month, Last 12 months, Last 30 days, ...
• Charts library update, highlight chart series on mouse hover
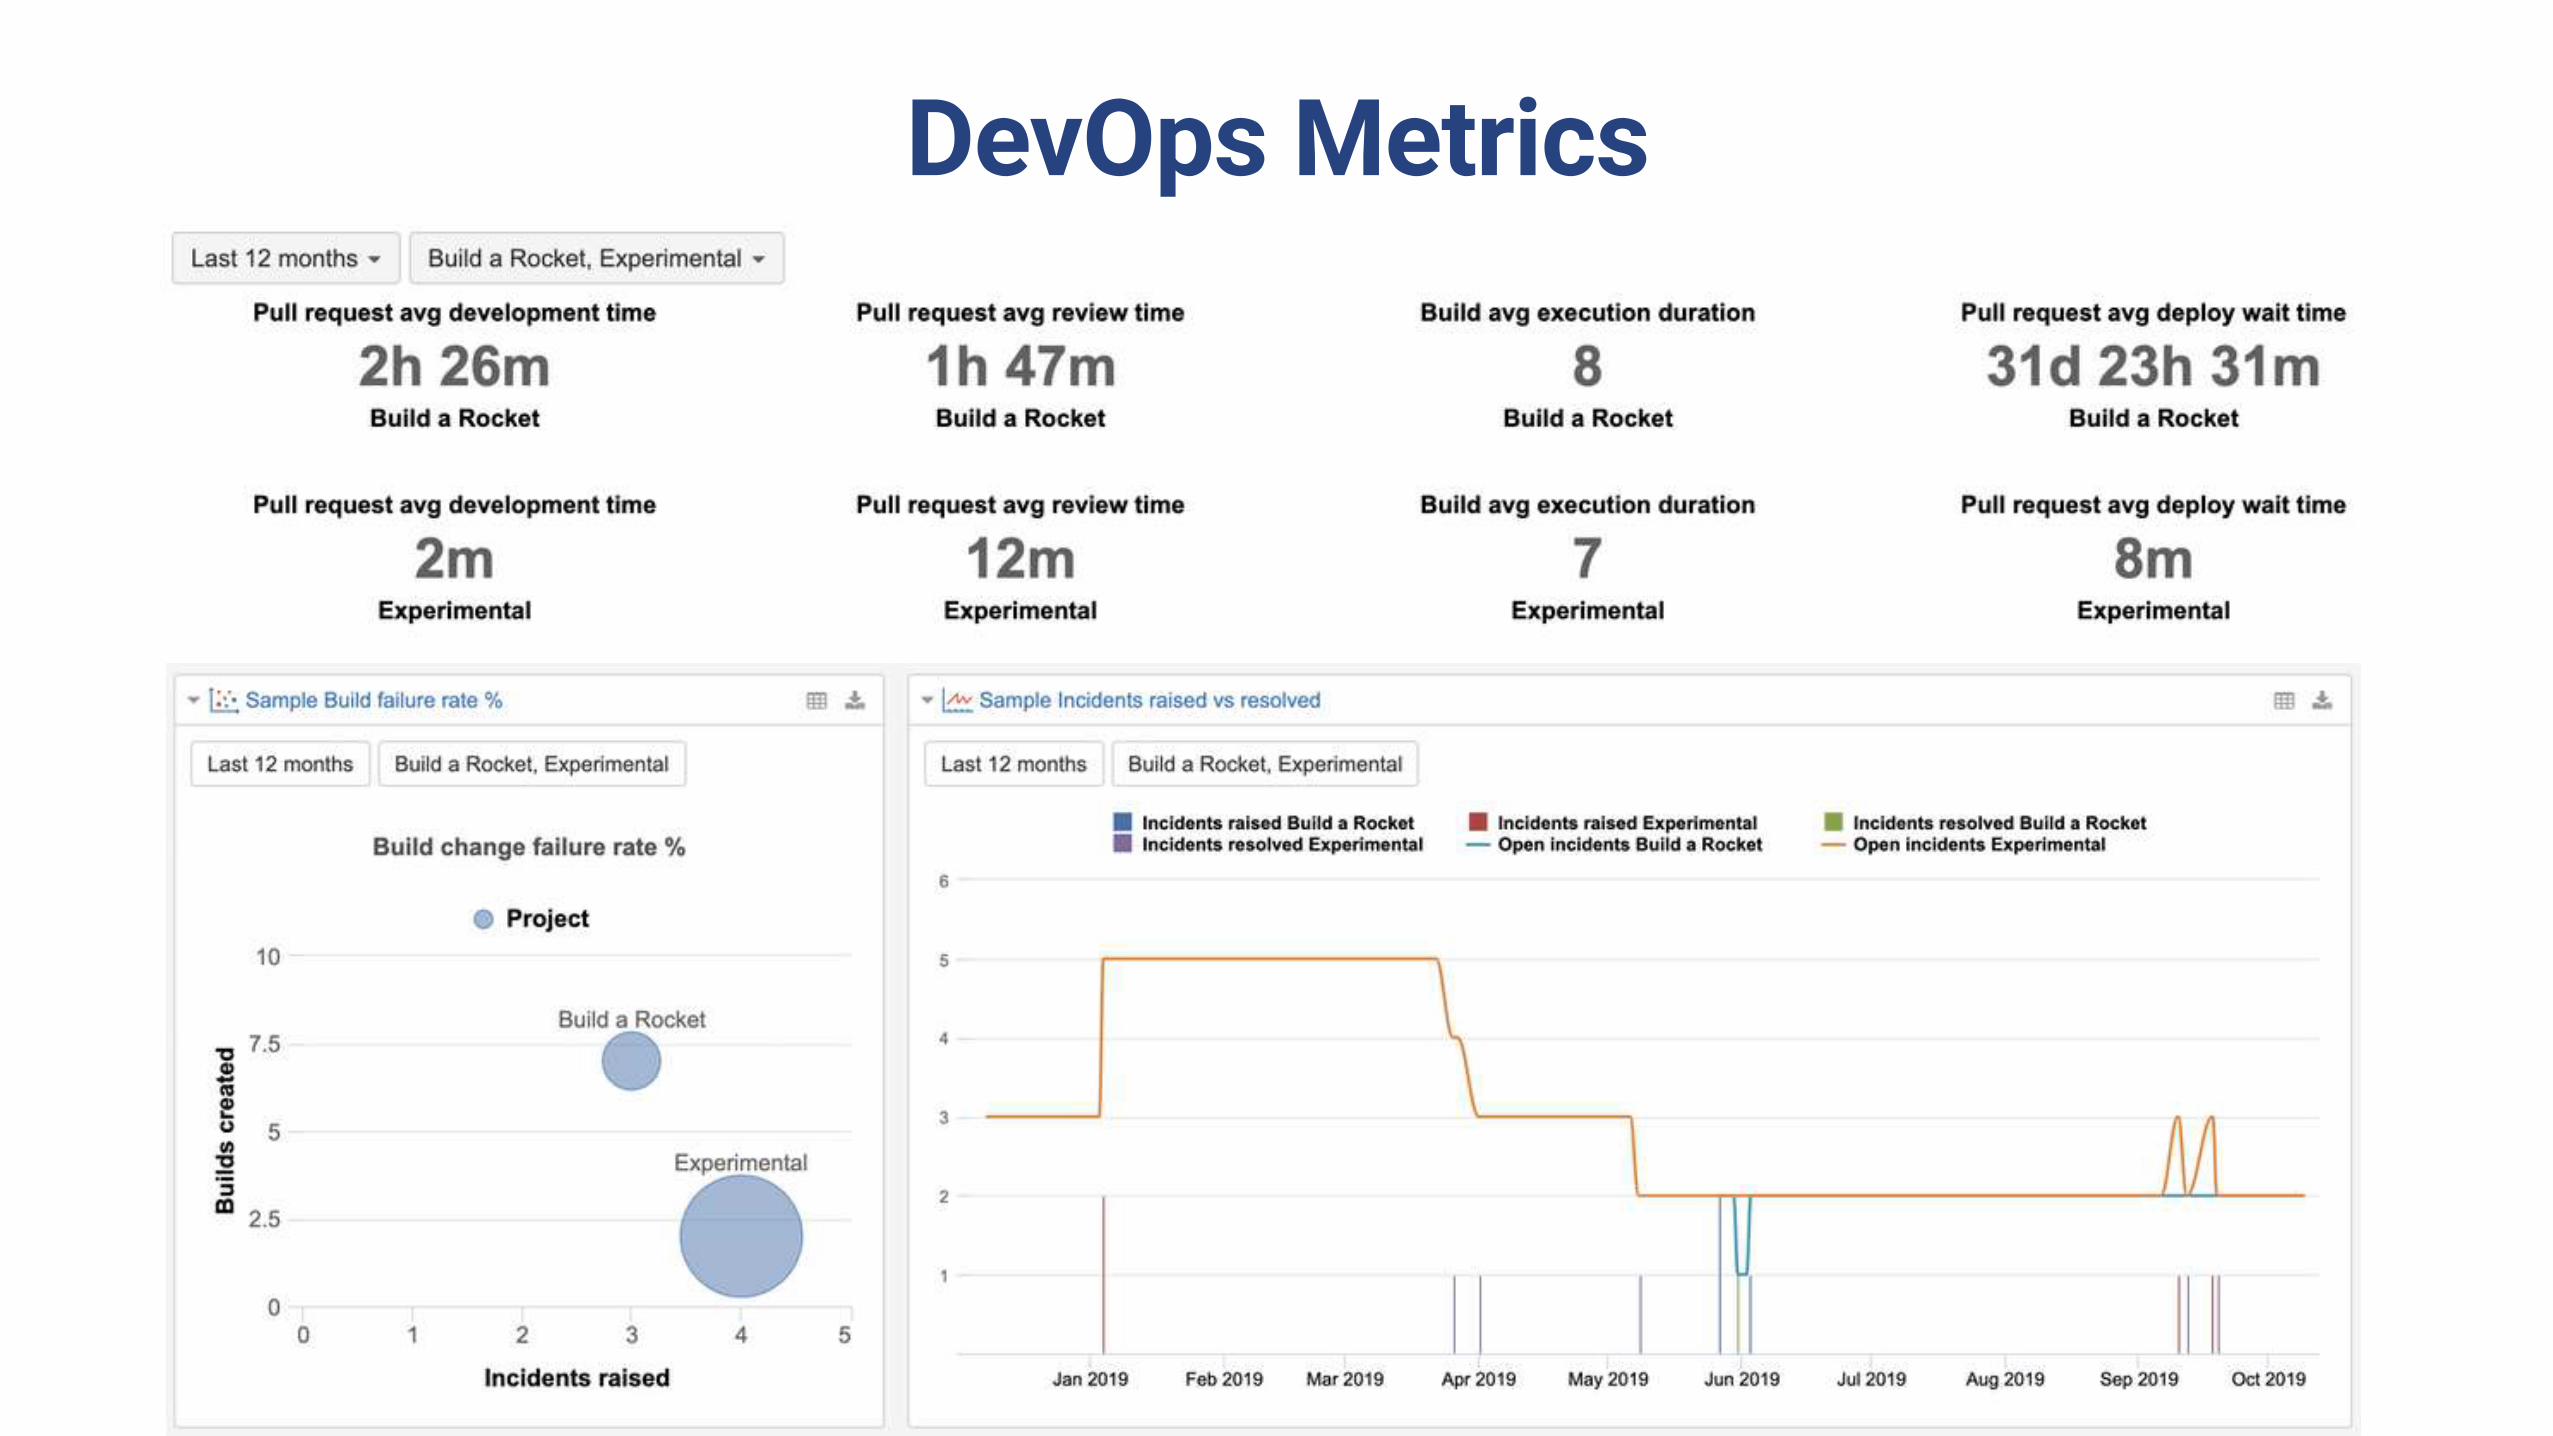
DevOps Metrics

eazyBI 5.2 Features Highlights
• Stacked charts with relative percentage
• Show drilled into member names in charts
• Vertical lines in bar and line charts


eazyBI 5.3 Features Highlights
• Drill into a single measure by another dimension
• Gantt chart weekly, quarterly, and yearly views
• Custom multi-weekly hierarchies
• Database migrator
• From server to server using files
• Jira Server to Jira Cloud migrator

Drill Into a Single Measure
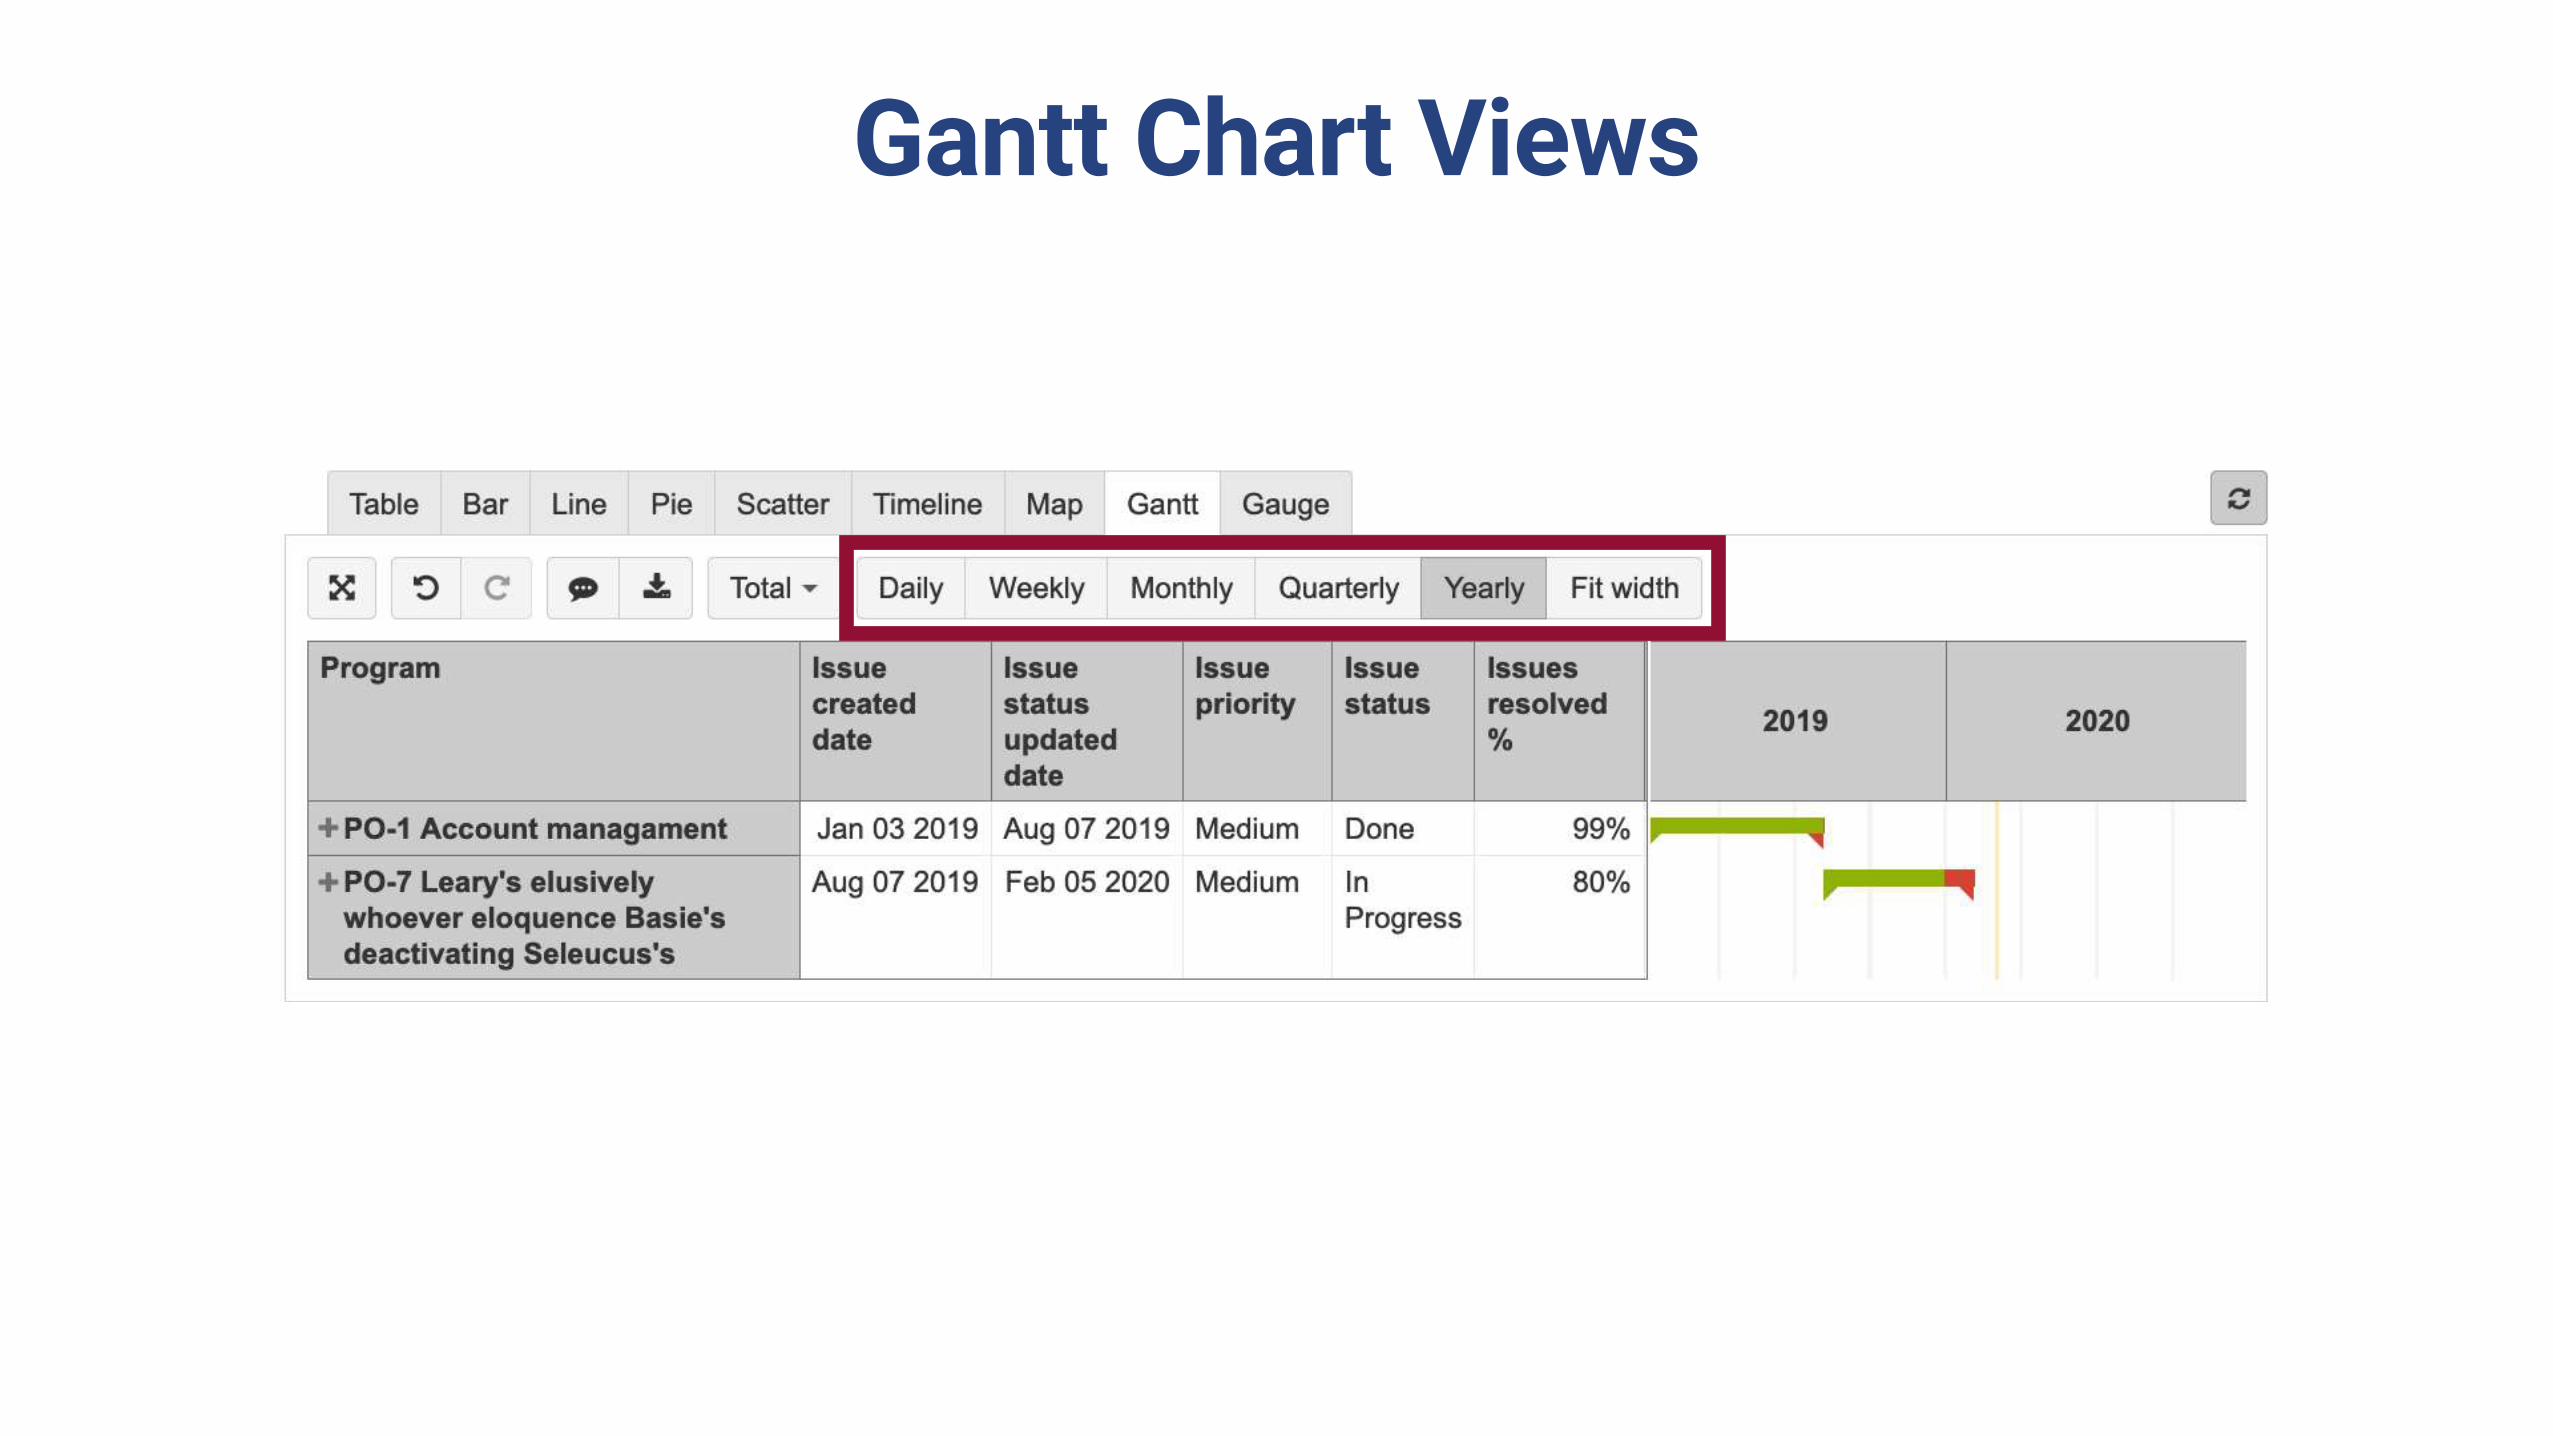
Gantt Chart Views

Database Migrator

eazyBI for Jira Cloud
• Next-gen projects reporting
• Project specific issue types, statuses, custom fields
• Story point estimate, Epics
• Tempo Cloud Planned hours
• Xray Test Management Cloud
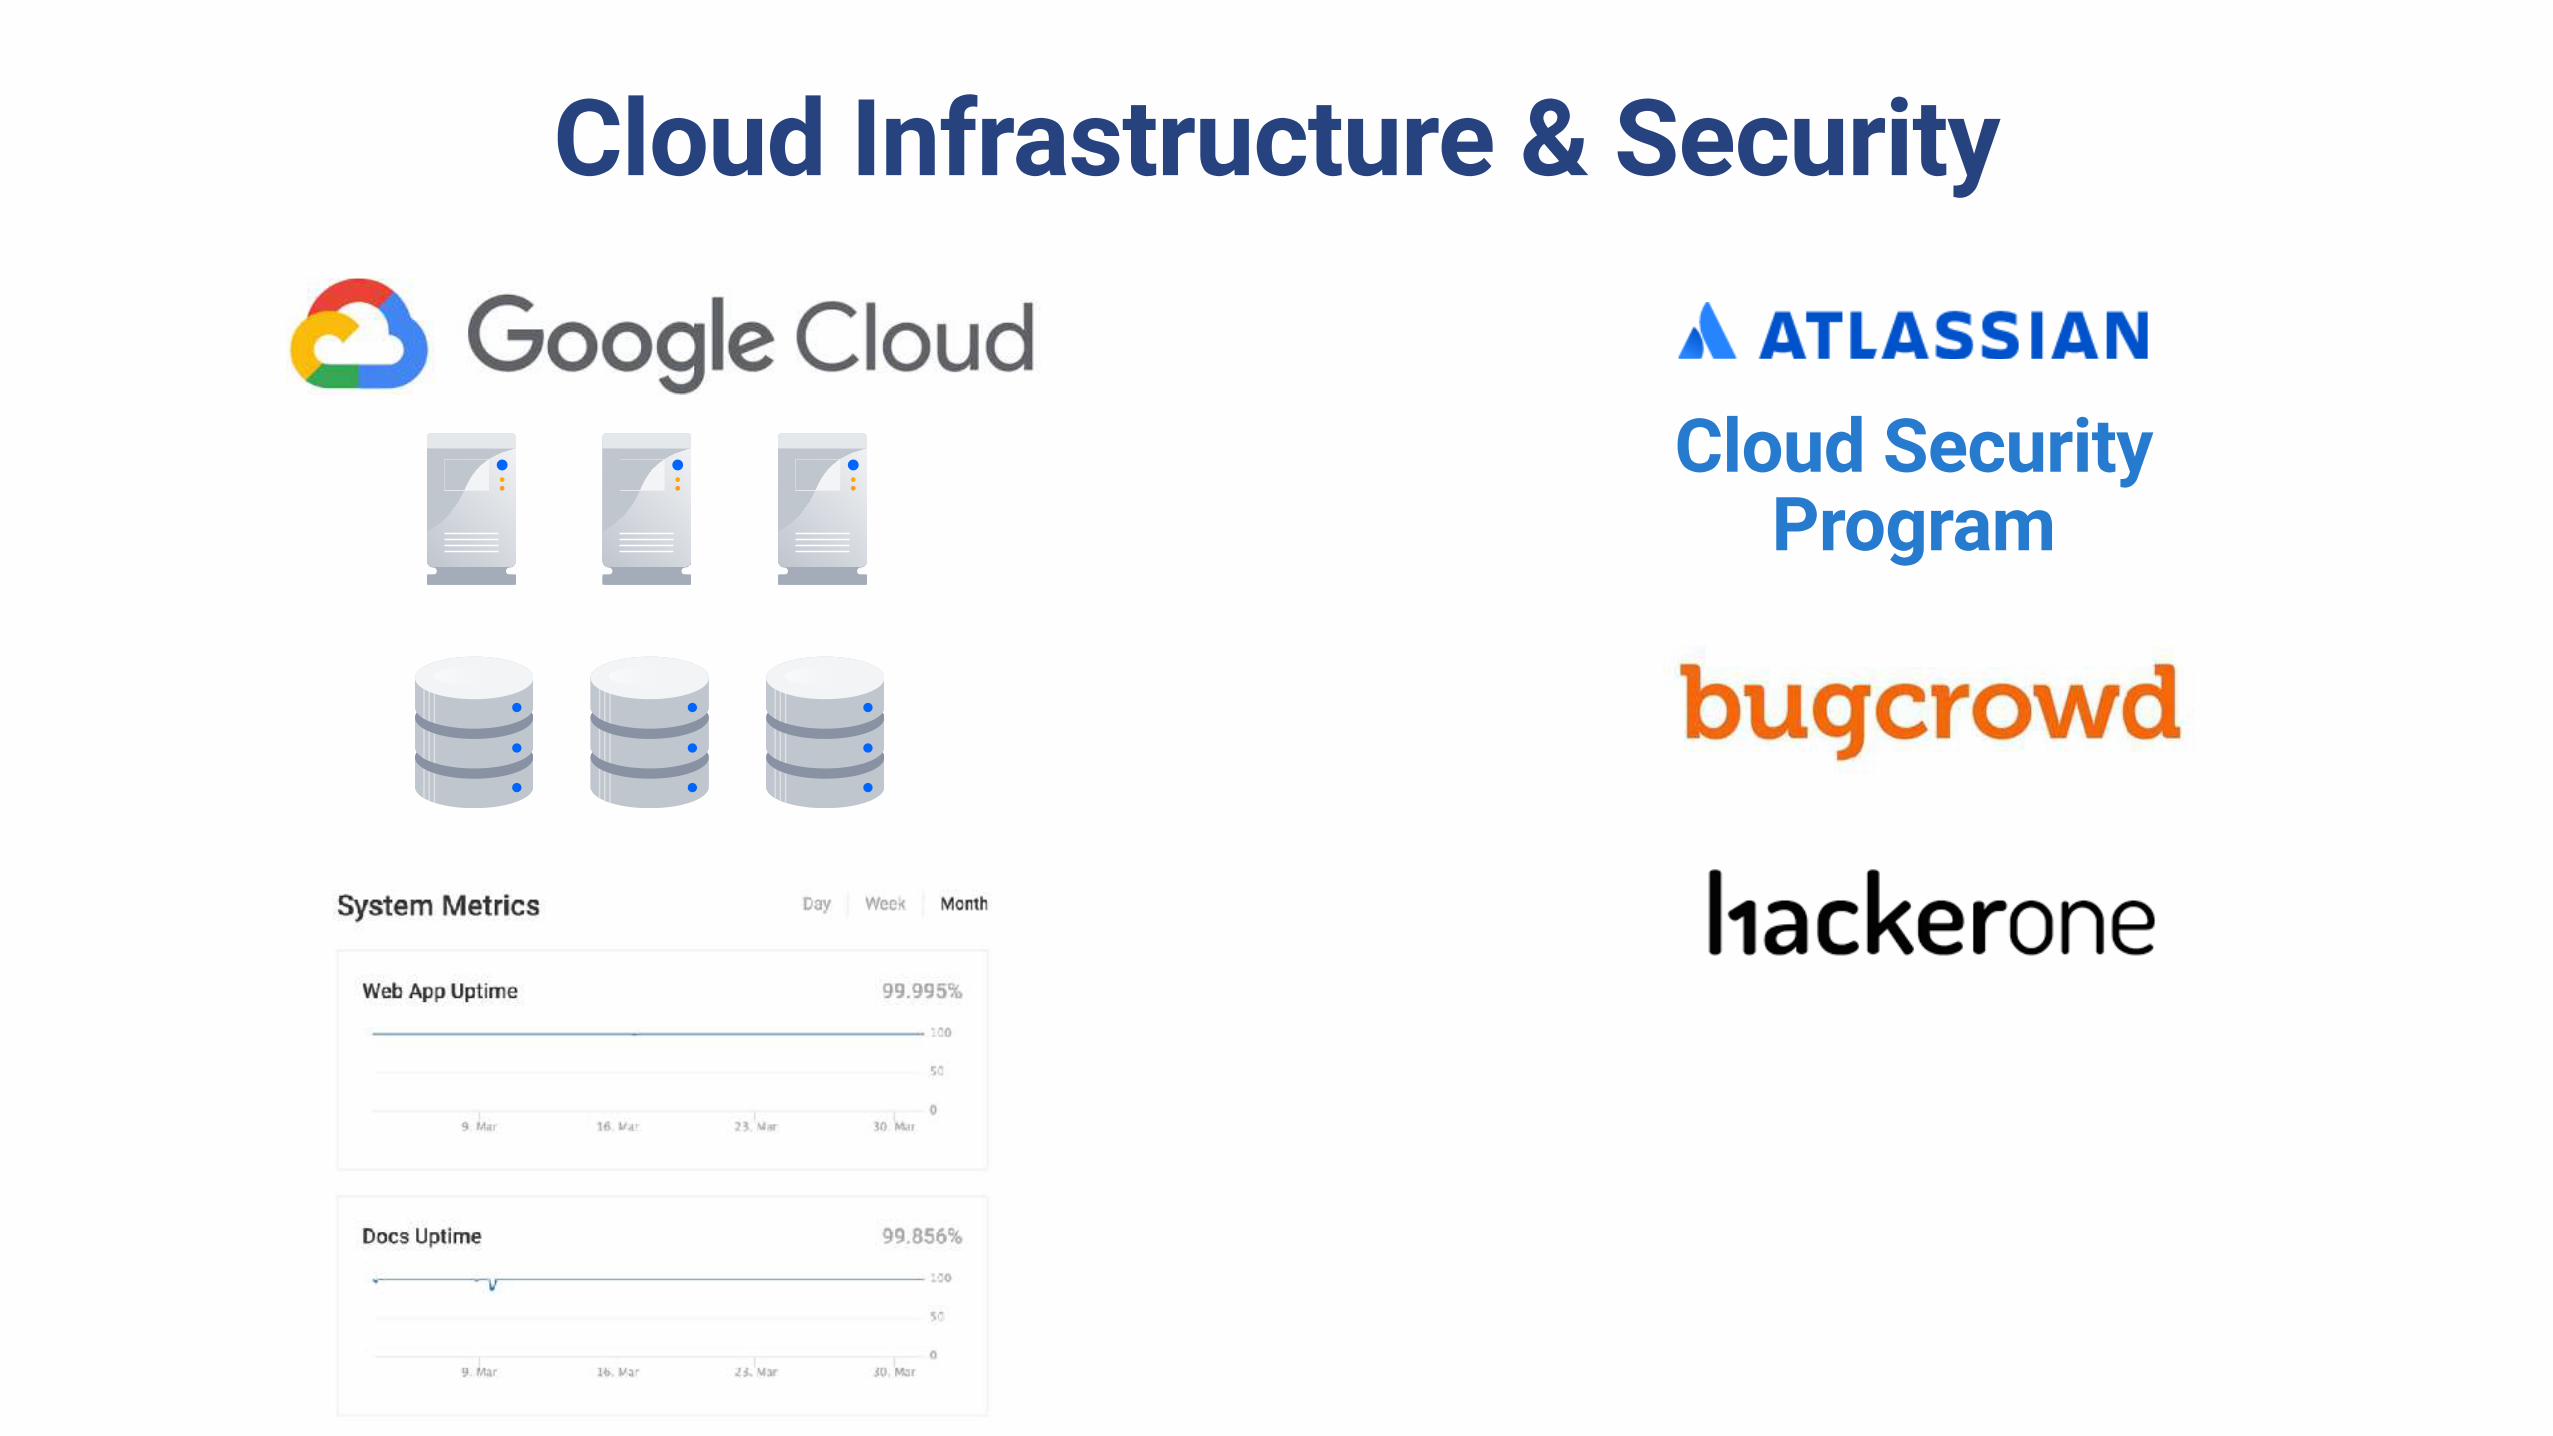
Cloud Infrastructure & Security
Cloud Security Program

eazyBI for Confluence 5.0 – 5.3
• Confluence content analytics
• pages created, updated, page views, search queries
• Macros for publishing eazyBI reports and dashboards from
Confluence and from Jira
• also in Confluence page PDF exports
• Approved as Confluence Data Center compatible
Upcoming eazyBI Version 6
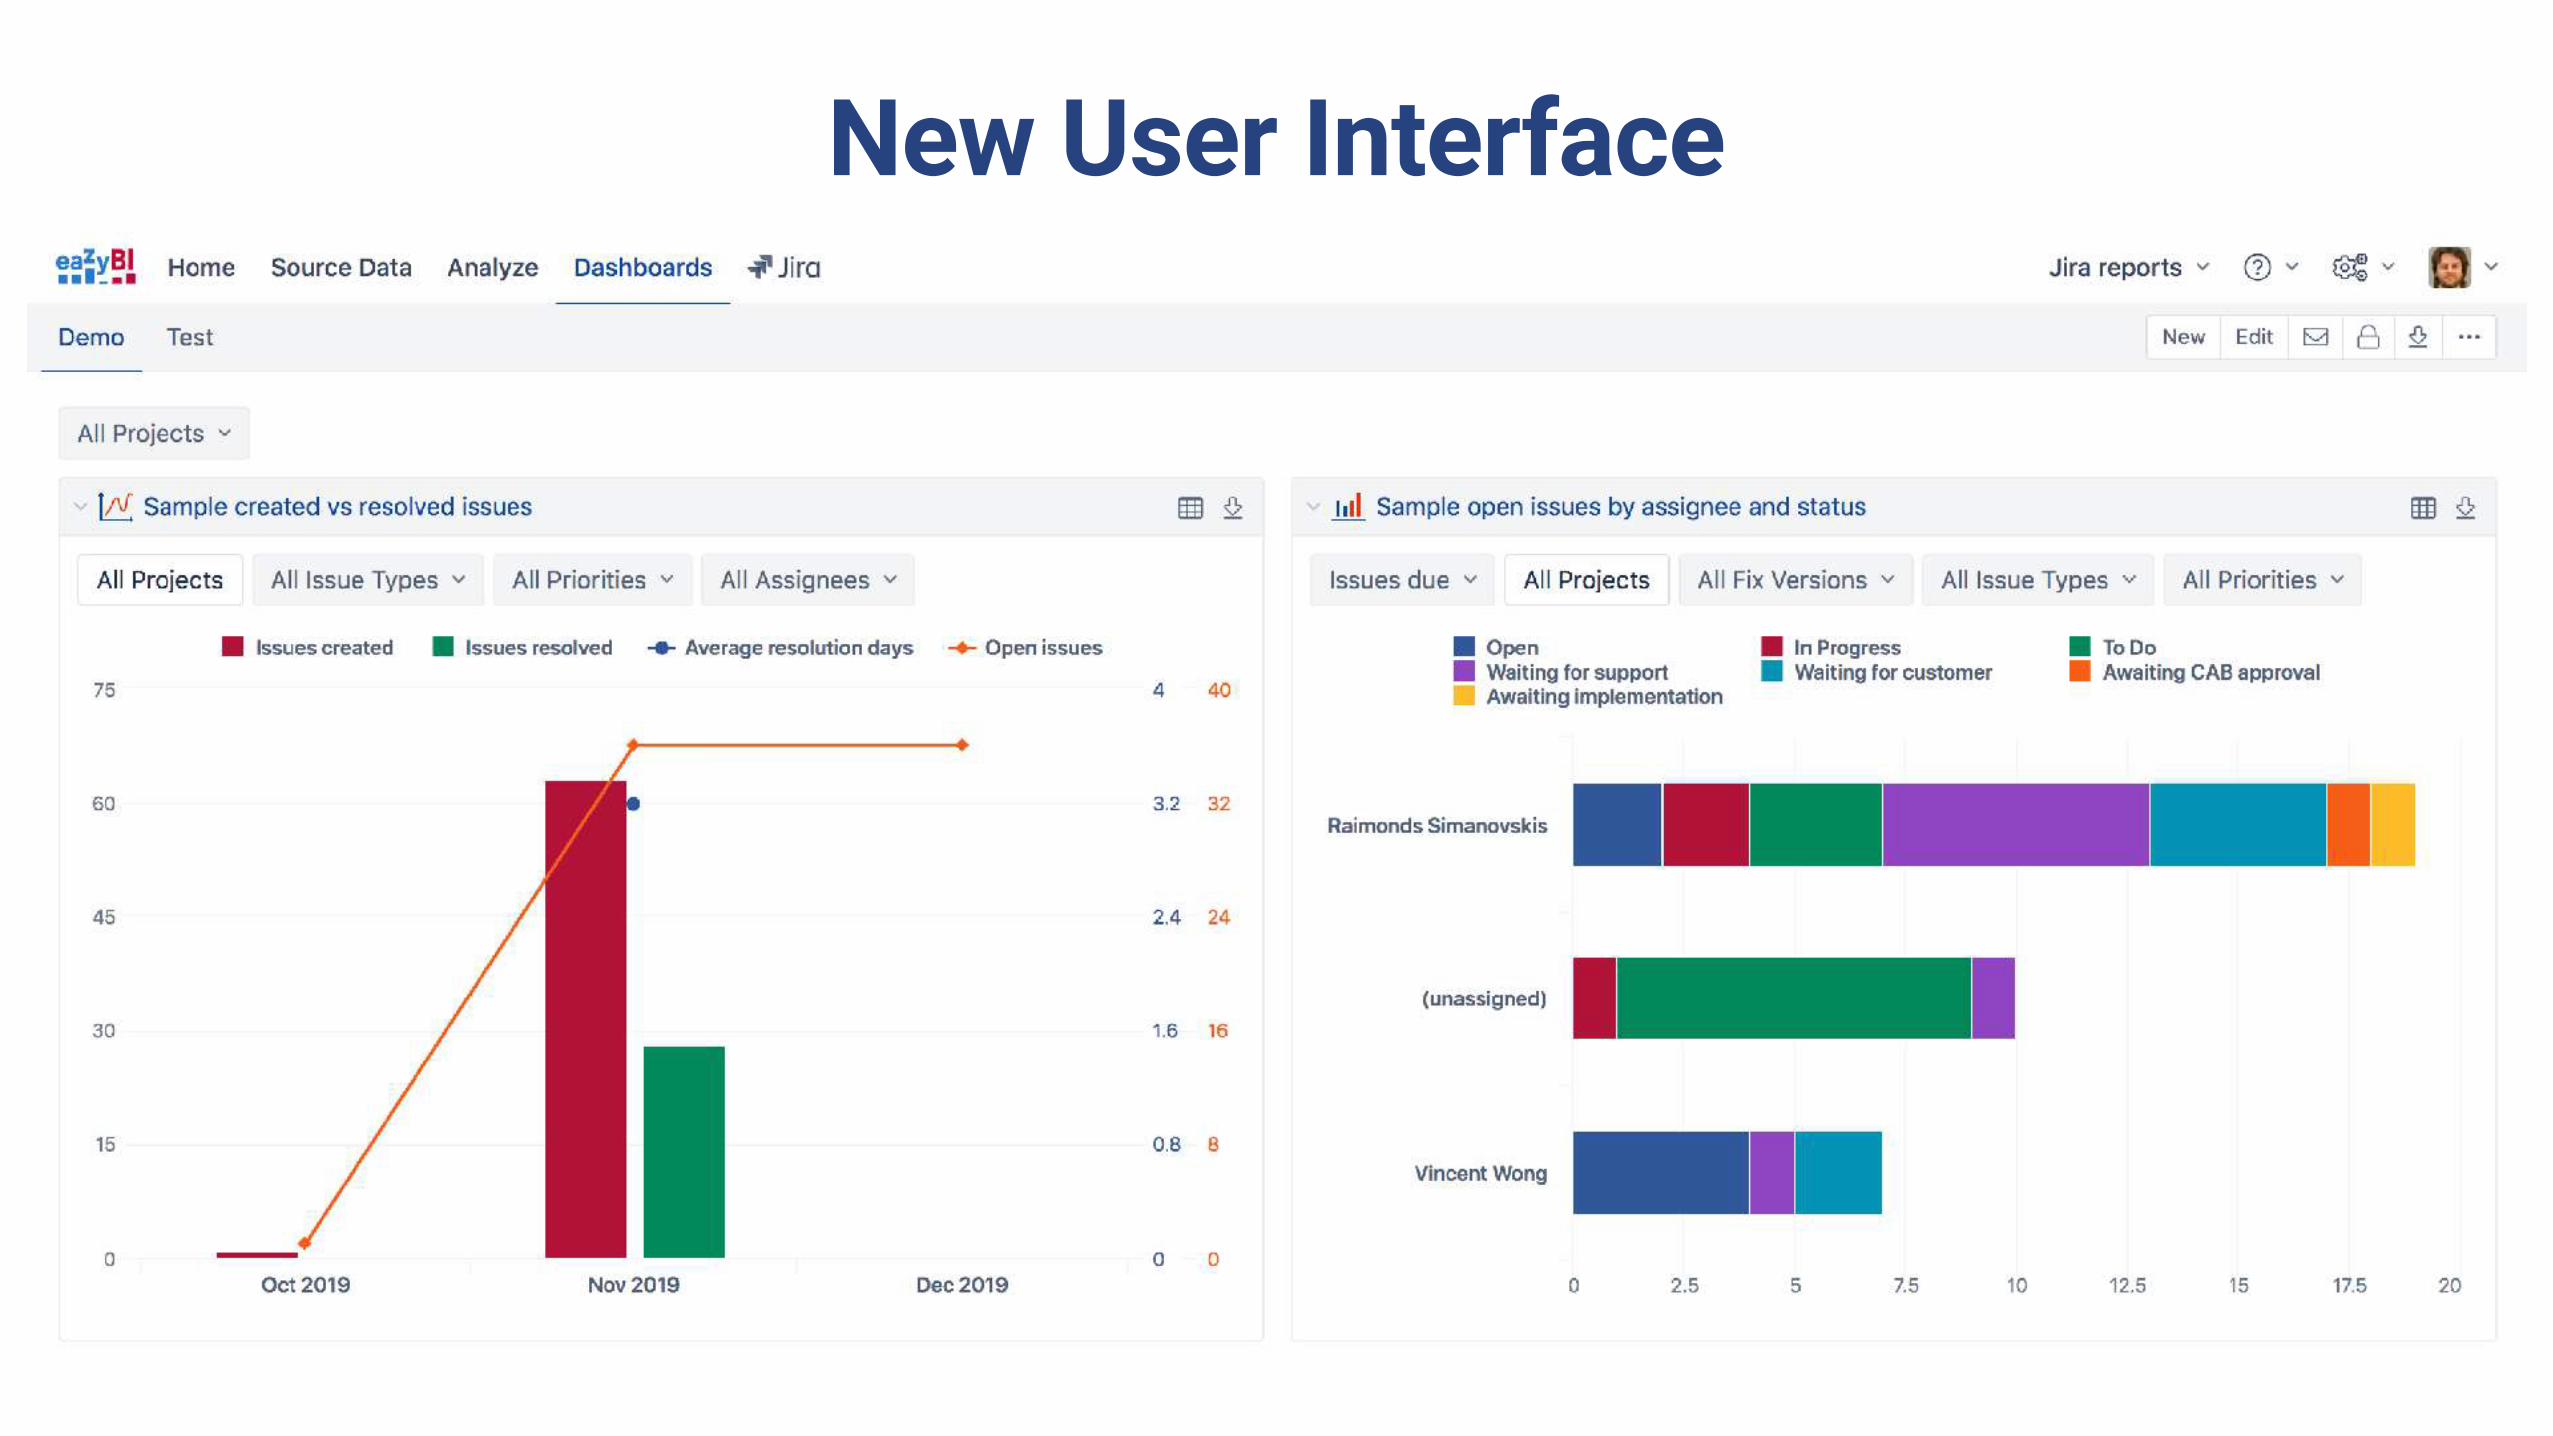
New User Interface
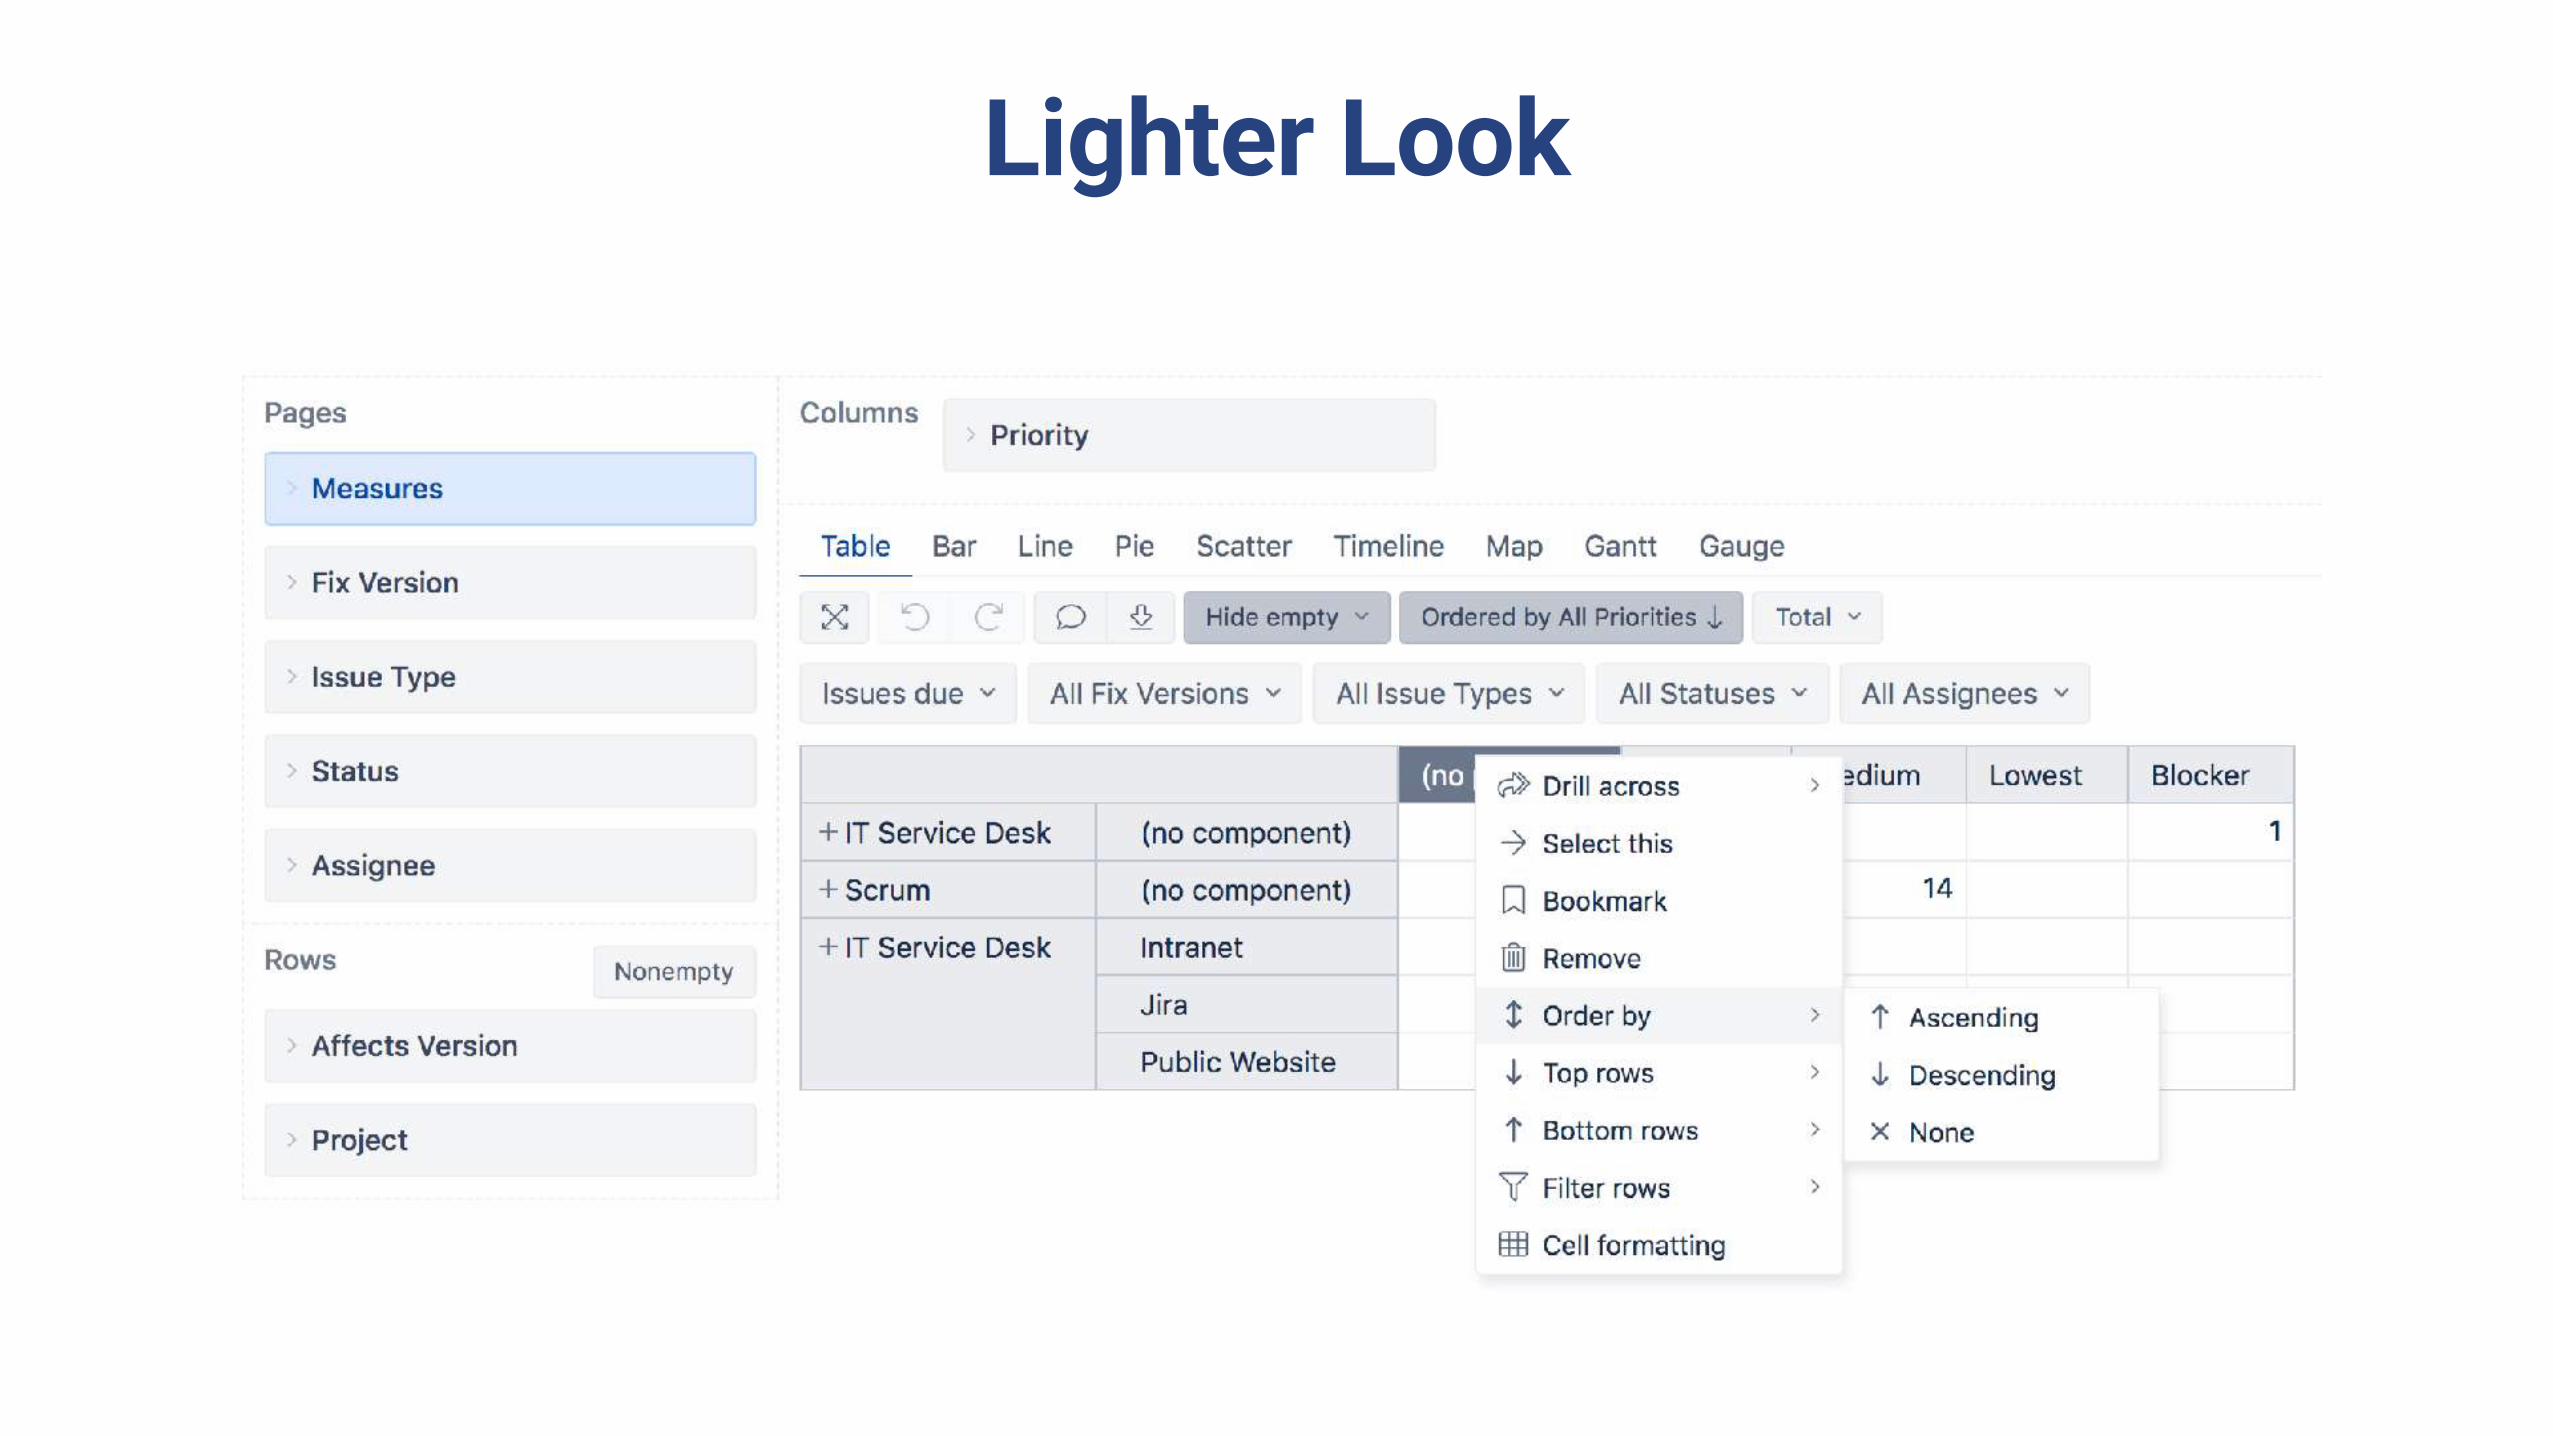
Lighter Look

More Standard Colors for Charts

Compatible with Atlassian Design

eazyBI for Jira Cloud and Confluence Cloud

Some Other Upcoming eazyBI 6 Features
• Week Day dimension
• Freeze row headers in wide tables
• More standard calculations
• Report specific calculated measures
• Larger sample reports library
• More Confluence content measures
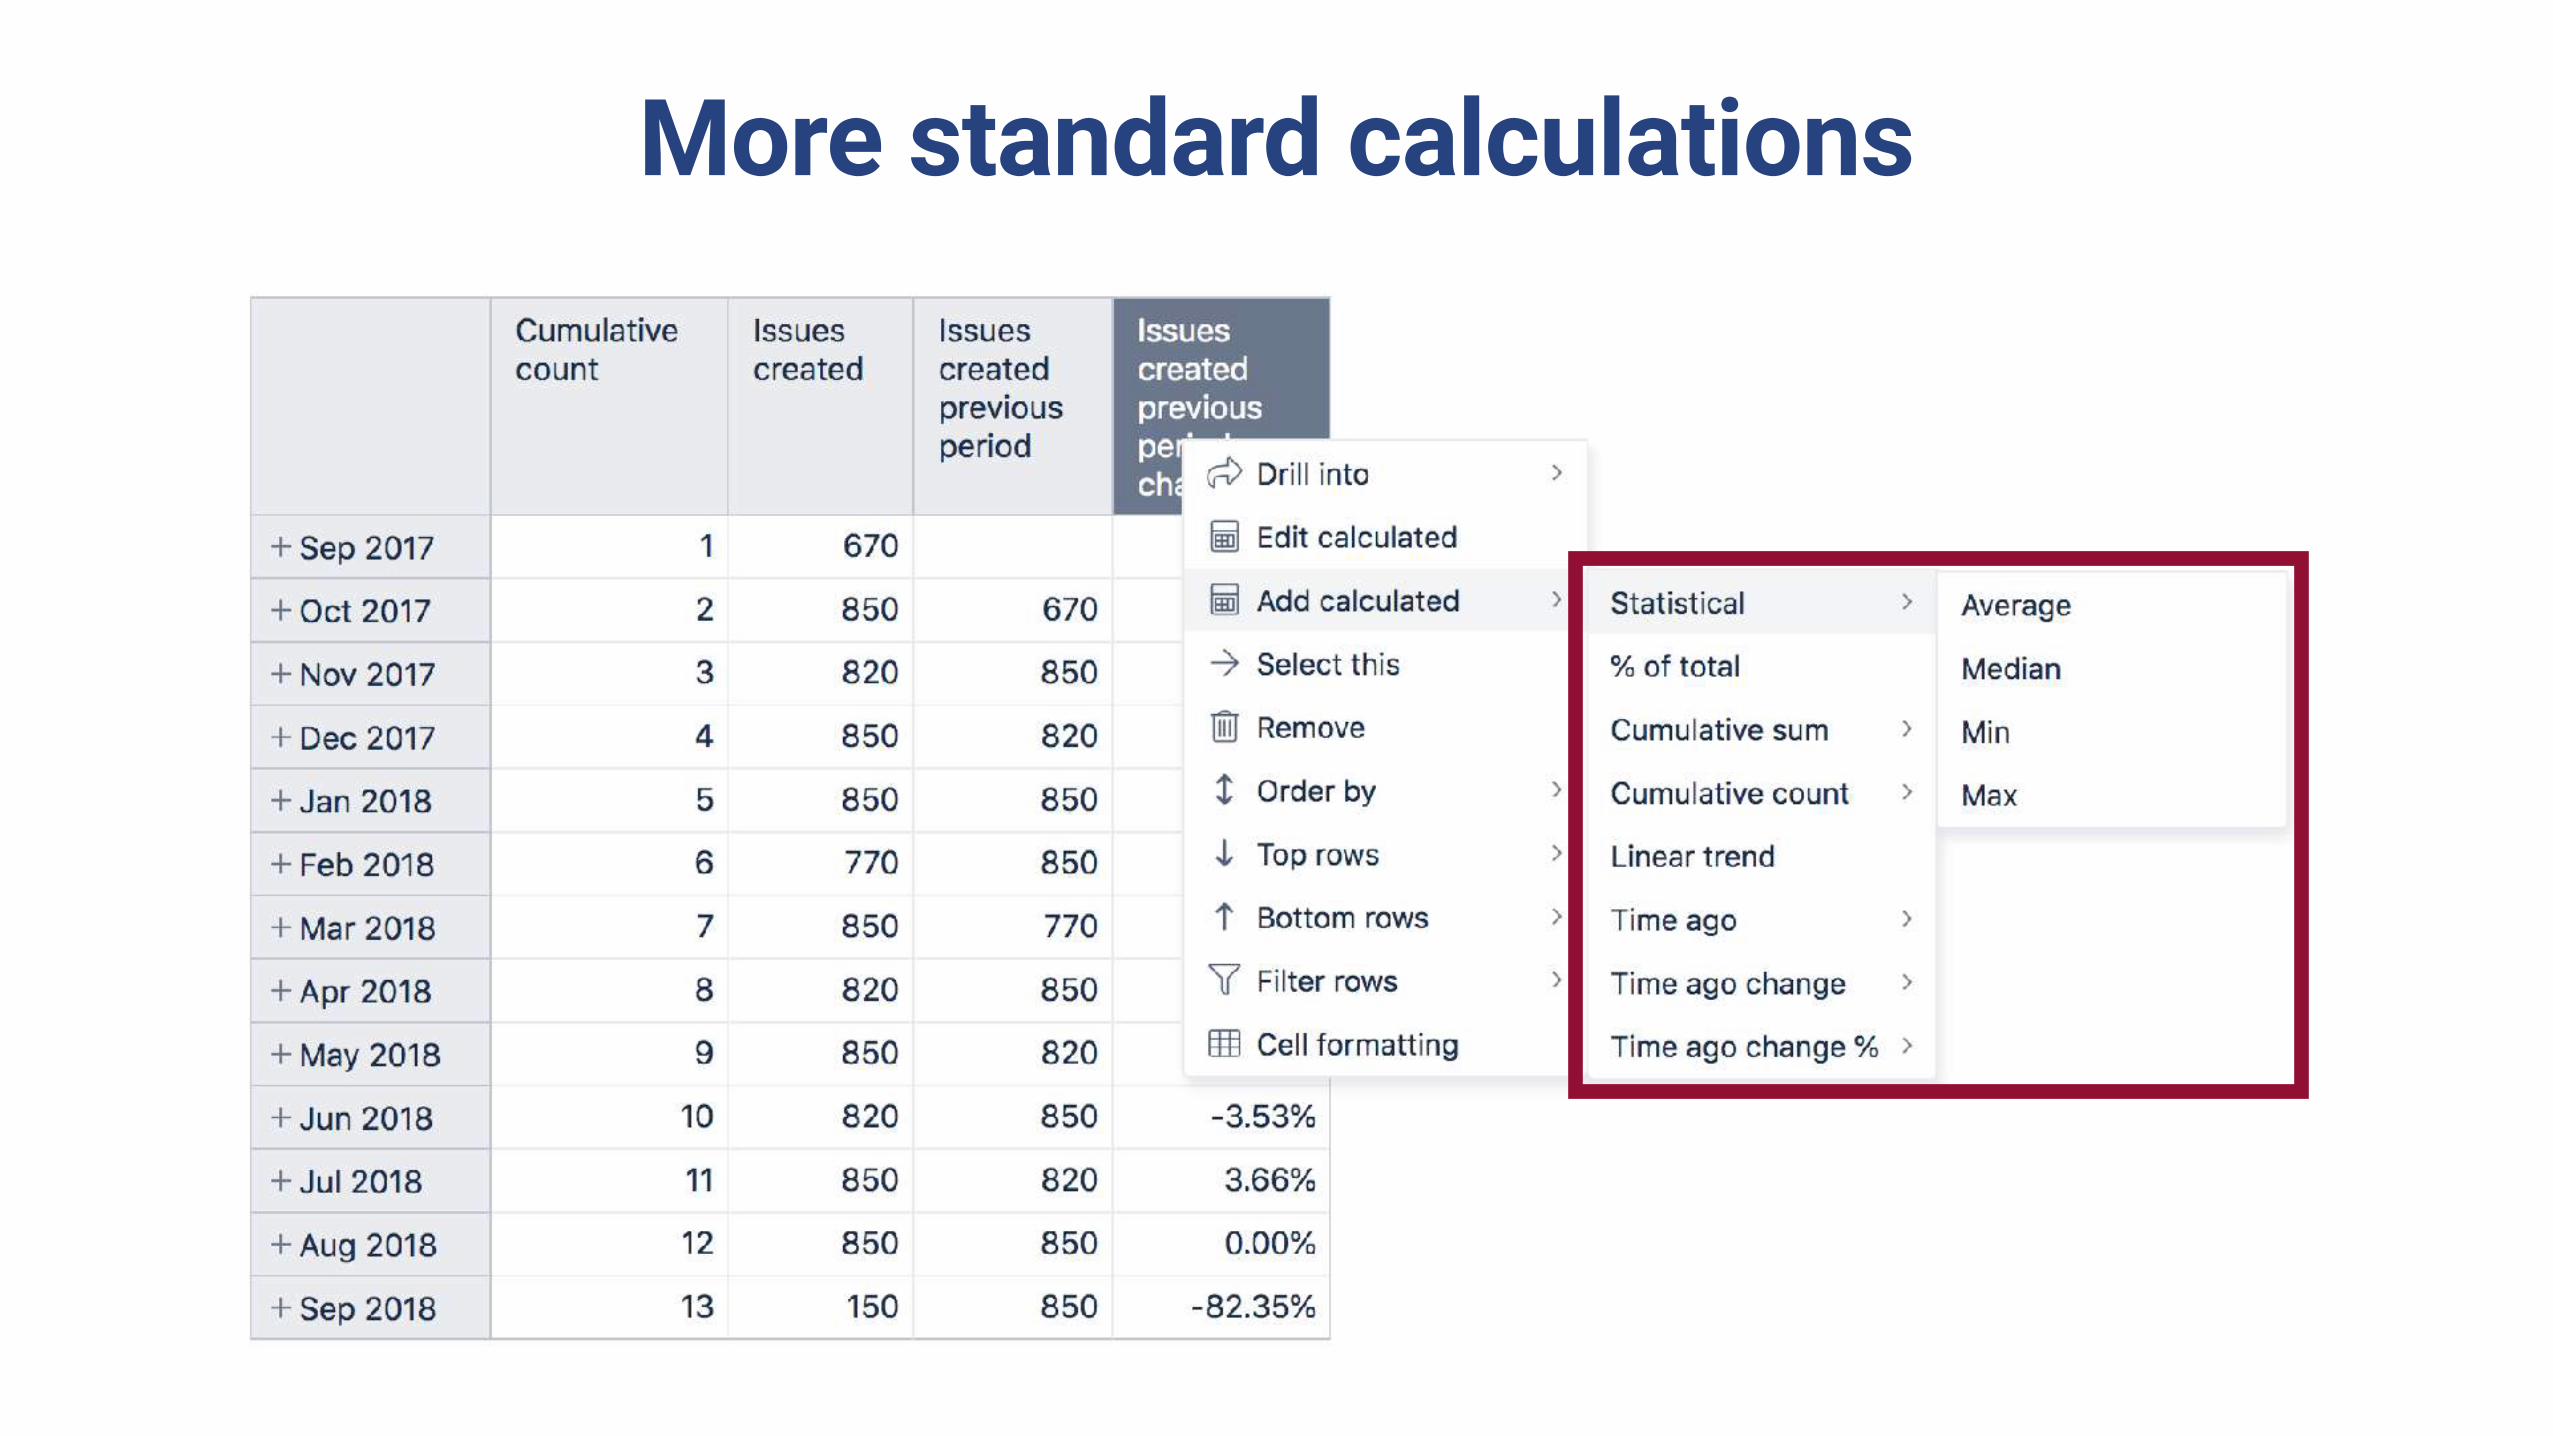
More standard calculations

Report specific calculated measures

New Training Videos in co-operation
with Atlassian University

Introduction to eazyBI Get to know eazyBI and understand the basic concepts
Import data into eazyBI Overview of eazyBI accounts and data import into eazyBI
Start building report Learn how to create a new report in eazyBI
Using charts I Timeline chart customization
Using charts II A quick overview of frequently used chart types.
Share reports(eazyBI dashboards)
Report gains added value when it is shared. Learn how to do that!
Season 1 Episodes 1–6

Web Interface forSupport Email Conversations

Contact Support

Previous Conversations
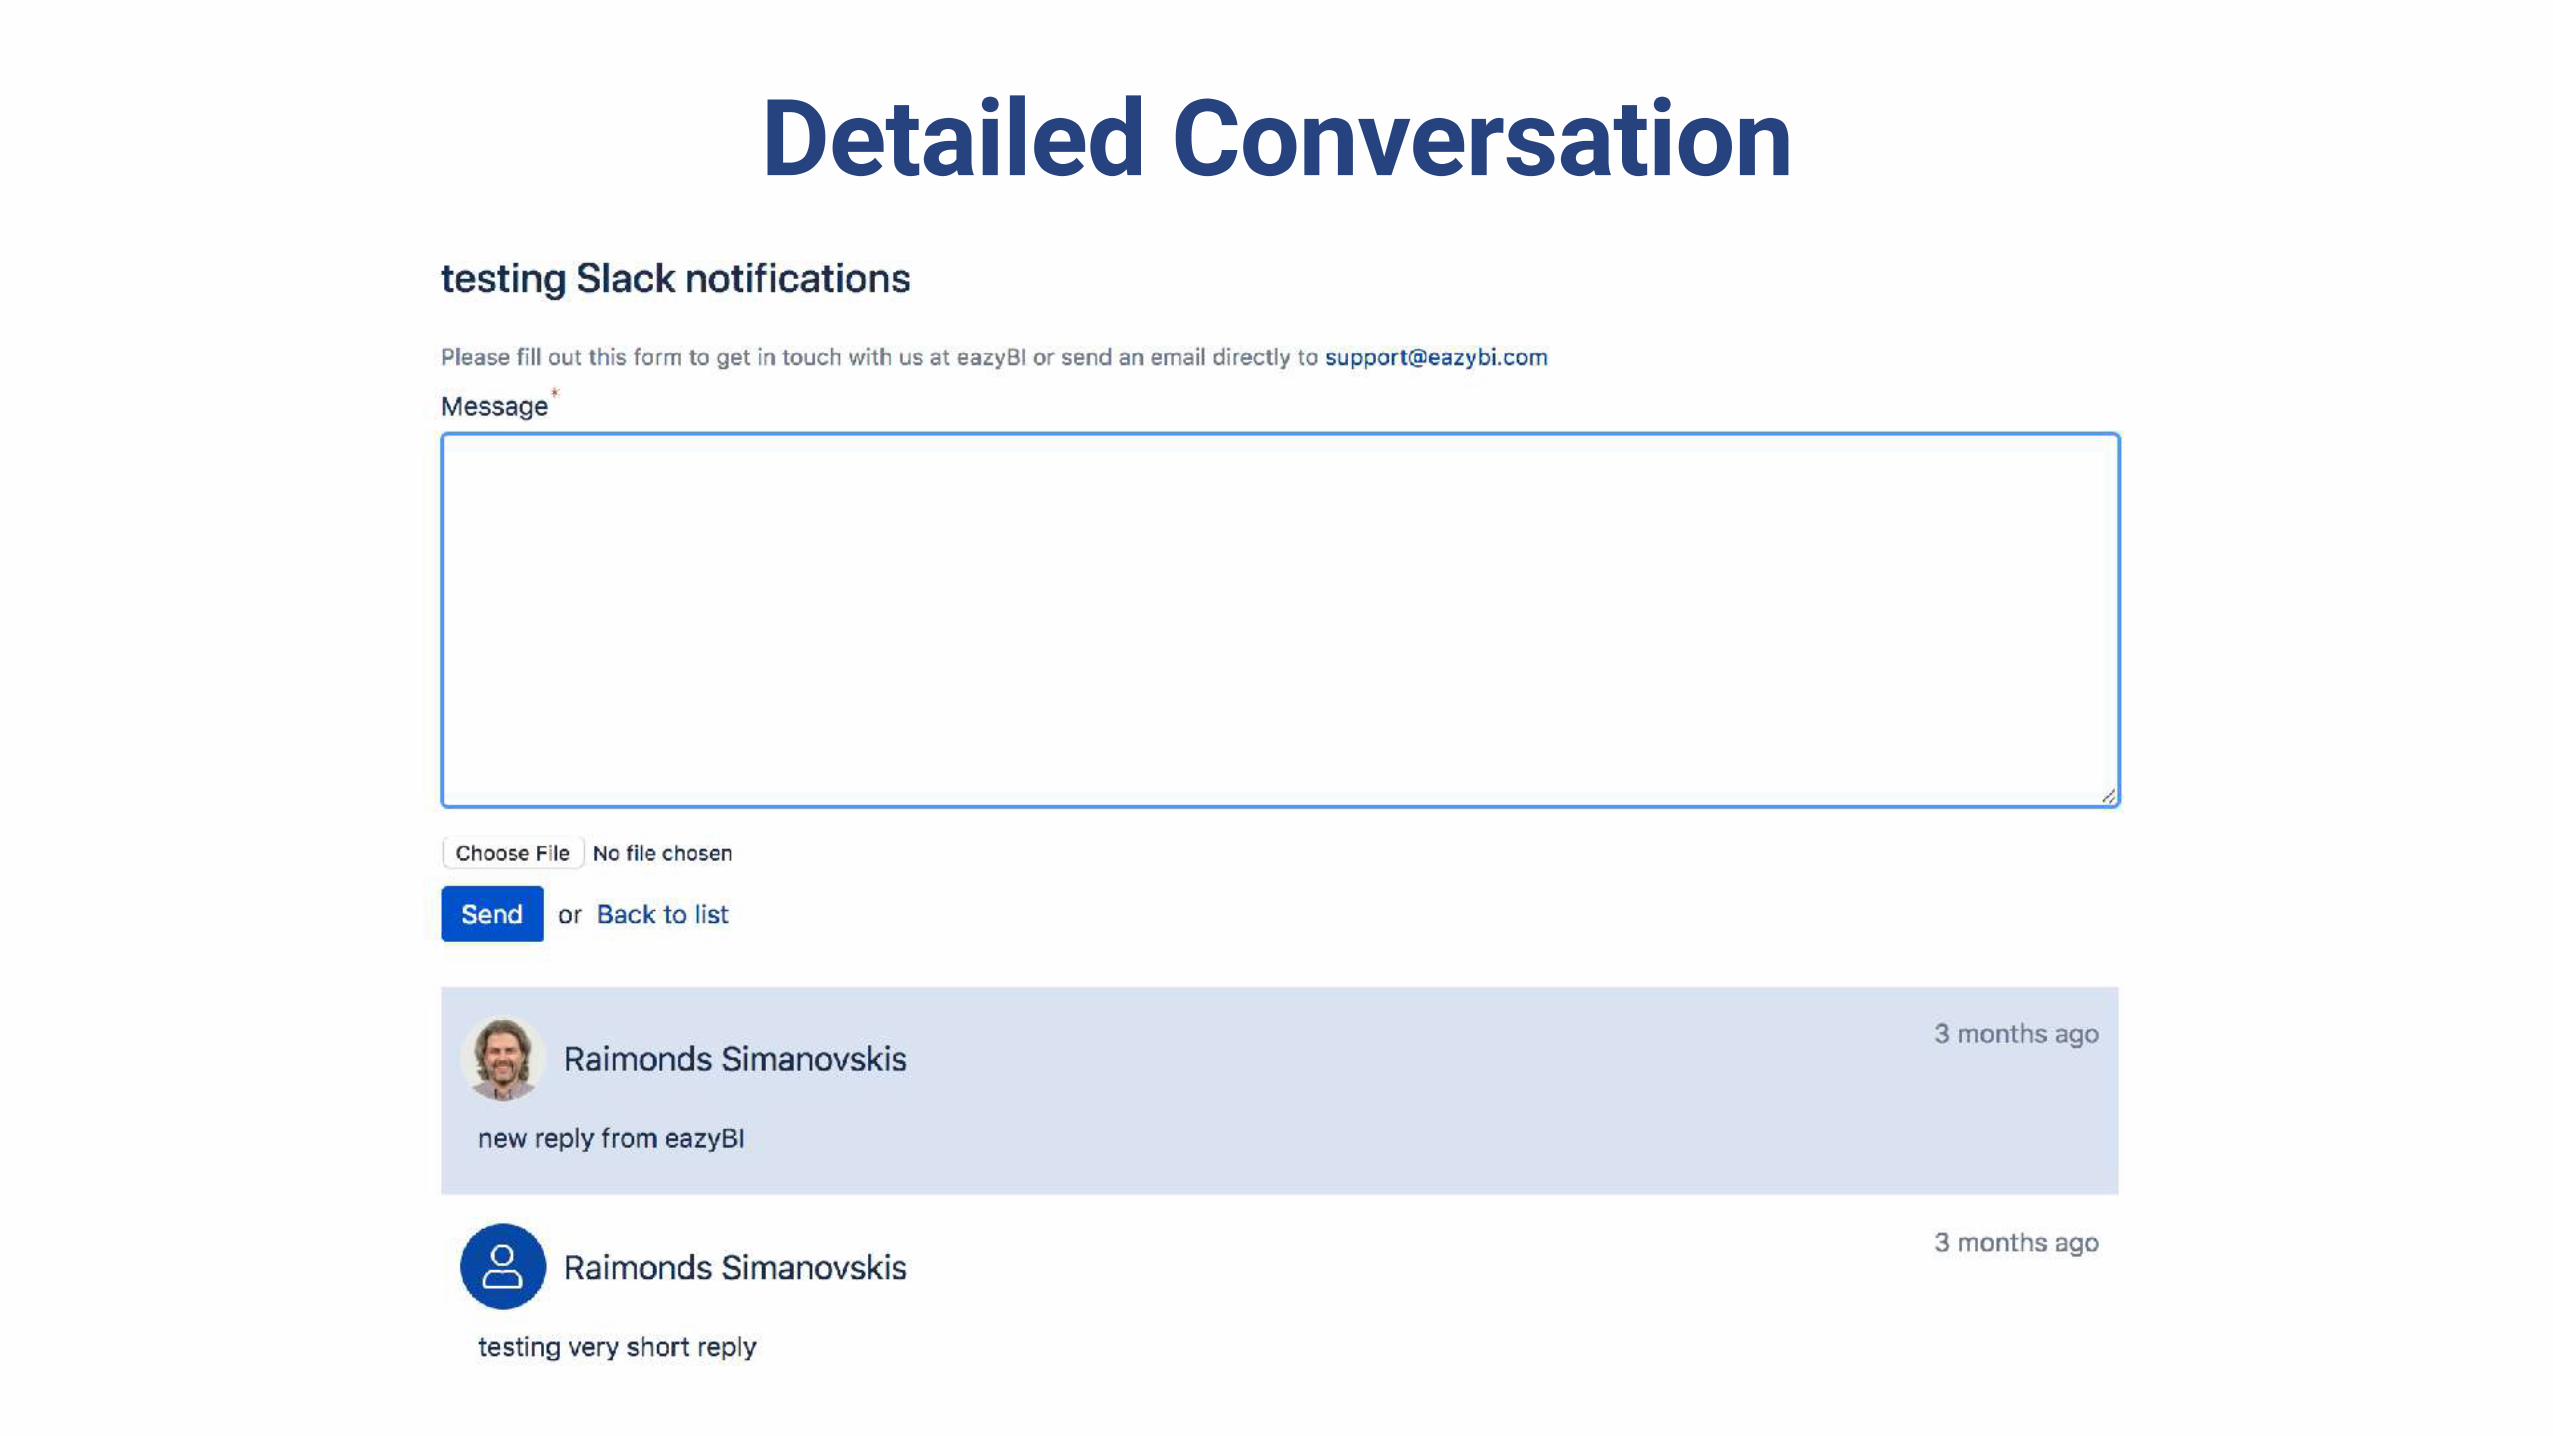
Detailed Conversation
Questions?(in Slack)
Thank you!