east london industrial development zone survey, 2016 · statistics south africa east london...
TRANSCRIPT
THE SOUTH AFRICA I KNOW, THE HOME I UNDERSTAND
East London Industrial Development Zone Survey, 2016
Statistics South Africa
R Maluleke
Report No. 00-30-00 (2016) Statistician-General
Statistics South Africa
East London Industrial Development Zone, 2016
ii
East London Industrial Development Zone Survey, 2016 / Statistics South Africa
Published by Statistics South Africa, Private Bag X44, Pretoria, 0001 © Statistics South Africa, 2017 Users may apply or process this data, provided Statistics South Africa (Stats SA) is acknowledged as the original source of the data; that it is specified that the application and/or analysis is the result of the user's independent processing of the data; and that neither the basic data nor any reprocessed version or application thereof may be sold or offered for sale in any form whatsoever without prior permission from Stats SA. Stats SA Library Cataloguing-in-Publication (CIP) Data East London Industrial Development Zone Survey, 2016 / Statistics South Africa. Pretoria: Statistics South Africa, 2017
[Report No. 00-30-00 (2016)] 40 pp
ISBN: 978-0-621-45646-2
A complete set of Stats SA publications is available at Stats SA Library and the following libraries:
National Library of South Africa, Pretoria Division Eastern Cape Library Services, King William’s Town National Library of South Africa, Cape Town Division Central Regional Library, Polokwane Library of Parliament, Cape Town Central Reference Library, Nelspruit Bloemfontein Public Library Central Reference Collection, Kimberley Natal Society Library, Pietermaritzburg Central Reference Library, Mmabatho Johannesburg Public Library
This report is available on the Stats SA website: www.statssa.gov.za Copies are obtainable from: Printing and Distribution, Statistics South Africa Tel: (012) 310 8251 (012) 310 8358 Email: [email protected]
Technical enquiries: Nonzukiso Stemela: (043) 707 4953 ([email protected])
Katumetso Honwani: (012) 310 8435 ([email protected])

Statistics South Africa
East London Industrial Development Zone, 2016
iii
Table of contents
1. Introduction ......................................................................................................................................................................................................................................................................1 2. Summary of findings for the year 2016 ..........................................................................................................................................................................................................................2 2.1 Income ...........................................................................................................................................................................................................................................................................2 Table A – Income in the ELIDZ, 2015 – 2016 ..........................................................................................................................................................................................................................2 Table B – Income from ‘goods and services exported or sold to domestic exporters’ and ‘goods and services sold to other domestic enterprises’ by the ELIDZ, 2015 and 2016 ...............2 2.2 Employment ...................................................................................................................................................................................................................................................................3 Table C – Employment by type of activity (excluding employees employed through labour brokers) as at the end of June in the ELIDZ, 2015 and 2016 .....................................................3 Table D – Employment (excluding employees employed through labour brokers) by gender as at the end of June in the ELIDZ, 2015 and 2016 ................................................................3 Table E – Employment (excluding employees employed through labour brokers) by age as at the end of June in the ELIDZ, 2015 and 2016 ......................................................................4 Table F – Employment (excluding employees employed through labour brokers) by occupational group as at the end of June in the ELIDZ, 2015 and 2016 ..............................................4 Figure 1 – Income and employment by type of activity (% contribution) in the ELIDZ, 2016 ...................................................................................................................................................5 2.3 Capital expenditure on new assets ..............................................................................................................................................................................................................................5 Table G – Capital expenditure by type of activity on new assets in the ELIDZ, 2015 and 2016 ..............................................................................................................................................5 3. Tables ................................................................................................................................................................................................................................................................................6 Table 1 – Principal statistics in the ELIDZ, 2015 and 2016 ......................................................................................................................................................................................................6 Table 2A – Principal statistics by type of contractor in the ELIDZ, 2016 ..................................................................................................................................................................................7 Table 2B – Principal statistics by type of activity in the ELIDZ, 2016 .......................................................................................................................................................................................7 Table 3A – Profit margin by type of contractor in the ELIDZ, 2015 and 2016 ..........................................................................................................................................................................8 Table 3B – Profit margin by type of activity in the ELIDZ, 2015 and 2016 ...............................................................................................................................................................................8 Table 4 – Income in the ELIDZ, 2015 and 2016 ......................................................................................................................................................................................................................9 Table 4A – Income by type of contractor in the ELIDZ, 2016................................................................................................................................................................................................. 10 Table 4B – Income by type of activity in the ELIDZ, 2016...................................................................................................................................................................................................... 10 Table 5 – Expenditure in the ELIDZ, 2015 and 2016 ............................................................................................................................................................................................................. 11 Table 5A – Expenditure by type of contractor in the ELIDZ, 2016 ......................................................................................................................................................................................... 12 Table 5B – Expenditure by type of activity in the ELIDZ, 2016 .............................................................................................................................................................................................. 12 Table 6 – Carrying value of assets at the end of the financial year in the ELIDZ, 2015 and 2016 ......................................................................................................................................... 13 Table 6A – Carrying value of assets by type of contractor as at the end of the financial year in the ELIDZ, 2016 ................................................................................................................ 13 Table 6B – Carrying value of assets by type of activity as at the end of the financial year in the ELIDZ, 2016 ..................................................................................................................... 14 Table 7 – Details of assets in the ELIDZ, 2015 and 2016 ...................................................................................................................................................................................................... 15 Table 7A – Details of assets by type of contractor in the ELIDZ, 2016 .................................................................................................................................................................................. 16 Table 7B – Details of assets by type of activity in the ELIDZ, 2016 ....................................................................................................................................................................................... 16
Statistics South Africa
East London Industrial Development Zone, 2016
iv
Table 8 – Details of liabilities and equity in the ELIDZ, 2015 and 2016 ................................................................................................................................................................................. 17 Table 8A – Details of liabilities and equity by type of contractor in the ELIDZ, 2016 ............................................................................................................................................................. 18 Table 8B – Details of liabilities and equity by type of activity in the ELIDZ, 2016 .................................................................................................................................................................. 18 Table 9 – Capital expenditure on new assets in the ELIDZ, 2015 and 2016 ......................................................................................................................................................................... 19 Table 9A – Capital expenditure on new assets by type of contractor in the ELIDZ, 2016 ...................................................................................................................................................... 19 Table 9B – Capital expenditure on new assets by type of activity in the ELIDZ, 2016 ........................................................................................................................................................... 20 Table 10A – Details of employment by type of activity and gender in the ELIDZ for the last pay period ended on or before 30 June 2015 and 2016 .......................................................... 21 Table 10B – Details of employment by type of contractor and gender in the ELIDZ for the last pay period ended on or before 30 June 2016 ..................................................................... 21 Table 10C – Details of employment by type of activity and gender in the ELIDZ for the last pay period ended on or before 30 June 2016 ......................................................................... 22 Table 11A – Details of employment by type of contractor and age in the ELIDZ for the last pay period ended on or before 30 June 2016 .......................................................................... 22 Table 11B – Details of employment by type of activity and age in the ELIDZ for the last pay period ended on or before 30 June 2016 ............................................................................... 23 Table 12A – Details of employment by occupational group and gender in the ELIDZ for the last pay period ended on or before 30 June 2015 and 2016 .................................................. 23 Table 12B – Details of employment by occupational group and gender in the ELIDZ for the last pay period ended on or before 30 June 2016 .................................................................. 24 Table 12C – Details of employment by occupational group and age in the ELIDZ for the last pay period ended on or before 30 June 2016 ....................................................................... 25 Table 13 – Selected expenditure items: goods and services imported or sourced domestically by type of contractor in the ELIDZ, 2015 and 2016............................................................ 26 Table 13A – Selected expenditure items: goods and services imported or sourced domestically by type of contractor in the ELIDZ, 2016 ......................................................................... 27 Table 14 – Selected income items: goods and services exported and sold to domestic exporters or sold to other domestic enterprises in the ELIDZ, 2015 and 2016 .............................. 28 Table 14A – Selected income items: goods and services exported and sold to domestic exporters or sold to other domestic enterprises in the ELIDZ, 2016 ............................................ 28 Table 15A – Information and communication technology usage by type of contractor in the ELIDZ as at the end of June 2016 .......................................................................................... 29 Table 15B – Information and communication technology usage by type of activity in the ELIDZ as at the end of June 2016 ............................................................................................... 30 Explanatory notes ................................................................................................................................................................................................................................................................ 31 Glossary .............................................................................................................................................................................................................................................................................. 33 General information ............................................................................................................................................................................................................................................................. 36
Statistics South Africa
East London Industrial Development Zone, 2016
1
1. Introduction The East London Industrial Development Zone (ELIDZ) was established in 2003 as part of the South African government initiative to improve industrial competitiveness
and economic growth in the country. The zone has since become a prime industrial park in South Africa, renowned for its customised solutions for various industries
including automotive, agro-processing and aqua-culture. The ELIDZ offers growth-oriented companies a specialised manufacturing platform, innovative industrial and
business solutions, access to new markets and strategic industry networks.
The ELIDZ is often required to report statistics about the activities of its tenants, but does not have mechanisms in place to collect this information. The ELIDZ needs
verified information on data such as employment, value of imports and exports, investment and income. Such information allows the ELIDZ to have benchmark data to
continually monitor and compare economic activity over time. The ELIDZ also gives preferential rates and discounts to tenants who create a certain amount of
employment, implement new technology, and meet other socio-economic criteria. However, the ELIDZ is unable to measure and verify whether tenants actually do
employ the required amount of staff to qualify for discounted rates.
Statistics South Africa (Stats SA) partnered with the ELIDZ to conduct a survey of the zone’s tenants. The main objectives of the study were to determine:
number of employees;
value of imports and exports;
expenditure on investments; and
employment levels per skills category.
The data collected are published at aggregated levels and all care was taken to preserve confidentiality in terms of section 17 of the Statistics Act, 1999 (Act No. 6 of
1999).
Statistics South Africa
East London Industrial Development Zone, 2016
2
2. Summary of findings for the year 2016
2.1 Income
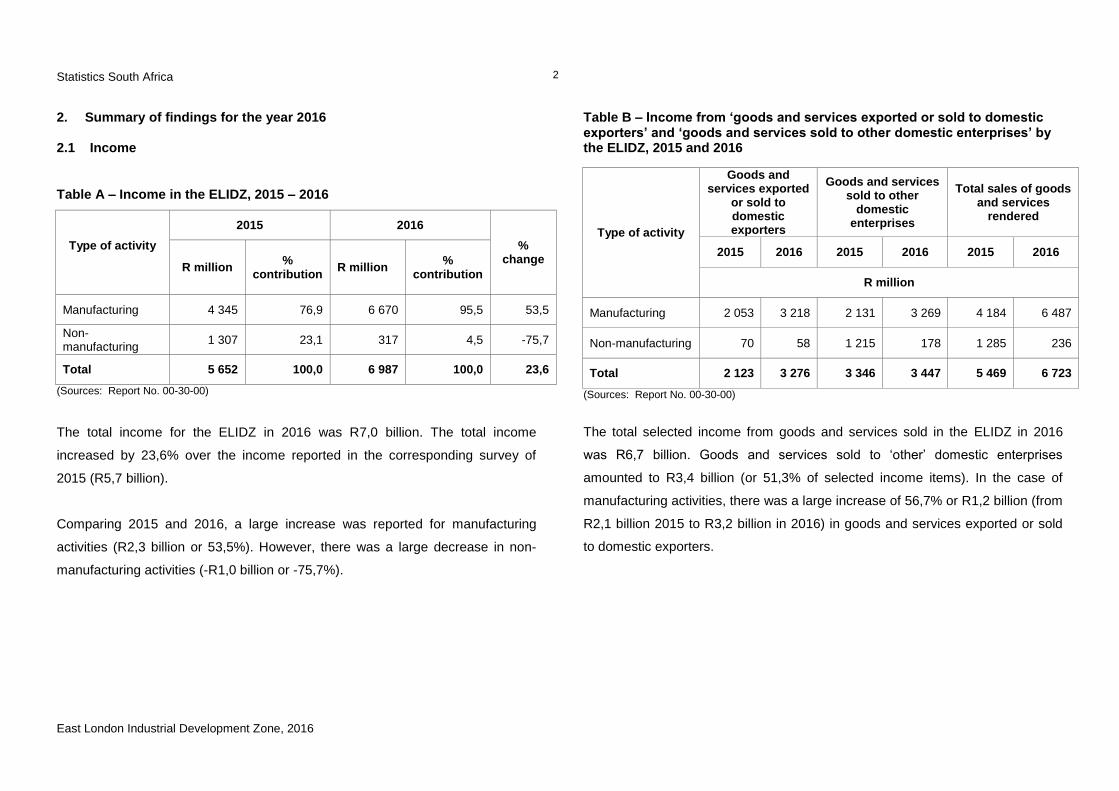
Table A – Income in the ELIDZ, 2015 – 2016
Type of activity
2015 2016
% change
R million %
contribution R million
% contribution
Manufacturing 4 345 76,9 6 670 95,5 53,5
Non-manufacturing
1 307 23,1 317 4,5 -75,7
Total 5 652 100,0 6 987 100,0 23,6
(Sources: Report No. 00-30-00)
The total income for the ELIDZ in 2016 was R7,0 billion. The total income
increased by 23,6% over the income reported in the corresponding survey of
2015 (R5,7 billion).
Comparing 2015 and 2016, a large increase was reported for manufacturing
activities (R2,3 billion or 53,5%). However, there was a large decrease in non-
manufacturing activities (-R1,0 billion or -75,7%).
Table B – Income from ‘goods and services exported or sold to domestic exporters’ and ‘goods and services sold to other domestic enterprises’ by the ELIDZ, 2015 and 2016
Type of activity
Goods and services exported
or sold to domestic exporters
Goods and services sold to other
domestic enterprises
Total sales of goods and services
rendered
2015 2016 2015 2016 2015 2016
R million
Manufacturing 2 053 3 218 2 131 3 269 4 184 6 487
Non-manufacturing 70 58 1 215 178 1 285 236
Total 2 123 3 276 3 346 3 447 5 469 6 723
(Sources: Report No. 00-30-00)
The total selected income from goods and services sold in the ELIDZ in 2016
was R6,7 billion. Goods and services sold to ‘other’ domestic enterprises
amounted to R3,4 billion (or 51,3% of selected income items). In the case of
manufacturing activities, there was a large increase of 56,7% or R1,2 billion (from
R2,1 billion 2015 to R3,2 billion in 2016) in goods and services exported or sold
to domestic exporters.
Statistics South Africa
East London Industrial Development Zone, 2016
3
2.2 Employment
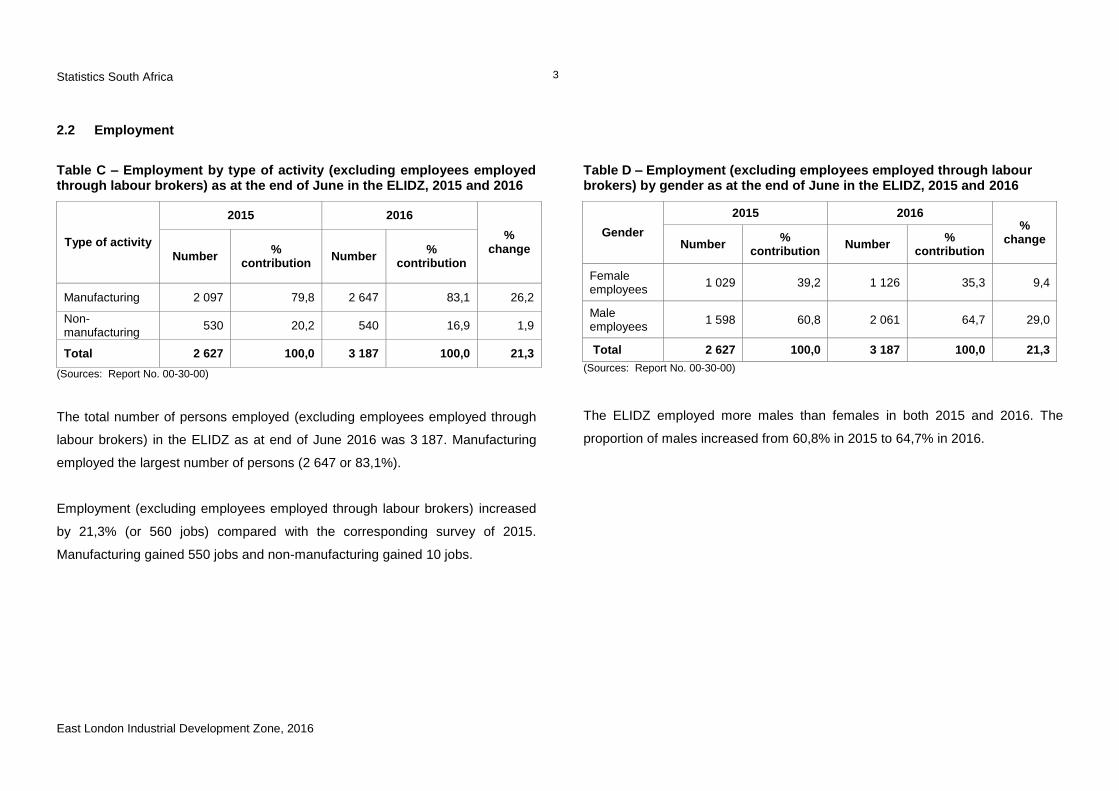
Table C – Employment by type of activity (excluding employees employed through labour brokers) as at the end of June in the ELIDZ, 2015 and 2016
Type of activity
2015 2016
% change
Number %
contribution Number
% contribution
Manufacturing 2 097 79,8 2 647 83,1 26,2
Non-manufacturing
530 20,2 540 16,9 1,9
Total 2 627 100,0 3 187 100,0 21,3
(Sources: Report No. 00-30-00)
The total number of persons employed (excluding employees employed through
labour brokers) in the ELIDZ as at end of June 2016 was 3 187. Manufacturing
employed the largest number of persons (2 647 or 83,1%).
Employment (excluding employees employed through labour brokers) increased
by 21,3% (or 560 jobs) compared with the corresponding survey of 2015.
Manufacturing gained 550 jobs and non-manufacturing gained 10 jobs.
Table D – Employment (excluding employees employed through labour brokers) by gender as at the end of June in the ELIDZ, 2015 and 2016
Gender
2015 2016 %
change Number %
contribution Number
% contribution
Female employees
1 029 39,2 1 126 35,3 9,4
Male employees
1 598 60,8 2 061 64,7 29,0
Total 2 627 100,0 3 187 100,0 21,3
(Sources: Report No. 00-30-00)
The ELIDZ employed more males than females in both 2015 and 2016. The
proportion of males increased from 60,8% in 2015 to 64,7% in 2016.
Statistics South Africa
East London Industrial Development Zone, 2016
4
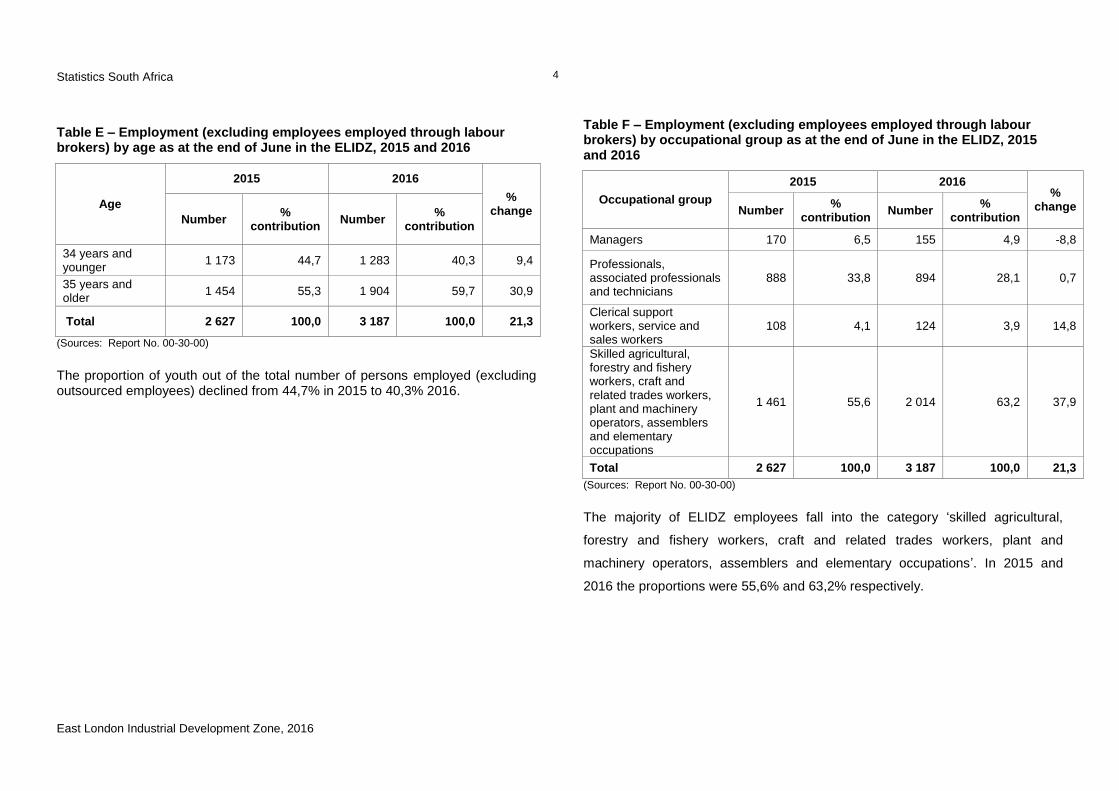
Table E – Employment (excluding employees employed through labour brokers) by age as at the end of June in the ELIDZ, 2015 and 2016
Age
2015 2016
% change
Number %
contribution Number
% contribution
34 years and younger
1 173 44,7 1 283 40,3 9,4
35 years and older
1 454 55,3 1 904 59,7 30,9
Total 2 627 100,0 3 187 100,0 21,3
(Sources: Report No. 00-30-00)
The proportion of youth out of the total number of persons employed (excluding outsourced employees) declined from 44,7% in 2015 to 40,3% 2016.
Table F – Employment (excluding employees employed through labour brokers) by occupational group as at the end of June in the ELIDZ, 2015 and 2016
Occupational group
2015 2016 %
change Number %
contribution Number
% contribution
Managers 170 6,5 155 4,9 -8,8
Professionals, associated professionals and technicians
888 33,8 894 28,1 0,7
Clerical support workers, service and sales workers
108 4,1 124 3,9 14,8
Skilled agricultural, forestry and fishery workers, craft and related trades workers, plant and machinery operators, assemblers and elementary occupations
1 461 55,6 2 014 63,2 37,9
Total 2 627 100,0 3 187 100,0 21,3
(Sources: Report No. 00-30-00)
The majority of ELIDZ employees fall into the category ‘skilled agricultural,
forestry and fishery workers, craft and related trades workers, plant and
machinery operators, assemblers and elementary occupations’. In 2015 and
2016 the proportions were 55,6% and 63,2% respectively.
Statistics South Africa
East London Industrial Development Zone, 2016
5
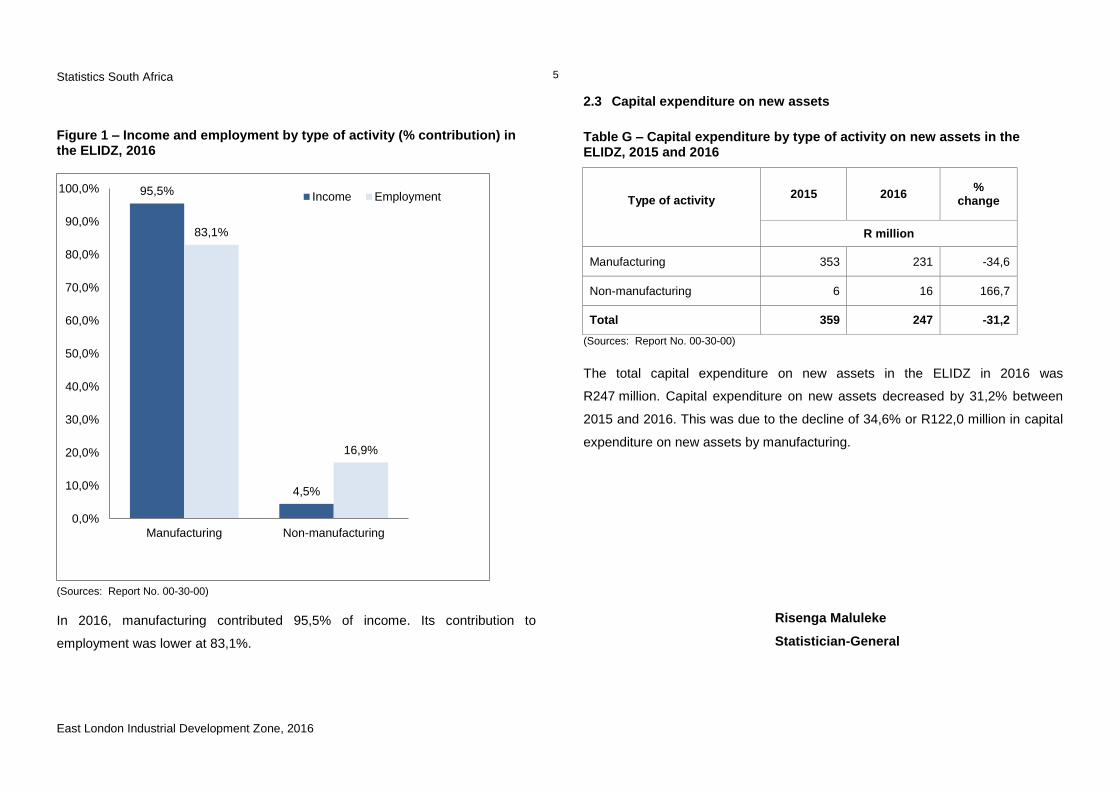
Figure 1 – Income and employment by type of activity (% contribution) in the ELIDZ, 2016
(Sources: Report No. 00-30-00)
In 2016, manufacturing contributed 95,5% of income. Its contribution to
employment was lower at 83,1%.
2.3 Capital expenditure on new assets
Table G – Capital expenditure by type of activity on new assets in the ELIDZ, 2015 and 2016
Type of activity
2015 2016 %
change
R million
Manufacturing 353 231 -34,6
Non-manufacturing 6 16 166,7
Total 359 247 -31,2
(Sources: Report No. 00-30-00)
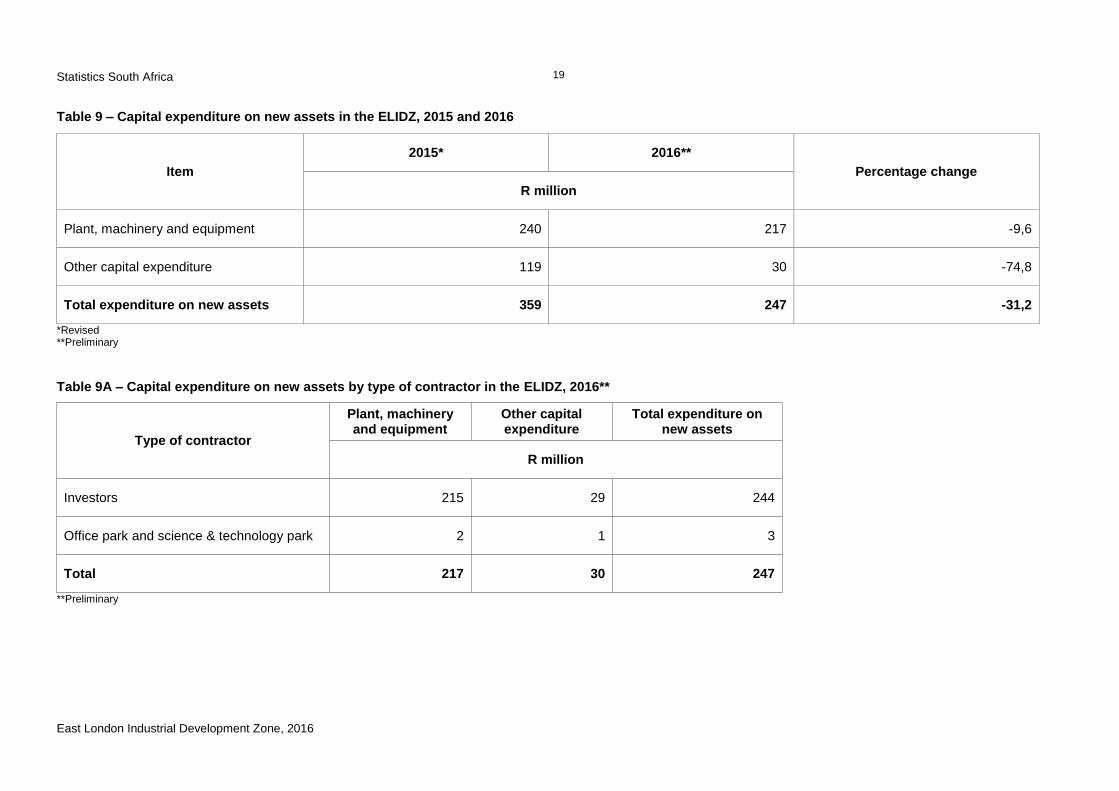
The total capital expenditure on new assets in the ELIDZ in 2016 was
R247 million. Capital expenditure on new assets decreased by 31,2% between
2015 and 2016. This was due to the decline of 34,6% or R122,0 million in capital
expenditure on new assets by manufacturing.
Risenga Maluleke
Statistician-General
95,5%
4,5%
83,1%
16,9%
0,0%
10,0%
20,0%
30,0%
40,0%
50,0%
60,0%
70,0%
80,0%
90,0%
100,0%
Manufacturing Non-manufacturing
Income Employment
Statistics South Africa
East London Industrial Development Zone, 2016
6
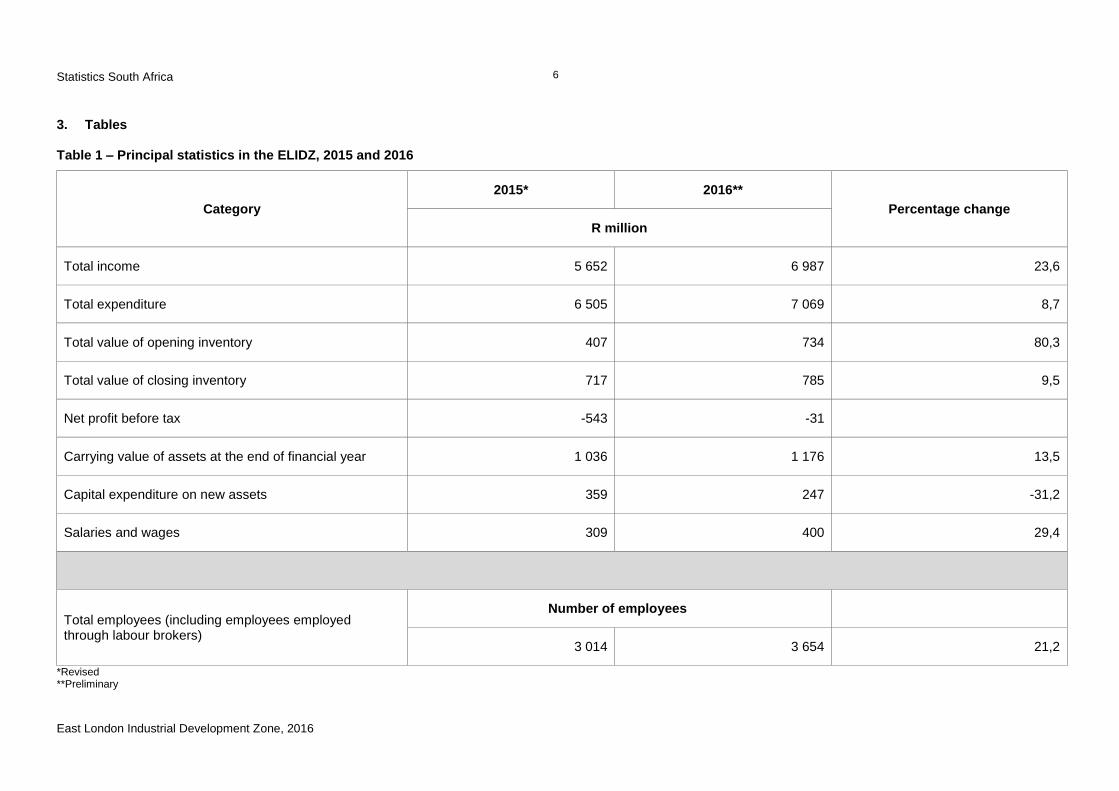
3. Tables Table 1 – Principal statistics in the ELIDZ, 2015 and 2016
Category
2015* 2016**
Percentage change
R million
Total income 5 652 6 987 23,6
Total expenditure 6 505 7 069 8,7
Total value of opening inventory 407 734 80,3
Total value of closing inventory 717 785 9,5
Net profit before tax -543 -31
Carrying value of assets at the end of financial year 1 036 1 176 13,5
Capital expenditure on new assets 359 247 -31,2
Salaries and wages 309 400 29,4
Total employees (including employees employed through labour brokers)
Number of employees
3 014 3 654 21,2
*Revised **Preliminary
Statistics South Africa
East London Industrial Development Zone, 2016
7
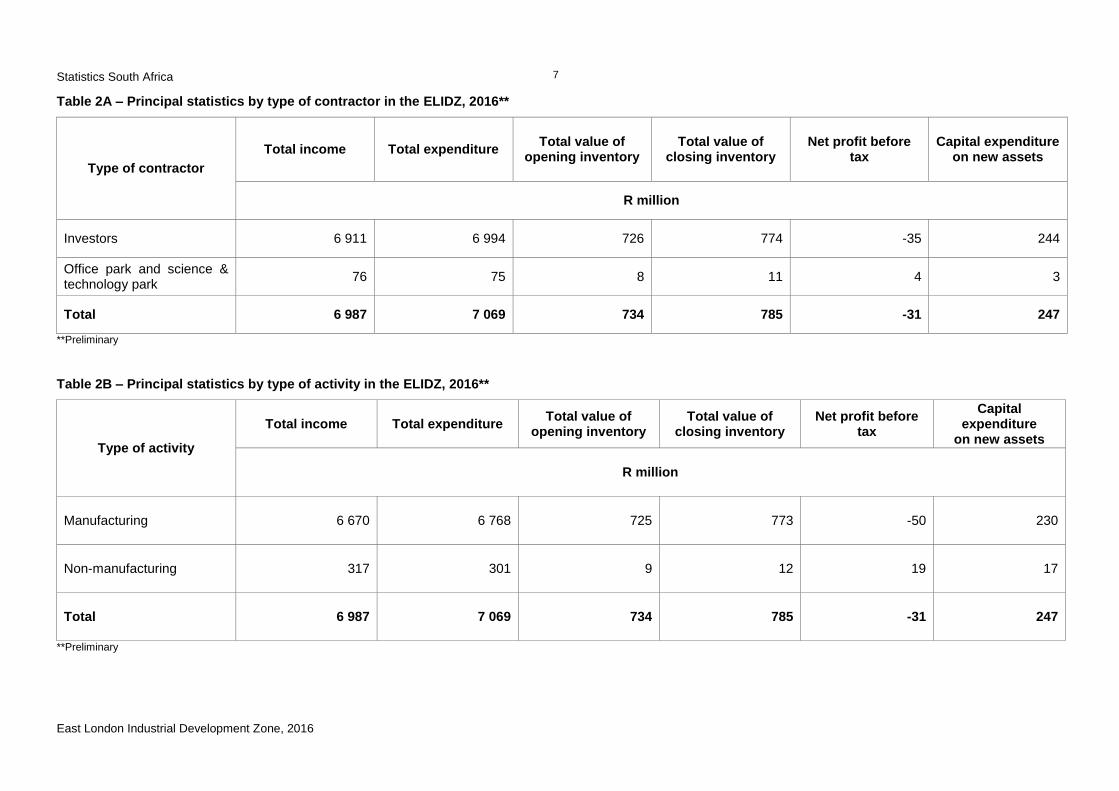
Table 2A – Principal statistics by type of contractor in the ELIDZ, 2016**
Type of contractor
Total income Total expenditure Total value of
opening inventory Total value of
closing inventory Net profit before
tax Capital expenditure
on new assets
R million
Investors 6 911 6 994 726 774 -35 244
Office park and science & technology park
76 75 8 11 4 3
Total 6 987 7 069 734 785 -31 247
**Preliminary
Table 2B – Principal statistics by type of activity in the ELIDZ, 2016**
Type of activity
Total income Total expenditure Total value of
opening inventory Total value of
closing inventory Net profit before
tax
Capital expenditure
on new assets
R million
Manufacturing 6 670 6 768 725 773 -50 230
Non-manufacturing 317 301 9 12 19 17
Total 6 987 7 069 734 785 -31 247
**Preliminary
Statistics South Africa
East London Industrial Development Zone, 2016
8
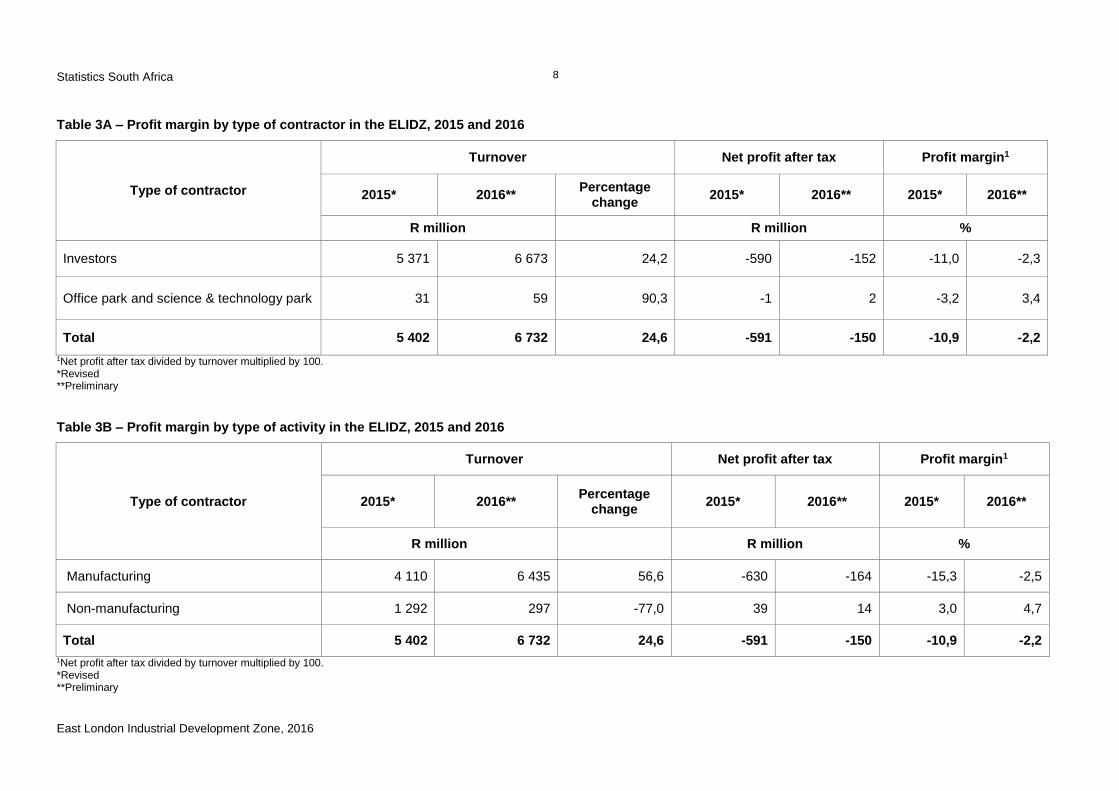
Table 3A – Profit margin by type of contractor in the ELIDZ, 2015 and 2016
Type of contractor
Turnover Net profit after tax Profit margin1
2015* 2016** Percentage
change 2015* 2016** 2015* 2016**
R million R million %
Investors 5 371 6 673 24,2 -590 -152 -11,0 -2,3
Office park and science & technology park 31 59 90,3 -1 2 -3,2 3,4
Total 5 402 6 732 24,6 -591 -150 -10,9 -2,2
1Net profit after tax divided by turnover multiplied by 100. *Revised **Preliminary
Table 3B – Profit margin by type of activity in the ELIDZ, 2015 and 2016
Type of contractor
Turnover Net profit after tax Profit margin1
2015* 2016** Percentage
change 2015* 2016** 2015* 2016**
R million R million %
Manufacturing 4 110 6 435 56,6 -630 -164 -15,3 -2,5
Non-manufacturing 1 292 297 -77,0 39 14 3,0 4,7
Total 5 402 6 732 24,6 -591 -150 -10,9 -2,2
1Net profit after tax divided by turnover multiplied by 100.
*Revised **Preliminary
Statistics South Africa
East London Industrial Development Zone, 2016
9
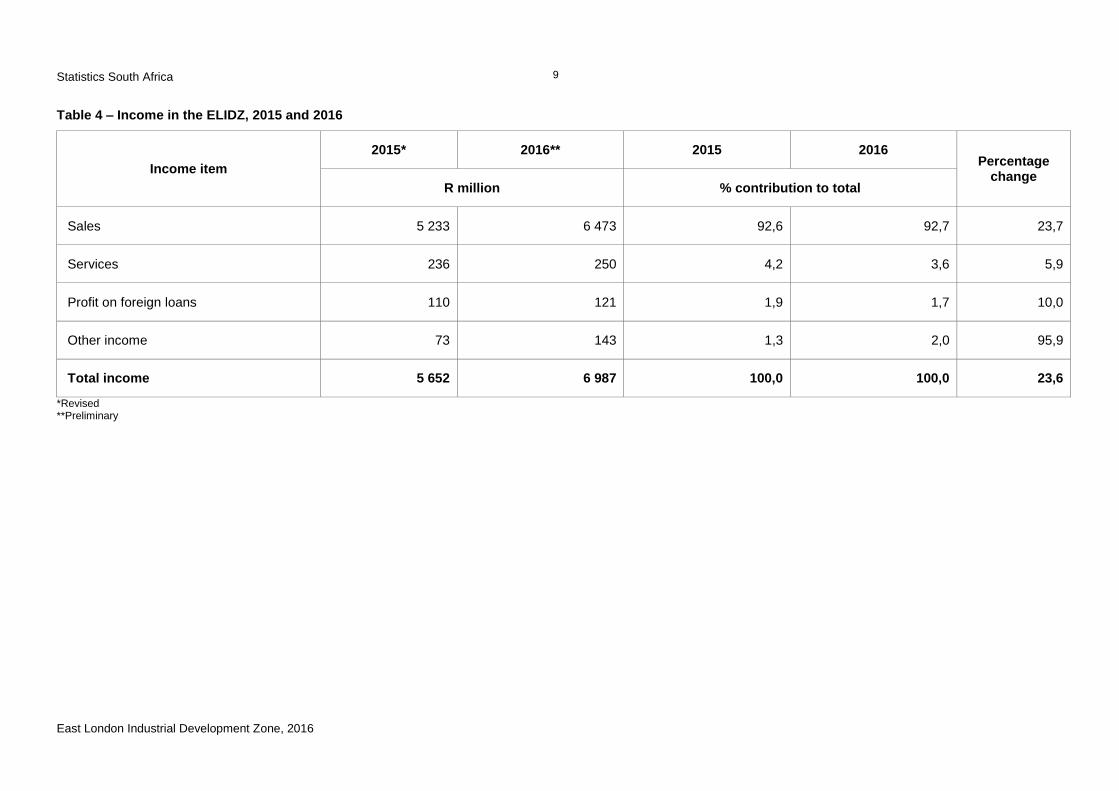
Table 4 – Income in the ELIDZ, 2015 and 2016
Income item
2015* 2016** 2015 2016 Percentage
change R million % contribution to total
Sales 5 233 6 473 92,6 92,7 23,7
Services 236 250 4,2 3,6 5,9
Profit on foreign loans 110 121 1,9 1,7 10,0
Other income 73 143 1,3 2,0 95,9
Total income 5 652 6 987 100,0 100,0 23,6
*Revised **Preliminary
Statistics South Africa
East London Industrial Development Zone, 2016
10
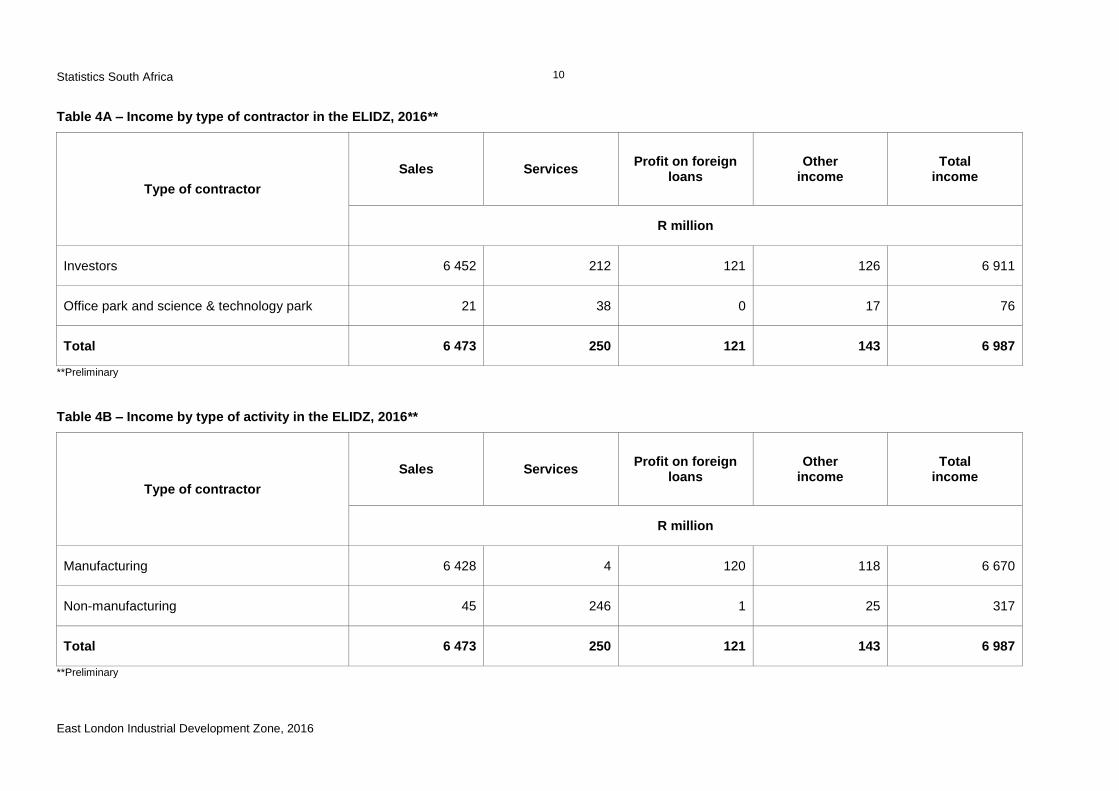
Table 4A – Income by type of contractor in the ELIDZ, 2016**
Type of contractor
Sales Services Profit on foreign
loans Other
income Total
income
R million
Investors 6 452 212 121 126 6 911
Office park and science & technology park 21 38 0 17 76
Total 6 473 250 121 143 6 987
**Preliminary
Table 4B – Income by type of activity in the ELIDZ, 2016**
Type of contractor
Sales Services Profit on foreign
loans Other
income Total
income
R million
Manufacturing 6 428 4 120 118 6 670
Non-manufacturing 45 246 1 25 317
Total 6 473 250 121 143 6 987
**Preliminary
Statistics South Africa
East London Industrial Development Zone, 2016
11
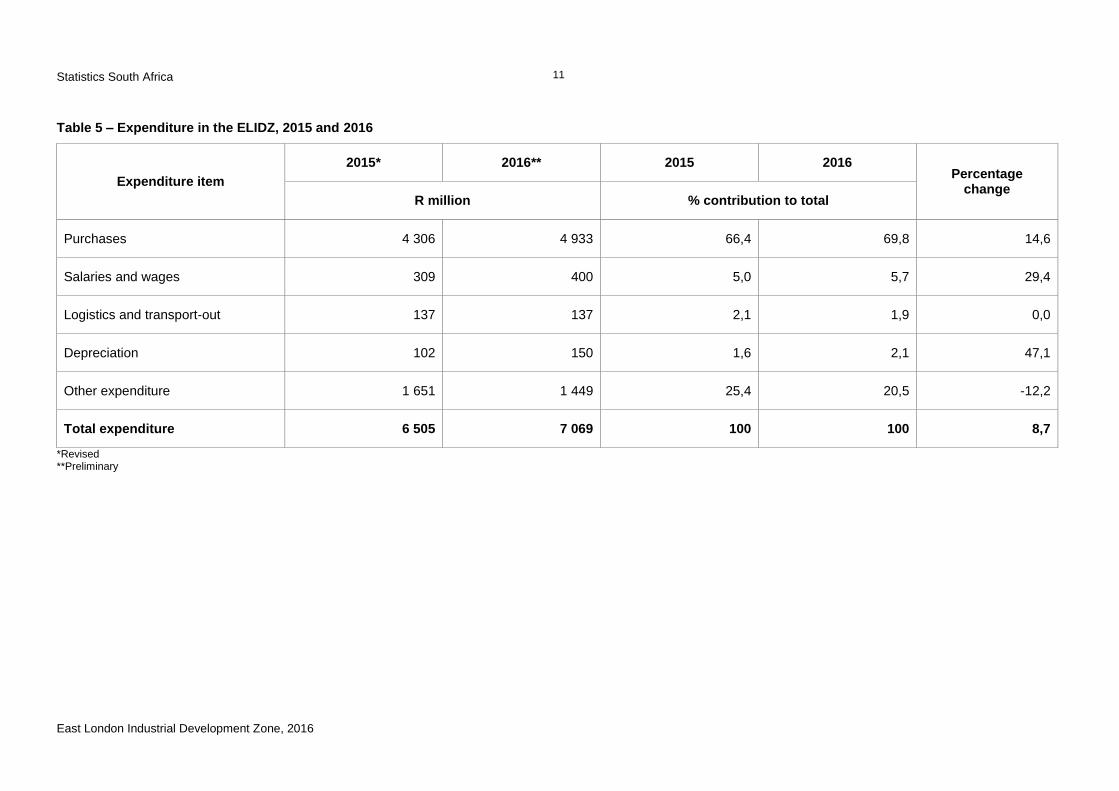
Table 5 – Expenditure in the ELIDZ, 2015 and 2016
Expenditure item
2015* 2016** 2015 2016 Percentage
change R million % contribution to total
Purchases 4 306 4 933 66,4 69,8 14,6
Salaries and wages 309 400 5,0 5,7 29,4
Logistics and transport-out 137 137 2,1 1,9 0,0
Depreciation 102 150 1,6 2,1 47,1
Other expenditure 1 651 1 449 25,4 20,5 -12,2
Total expenditure 6 505 7 069 100 100 8,7
*Revised **Preliminary
Statistics South Africa
East London Industrial Development Zone, 2016
12
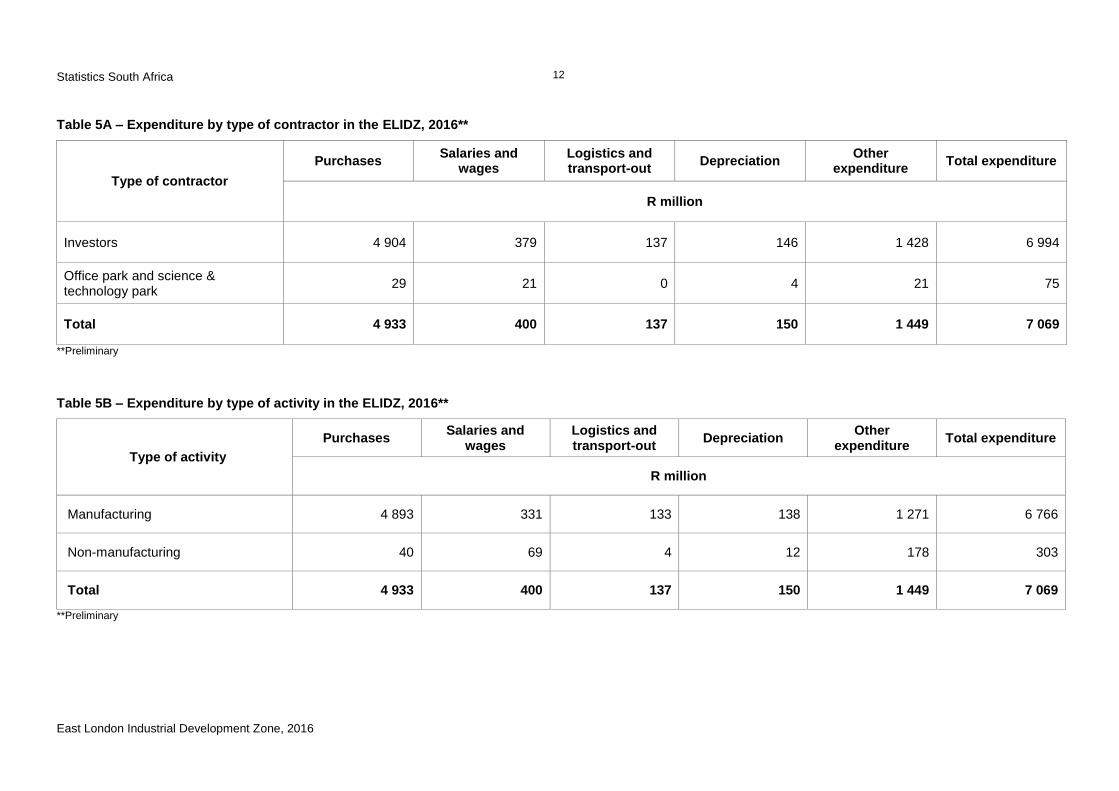
Table 5A – Expenditure by type of contractor in the ELIDZ, 2016**
Type of contractor
Purchases Salaries and
wages Logistics and transport-out
Depreciation Other
expenditure Total expenditure
R million
Investors 4 904 379 137 146 1 428 6 994
Office park and science & technology park
29 21 0 4 21 75
Total 4 933 400 137 150 1 449 7 069
**Preliminary
Table 5B – Expenditure by type of activity in the ELIDZ, 2016**
Type of activity
Purchases Salaries and
wages Logistics and transport-out
Depreciation Other
expenditure Total expenditure
R million
Manufacturing 4 893 331 133 138 1 271 6 766
Non-manufacturing 40 69 4 12 178 303
Total 4 933 400 137 150 1 449 7 069
**Preliminary
Statistics South Africa
East London Industrial Development Zone, 2016
13
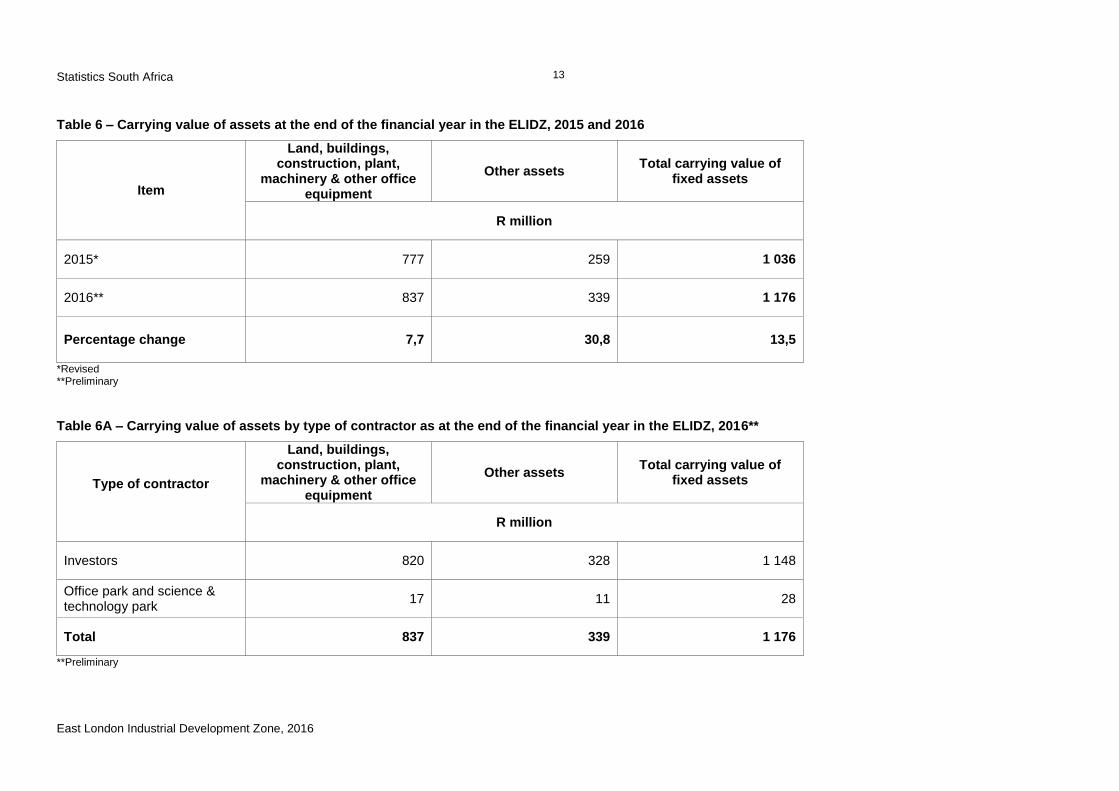
Table 6 – Carrying value of assets at the end of the financial year in the ELIDZ, 2015 and 2016
Item
Land, buildings, construction, plant,
machinery & other office equipment
Other assets Total carrying value of
fixed assets
R million
2015* 777 259 1 036
2016** 837 339 1 176
Percentage change 7,7
30,8
13,5
*Revised **Preliminary
Table 6A – Carrying value of assets by type of contractor as at the end of the financial year in the ELIDZ, 2016**
Type of contractor
Land, buildings, construction, plant,
machinery & other office equipment
Other assets Total carrying value of
fixed assets
R million
Investors 820 328 1 148
Office park and science & technology park
17 11 28
Total 837 339 1 176
**Preliminary
Statistics South Africa
East London Industrial Development Zone, 2016
14
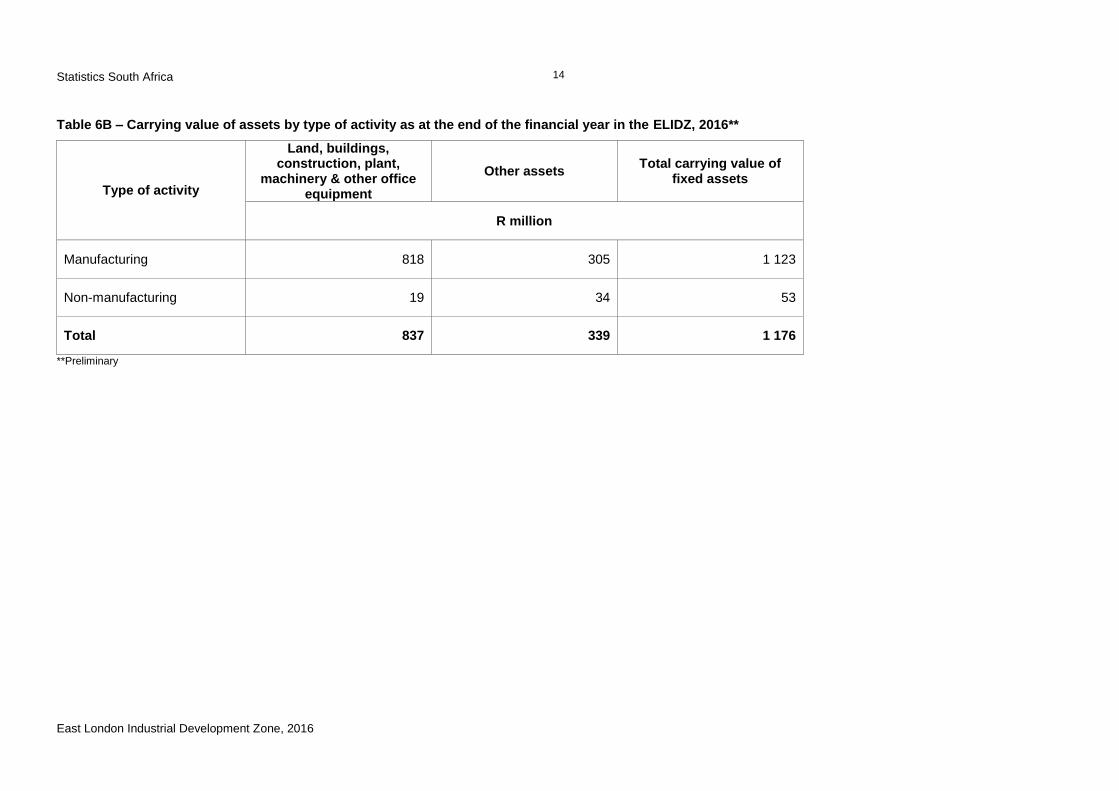
Table 6B – Carrying value of assets by type of activity as at the end of the financial year in the ELIDZ, 2016**
Type of activity
Land, buildings, construction, plant,
machinery & other office equipment
Other assets Total carrying value of
fixed assets
R million
Manufacturing 818 305 1 123
Non-manufacturing 19 34 53
Total 837 339 1 176
**Preliminary
Statistics South Africa
East London Industrial Development Zone, 2016
15
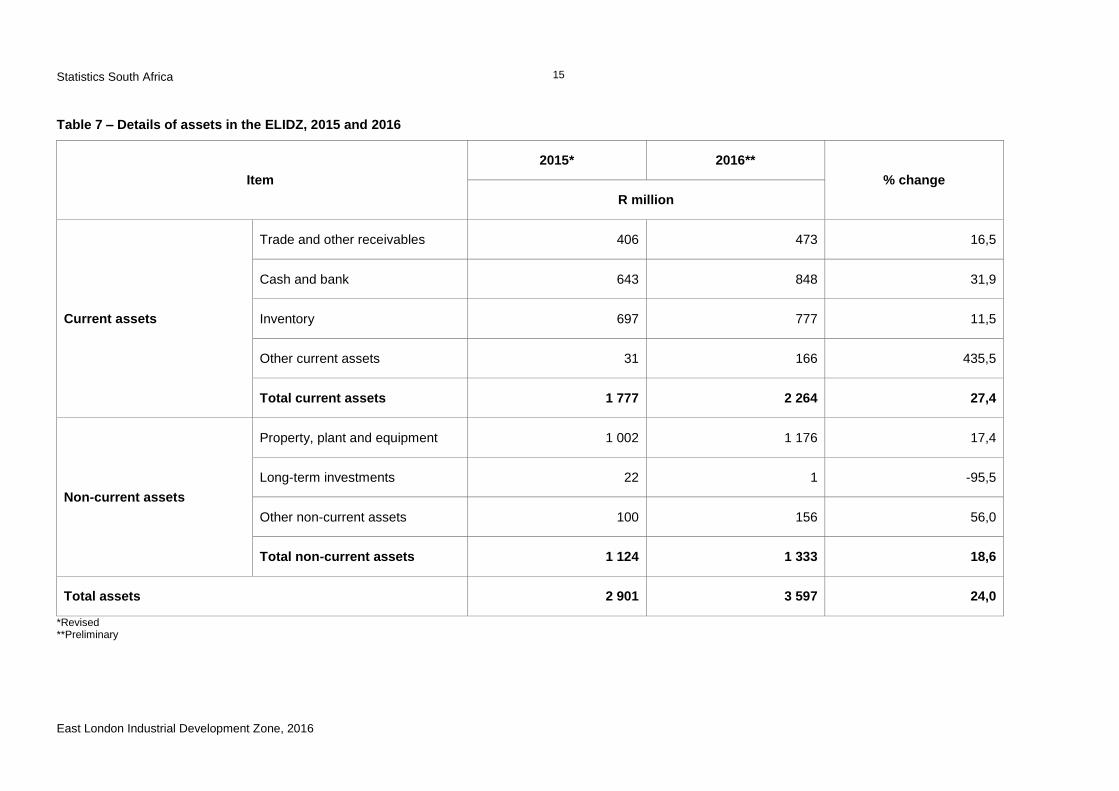
Table 7 – Details of assets in the ELIDZ, 2015 and 2016
Item
2015* 2016**
% change
R million
Current assets
Trade and other receivables 406 473 16,5
Cash and bank 643 848 31,9
Inventory 697 777 11,5
Other current assets 31 166 435,5
Total current assets 1 777 2 264 27,4
Non-current assets
Property, plant and equipment 1 002 1 176 17,4
Long-term investments 22 1 -95,5
Other non-current assets 100 156 56,0
Total non-current assets 1 124 1 333 18,6
Total assets 2 901 3 597 24,0
*Revised **Preliminary
Statistics South Africa
East London Industrial Development Zone, 2016
16
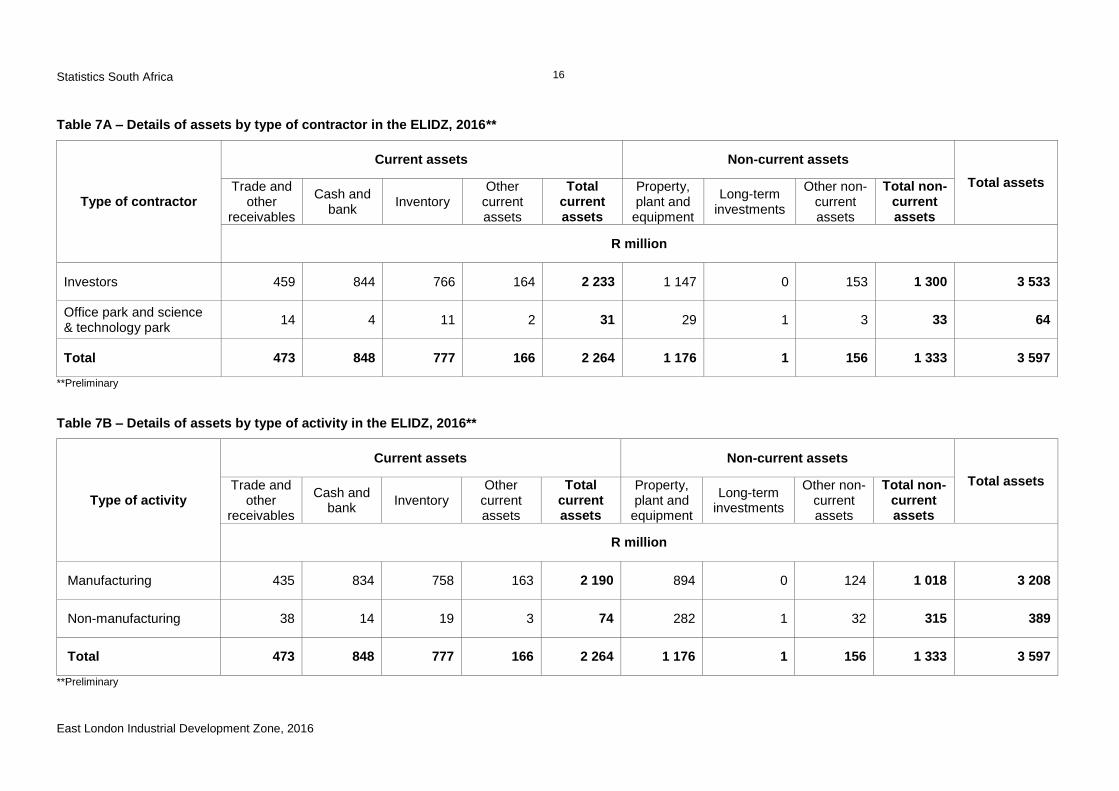
Table 7A – Details of assets by type of contractor in the ELIDZ, 2016**
Type of contractor
Current assets Non-current assets
Total assets Trade and other
receivables
Cash and bank
Inventory Other
current assets
Total current assets
Property, plant and
equipment
Long-term investments
Other non-current assets
Total non-current assets
R million
Investors 459 844 766 164 2 233 1 147 0 153 1 300 3 533
Office park and science & technology park
14 4 11 2 31 29 1 3 33 64
Total 473 848 777 166 2 264 1 176 1 156 1 333 3 597
**Preliminary
Table 7B – Details of assets by type of activity in the ELIDZ, 2016**
Type of activity
Current assets Non-current assets
Total assets Trade and other
receivables
Cash and bank
Inventory Other
current assets
Total current assets
Property, plant and
equipment
Long-term investments
Other non-current assets
Total non-current assets
R million
Manufacturing 435 834 758 163 2 190 894 0 124 1 018 3 208
Non-manufacturing 38 14 19 3 74 282 1 32 315 389
Total 473 848 777 166 2 264 1 176 1 156 1 333 3 597
**Preliminary
Statistics South Africa
East London Industrial Development Zone, 2016
17
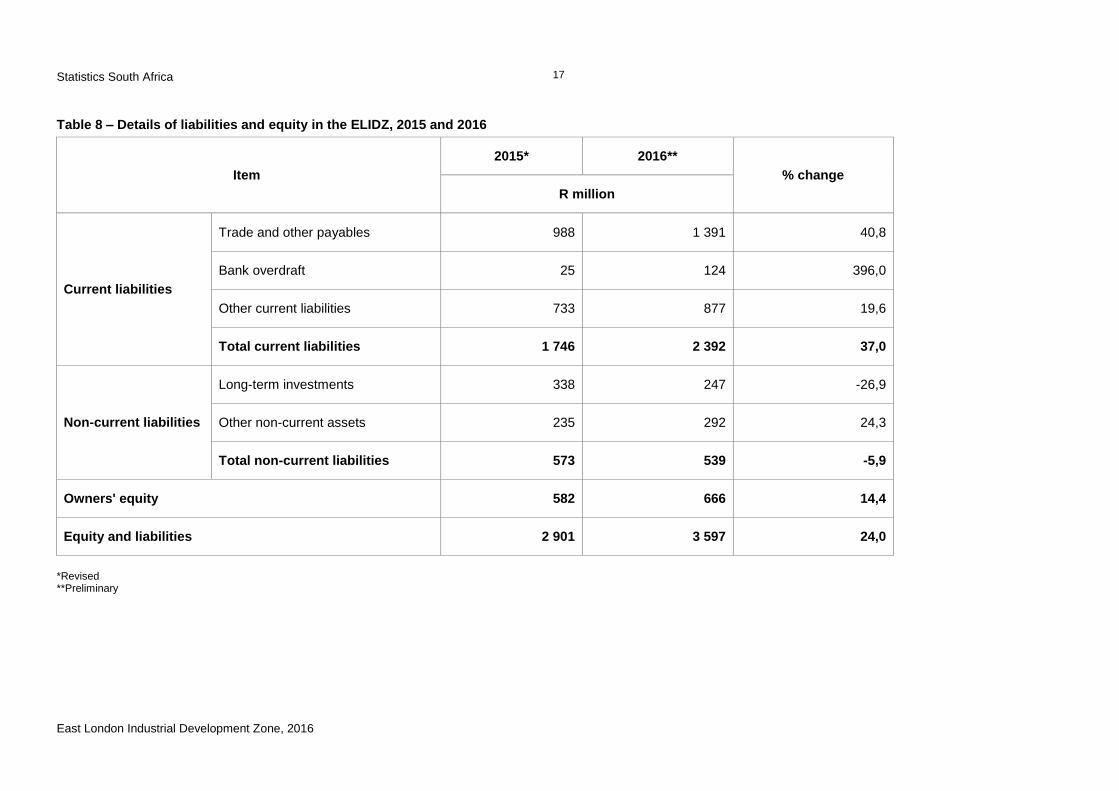
Table 8 – Details of liabilities and equity in the ELIDZ, 2015 and 2016
*Revised **Preliminary
Item
2015* 2016**
% change
R million
Current liabilities
Trade and other payables 988 1 391 40,8
Bank overdraft 25 124 396,0
Other current liabilities 733 877 19,6
Total current liabilities 1 746 2 392 37,0
Non-current liabilities
Long-term investments 338 247 -26,9
Other non-current assets 235 292 24,3
Total non-current liabilities 573 539 -5,9
Owners' equity 582 666 14,4
Equity and liabilities 2 901 3 597 24,0
Statistics South Africa
East London Industrial Development Zone, 2016
18
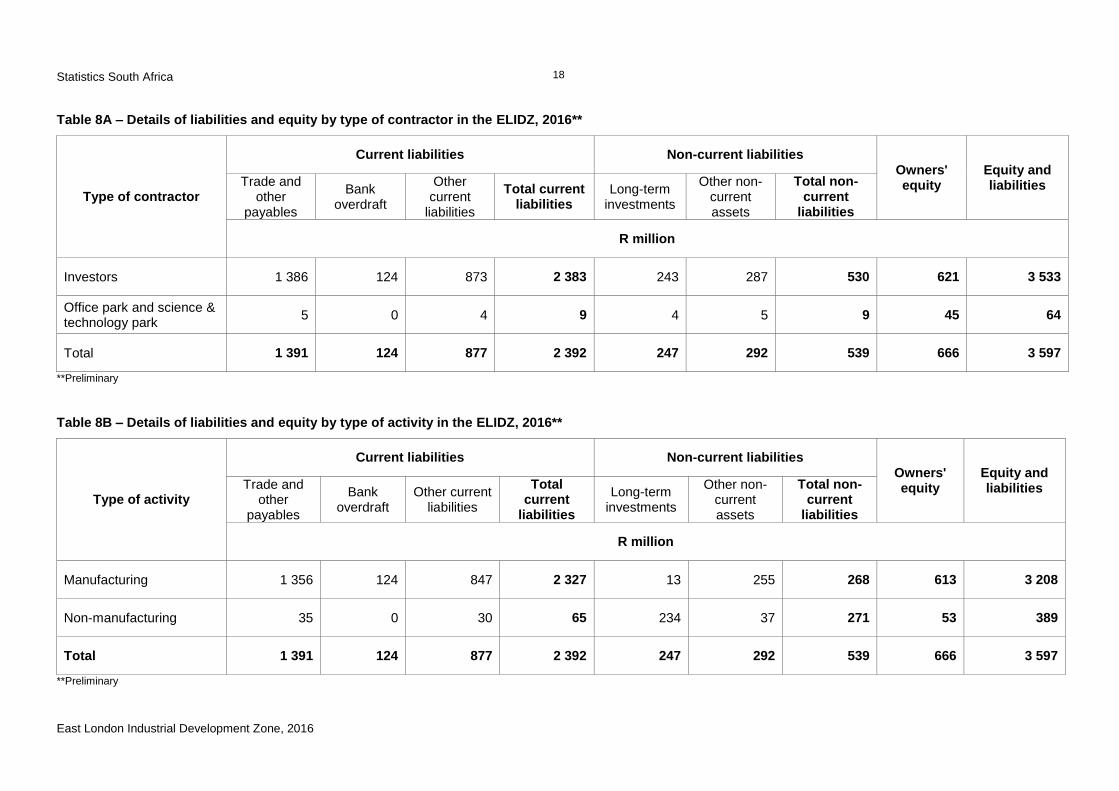
Table 8A – Details of liabilities and equity by type of contractor in the ELIDZ, 2016**
Type of contractor
Current liabilities Non-current liabilities Owners' equity
Equity and liabilities Trade and
other payables
Bank overdraft
Other current
liabilities
Total current liabilities
Long-term investments
Other non-current assets
Total non-current
liabilities
R million
Investors 1 386 124 873 2 383 243 287 530 621 3 533
Office park and science & technology park
5 0 4 9 4 5 9 45 64
Total 1 391 124 877 2 392 247 292 539 666 3 597
**Preliminary
Table 8B – Details of liabilities and equity by type of activity in the ELIDZ, 2016**
Type of activity
Current liabilities Non-current liabilities Owners' equity
Equity and liabilities Trade and
other payables
Bank overdraft
Other current liabilities
Total current
liabilities
Long-term investments
Other non-current assets
Total non-current
liabilities
R million
Manufacturing 1 356 124 847 2 327 13 255 268 613 3 208
Non-manufacturing 35 0 30 65 234 37 271 53 389
Total 1 391 124 877 2 392 247 292 539 666 3 597
**Preliminary
Statistics South Africa
East London Industrial Development Zone, 2016
19
Table 9 – Capital expenditure on new assets in the ELIDZ, 2015 and 2016
Item
2015* 2016**
Percentage change
R million
Plant, machinery and equipment 240 217 -9,6
Other capital expenditure 119 30 -74,8
Total expenditure on new assets 359 247 -31,2
*Revised **Preliminary
Table 9A – Capital expenditure on new assets by type of contractor in the ELIDZ, 2016**
Type of contractor
Plant, machinery and equipment
Other capital expenditure
Total expenditure on new assets
R million
Investors 215 29 244
Office park and science & technology park 2 1 3
Total 217 30 247
**Preliminary
Statistics South Africa
East London Industrial Development Zone, 2016
20
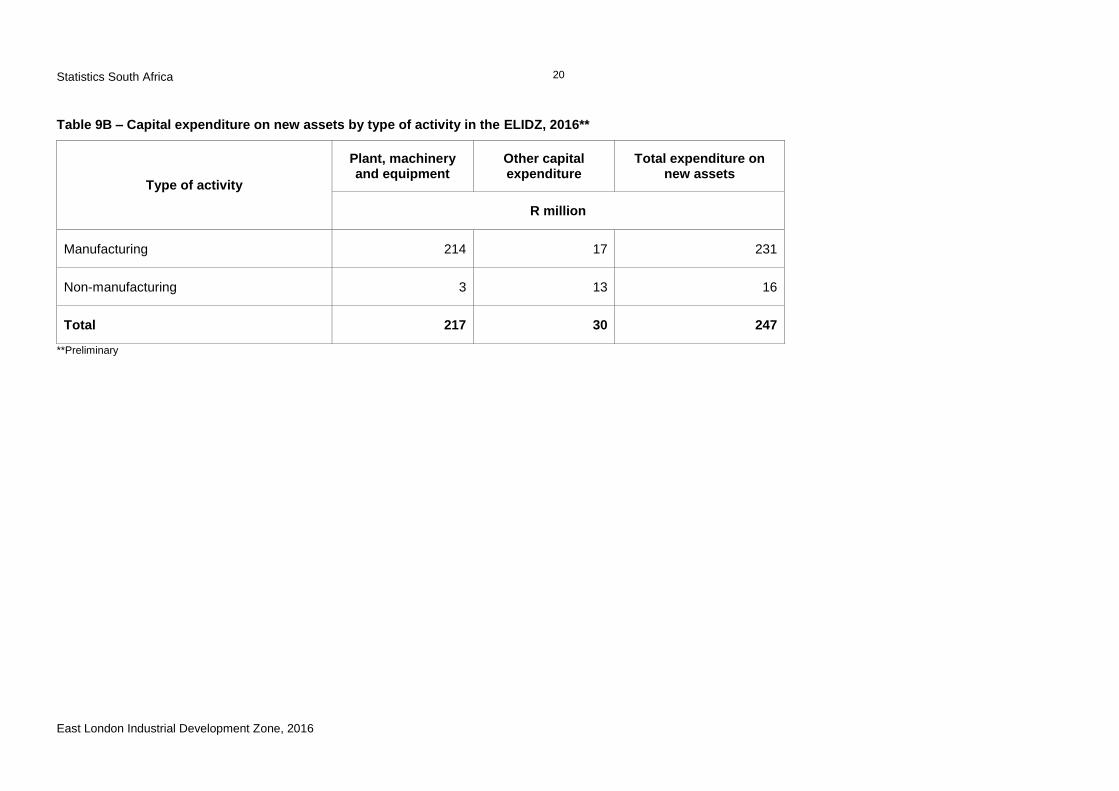
Table 9B – Capital expenditure on new assets by type of activity in the ELIDZ, 2016**
Type of activity
Plant, machinery and equipment
Other capital expenditure
Total expenditure on new assets
R million
Manufacturing 214 17 231
Non-manufacturing 3 13 16
Total 217 30 247
**Preliminary
Statistics South Africa
East London Industrial Development Zone, 2016
21
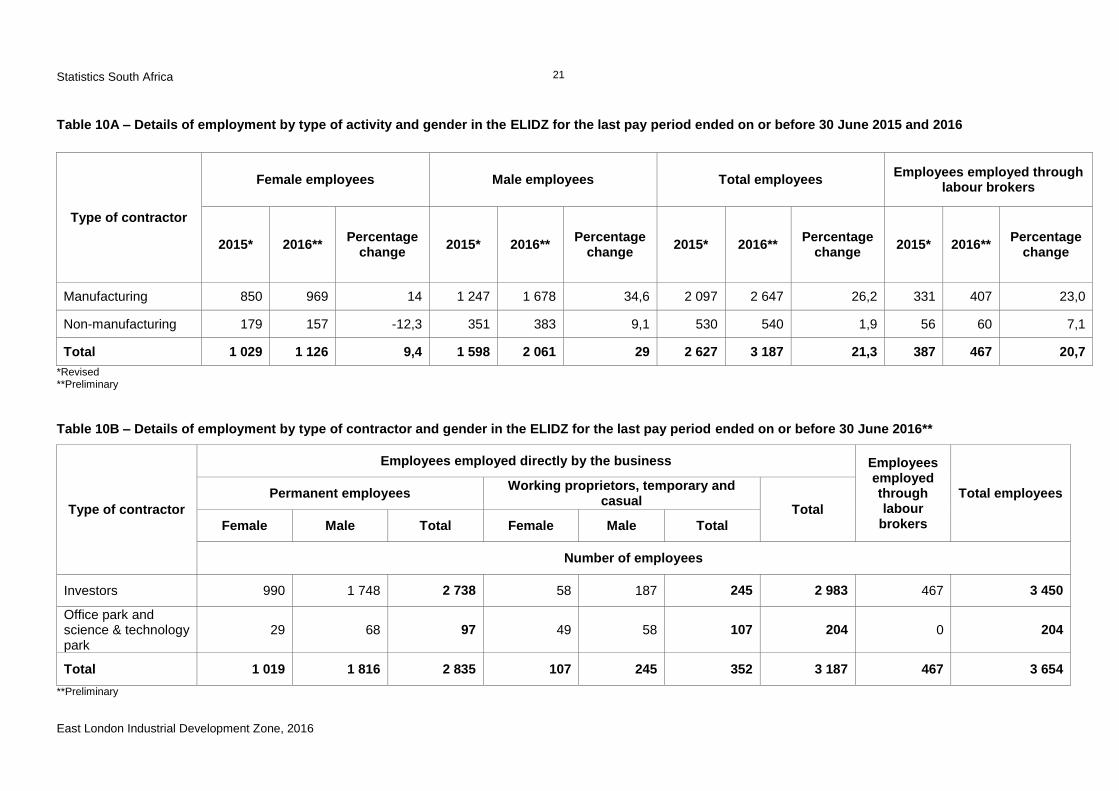
Table 10A – Details of employment by type of activity and gender in the ELIDZ for the last pay period ended on or before 30 June 2015 and 2016
Type of contractor
Female employees Male employees Total employees Employees employed through
labour brokers
2015* 2016** Percentage
change 2015* 2016**
Percentage change
2015* 2016** Percentage
change 2015* 2016**
Percentage change
Manufacturing 850 969 14 1 247 1 678 34,6 2 097 2 647 26,2 331 407 23,0
Non-manufacturing 179 157 -12,3 351 383 9,1 530 540 1,9 56 60 7,1
Total 1 029 1 126 9,4 1 598 2 061 29 2 627 3 187 21,3 387 467 20,7
*Revised **Preliminary
Table 10B – Details of employment by type of contractor and gender in the ELIDZ for the last pay period ended on or before 30 June 2016**
Type of contractor
Employees employed directly by the business Employees employed through labour
brokers
Total employees Permanent employees Working proprietors, temporary and
casual Total
Female Male Total Female Male Total
Number of employees
Investors 990 1 748 2 738 58 187 245 2 983 467 3 450
Office park and science & technology park
29 68 97 49 58 107 204 0 204
Total 1 019 1 816 2 835 107 245 352 3 187 467 3 654
**Preliminary
Statistics South Africa
East London Industrial Development Zone, 2016
22
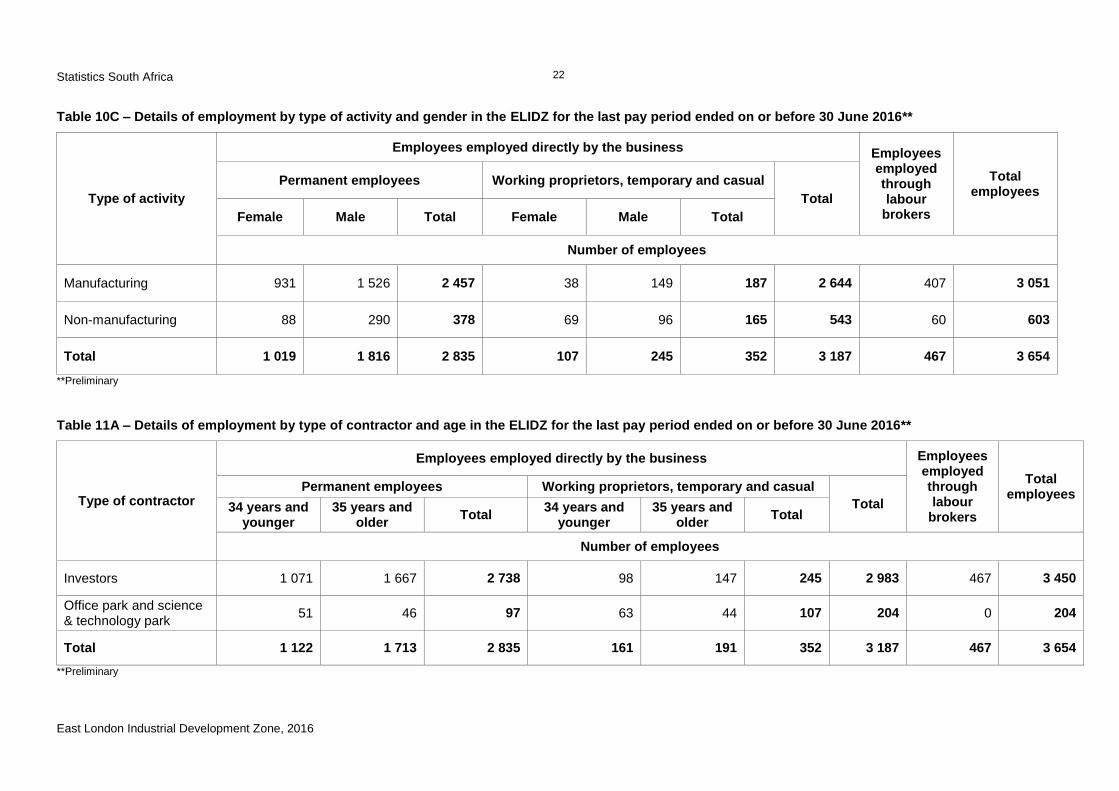
Table 10C – Details of employment by type of activity and gender in the ELIDZ for the last pay period ended on or before 30 June 2016**
Type of activity
Employees employed directly by the business Employees employed through labour
brokers
Total employees
Permanent employees Working proprietors, temporary and casual
Total
Female Male Total Female Male Total
Number of employees
Manufacturing 931 1 526 2 457 38 149 187 2 644 407 3 051
Non-manufacturing 88 290 378 69 96 165 543 60 603
Total 1 019 1 816 2 835 107 245 352 3 187 467 3 654
**Preliminary
Table 11A – Details of employment by type of contractor and age in the ELIDZ for the last pay period ended on or before 30 June 2016**
Type of contractor
Employees employed directly by the business Employees employed through labour
brokers
Total employees
Permanent employees Working proprietors, temporary and casual
Total 34 years and younger
35 years and older
Total 34 years and
younger 35 years and
older Total
Number of employees
Investors 1 071 1 667 2 738 98 147 245 2 983 467 3 450
Office park and science & technology park
51 46 97 63 44 107 204 0 204
Total 1 122 1 713 2 835 161 191 352 3 187 467 3 654
**Preliminary
Statistics South Africa
East London Industrial Development Zone, 2016
23
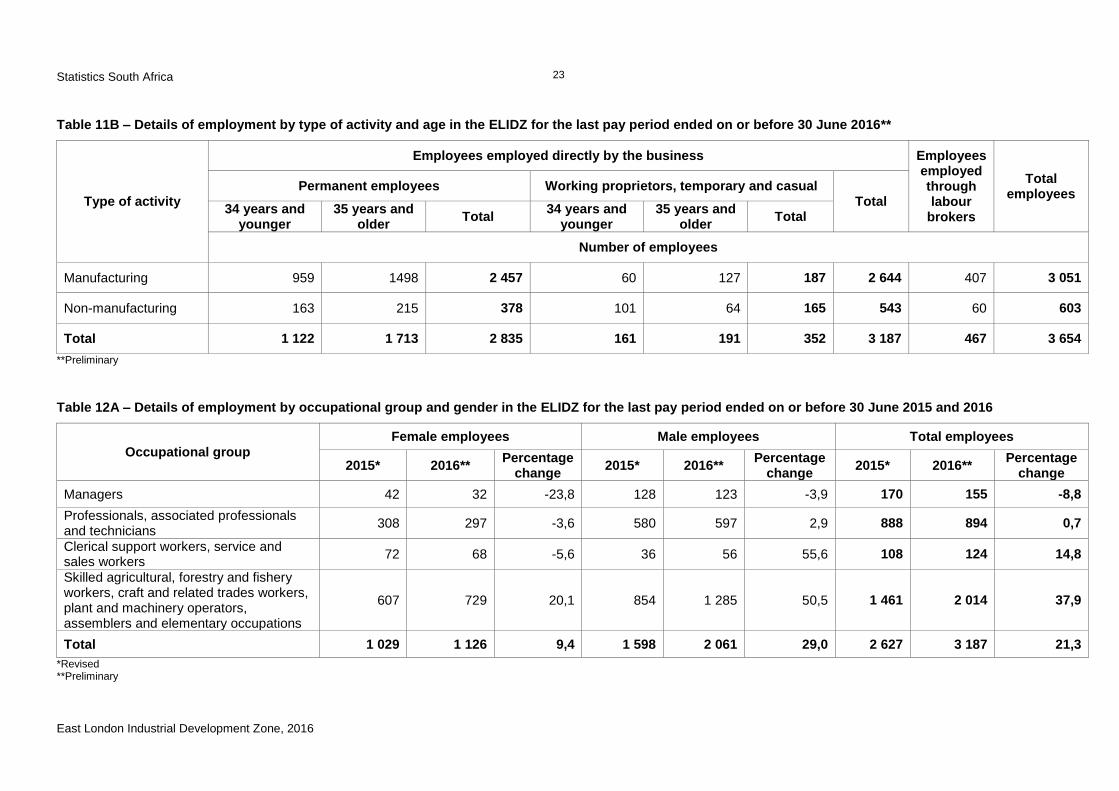
Table 11B – Details of employment by type of activity and age in the ELIDZ for the last pay period ended on or before 30 June 2016**
Type of activity
Employees employed directly by the business Employees employed through labour
brokers
Total employees
Permanent employees Working proprietors, temporary and casual Total
34 years and younger
35 years and older
Total 34 years and
younger 35 years and
older Total
Number of employees
Manufacturing 959 1498 2 457 60 127 187 2 644 407 3 051
Non-manufacturing 163 215 378 101 64 165 543 60 603
Total 1 122 1 713 2 835 161 191 352 3 187 467 3 654
**Preliminary
Table 12A – Details of employment by occupational group and gender in the ELIDZ for the last pay period ended on or before 30 June 2015 and 2016
Occupational group Female employees Male employees Total employees
2015* 2016** Percentage
change 2015* 2016**
Percentage change
2015* 2016** Percentage
change
Managers 42 32 -23,8 128 123 -3,9 170 155 -8,8
Professionals, associated professionals and technicians
308 297 -3,6 580 597 2,9 888 894 0,7
Clerical support workers, service and sales workers
72 68 -5,6 36 56 55,6 108 124 14,8
Skilled agricultural, forestry and fishery workers, craft and related trades workers, plant and machinery operators, assemblers and elementary occupations
607 729 20,1 854 1 285 50,5 1 461 2 014 37,9
Total 1 029 1 126 9,4 1 598 2 061 29,0 2 627 3 187 21,3
*Revised **Preliminary
Statistics South Africa
East London Industrial Development Zone, 2016
24
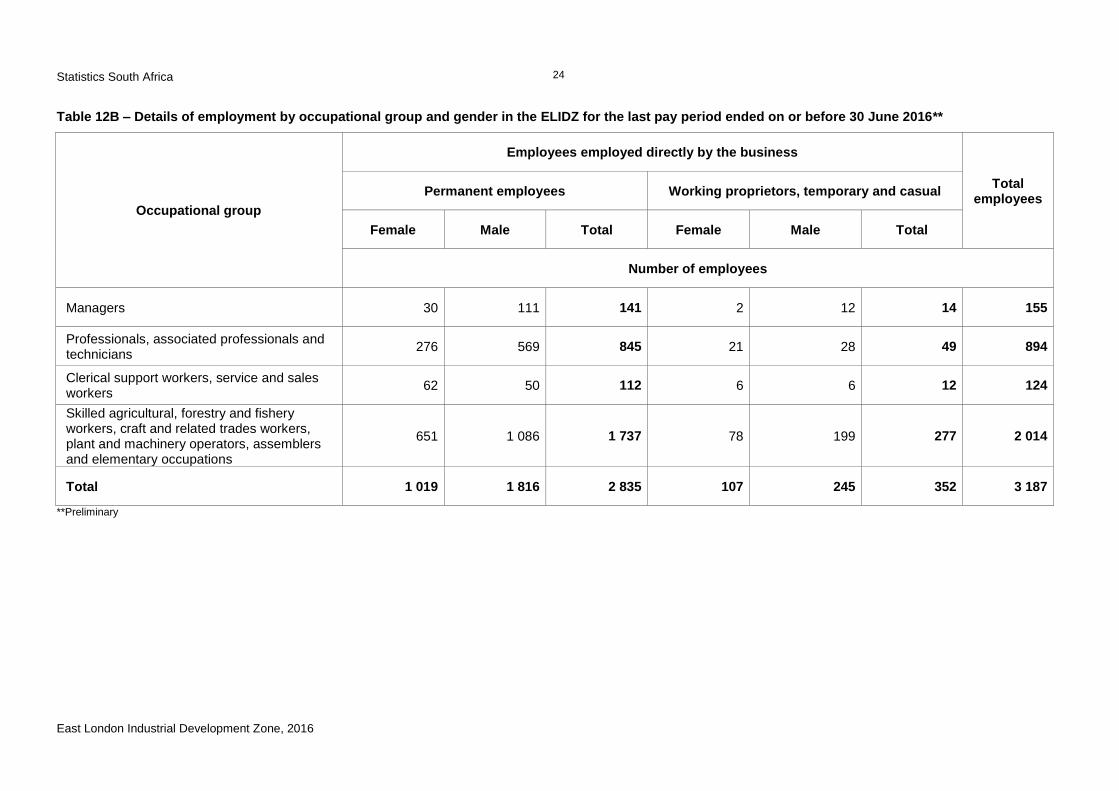
Table 12B – Details of employment by occupational group and gender in the ELIDZ for the last pay period ended on or before 30 June 2016**
Occupational group
Employees employed directly by the business
Total employees
Permanent employees Working proprietors, temporary and casual
Female Male Total Female Male Total
Number of employees
Managers 30 111 141 2 12 14 155
Professionals, associated professionals and technicians
276 569 845 21 28 49 894
Clerical support workers, service and sales workers
62 50 112 6 6 12 124
Skilled agricultural, forestry and fishery workers, craft and related trades workers, plant and machinery operators, assemblers and elementary occupations
651 1 086 1 737 78 199 277 2 014
Total 1 019 1 816 2 835 107 245 352 3 187
**Preliminary
Statistics South Africa
East London Industrial Development Zone, 2016
25
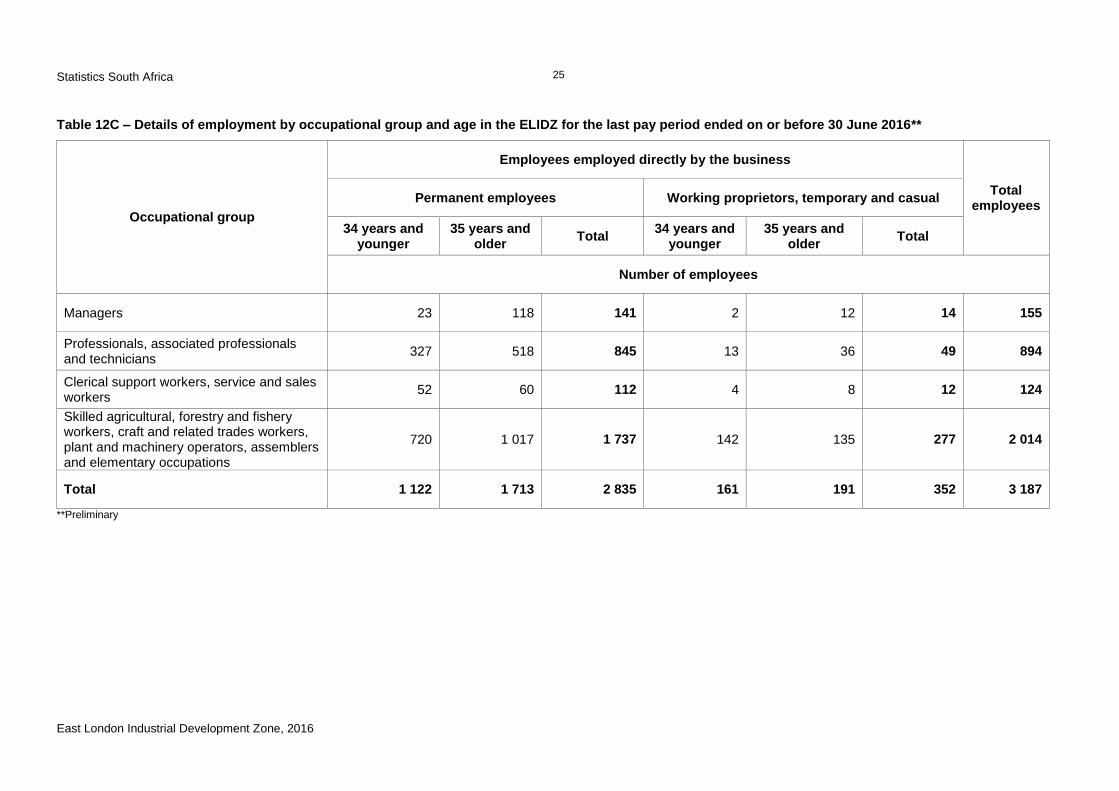
Table 12C – Details of employment by occupational group and age in the ELIDZ for the last pay period ended on or before 30 June 2016**
Occupational group
Employees employed directly by the business
Total employees
Permanent employees Working proprietors, temporary and casual
34 years and younger
35 years and older
Total 34 years and
younger 35 years and
older Total
Number of employees
Managers 23 118 141 2 12 14 155
Professionals, associated professionals and technicians
327 518 845 13 36 49 894
Clerical support workers, service and sales workers
52 60 112 4 8 12 124
Skilled agricultural, forestry and fishery workers, craft and related trades workers, plant and machinery operators, assemblers and elementary occupations
720 1 017 1 737 142 135 277 2 014
Total 1 122 1 713 2 835 161 191 352 3 187
**Preliminary
Statistics South Africa
East London Industrial Development Zone, 2016
26
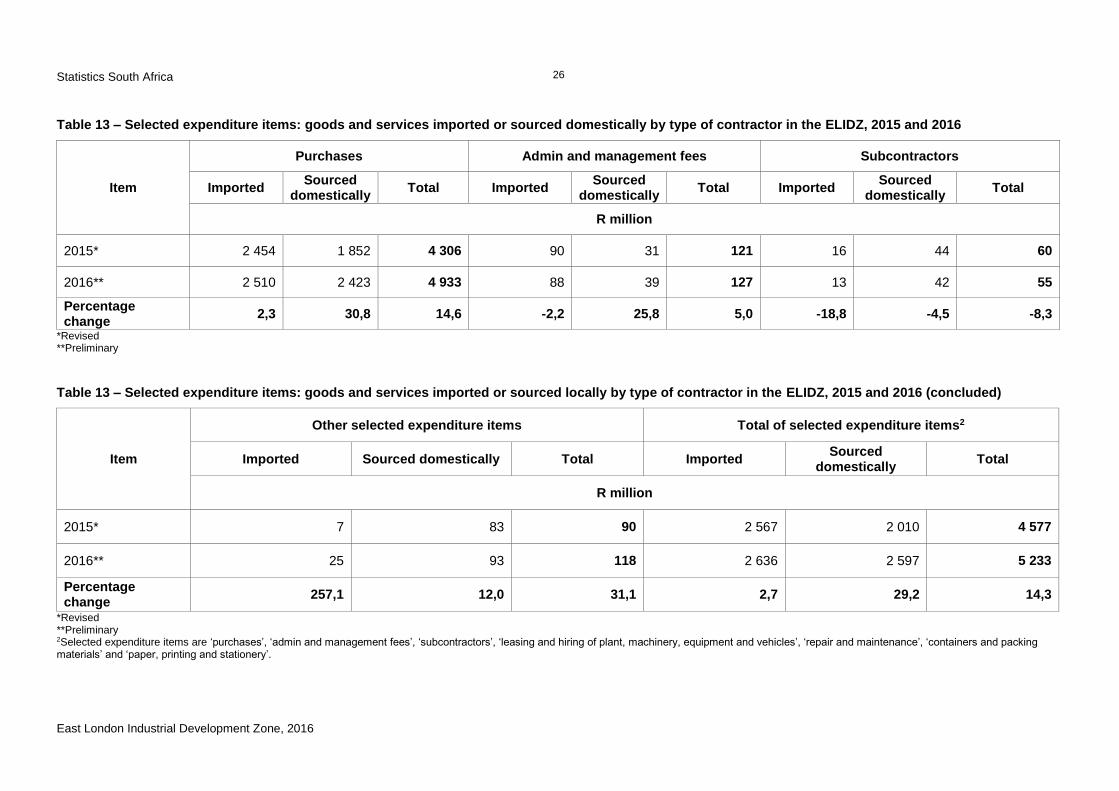
Table 13 – Selected expenditure items: goods and services imported or sourced domestically by type of contractor in the ELIDZ, 2015 and 2016
Item
Purchases Admin and management fees Subcontractors
Imported Sourced
domestically Total Imported
Sourced domestically
Total Imported Sourced
domestically Total
R million
2015* 2 454 1 852 4 306 90 31 121 16 44 60
2016** 2 510 2 423 4 933 88 39 127 13 42 55
Percentage change
2,3 30,8 14,6 -2,2 25,8 5,0 -18,8 -4,5 -8,3
*Revised **Preliminary
Table 13 – Selected expenditure items: goods and services imported or sourced locally by type of contractor in the ELIDZ, 2015 and 2016 (concluded)
Item
Other selected expenditure items Total of selected expenditure items2
Imported Sourced domestically Total Imported Sourced
domestically Total
R million
2015* 7 83 90 2 567 2 010 4 577
2016** 25 93 118 2 636 2 597 5 233
Percentage change
257,1 12,0 31,1 2,7 29,2 14,3
*Revised **Preliminary 2Selected expenditure items are ‘purchases’, ‘admin and management fees’, ‘subcontractors’, ‘leasing and hiring of plant, machinery, equipment and vehicles’, ‘repair and maintenance’, ‘containers and packing materials’ and ‘paper, printing and stationery’.
Statistics South Africa
East London Industrial Development Zone, 2016
27
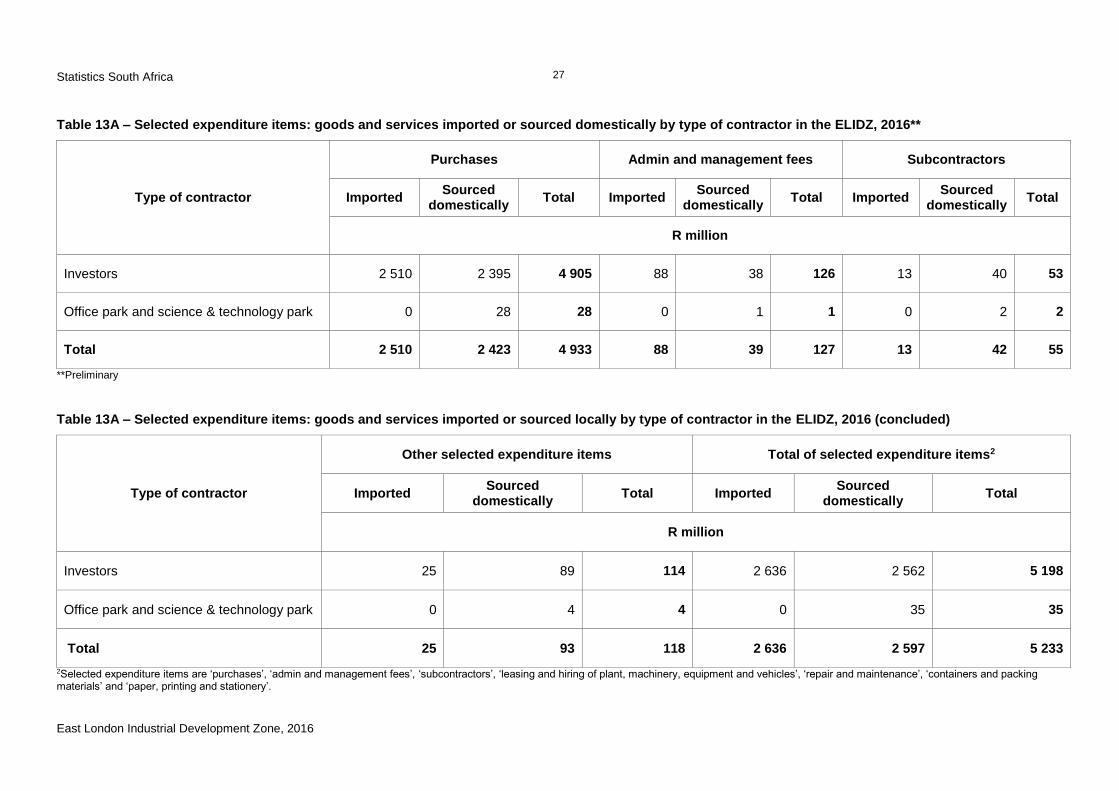
Table 13A – Selected expenditure items: goods and services imported or sourced domestically by type of contractor in the ELIDZ, 2016**
Type of contractor
Purchases Admin and management fees Subcontractors
Imported Sourced
domestically Total Imported
Sourced domestically
Total Imported Sourced
domestically Total
R million
Investors 2 510 2 395 4 905 88 38 126 13 40 53
Office park and science & technology park 0 28 28 0 1 1 0 2 2
Total 2 510 2 423 4 933 88 39 127 13 42 55
**Preliminary
Table 13A – Selected expenditure items: goods and services imported or sourced locally by type of contractor in the ELIDZ, 2016 (concluded)
Type of contractor
Other selected expenditure items Total of selected expenditure items2
Imported Sourced
domestically Total Imported
Sourced domestically
Total
R million
Investors 25 89 114 2 636 2 562 5 198
Office park and science & technology park 0 4 4 0 35 35
Total 25 93 118 2 636 2 597 5 233
2Selected expenditure items are ‘purchases’, ‘admin and management fees’, ‘subcontractors’, ‘leasing and hiring of plant, machinery, equipment and vehicles’, ‘repair and maintenance’, ‘containers and packing materials’ and ‘paper, printing and stationery’.
Statistics South Africa
East London Industrial Development Zone, 2016
28
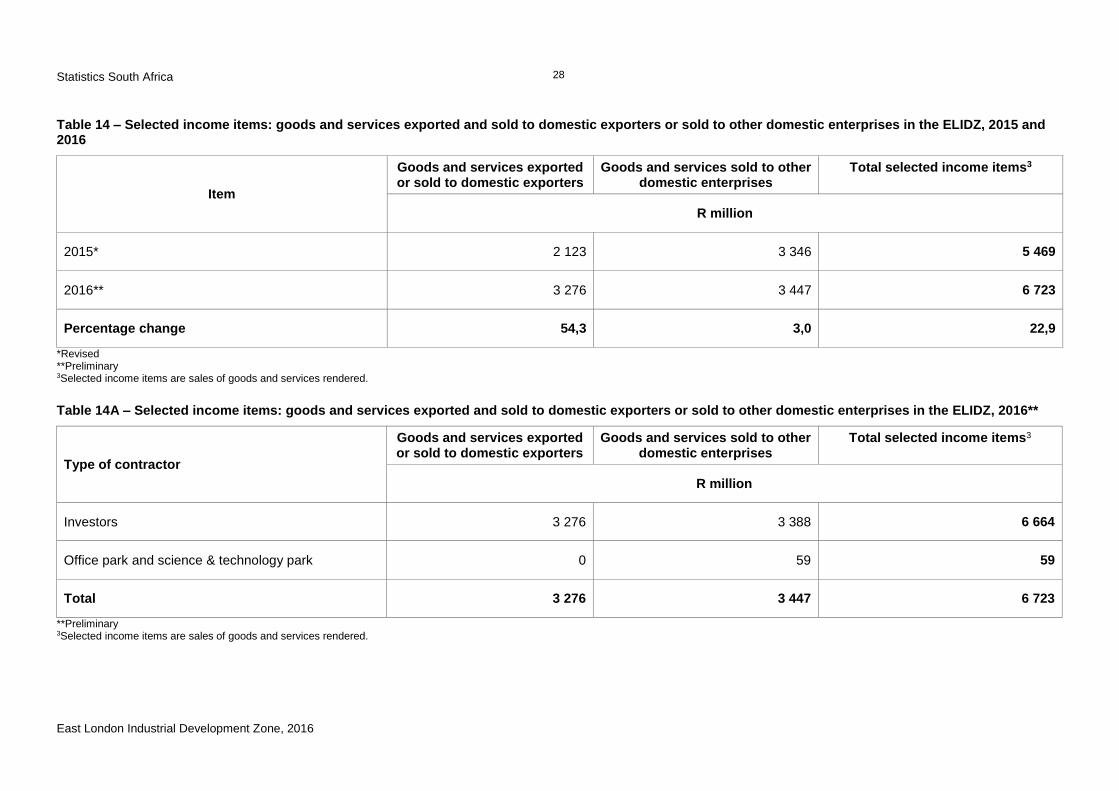
Table 14 – Selected income items: goods and services exported and sold to domestic exporters or sold to other domestic enterprises in the ELIDZ, 2015 and 2016
Item
Goods and services exported or sold to domestic exporters
Goods and services sold to other domestic enterprises
Total selected income items3
R million
2015* 2 123 3 346 5 469
2016** 3 276 3 447 6 723
Percentage change 54,3 3,0 22,9
*Revised **Preliminary 3Selected income items are sales of goods and services rendered.
Table 14A – Selected income items: goods and services exported and sold to domestic exporters or sold to other domestic enterprises in the ELIDZ, 2016**
Type of contractor
Goods and services exported or sold to domestic exporters
Goods and services sold to other domestic enterprises
Total selected income items3
R million
Investors 3 276 3 388 6 664
Office park and science & technology park 0 59 59
Total 3 276 3 447 6 723
**Preliminary 3Selected income items are sales of goods and services rendered.
Statistics South Africa
East London Industrial Development Zone, 2016
29
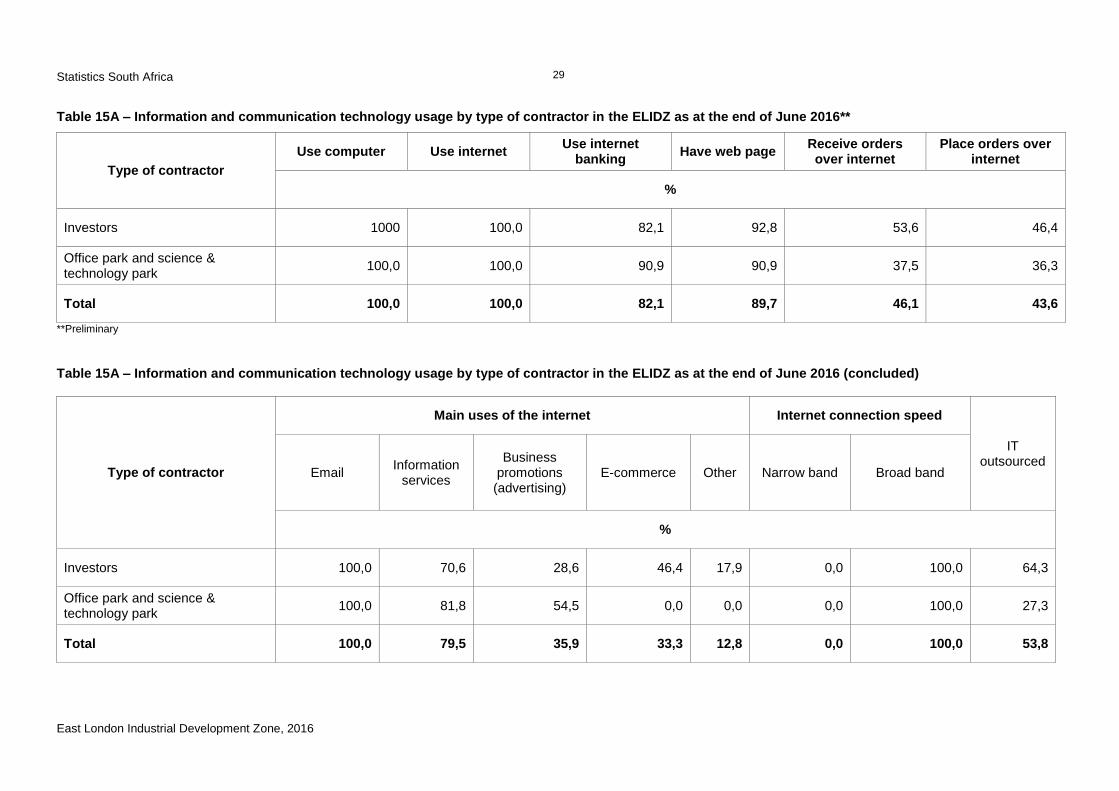
Table 15A – Information and communication technology usage by type of contractor in the ELIDZ as at the end of June 2016**
Type of contractor
Use computer Use internet Use internet
banking Have web page
Receive orders over internet
Place orders over internet
%
Investors 1000 100,0 82,1 92,8 53,6 46,4
Office park and science & technology park
100,0 100,0 90,9 90,9 37,5 36,3
Total 100,0 100,0 82,1 89,7 46,1 43,6
**Preliminary
Table 15A – Information and communication technology usage by type of contractor in the ELIDZ as at the end of June 2016 (concluded)
Type of contractor
Main uses of the internet Internet connection speed
IT outsourced
Email Information
services
Business promotions (advertising)
E-commerce Other Narrow band Broad band
%
Investors 100,0 70,6 28,6 46,4 17,9 0,0 100,0 64,3
Office park and science & technology park
100,0 81,8 54,5 0,0 0,0 0,0 100,0 27,3
Total 100,0 79,5 35,9 33,3 12,8 0,0 100,0 53,8
Statistics South Africa
East London Industrial Development Zone, 2016
30
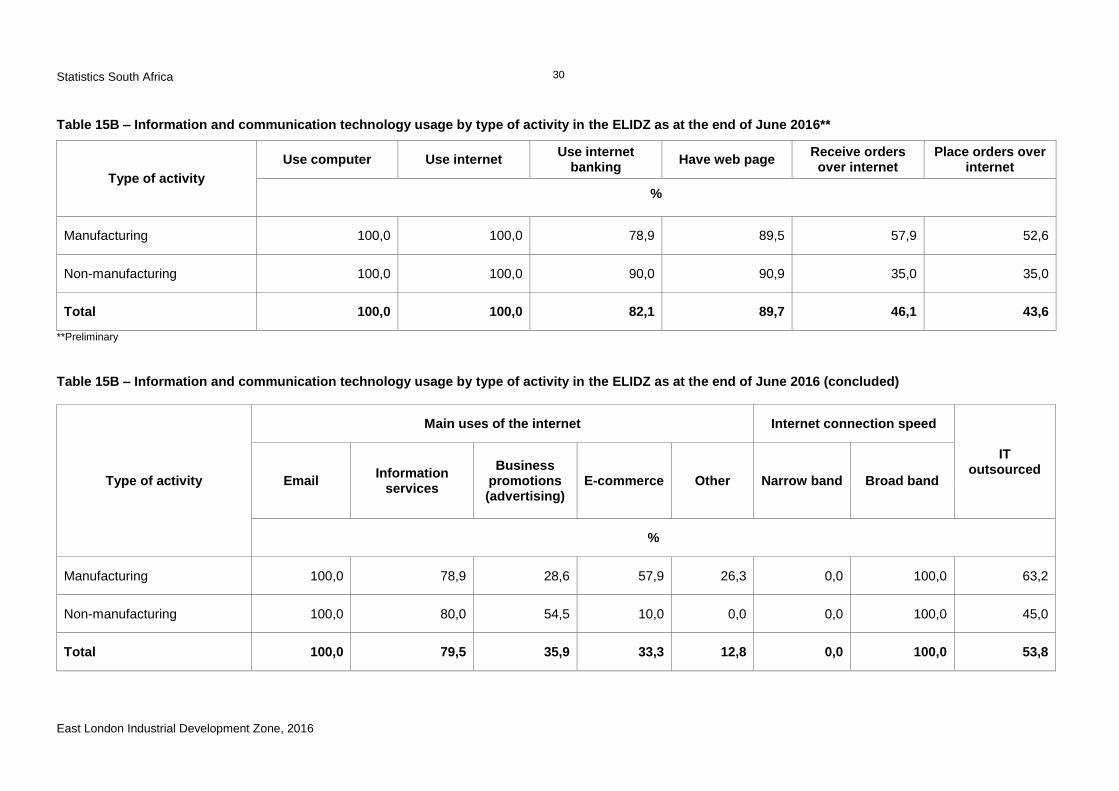
Table 15B – Information and communication technology usage by type of activity in the ELIDZ as at the end of June 2016**
Type of activity
Use computer Use internet Use internet
banking Have web page
Receive orders over internet
Place orders over internet
%
Manufacturing 100,0 100,0 78,9 89,5 57,9 52,6
Non-manufacturing 100,0 100,0 90,0 90,9 35,0 35,0
Total 100,0 100,0 82,1 89,7 46,1 43,6
**Preliminary
Table 15B – Information and communication technology usage by type of activity in the ELIDZ as at the end of June 2016 (concluded)
Type of activity
Main uses of the internet Internet connection speed
IT outsourced
Email Information
services
Business promotions (advertising)
E-commerce Other Narrow band Broad band
%
Manufacturing 100,0 78,9 28,6 57,9 26,3 0,0 100,0 63,2
Non-manufacturing 100,0 80,0 54,5 10,0 0,0 0,0 100,0 45,0
Total 100,0 79,5 35,9 33,3 12,8 0,0 100,0 53,8
Statistics South Africa
East London Industrial Development Zone, 2016
31
Explanatory notes
Background The results presented in this publication have been derived from the 2016 East London Industrial Development Zone (ELIDZ) survey which measured economic activity in the ELIDZ. This survey covers private and public businesses operating in the ELIDZ. All figures exclude VAT.
Reference period The information was collected from businesses for their financial year which ended on any date between 1 July 2015 and 30 June 2016,
according to their usual reporting schedules. Examples:
01 October 2014 to 30 September 2015
01 January 2015 to 31 December 2015
01 February 2015 to 31 January 2016
01 March 2015 to 29 February 2016
01 April 2015 to 31 March 2016
01 July 2015 to 30 June 2016
Scope and coverage
Classification by industry
This survey covers all the tenants within the East London Industrial Development Zone that were active during the period under review.
The 1993 edition of the Standard Industrial Classification of All Economic Activities (SIC). Report No. 09-09-02, was used to classify the statistical units in the survey. The SIC is based on the 1990 International Standard Industrial Classification of All Economic Activities (ISIC) with suitable adaptions for local conditions. Each enterprise is classified to an industry which reflects its predominant activity.
Survey methodology and design
The East London Industrial Development Zone survey was conducted mainly through personal visits. Of the 39 businesses that were active, 37 responded to the survey. Imputations were made for the remaining 2 businesses. The collection rate was 94,9%.
Collection rate Collection rate = ((collected + finalised investigations) / sample size) x 100.
Relative standard error Data presented in this publication are based on information obtained from a census and are, therefore, not subject to sampling variability; that is, there are no relative standard errors associated with the data.
Non-sampling errors Inaccuracies may occur because of imperfections in reporting by businesses and errors made in the collection and processing of the data.
Inaccuracies of this kind are referred to as non-sampling errors. Every effort is made to minimise non-sampling errors by careful design of questionnaires, testing them in pilot studies, editing reported data and implementing efficient operating procedures. Non-sampling errors occur in both sample surveys and censuses.
Statistics South Africa
East London Industrial Development Zone, 2016
32
Revisions to 2015 results
Revisions were made to 2015 results due to new information obtained after the publication. There were 43 active enterprises, 39 of which responded and 3 of which were imputed. The collection rate was 90,7% for 2015.
Rounding-off of figures The figures in the tables have, where necessary, been rounded off to the nearest final digit shown. There may therefore be slight
discrepancies between the sums of the constituent items and the totals shown.
Symbols and abbreviations
SIC Standard Industrial Classification of All Economic Activities ELIDZ East London Industrial Development Zone SARS South African Revenue Service SNA System of National Accounts Stats SA Statistics South Africa VAT Value added tax 0 Nil or less than half the final digit shown
Statistics South Africa
East London Industrial Development Zone, 2016
33
Glossary
Current assets Assets that are expected to be turned into cash within one year during the normal course of business. They include:
trade and other receivables;
cash and bank;
inventories; and
other current assets.
Current liabilities Debts or obligations that are due within one year. They include:
trade and other payables;
bank overdraft; and
other current liabilities.
Employees Persons employed by a business or organisation and who received payment (in salaries, wages, commission, piece rates or payments in kind) for the last pay period ended on or before 30 June 2016.
Business A legal entity or a combination of legal units that includes and directly controls all functions necessary to carry out its activities.
Equity The residual interest in the entity’s assets after deducting its liabilities.
Industry An industry consists of a group of businesses engaged in the same or similar kinds of economic activity. Industries are defined in the System of National Accounts (SNA) in the same way as in the Standard Industrial Classification of All Economic Activities, Fifth Edition, Report No. 09-90-02 of January 1993 (SIC).
Labour brokers Labour brokers are agents who recruit and administer workers on behalf of businesses. They do not provide any other service.
Net profit or loss after tax
Net profit or loss after tax is derived as: Net profit or loss before tax minus company tax
Statistics South Africa
East London Industrial Development Zone, 2016
34
Net profit or loss before tax
Net profit or loss before tax is derived as: Total income plus closing inventories minus total expenditure minus opening inventories
Non-current assets
Assets which are not easily convertible to cash or not expected to become cash within the next year. They include:
property, plant and equipment and intangible assets;
long-term investments; and
other non-current assets.
Non-current liabilities
Liabilities not due to be paid within one year during the normal course of business. They include:
long-term loans; and
other non-current liabilities.
Other expenditure Includes: Subcontractors paid; leasing and hiring of plant, machinery, equipment and vehicles under operating leases; rental of land, building and other structures; repair and maintenance; administration and management fees; amortisation; bank charges; computer expenditure; containers and packaging materials; customs duty paid; excise duty paid; insurance premiums; interest; losses on financial and other assets: disposal of assets, realisation for cash and revaluation of assets; losses on financial and other liabilities: redemption, liquidation or revaluation of liabilities; losses on foreign exchange as a result of variations in foreign exchange rates; motor vehicle running expenditure; paper, printing and stationery; postal and courier services; provisions; research and development; security services; severance, termination and redundancy payments; skills development levy (net value after refund); staff training; telecommunication services; water and electricity; donations, sponsorships and social investment for non-employees; and other expenditure.
Other income Includes:
Leasing and hiring of motor vehicles and other transport equipment under operating leases without driver/operator; leasing and hiring of plant, machinery and equipment without driver/operator; rental and leasing of land, buildings and other structures; dividends received; government subsidies and incentives; government capital transfers; interest received; profit on financial and other assets: disposal of assets, realisation for cash and revaluation of assets; profit on foreign exchange transactions as a result of variations in foreign exchange rates; provisions; customs duty received; excise duty received; and other income.
Statistics South Africa
East London Industrial Development Zone, 2016
35
Profit margin
Profit margin is derived as: Net profit or loss after tax divided by turnover multiplied by 100
Statistical unit A unit about which statistics are tabulated, compiled or published. In this survey it was all enterprises active within ELIDZ.
Turnover Turnover includes:
the value of sales;
amounts received for work done;
amounts received for services rendered;
rent and/or lease payments received for land and buildings;
rent, leasing and hiring received for machinery, vehicles and other equipment; and
mineral rights leases. Turnover excludes:
value added tax (VAT);
net profit or loss on sales or revaluation of fixed assets (including profit or loss on foreign exchange);
export freight charges;
interest received; and
excise duty.
Statistics South Africa
East London Industrial Development Zone, 2016
36
General information
Stats SA publishes approximately 300 different statistical releases each year. It is not economically viable to produce them in more than one of South Africa's eleven official languages. Since the releases are used extensively, not only locally but also by international economic and social-scientific communities, Stats SA releases are published in English only.
Stats SA has copyright on this publication. Users may apply the information as they wish, provided that they acknowledge Stats SA as the source of the basic data wherever they process, apply, utilise, publish or distribute the data; and also that they specify that the relevant application and analysis (where applicable) result from their own processing of the data.
Stats SA products
A complete set of Stats SA publications is available at the Stats SA Library and the following libraries: National Library of South Africa, Pretoria Division Eastern Cape Library Services, King William’s Town National Library of South Africa, Cape Town Division Central Regional Library, Polokwane Natal Society Library, Pietermaritzburg Central Reference Library, Mbombela Library of Parliament, Cape Town Central Reference Collection, Kimberley Bloemfontein Public Library Central Reference Library, Mmabatho Johannesburg Public Library
Stats SA also provides a subscription service.
Electronic services
A large range of data is available via online services, diskette and computer printouts. For more details about our electronic data services, contact: (012) 310 8600/8390/8351/4892/8496/8095. You can visit us on the Internet at: www.statssa.gov.za
Enquiries
Telephone number: (012) 310 8600 (user information services) (012) 310 2971 (technical enquiries) (012) 310 8044 (orders/subscription services) (012) 310 8490 (library) Fax number: (012) 310 8623 (technical enquiries) Email address: [email protected] / [email protected] (technical enquiries) [email protected] (user information services) [email protected] (orders) Postal address: Private Bag X44, Pretoria, 0001
Produced by Stats SA