east anglia fenlands
TRANSCRIPT

East Anglia Fenlands
through Time Original 2011 presentation
Cambridge UniversityArchaeology Department
Fenlands Research Committee

Introduction
• Darby (1969, 1974) describes the economic geography of East Anglia from the 1087 Domesday census, and the 1327-34 and the 1640-1641 Subsidy tax assessments. The switch of wealth from the Uplands in the north and south, to the Lowlands in the centre, is illustrated through 55 map figures. Some are re-created here as thematic maps, using Ordnance Survey OpenData released this month under Creative Commons Attribution - ShareAlike 3.0 Unported (CC BY-SA 3.0) as detailed below.
• NOTICES: Contains data © Crown copyright and database rights 2010, 2013 Ordnance SurveyBoundary Line data quality assured using 1SpatialCloud Online Validation ServiceReproduced with the permission of the British Geological Survey (BGS) ©NERC. All rights Reserved

Premise
• Ordnance Survey released County & Parish Boundary Line data• HC Darby documented Fenlands economic history 1087 - 1877• 35 out of 55 figures in two books were used• Parishes taken as constant since Domesday Census• Attribute data added from figures to Parish shape files• Classification rationalised and harmonised for correlation• Created thematic maps that can be stepped through time• Overlaid scanned and web maps of surficial geology

Classification
Subs idy year 1327 1332
assessmt. "20th" "15th"
cri teria 1/20 1/15 /1000 acre /500 acre
Darby 15 20 30 15
class ifi cn. 30 40 60 30
values 45 60 90 45
original 15 20
derived 23 30
used 38 50
Class ifi cation Subs idyDomesday SurfGeol R G B Bowring
0 0 155 155 155 = 0
1 1 0 0 255 0 - 10
3 2 155 0 255 10 - 25
4 3 255 0 255 25 - 50
6 4 255 0 0 > 50
1641

East Anglia agriculture wealth distribution
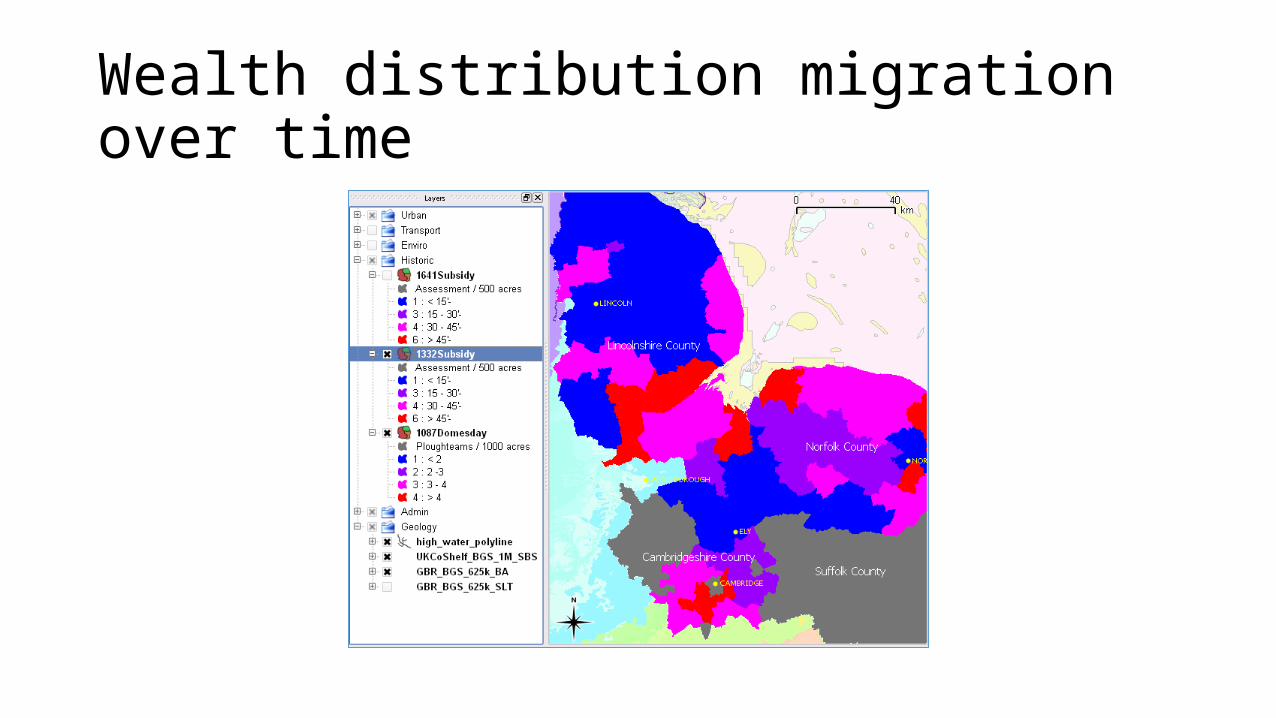
Wealth distribution migration over time

Restricted datasets over time

Correlate lay subsidy (L) & land cover (R)

Land cover attributed from map figure

Land cover from scanned figure (BGS origin)
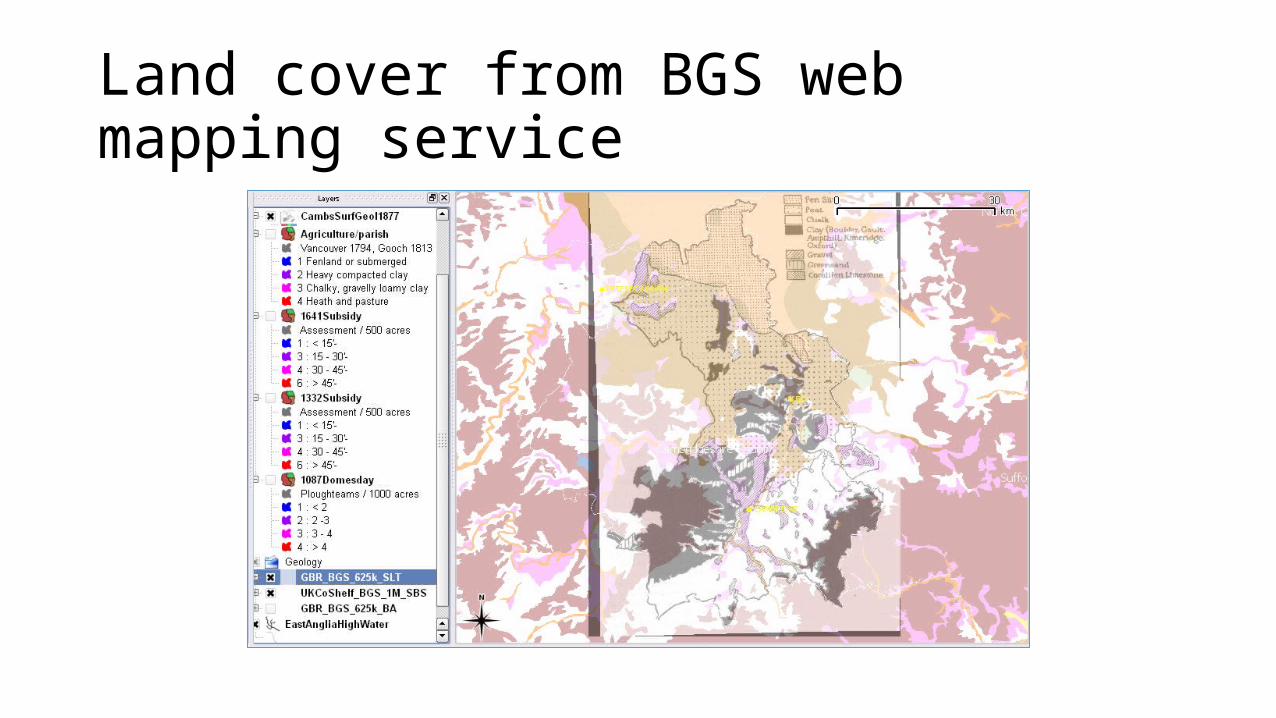
Land cover from BGS web mapping service

Posters


