east anglia one north and east anglia two offshore windfarms
TRANSCRIPT

East Anglia ONE North and East Anglia TWO Offshore Windfarms
Applicant’s Comments on Relevant Representations
Appendix 7 Offshore Windfarm Visibility and Visual Impact Threshold Distances (2012) Journal Article
Applicant: East Anglia TWO Limited Document Reference: ExA.RRA7.D0.V1 SPR Reference: EA1N_EA2-DWF-ENV-REP-IBR-000971_007
Date: 11th June 2020 Revision: Version 01 Author: Royal HaskoningDHV
Applicable to East Anglia ONE North and East Anglia TWO

2
Wind Turbine Visibility and Visual Impact Threshold Distances in Western Landscapes
Robert G. Sullivan Program Manager/Coordinator
Environmental Science Division Argonne National Laboratory
Argonne, IL (p)630-252-6182 (f)630-252-6090 [email protected]
Leslie B. Kirchler
Landscape Specialist Environmental Science Division
Argonne National Laboratory Argonne, IL
Tom Lahti
State Landscape Architect (retired) Wyoming State Office
U.S. Department of the Interior, Bureau of Land Management Cheyenne, WY
Sherry Roché
NLCS Wilderness Program Lead Visual Resource Program Lead
Wyoming State Office U.S. Department of the Interior, Bureau of Land Management
Cheyenne, WY
Kevin Beckman Programmer Analyst
Environmental Science Division Argonne National Laboratory
Argonne, IL
Brian Cantwell Senior GIS Programmer/Analyst Environmental Science Division
Argonne National Laboratory Argonne, IL
Pamela Richmond
Programmer/Analyst Environmental Science Division
Argonne National Laboratory Argonne, IL

3
Acknowledgments
Argonne National Laboratory's work was supported by the United States Department of the Interior Bureau of Land Management under interagency agreement, through U.S. Department of Energy contract DEAC02-06CH11357.

4
Wind Turbine Visibility and Visual Impact Threshold Distances in Western Landscapes
Abstract
The siting of wind facilities to minimize visual impacts to high-value scenic resources presents a major challenge for land management agencies in the western United States. The visibility and potential visual contrasts associated with utility-scale wind facilities are dependent on complex interactions of a variety of factors, but little systematic study of visibility in real landscape settings has been conducted.
In a study sponsored by the United States Department of the Interior Bureau of Land Management, 377 observations of five wind facilities in Wyoming and Colorado were made under various lighting and weather conditions. The facilities were found to be visible to the unaided eye at >58 km (36 mi) under optimal viewing conditions, with turbine blade movement often visible at 39 km (24 mi).
Under favorable viewing conditions, the wind facilities were judged to be major foci of visual attention at up to 19 km (12 mi) and likely to be noticed by casual observers at >37 km (23 mi). A conservative interpretation suggests that for such facilities, an appropriate radius for visual impact analyses would be 48 km (30 mi), that the facilities would be unlikely to be missed by casual observers at up to 32 km (20 mi), and that the facilities could be major sources of visual contrast at up to 16 km (10 mi).
Results will be stored in a Web-enabled database.

5
This page intentionally left blank.
6
I. Introduction
The advent of utility-scale wind energy is having a profound impact on scenic resources in the United States and elsewhere. While there is strong public support for renewable energy, and many individuals have favorable opinions about the aesthetics of wind energy facilities, utility-scale wind energy facilities have engendered significant levels of public opposition in some settings. Utility-scale wind facilities may cover tens of thousands of acres, and the individual wind turbine generators are very large structures incorporating visually conspicuous, reflective surfaces and obviously non-natural geometry that contrasts strongly with natural landscapes. As a result, in some settings, utility-scale renewable-energy facilities may be visible for long distances. Concerns regarding the visual impacts of utility-scale wind energy facilities have emerged as major factors in the delay or cancellation of planned facilities.
The United States Department of the Interior Bureau of Land Management (BLM) faces increasing interest in the use of BLM-administered public lands for renewable-energy development and continues to conduct studies necessary to evaluate and process an expanding number of applications for rights-of-way for renewable-energy projects. The BLM must ensure that proposed projects meet all applicable environmental laws and regulations, and several programmatic environmental impact statements (EISs) pertaining to the authorization of wind, solar, and geothermal energy projects on BLM-administered lands have been completed since 2005 to satisfy the requirements of the National Environmental Policy Act. The programmatic EISs determined that potential visual impacts resulting from renewable energy developments on BLM-administered lands are an important concern. BLM’s Instruction Memorandum No. 2009-043, “Wind Energy Development Policy,” (BLM, 2008) emphasizes the importance of careful project siting and defensible analyses that facilitate renewable-energy development while protecting visual-resource values on BLM-administered public lands.
The BLM requires that visual design considerations be incorporated into all surface-disturbing activities, including the siting of renewable-energy developments. Optimal siting to reduce potential visual impacts requires an accurate understanding of the visual characteristics of the different types of energy facilities, including their visibility under the different lighting conditions that occur at proposed project locations. Lighting conditions at a given location vary by season, time of day, sun direction and angle above the horizon, and atmospheric factors, including the presence or absence of clouds and the level of haze, which varies by region and by time of day. Furthermore, defensible siting of renewable-energy development projects requires an understanding of how the nature and magnitude of potential visual impacts vary with distance, as it is well established that distance is a key variable that determines the magnitude of potential visual impacts from a proposed development (Bishop and Miller, 2007; Hull and Bishop, 1988). In many situations, especially in the open landscapes of the western U.S., siting wind energy facilities farther away from highly valued landscapes and visual resource areas to preserve existing visual integrity and scenic vistas may be the single most effective means for reducing or avoiding those impacts.
In order to address scenic resources, the BLM employs the Visual Resource Management (VRM) system (BLM, 1984). This system provides a means of systematically describing and

7
evaluating potential impacts on the visual integrity and scenic qualities of affected landscapes. It defines a visual impact as the contrast that observers perceive between an existing landscape and a proposed project or activity (BLM, 1986a). The VRM Class Objectives are determined through the BLM’s land use planning process. These management classes guide the BLM on the appropriate level of landscape contrast allowed on public lands. The VRM process begins with the Visual Resource Inventory (VRI), which documents the scenic quality, sensitivity, and relationship of distance (BLM, 1986b). Then, through the land use planning process, other management issues are considered; adjustments to VRM classes may be made to resolve resource allocation conflicts.
The VRM system specifies three distance zones: “foreground-middleground” (0 to 3-5 mi), “background” (3-5 to 15 mi), and “seldom seen” (beyond 15 mi). BLM’s VRI Manual 8410-1 (BLM, 1986b) indicates that these zone boundaries are tied to landscape characteristics, such as “the point where the texture and form of individual plants are no longer apparent in the landscape” (for the foreground-middleground zone), that are associated with potential impact levels. The foreground-middleground zone is described as the distance zone “where management activities might be viewed in detail” and where “changes are more noticeable and are more likely to trigger public concern,” with similar boundary designations/descriptions for the other zones. The VRI manual asserts that the VRM distance zones are important to VRI sensitivity analyses that measure the public’s concern for the visual qualities of an area, and provide data used during the land use planning process.
While the VRM distance zones specified by the BLM may be adequate for impact assessments involving the range of activities and surface-disturbing actions that have historically occurred on BLM-administered lands, utility-scale development of renewable energy, such as wind and solar energy, involves facilities that are arguably larger in scope and size than those for which the standard VRM distance zones were developed. Utility-scale wind energy developments may cover thousands of acres, and the height of utility-scale wind turbines may exceed 400 ft, with dozens or hundreds of widely spaced wind turbines per facility. The enormous height of the wind turbines and the size of large arrays can make them visible for very long distances, particularly in the western United States, where atmospheric conditions in some locations and under some circumstances lead to extended visibility. Potentially strong color contrast and blade motion can also attract views and increase long-distance visibility.
At any given distance, a utility-scale wind development would occupy a much larger portion of an observer’s field of view than smaller-scale developments (such as oil and gas wells), with proportionally larger visual impacts; the distance at which a particular level of impact is experienced (the impact threshold distance) would also be greater. This suggests that the use of the standard distance zones from BLM’s VRM System to determine impacts from large-scale renewable-energy facilities may lead to an underestimation of potential impacts and inappropriate distances for visual impact analyses.
Limited research has been conducted to determine the maximum distance of the visibility of wind turbines or the appropriate distance zones for impact thresholds. While previous studies provide valuable information about factors that serve to determine impact thresholds, their applicability for BLM is limited in that the facilities examined were in areas where average
8
atmospheric conditions are poorer with respect to extended visibility than on most BLM-administered lands in the western United States, and, because of the age of the studies, the wind turbines examined were much smaller than those that are in current use or planned for siting on BLM-administered lands.
The field study discussed in this paper used trained observers to systematically evaluate visibility and visual impact threshold distances for modern utility-scale wind energy facilities on lands in the western United States. The study examined the visual effects associated with several facilities in a variety of seasonal, weather, and lighting conditions. The purpose of the study was to improve the BLM’s professional understanding of the effect of distance and other variables on the visual impact of wind energy developments. The study also established threshold distances for use in conducting visual impact assessments.
The study consisted of three main phases:
1) Maximum wind turbine visibility determination: In this phase, trained observers determined the maximum distances at which utility-scale wind turbines in existing commercial wind facilities could be seen under favorable viewing conditions in both daytime and nighttime views.
2) Impact threshold distance determination: In this phase, trained observers judged the degree of visibility of utility-scale wind turbines in existing commercial wind facilities under a variety of weather and lighting conditions at distances ranging from 0.8 km (0.5 mi) to beyond 58 km (36 mi), and photographed them.
3) Photographic catalogue compilation: In this phase, photos from Phase 2 that illustrated the range of distances and lighting conditions for the Phase 2 impact threshold analysis were selected for inclusion in a Web-based digital photographic catalogue. The catalogue has controls to select photos by facility, distance from facility, date, time of day, weather and lighting conditions, and other parameters.
This paper is devoted primarily to discussion of the Phase 1 and Phase 2 results.
II. Literature Review
Published literature discussing the maximum distance over which wind turbines can be seen is limited, with most studies generated outside of the United States. One of the first published analyses of the impact of distance on turbine visibility was conducted for the environmental statement for the Penrhyddlan and Llidartywaun facilities in Wales (European Commission, 1995). These wind energy facilities (managed as one site) were installed in the early 1990s. The authors suggested that at 20 km (12.4 mi) from all turbines, the turbines would appear invisible

9
to the naked eye in conditions of very good visibility. The turbines at both facilities consisted of Mitsubishi MWT 250s with tower heights of 30 m (98 ft) and rotor diameters of 28 m (92 ft). From a visual assessment undertaken at 22 locations around the 103-turbine site, 20 km (12.4 mi) was determined as the limit of visibility (European Commission, 1995). Owing to the size of this wind energy development and its early development, this distance became a general standard for measuring the visibility of turbines and determining their relative impact.
In 1996, Gareth Thomas, a planning officer in Montgomeryshire, Wales, attempted to define the potential visual impacts of wind turbines using descriptors, which could be assessed in the field and could be repeated with constant observations. His analysis was based on observations of the Cemaes and Llandinam wind energy facilities located in Wales. Thomas’s approach assumed good visibility. As a result of his initial evaluations, Thomas concluded that a distance of 15 km (9.3 mi) was appropriate for evaluating the visibility of the wind energy facilities (Campaign for the Protection of Rural Wales, 1999).
Using the information from his observations of the two wind energy facilities, Thomas developed a matrix that incorporated nine bands of visual impacts ranging from “dominant” to “negligible.” The matrix accounted for turbine hub heights of approximately 25–31 m (82–102 ft) and overall heights of 41–45 m (135–148 ft) (Campaign for the Protection of Rural Wales, 1999). The resulting “Thomas Matrix” is reproduced in Table 1.
To further test the usability of the Thomas Matrix, Geoffrey Sinclair of Environment Information Services conducted an additional analysis using the same turbine heights as Thomas. Sinclair generally agreed with the results initially found by Thomas, with some modifications to the distances in which impacts were experienced. These modifications resulted in the distances associated with the “revised” Thomas Matrix (shown in Table 1 as the column labeled “Revised”). Further investigations at additional wind energy facilities then provided for more revisions to the original matrix in order to account for larger wind turbines. These revisions led to the development of the Sinclair-Thomas Matrix (Campaign for the Protection of Rural Wales, 1999), also shown in Table 1.
Table 1. Thomas Matrix and Sinclair-Thomas Matrix of Potential Visual Impacts of Wind Turbines
Descriptors
Thomas Matrix Sinclair-Thomas Matrix
Overall height of turbines
41–45 m (134.5–147.6 ft)
52–55 m (170.6–180.4 ft)
70 m (229.7
ft)
95 m
(311.7 ft)** (projected)
Original Revised
Band Approximate Distance Range
Dominant impact A 0–2 km 0–2 km (0 0–2.5 km 0–3 km 0–4 km (0–

10
due to large scale, movement, proximity, and number
(0–1.2 mi)
–1.2 mi) (0–1.6 mi)
(0–1.9 mi)
2.5 mi)
Major impact due to proximity; capable of dominating landscape
B 2–3 km (1.2–1.9 mi)
2–4 km (1.2–2.5 mi)
2.5–5 km (1.6–3.1 mi)
3–6 km (1.9–3.7 mi)
4–7.5 km (2.5–4.7 mi)
Clearly visible with moderate impact; potentially intrusive
C 3–4 km (1.9–2.5 mi)
4–6 km (2.5–3.7 mi)
5–8 km (3.1–5.0 mi)
6–10 km (3.7–6.2 mi)
7.5–12 km (4.7–7.5 mi)
Clearly visible with moderate impact; becoming less distinct
D 4–6 km (2.5–3.7 mi)
6–9 km (3.7–5.6 mi)
8–11 km (5.0–8.1 mi)
10–14 km (6.2–8.7 mi)
12–17 km (7.5–10.6 mi)
Less distinct; size is reduced, but movement still is discernible
E 6–10 km (3.7–6.2 mi)
9–13 km (5.6–8.1 mi)
11–15 km (8.1–9.3 mi)
14–18 km (8.7–11.2 mi)
17–22 km (10.6–13.7 mi)
Low impact, movement noticeable in good light; becoming noticeable components in the overall landscape
F 10–12 km (6.2–7.5 mi)
13–16 km (8.1–9.9 mi)
15–19 km (9.3–11.8 mi)
19–23 km (11.8–14.3 mi)
22–27 km (13.7–16.8 mi)
Becoming indistinct with negligible impact on the wider landscape
G
12–18 km (12.5–11.2 mi)
16–21 km (9.9–13.0 mi)
19–25 km (11.8–15.5 mi)
23–30 km (14.3–18.6 mi)
27–35 km (16.8–21.7 mi)
Noticeable in good light, but negligible impact
H
18–20 km (11.2 – 12.4 mi)
21–25 km (13.0–15.5 mi)
25–30 km (15.5–18.6 mi)
30–35 km (18.6–21.7 mi)
35–40 km (21.7–24.9 mi)
Negligible or no impact
I 20 km (12.4 mi)
25 km (15.5 mi)
30 km (18.6 mi)
35 km (21.7 mi)
40 km (24.9 mi)
Suggested radius for zone of visual impact analysis
15 km (9.3 mi)
18 km (11.2 mi)
20 km (12.4 mi)
25 km (15.5 mi)
30 km (18.6 mi)
Source: Campaign for the Protection of Rural Wales, 1999.
11
Subsequent evaluations of the visual impact of wind energy facilities often utilized standard guidelines, building from these early studies for reference, in determining the largest distance at which a wind turbine was visible. One such standard includes a division of the landscape into three areas—a distant area (a radius of over 10 km/6.2 mi), an intermediate area (a radius of 1km/0.62 mi to 10km/6.2 mi), and an immediate area (a radius of less than 1km/0.62 mi). Within the distant area, wind turbines would be visible, but the nearest objects generally would dominate perception. However, within an “empty” landscape, the wind turbines could become the visual focus of observers. In the intermediate area, wind turbines would dominate the space because of their height and their movement. In the immediate area, wind turbines would be extremely dominant because of their size and the rotational movement of the blades (Jallouli and Moreau, 2009; University of Newcastle, 2002).
Planning Advice Notice 45, issued by the Scottish Government but revoked in 2011, 1 provided generic categories of visibility and visual impact in relation to distance. These categories suggested that in an open landscape, at distances up to 2 km (1.2 mi), a wind energy facility would be a prominent feature; between 2 and 5 km (1.2 and 3.1 mi), it would be relatively prominent; and between 5 and 15 km (3.1 and 9.3 mi), it would be prominent only in clear visibility when the turbines were seen as part of the wider landscape. Beyond 15 km (9.3 mi), the wind energy facility would be seen only in very clear visibility, and the turbines would be viewed as a minor part of the landscape (SNH, 2009).
The impact of visual thresholds (e.g., “minimal quantity that can be perceived; a boundary one crosses from not detecting to detecting”) was further tested using computer-simulated images (Shang and Bishop, 2000). Shang and Bishop developed a systematic procedure for the assessment of three visual thresholds, including detection (i.e., is it visible?), recognition (i.e., can the object be identified?), and visual impact (i.e., what effect does the object have?). Their study was based upon concepts found within the field of psychophysics, in which the visual threshold is the minimal quantity that can be perceived. The thresholds were analyzed through controlled slide-viewing using computer-simulated images with modified visual attributes, such as size, contrast, object type, and landscape type. While the study did not specifically address distance thresholds, the authors provided a basis for understanding the impact of contrast on an object’s visibility. Contrast for this study was defined as a measurement of target luminance relative to the background luminance (Shang and Bishop, 2000).
In the Shang and Bishop study (2000), participants were told to compare pairs of black and white slides projected side by side for 30 sec. Then, the participants were asked if they could find any differences between the two photographs and if they recognized the difference. The study accounted for some participant “guessing.” Shang and Bishop (2000) found that contrast-weighted visual size (magnitude) was a key predictor variable for visual detection, recognition, and visual-impact assessment.
1 PAN 45 has recently been revoked; it was originally published in 2002. The 2011 update does not specifically address a distance to which visibility studies should be analyzed; instead, the authors state the following: “In considering wind farm visibility it should be noted that in some locations and clear weather, turbines may be visible over long distances, though this will depend on elevation, the angle of the sun and other factors. It is important to emphasize, however, that visibility and distance do not follow a linear relationship” (Scottish Government, 2011).

12
In response to a growing trend toward larger turbine heights and rotor diameters, various government agencies within the United Kingdom wanted to determine the potential visual impacts of wind turbines out to 30 km (18.6 mi), an expansion beyond many of the recognized guidelines. In response, Ian D. Bishop of the University of Melbourne questioned whether a United Kingdom government agency was reasonable in requesting an evaluation of a proposed wind energy facility by estimating its visibility out to a distance of 30 km (18.6 mi). Beginning with this question, Bishop (2002) first considered the estimation of size through evaluating rotating turbines in comparison with the perception of a solid object of similar overall dimensions. Three aspects of the visual dimensions of wind turbines were evaluated: the total area covered by the tower and the rotor arms as they rotated; the area covered by the tower and arms at rest; and the area of the tower alone.
Using a web-based tool, Bishop (2002) surveyed people to determine the perceived sizes of a rotating turbine and an expanding tower. The turbine used in this survey then became the introduced landscape element in further evaluations, which included consideration of contrast, atmospheric effects, and color. Bishop’s evaluation showed that visibility modeling out to 20–30 km (12.4–18.6 miles) was justified, but that effects beyond 20 km (12.4 miles) may be rare.
The Highland Council in the United Kingdom adopted a distance of 35 km (22 mi) as a standard for evaluating the impacts of wind turbines. In a summary report, Miller et al. (2010) determined that the boundary for analysis should extend to this distance in order to account for the theoretical viewing distance, as well as previous environmental studies. The authors, however, placed a greater weight on closer distances when evaluating visual sensitivity. They described a “distance decay” phenomenon, in which viewers have a reduced capability to identify and recognize features as the distance between the viewed object and the viewer increases (Miller et al., 2010).
Vissering (2011) presented a brief synopsis of the distance thresholds typically used to evaluate wind turbines within the United States. Vissering suggested that modern wind projects using 2.0-MW or larger turbines are easily visible within 24.1–32.2 km (15–20 mi) under clear weather conditions, but that large visual impacts typically would occur within a shorter distance. Vissering suggests that in the Northeast, for example, the distance where large visual impacts typically would occur may be between five and eight miles, and suggests that ten miles thus would provide a good guideline for analysis in this part of the country. On the basis of input from the authors of the present study, Vissering suggested a distance of 40.2 km (25 mi) as likely more appropriate for the Midwest and the West, where open terrain, dry air, and larger wind projects are found.
Additional research has been conducted to determine the influence of wind turbine blade movement in conjunction with distance. In general, the human eye can detect movement at large distances. The rotary and very regular movement of wind turbine blades is not a common type of “natural” movement, especially at the scale of a large wind facility. Instead, this type of movement has been found to be highly noticeable, and Coates Associates (2007) suggested that it may enhance the visibility of wind facilities within the landscape. Some studies of onshore wind energy facilities, for instance, have suggested that motion can extend the viewshed of wind turbines to beyond 8 km (5 mi) (Tsoutsos et al., 2007) and up to 17 km (11 mi) in clear

13
weather, or when conditions of strong contrast between the rotors and the sky are present (University of Newcastle, 2002). At times, the blades may not be visible, but a slight “pulse” in the intensity of light can be seen as the blade passes across the wind turbine tower (Coates Associates, 2007).
14
III. Methodology
The methodology for this study consisted of a combination of field-based observations of wind turbines and geospatial analyses that were used to determine the visual characteristics of wind turbines viewed at various distances, along with the maximum limits of visibility of the wind turbines under a variety of lighting and atmospheric conditions. The study primarily involved making on-site observations of the visual characteristics of the wind turbines from locations within the various wind energy facilities’ viewsheds.
The on-site fieldwork for this study was conducted in four field work exercises totaling 19 days with observations in March, July, and October of 2011, with additional brief observations conducted in January 2011. The January 2011 fieldwork primarily consisted of determining the maximum limits of visibility, while the remainder of the fieldwork consisted of establishing visual impact threshold distances and developing a catalogue of photographs of wind facilities, as well as evaluating the maximum limit of visibility. Participants included Argonne National Laboratory (Argonne), BLM, National Park Service, and Wyoming State Historic Preservation Office employees. The backgrounds of the participants varied, including, but not limited to, landscape architects, archaeologists, recreational and land use planners, and air resource specialists. Most of the observations were made by two to four observers per observation.
The primary wind energy facilities analyzed in this study included the following:
Cedar Creek I Wind Farm: Cedar Creek I Wind Farm (hereafter referred to as “Cedar Creek”) is owned and operated by Babcock & Brown/BP America and is located on Chalk Bluff in far northeastern Colorado, about 10.3 km (6.4 mi) east of Grover, Colorado, and about 24 km (15 mi) south of Pine Bluffs, Wyoming. The facility was built in 2007 and was the largest operating wind energy facility in Colorado at the time of its construction (Apex Wind Energy, 2011). The total generating capacity for Cedar Creek is 300.5 MW.
The Cedar Creek I wind energy facility consists of 274 wind turbines, including 53 General Electric 1.5-MW Model SLE wind turbines with hub heights of 77 m (253 ft) and blade tip heights of 119 m (390 ft), and 221 Mitsubishi 1.0-MW Model MWT1000a wind turbines with hub heights of 61.4 m (201.4 ft) and blade tip heights of 90.7 m (297.6 ft).
The wind turbines are scattered across the mesa, east of the bluffs, in an irregular polygon measuring roughly 18 km (11 mi) east-west and 16 km (10 mi) north-south. Wind turbine pad elevations range from approximately 1,650–1,680 m (5,400–5,500 ft) at the northwestern and western edges of the facility along the bluffs to about 1,580 m (5,200 ft) at the southeastern corner of the facility. In the vicinity of the facility, the ground slopes gently downward to the southeast.
Seven Mile Hill Wind Farms: The Seven Mile Hill Wind Farms (hereafter referred to as “Seven Mile”) are located in Carbon County, Wyoming, between Hanna and Medicine Bow. The wind energy facilities consist of 79 General Electric 1.5-MW Model SLE

15
turbines, built in two phases (66 in the Seven Mile Hill phase and 13 in the Seven Mile Hill II phase).
These turbines have rotor diameters of 77 m (252 ft) and tower hub heights of 80 m (262 ft). The blade tip heights are approximately 117.0 m (383 ft) for a typical turbine of this model (GE, 2011). The wind energy facility has a generating capacity of 99 MW for the first phase and 19.5 MW for the second. For this study, they are treated as one wind energy facility. Seven Mile is owned by Rocky Mountain Power (Rocky Mountain Power, 2010b).
Dunlap Ranch Wind Energy Project: The Dunlap Ranch Wind Energy Project (hereafter referred to as “Dunlap”) is located in Carbon County, Wyoming, near Medicine Bow. The first phase of this wind energy facility consists of 74 General Electric 1.5-MW Model SLE turbines, with a generating capacity of 111 MW. These models consist of structures with tower hub heights of 80 m (262 ft) and rotor diameters of 77 m (253 ft). The blade tip heights are approximately 117.0 m (383 ft) for a typical turbine of this model (GE, 2011). The facility is owned by Rocky Mountain Power and has been in operation since October 2010 (Rocky Mountain Power, 2010a and 2010b).
Two additional facilities, the Happy Jack and Silver Sage Wind Farms, were included in the January 2011 fieldwork for the maximum visibility distance assessment. These wind farms are located in Laramie County, west of Cheyenne, Wyoming. They are located immediately adjacent to each other and use the same turbine models. They were considered as one unit, owing to their proximity. They began service in 2008 and 2009, respectively. Both wind farms are owned by Duke Energy (Cheyenne Light, Fuel, and Power, 2011).
The combined wind farms occupy an irregular polygon measuring roughly 4.5 km (2.8 mi) east-west and 2.9 km (1.8 mi) north-south. The 34 wind turbines (14 at Happy Jack and 20 at Silver Sage) are Suzlon 2.1-MW Model S88/2100 wind turbines, with hub heights of 88 m (289 ft) and blade tip heights of 123 m (404 ft).
During the impact threshold distance assessment field trips of March, July, and October 2011, a total of 377 daytime observations were made from 122 locations (referred to as study observation points [SOPs]); 14 additional observations were made at night. Of these, 244 observations (64 percent) were of Cedar Creek; 98 observations (26 percent) were of Seven Mile; 28 observations (eight percent) were of Dunlap; and seven observations (two percent) were of other wind energy facilities.
For each observation, single-frame photographs were taken at a variety of focal lengths; at some locations, short videos were also recorded to capture the motion of the turning blades. For many locations, panoramic sequences were also taken. Data recorded included descriptions of the location of the viewpoint; weather, general lighting, and visibility conditions; and the backdrop content and color. In addition, observers collected information about the solar azimuth and elevation, the layout and height of the visible turbines, the shading and/or sunlight on the turbines, and the overall lighting angle as understood from the viewer’s position. If

16
observed, information about aviation navigation lighting was included, as well as whether blade movement or other transitory effects were noted. For nighttime observations, additional data collected included the number, type, and cycle of the aviation lighting.
Visibility assessments for the facilities were also made for 359 of the observations (95 percent) in order to assess the effects of distance and atmospheric variables on the visibility and visual contrast levels of the observed wind facilities. The visibility assessments consist of numeric ratings on a scale of 1 to 6, scored on the visibility of a wind energy facility within its landscape setting and for the weather and lighting conditions at the time of the observation. The visibility rating is a judgment made by the observer by comparing the wind energy facility in view with language described on a Visibility Rating Form that accounts for the visual characteristics of the wind facility appropriate to each rating level. Photographs were not used for visibility ratings; the ratings were conducted through naked-eye observations of the facilities in the field.
The rating scale is loosely based on the BLM’s VRM system (BLM, 1984), specifically, the Visual Contrast Rating (BLM, 1986a), which is used to predict the visual contrast of a proposed project with the surrounding natural landscape. The Visibility Rating Form was customized for use with existing, rather than proposed, facilities. The form also included several open-ended questions soliciting information from the observer to justify, explain, and/or expand upon the numeric visibility rating. The visibility ratings and instructions used by the observers to rate visibility are reproduced in Table 2.

17
Table 2. Visibility rating form instructions used to rate visibility of wind facilities.
Visibility Rating Description
VISIBILITY LEVEL 1: Visible only after extended, close viewing; otherwise invisible.
An object/phenomenon that is near the extreme limit of visibility. It could not be seen by a person who was not aware of it in advance, and looking for it. Even under those circumstances, the object can only be seen after looking at it closely for an extended period of time.
VISIBILITY LEVEL 2: Visible when scanning in general direction of study subject; otherwise likely to be missed by casual observer.
An object/phenomenon that is very small and/or faint, but when the observer is scanning the horizon or looking more closely at an area, can be detected without extended viewing. It could sometimes be noticed by a casual observer; however, most people would not notice it without some active looking.
VISIBILITY LEVEL 3: Visible after brief glance in general direction of study subject and unlikely to be missed by casual observer.
An object/phenomenon that can be easily detected after a brief look and would be visible to most casual observers, but without sufficient size or contrast to compete with major landscape elements.
VISIBILITY LEVEL 4: Plainly visible, could not be missed by casual observer, but does not strongly attract visual attention, or dominate view because of apparent size, for views in general direction of study subject.
An object/phenomenon that is obvious and with sufficient size or contrast to compete with other landscape elements, but with insufficient visual contrast to strongly attract visual attention and insufficient size to occupy most of the observer’s visual field.
VISIBILITY LEVEL 5: Strongly attracts visual attention of views in general direction of study subject. Attention may be drawn by strong contrast in form, line, color, or texture, luminance, or motion.
An object/phenomenon that is not of large size, but that contrasts with the surrounding landscape elements so strongly that it is a major focus of visual attention, drawing viewer attention immediately, and tending to hold viewer attention. In addition to strong contrasts in form, line, color, and texture, bright light sources (such as lighting and reflections) and moving objects associated with the study subject may contribute substantially to drawing viewer attention. The visual prominence of the study subject interferes noticeably with views of nearby landscape elements.
VISIBILITY LEVEL 6: Dominates view because study subject fills most of visual field for views in its general direction. Strong contrasts in form, line, color, texture, luminance, or motion may contribute to view dominance.
An object/phenomenon with strong visual contrasts that is of such large size that it occupies most of the visual field, and views of it cannot be avoided except by turning the head more than 45 degrees from a direct view of the object. The object/phenomenon is the major focus of visual attention, and its large apparent size is a major factor in its view dominance. In addition to size, contrasts in form, line, color, and texture, bright light sources and moving objects associated with the study subject may contribute substantially to drawing viewer attention. The visual prominence of the study subject detracts noticeably from views of other landscape elements.

18
Visibility ratings of “1” or “2” would generally correspond to low levels of visual contrast in the framework of the Visual Contrast Rating; ratings of “3” or “4” would correspond to moderate levels of visual contrast; and ratings of “5” or “6” would correspond to high levels of visual contrast. There is not necessarily a direct correspondence between the visibility ratings and conformance with VRM class management objectives, however, because the language used to define visibility is not identical to that used to describe conformance with VRM class management objectives in the visual contrast rating process.
New observers were trained in the field, with a brief discussion of the purpose of the form. For the first few ratings a user performed, ratings and the rationales for assigning a rating were discussed in order to insure that the instructions were clear, but raters were not told that their ratings were high or low, correct or incorrect, or otherwise coached or instructed about how to conduct visibility ratings.
Each observer completed a separate Visibility Rating Form for each observation, rating the visibility and answering the questions for each form independently without consulting the other observers. Observers could discuss their ratings after observations, but they were not allowed to change the ratings once the form was completed. Observers were asked to review the visibility rating instructions for every observation.
Upon completion of each trip, information from the data forms was entered into a web-accessible, searchable database created by Argonne. The location of each observation was identified and matched to the corresponding SOP. Notes also were entered to provide an electronic copy of the field notes. Photographs were selected from various focal lengths and added to each record, where applicable.
After completion of the fieldwork, the observation data, visibility ratings, and photographs were entered into a Web-enabled database for storage and retrieval. The data were also exported to a KMZ file for use in Google Earth. The database provides a means to search data from each of the three trips and to make comparisons across the trips and locations. It also provides for an extensive photographic catalogue of the various wind energy facilities. The Web-based database and KMZ file are available at http://web.evs.anl.gov/vitd.
Using the database, a geographic information system (GIS) program, and other software tools, several types of calculations were made to enhance or correct the data collected in the field. These include the following:
1) Distance: This value was calculated using a GIS program. The distance is calculated from each SOP to a turbine in the central portion of the side of the facility facing the observer for each wind energy facility. This provides for consistency among the distance calculations, but does introduce some error, as in some observations, the actual turbines in view may in fact be slightly closer or further from the observer than indicated.

19
2) Solar Azimuth: The solar azimuth was determined by inputting the date, time, and location for the observation into a web-based application provided by the National Oceanic and Atmospheric Administration.2
3) Bearing: This value was calculated using a GIS-based computer program. The bearing represents the direction in which the observation was made. It was calculated using a central turbine within each wind energy facility. This provides for consistency among the bearing calculations, but does introduce some error as the actual turbines in view may in fact have a slightly different bearing.
4) Wind turbine lighting angle: The lighting angle for each observation was calculated to indicate what the lighting conditions would have been for the wind turbines, on the basis of the geometry of the sun and the location of a central wind turbine. This calculation was derived from a calculated value of the solar azimuth and the bearing.
5) Average Visibility Rating: The average visibility was calculated by averaging the ratings from all viewers for each observation. The database querying capability was used to extract subsets of the observations for analysis.
IV. Results
Phase 1: Maximum Visibility Distance Analysis
The maximum visibility distance portion of this study utilized a combination of field-based observations of wind turbines and geospatial analyses to determine the maximum limit of visibility of the wind turbines in a variety of lighting and atmospheric conditions, and the maximum limit of visibility of blade movement on the wind turbines. The observation points were determined by conducting viewshed analyses for the wind facilities to determine areas with potential visibility of the wind turbines, and then driving the roads within the viewsheds to determine the outer limits of visibility for the particular weather and lighting conditions at the time. Both daytime and nighttime observations were made. Observations were made for both the Cedar Creek and Happy Jack/Silver Sage wind facilities. Most observations for this phase of the study were conducted in January 2011, but additional observations were made on the subsequent trips in March, July and October 2011.
Note: distances reported below were measured to the nearest visible turbine; however, for all observations, other turbines were visible at slightly longer distances.
2 http://www.esrl.noaa.gov/gmd/grad/solcalc/.
20
Wind Turbine Maximum Visibility Distance: Daylight Observations
The maximum distance at which wind turbines were observed in this study was 58.3 km (36.2 mi), on January 28, 2011, at 11:45 AM, and again on March 24, 2011, at 8:30 AM, for observations of the Cedar Creek wind facility made from Chalk Bluff Rd. (SOP #431), southeast of Cheyenne and northwest of the Cedar Creek facility.
For the January 28th observation, skies were clear. The wind turbines were just visible to the naked eye as faint smudges on the eastern horizon, after extended and concentrated viewing. The lone observer looked away and back at them several times to confirm that the wind turbines were actually visible. The observer was able to confirm them as wind turbines with binoculars, but judged that without binoculars, they would not be recognizable as wind turbines, nor would they have been likely to be seen at all unless an observer had already known they were there.
For the March 24th observation, the weather was partly cloudy, but with the wind turbines backlit by low sun in a bright pale blue morning sky. Two observers saw wind turbine towers as tiny vertical lines on the distant bluff. The wind turbines were visible briefly before haze or some other factor caused them to fade from view.
For both observations, the turbine blades were not visible, nor was there any visible evidence of blade motion.
The wind turbines were not visible to the naked eye from SOP #431 on several additional visits during the July and October trips. It should be noted that topographic screening eliminated the possibility of seeing the Cedar Creek wind facility beyond SOP #431, and it is possible that the facility might have been visible from a slightly greater distance under exceptional viewing conditions.
Wind turbines in the Cedar Creek wind facility were visible from SOP #57 at 56.5 km (35.1 mi) directly west of the facility on four separate occasions, with two observations in March (both mid-morning: one with sunny skies, turbines frontlit; one with overcast skies, turbines shaded) and twice in July (one mid-morning, one mid-afternoon, both in partly cloudy skies). For all observations, the turbine blades were not visible, nor was there any visible evidence of blade motion.
In the entire study, the Cedar Creek wind facility was recorded as visible from observation points beyond 48 km (30 mi) 15 times, although the facility was seen at these distances more often than was formally recorded. While there were a number of days when the facility was not visible from beyond 48 km (30 mi), it is reasonable to conclude that under favorable but not exceptional viewing conditions, for persons who were actively looking for the facility and knew where to look, they could expect to see the Cedar Creek facility beyond 48 km (30 mi), but it would be unusual to see it beyond 56 km (35 mi).
21
Wind Turbine Blade Motion Maximum Visibility Distance
Wind turbine blade motion has been identified as a significant attractor of visual attention and a factor that increases perceived visual contrast from wind facilities (Bishop and Miller, 2007; University of Newcastle, 2002). The maximum visibility distance assessment included identifying the limit of visible blade motion, on the basis of observations of the Cedar Creek and Happy Jack/Silver Sage wind facilities.
The maximum distance at which wind turbine blade motion was visible in this study was 46.7 km (29.0 mi), on July 12, 2011, at 10:55 AM, for an observation of the Cedar Creek wind facility made from SOP #58, directly west of the facility. The wind turbines were backlit against a cloudy sky. The individual blades were not visible, but the blade movement caused a barely visible blur or pulsation if the turbines were examined closely.
Wind turbine blade motion and individual blades were observed at 46.3 km (28.8 mi), on July 9, 2011, at 4:17 PM, for an observation of the Cedar Creek wind facility made from SOP #130, directly west of the facility. The wind turbines were frontlit against a partly cloudy sky. The wind turbines and the blades faded in and out of view as shade from clouds fell on the turbines, with the blades barely discernible in the sunlight. Blade motion (but not individual blades) was observed again at 7:34 AM on October 18, 2011.
A failure to see blade motion and the blades themselves may have several causes. Of course, if the wind is not blowing with sufficient force to cause blade movement, the blades may be visible, but blade motion will not be. At midrange distances, if the blades are turned parallel to the view direction, they may be invisible. The lack of blade visibility and blade motion visibility at the longest distances is likely because the eye is unable to discern the necessary level of fine detail in anything but the clearest air, especially if the blades are not turning.
Figure 1 is a graph of the blade motion and individual blade visibility observations for Cedar Creek, plotted against the average visibility ratings. The graph clearly shows the relationship between distance and blade/blade movement visibility. The prevalence of lower visibility ratings for observations where blades and blade movement were not visible, even at relatively short distances, suggests that blade/blade movement visibility may be an important driver of the overall visibility of wind facilities.

22
Figure 1. Observations of wind turbine blade motion and individual blade visibility at Cedar Creek wind facility as a function of distance and average visibility rating, for all observations in March, July, and October field exercises.
Blade motion and blades were observed at both Cedar Creek and the Happy Jack/Silver Sage wind facilities a number of times at distances of approximately 39 km (24 mi). The visual backdrop for the Happy Jack/Silver Sage facility when viewed from the east is a dark, vegetated mountain ridge; in the early morning, when the white turbines were frontlit against the dark backdrop, they were relatively easy to see when scanning the western horizon, and under favorable conditions, the blades could be discerned after looking at the wind turbines closely. Blade motion at the Cedar Creek facility was often observed in early morning when the backlit turbines were silhouetted against the bright morning sky to the east.
Wind Turbine Maximum Visibility Distance: Night Observations
Federal Aviation Administration (FAA) guidelines for marking and lighting wind energy facilities require lights that flash white during the day and at twilight and red at night (FAA 2007). The white daytime lights may be omitted if the turbines are painted white. White light strobes could be used optionally. All marker lights within a wind farm are also required to flash simultaneously (approximately 24 times/minute); however, only the perimeter turbines of a wind farm need such markings, provided that there is no unlighted gap greater than 0.81 km (0.5 mi). The maximum visibility distance assessment included identifying the maximum distance at which the red flashing turbine lights were visible at night, on the basis of observations of the Cedar Creek wind facility.
The maximum distance at which the red flashing hazard navigation lighting was officially recorded as visible in this study was 58.3 km (36.2 mi), on October 16, 2011, at 6:35 PM, for an

23
observation of the Cedar Creek wind facility made from Chalk Bluff Rd. (SOP #431), southeast of Cheyenne and northwest of the Cedar Creek facility. The lights appeared as a distant row of flashing lights visible through foreground obstructions. The lights were not as bright as many foreground lights, but were not judged to be close to the limit of visibility, and in the authors’ judgment would likely be visible for longer distances; however, topography prevented viewing the facility from a greater distance. The slow, synchronized red flashing of the row of lights was obvious, even though the lights were not bright.
Wind turbines in the Cedar Creek wind facility were visible from SOP #57 at 56.5 km (35.1 mi) directly west of the facility on October 17, 2011, at 7:11 PM. The view in this case was unobstructed, and the greater number of lights visible made them more visually conspicuous. The lights were judged to be unlikely to be missed by a casual observer.
While not formally recorded (because relatively few formal observations were made at night), the lights were visible from these two locations on a number of occasions, and in the observers’ judgment based on repeated visits, the lights are likely to be visible from these locations on most clear nights. In general, in the relatively featureless night landscapes of the rural High Plains, while single or multiple lights on single or a few grouped towers are not unusual, the sight of a large number of closely and regularly spaced synchronized flashing lights is unique to wind facilities, and can be quite conspicuous, with the bright red of the lights contrasting highly with the black or nearly black backdrop. The authors note that a common reaction of first-time viewers of wind farms at night is bewilderment at the unfamiliar sight, but even at very long distances, wind facilities at night are instantly recognizable to anyone familiar with their unique appearance.
Phase 2: Visual Impact Threshold Distance Analysis
The visual impact threshold distance portion of this study utilized a combination of field-based observations of wind turbines and geospatial analyses to determine the approximate distances at which the visual contrasts associated with wind facilities reach levels that have significance for conducting visual impact assessments. The facilities were observed under a variety of lighting and atmospheric conditions in order to determine, to the extent possible, what effect these variables might have on visibility ratings and threshold distances. At each observation point, basic information about the observation point, the weather, lighting conditions, and other situational variables was recorded, the facilities were photographed, and a visibility assessment was conducted by each observer independently, based not on photographs but on the view of the facility from the field at the time of the observation.
Observations were made for the Cedar Creek, Seven Mile Hill, and Dunlap wind facilities. These facilities were chosen for a variety of reasons, but primarily because they afforded both western and eastern views, and because of the range of visual backdrops for views of the facilities from the SOPs chosen for each facility. Cedar Creek is on a mesa, with SOP views generally from slightly inferior viewing positions such that the wind turbines are almost always viewed with a sky backdrop. Seven Mile, as viewed from the SOPs, generally has a mixed

24
backdrop of sky and mountains, while Dunlap, as viewed from the SOPs, has a mountain backdrop.
The observation points were determined by conducting viewshed analyses for the wind facilities to determine areas with potential visibility of the wind turbines, and then selecting regularly spaced observation points on the roads within the viewsheds. In some cases, because of partial screening, SOPs were moved slightly from the regular spacing, or additional SOPs were identified in nearby locations that afforded less obstructed views or eliminated potentially distracting foreground elements.
For the Cedar Creek wind facility, SOPs were located between 0.8 km (0.5 mi) and 56.5 km (35.1 mi) generally west of the facility. A total of 244 observations were made from 105 SOPs, including 232 observations with visibility ratings. These SOP locations are shown in Figures 2 through 5. The observations were made on 13 days in the course of three field exercises in March, July, and October 2011.
For the Seven Mile wind facility, SOPs were located between 3.1 km (1.9 mi) and 30.6 km (19.0 mi) generally east of the facility. A total of 98 observations were made from 35 SOPs, including 96 observations with visibility ratings. These SOP locations are shown in Figure 6. The observations were made on six days in the course of three field exercises in March, July, and October 2011.
For the Dunlap wind facility, SOPs were located between 6.4 km (4.0 mi) and 20.1 km (12.5 mi), with one additional SOP at 38.9 km (24.2 mi), generally southeast of the facility. A total of 28 observations were made from 13 SOPs, including 26 observations with visibility ratings. These SOP locations are shown in Figure 7. The observations were made on five days in the course of three field exercises in March, July, and October 2011.

25
Figure 2. Cedar Creek wind facility and SOPs, 0-14 km (0-9 mi) west of facility.
Figure 3. Cedar Creek wind facility SOPs, 16-32 km (10-20mi) west of facility.

26
Figure 4. Cedar Creek wind facility SOPs, 32-56 km (20-35 mi) west of facility.
Figure 5. Cedar Creek wind facility SOPs, 24-56 km (15-35 mi) northwest of facility.

27
Figure 6. Westernmost Seven Mile Hill and Dunlap wind facility SOPs.
Figure 7. Easternmost Seven Mile Hill and Dunlap wind facility SOPs.

28
Study Limitations
A field study of this nature has numerous limitations, which must be considered when interpreting any results. Generally, they can be classified as:
1) limitations related to the facilities themselves;
2) the inherent complexity of the factors involved in visibility of objects in real landscape settings;
3) limitations related to the study methodology; and
4) the inherent variability in ratings between observers because of their differing perceptions of the wind facilities and other landscape elements.
First, wind facilities vary widely in size and layout, and while there is nothing unusual about the facilities that were selected for the study, they represent a very small sample of the many wind facilities that exist in the West. For the purposes of this study, it is important to note that there are many larger wind facilities in operation or under development. Some facilities are much larger—up to 1,000 turbines—and some new facilities have significantly taller turbines. These facilities may create larger contrasts than the facilities observed in this study, depending on the number and size of turbines in view from key observation points.
Second, as the researchers at the University of Newcastle (2002) noted in their description of a conceptual model for visual impact assessment of wind facilities, “The issues are complex, and this cannot be wished away.” Distance is only one of many factors that affect perceived visual contrast of an object in a landscape setting. In fact, their conceptual model assessing the magnitude of visual impact lists 26 factors that influence assessments, grouped generally as factors relating to the physical form of the development; ambient conditions such as distance, direction, time of day, and weather; human perception factors; and a host of variables that tend to reduce or increase apparent impact magnitude, such as skylining of the facility, simple vs. complex surroundings, and viewpoint elevation with respect to the facility. Of course, trying to ascribe a particular observed result to any one factor such as distance is made even more difficult because in many cases the factors are not completely independent of each other.
Third, there are factors relating to the methodology used that might affect the results. The visibility ratings are not quantitative measurements, but are based on professional judgments, using particular language that may have introduced inaccuracies into the ratings. Although much of the other data collected about the observations were more factual or quantitative in nature, some items involved judgments (e.g., contrast between wind turbine and background) or interpretations of the instructions which may have varied slightly from individual to individual. Although the observations were made on many different days, it is possible that the full range of possible viewing conditions was not represented in the observations. Because of the large number of observation points and the long distances between them, some locations had more observations than others, and not all points had observations made at the same times of day. The ratings at some observation points were undoubtedly affected by surrounding landscape elements in the foreground and middle ground viewing distances that were unique to the
29
viewpoint, and could distort the distance/contrast relationship. While some observations involved as many as 10 observers, and many involved three or more observers, more than half of the observations involved two observers, clearly less than optimal, but necessitated by practical limitations.
Finally, there are a range of limitations that are directly or indirectly attributable to the observers themselves. Despite an effort to make the visibility rating language relatively simple, objective, and focused more on visibility and contrast issues than on emotional reactions to what was seen, the language is not perfect. It may have been interpreted slightly differently by different observers, and even if it had not been, would still yield variations from individual to individual. The main observers are landscape architects with training and experience that qualified them for the assessments, but might make them more or less sensitive to the visual phenomena observed, and in other ways might make them respond differently than other individuals might. By the end of the study, the main observers had made literally thousands of observations of wind turbines, and their judgments about some of the items may have changed because of the repeated exposure. Finally, although the observers all had “normal” vision, visual acuity did vary slightly between observers, although this generally seemed only to affect observations at very long distances, generally near the limits of visibility.
These limitations are important and must be considered when interpreting the results presented below, and when attempting to generalize the results or apply them to different landscape settings. Nonetheless, the results are based on a significant number of observations using a consistent approach to the individual ratings. There was good agreement between the individual ratings, likely a result, in part, of the relatively simple and straightforward rating approach and descriptions of the visibility levels.
Because of the limited range of SOP distances from the Seven Mile and Dunlap facilities and the relatively small number of observations at these facilities, the results presented below are based primarily on the Cedar Creek observations, supplemented by the observations at Seven Mile and Dunlap, where there was overlap in SOP distances.
Visibility Rating Trends
Effect of Distance on Facility Visibility
For all three facilities, average visibility ratings varied widely for a given distance, but clearly decreased as the distance from the SOP to the facility increased. The relationship between distance and average visibility rating is graphed in Figure 8. For all three facilities, the graph shows decreasing visibility of facilities as the distance between the SOP and the facility increases.
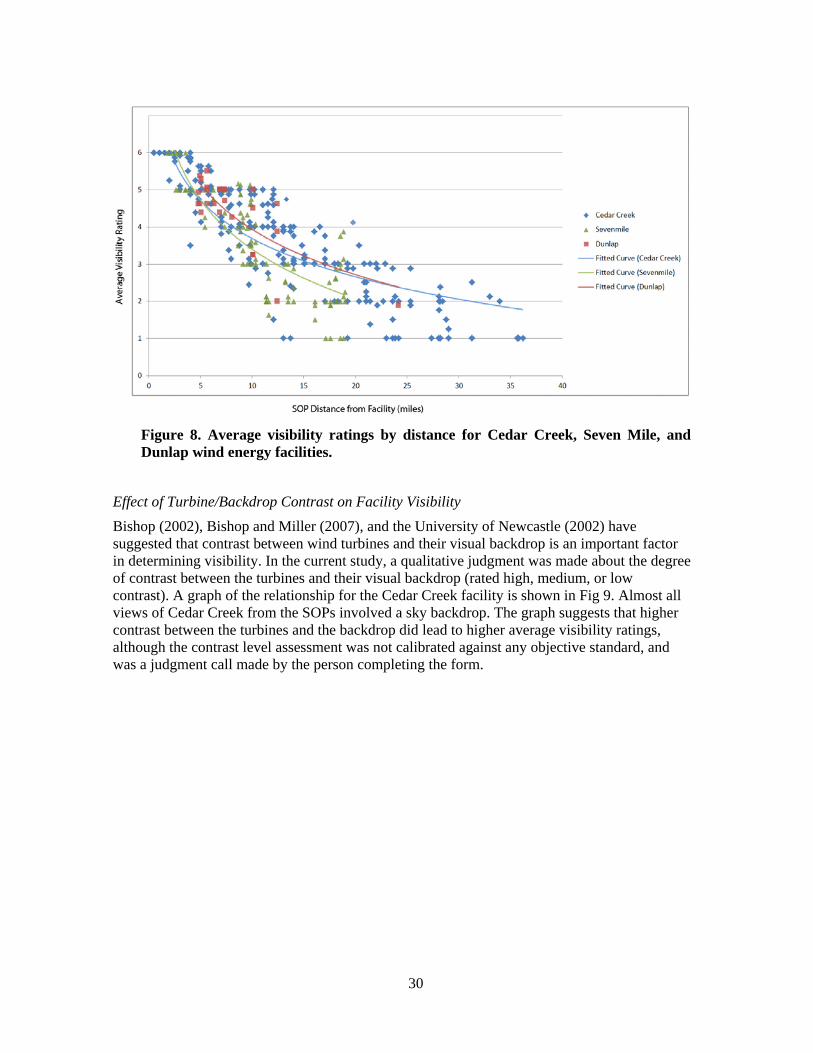
30
Figure 8. Average visibility ratings by distance for Cedar Creek, Seven Mile, and Dunlap wind energy facilities.
Effect of Turbine/Backdrop Contrast on Facility Visibility
Bishop (2002), Bishop and Miller (2007), and the University of Newcastle (2002) have suggested that contrast between wind turbines and their visual backdrop is an important factor in determining visibility. In the current study, a qualitative judgment was made about the degree of contrast between the turbines and their visual backdrop (rated high, medium, or low contrast). A graph of the relationship for the Cedar Creek facility is shown in Fig 9. Almost all views of Cedar Creek from the SOPs involved a sky backdrop. The graph suggests that higher contrast between the turbines and the backdrop did lead to higher average visibility ratings, although the contrast level assessment was not calibrated against any objective standard, and was a judgment call made by the person completing the form.

31
Figure 9. Average visibility ratings by wind turbine/backdrop contrast level (low, medium, or high) as a function of distance for the Cedar Creek wind energy facility.
Effect of Wind Turbine Lighting Angle on Facility Visibility
A key factor contributing to contrast between the turbines and their visual backdrop is the relationship of the sun angle and the viewing angle, i.e. whether the turbines are frontlit with respect to the viewer, backlit with respect to the viewer, sidelit, or unlit (shaded). The University of Newcastle (2002) suggested that frontlighting and backlighting increase contrast of wind facilities (depending on the lightness of the backdrop), while shading tends to decrease contrast.
In this study, as noted in the methodology discussion, the wind turbine lighting angle was a calculated value and not an observer judgment. A graph of the relationship between wind turbine lighting angle and visibility rating as a function of distance for the Cedar Creek facility is shown in Figure 10.

32
Figure 10. Average visibility ratings by wind turbine lighting angle as a function of distance for the Cedar Creek wind energy facility.
The graph shows the highest visibility ratings for frontlit conditions, somewhat lower ratings for backlit and for sidelit conditions, and the lowest ratings for shaded conditions. This finding is generally consistent with the authors’ informal observations about high- vs. low-contrast viewing situations, especially at longer distances. Inspection of the observation data suggests that the highest visibility ratings for long-distance views of the Cedar Creek facility tended to be in the late afternoon, likely because the the low sun angle resulted in more direct sunlight falling onto the frontlit towers, with the turbines especially noticeable if the sky behind the turbines was darkened by thick clouds. In the early morning, the rising sun behind the Cedar Creek wind turbines would cause them to be strongly silhouetted against the bright morning sky, also resulting in increased contrast, although at times the sky was so bright as to cause glare that made the turbines difficult to see.
The authors noted that viewing frontlit turbines against dark mountain backdrops also markedly increased wind turbine visibility. These viewing conditions facilitated seeing blade movement at long distances for the Happy Jack/Silver Sage facility in the early morning, when the low angle of the rising sun resulted in more direct sunlight falling onto the frontlit towers seen against the dark vegetation on the mountain backdrop. Similarly, views of the Dunlap facility against its long, dark mountain ridge backdrop showed high contrast in the morning when the rising sun frontlit the turbines, with contrast dropping significantly in the afternoon, when the sun gradually passed into sidelit conditions, or when overcast skies made the unlit turbines blend in with the backdrop.
33
Reported Factors Contributing to Visibility
As part of the visibility rating for each observation, two of the observers (for the July and October field exercises only) indicated visibility factors they felt contributed most to the visibility rating they assigned for the observation, and were asked to explain their choices. Factors were selected from the following list:
1) Size: This choice could refer to either apparent facility size or individual turbine size as a primary contributing factor to facility visibility.
2) Geometry: This choice referred to the vertical line contrast caused by the turbine towers, or the geometry of the facility as a whole.
3) Color: This choice referred to the color contrast between the turbines and their visual backdrop.
4) Blade motion: This choice referred to the visible blade motion as a primary contributing factor to facility visibility.
5) Other: This choice allowed observers to indicate other contributing factors they may have identified.
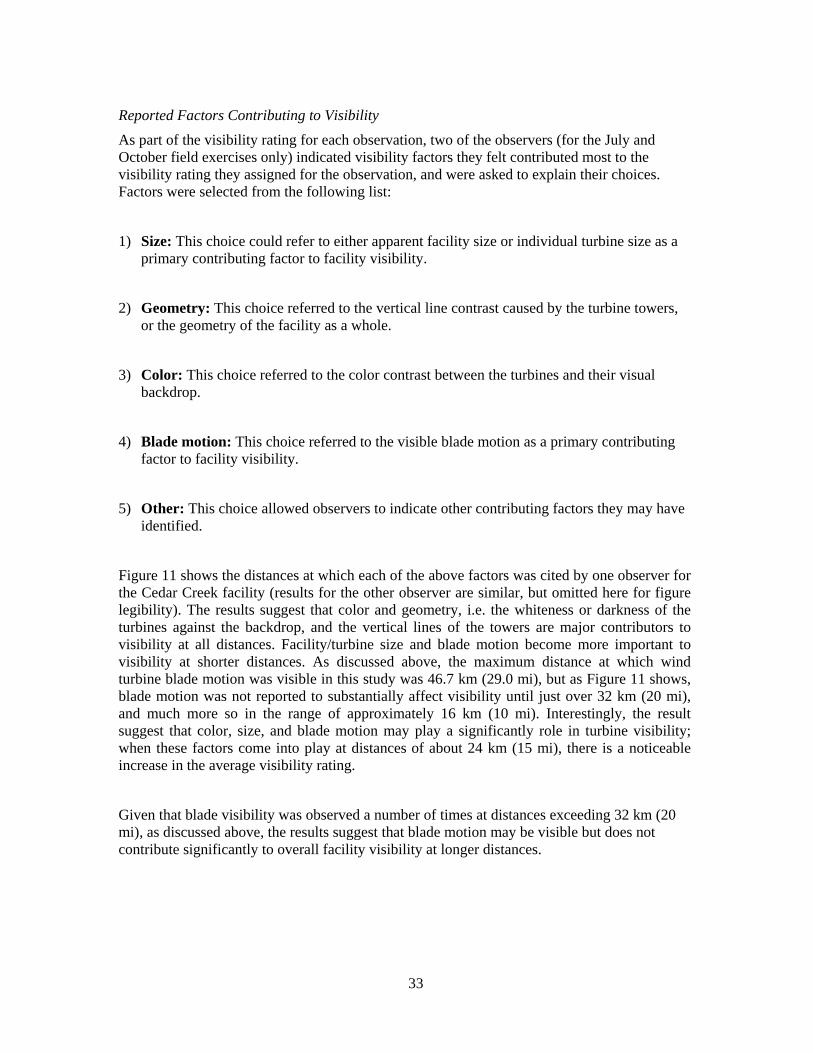
Figure 11 shows the distances at which each of the above factors was cited by one observer for the Cedar Creek facility (results for the other observer are similar, but omitted here for figure legibility). The results suggest that color and geometry, i.e. the whiteness or darkness of the turbines against the backdrop, and the vertical lines of the towers are major contributors to visibility at all distances. Facility/turbine size and blade motion become more important to visibility at shorter distances. As discussed above, the maximum distance at which wind turbine blade motion was visible in this study was 46.7 km (29.0 mi), but as Figure 11 shows, blade motion was not reported to substantially affect visibility until just over 32 km (20 mi), and much more so in the range of approximately 16 km (10 mi). Interestingly, the result suggest that color, size, and blade motion may play a significantly role in turbine visibility; when these factors come into play at distances of about 24 km (15 mi), there is a noticeable increase in the average visibility rating.
Given that blade visibility was observed a number of times at distances exceeding 32 km (20 mi), as discussed above, the results suggest that blade motion may be visible but does not contribute significantly to overall facility visibility at longer distances.
34
Figure 11. Factors cited as major contributing elements to visibility ratings at the Cedar Creek wind facility as a function of distance and average visibility rating, for all observations in March, July, and October field exercises.
V. Discussion
Impact Thresholds
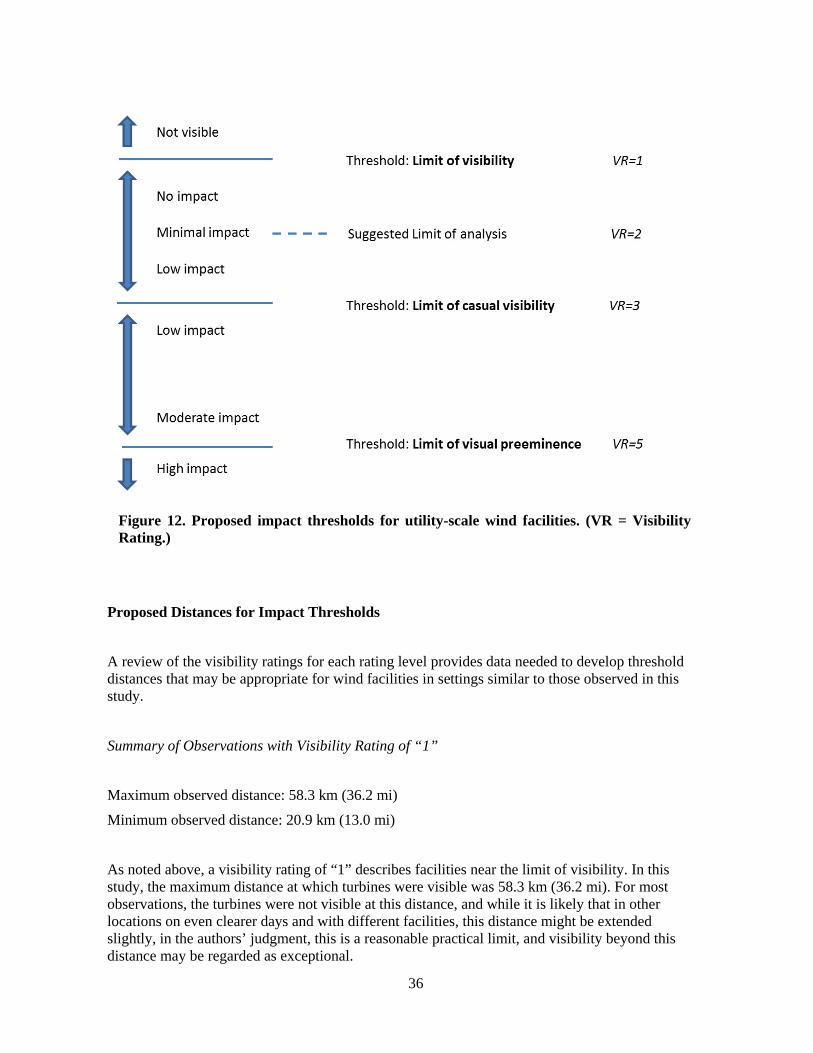
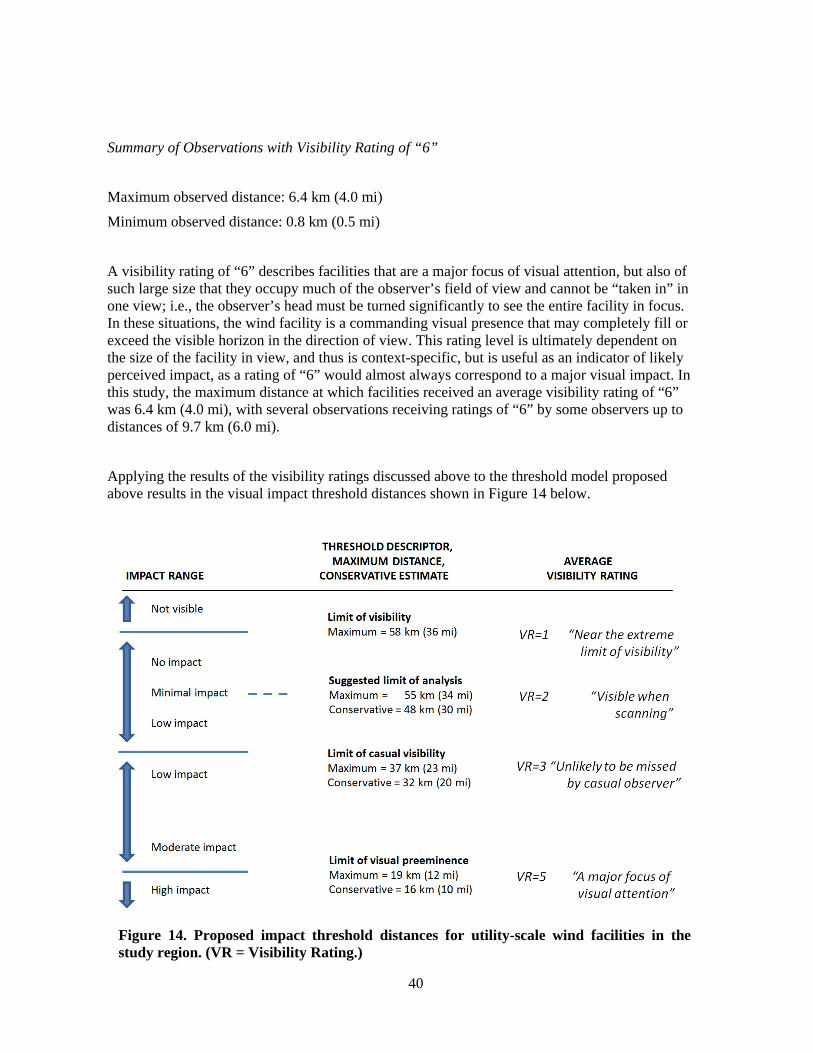
This study sought to determine the distance thresholds appropriate for visual impact analyses and for the siting of wind facilities to avoid or minimize potential visual impacts to visually sensitive landscapes. Given this purpose, the following impact thresholds are proposed:
1) Limit of visibility: This distance threshold determines the outer limit of visual effects (in daytime viewing only) associated with visual contrast from wind farms under normal circumstances. In this study, the corresponding average visibility rating (see Table 2) is “1.” This rating can be summarized as describing a facility that is at the extreme limit of visibility.
2) Suggested limit of analysis: This distance is the authors’ suggestion regarding the outer boundary of very small but important impacts that should be recognized and described in impact analyses. In this study, the corresponding average visibility rating is “2,” summarized as describing a facility that might be missed by casual observers but is easily visible when scanning or looking closely at the landscape. The rationale for selecting this threshold as the basis for impact analyses is that scanning or looking closely at the landscape is a very common activity, especially in areas that are visually sensitive, or have high scenic quality, or both; for example, at scenic overlooks or along scenic and historic

35
trails. It is reasonable and appropriate to analyze and describe potential visual impacts that might be encountered routinely, even if they are small impacts.
3) Limit of casual visibility: This distance threshold determines the distance at which a facility would likely be noticed by anyone looking briefly in the general direction of the facility, without foreknowledge or active looking. In this study, the corresponding average visibility rating is “3,” summarized as describing a facility that would be noticeable to a casual observer. At this level of visibility, impacts may rise to a moderate level, depending on circumstances and landscape context.
4) Limit of visual preeminence: This distance threshold determines the distance at which a facility becomes a major focus of visual attention, tending to attract and hold visual attention because of strong contrast in form, line, texture, color, or motion. In this study, the corresponding average visibility rating is “5.” At this level of visibility, impacts are generally at a high level, although the wind facility may not be visually dominant over major landforms such as mountains, hence avoidance of the term “dominance” in the threshold descriptor. In the authors’ opinion, despite the size of wind turbines and wind facilities, the open nature of the turbine layout may make it difficult for a wind facility to dominate views with prominent landforms, such as mountain ridges, because the wind turbines lack “visual weight”; however, the strong line, color, and motion contrasts of wind facilities may cause them to be major sources of visual contrast nonetheless, especially at short distances.
These proposed thresholds are shown in Figure 12.
36
Figure 12. Proposed impact thresholds for utility-scale wind facilities. (VR = Visibility Rating.)
Proposed Distances for Impact Thresholds
A review of the visibility ratings for each rating level provides data needed to develop threshold distances that may be appropriate for wind facilities in settings similar to those observed in this study.
Summary of Observations with Visibility Rating of “1”
Maximum observed distance: 58.3 km (36.2 mi)
Minimum observed distance: 20.9 km (13.0 mi)
As noted above, a visibility rating of “1” describes facilities near the limit of visibility. In this study, the maximum distance at which turbines were visible was 58.3 km (36.2 mi). For most observations, the turbines were not visible at this distance, and while it is likely that in other locations on even clearer days and with different facilities, this distance might be extended slightly, in the authors’ judgment, this is a reasonable practical limit, and visibility beyond this distance may be regarded as exceptional.
37
It should be noted that average visibility ratings of “1” at shorter distances are almost all observations made when the wind turbines were shaded, a circumstance that reduces visual contrast between the turbines and their visual backdrop, or, for the Seven Mile facility, when views of the facility were partially obstructed.
Summary of Observations with Visibility Rating of “2”
Maximum observed distance: 54.7 km (34.0 mi)
Minimum observed distance: 15.6 km (9.7 mi)
Recommended threshold distance: 48 km (30 mi)
As noted above, a visibility rating of “2” describes facilities that would likely be missed by casual observers but would be visible when scanning the landscape or looking closely at an area, without extended viewing. In this study, the maximum distance at which facilities received an average visibility rating of “2” was 54.7 km (34.0 mi), with another observation at 48.3 km (30.0 mi) receiving an average rating of 2.13. There are five observations with average visibility ratings of “2” at distances of approximately 45 km (28 mi), and two additional observations with one rating of “2” between 45 and 47 km (28 and 29 mi), a strong argument that the threshold should not be set lower than that distance. On the assumption that the longest distance views might be regarded as exceptional, a more conservative distance for the threshold would be 48 km (30 mi).
Summary of Observations with Visibility Rating of “3”
Maximum observed distance: 36.9 km (22.9 mi)
Minimum observed distance: 12.4 km (7.7 mi)
Recommended threshold distance: 32 km (20 mi)
As noted above, a visibility rating of “3” describes facilities that would be visible after a brief glance, and unlikely to be missed by a casual observer.” At this level of visibility, impacts may rise to a moderate level, depending on circumstances and landscape context. In this study, the maximum distance at which facilities received an average visibility rating of “3” was 36.9 km (22.9 mi), with several observations receiving ratings of “3” by some observers up to distances of 50.4 km (31.3 mi). There are four observations with average ratings of “3” at distances exceeding 32 km (20 mi), and an additional three observations with average ratings of 2.88 beyond 32 km (20 mi). Observations for Seven Mile extended to just under 32 km (20 mi), and are slightly lower than those for the Cedar Creek facility, possibly because of the mixed sky/ground backdrop, or possibly because of partially obstructed views. Factoring in the Seven Mile observations, a very conservative distance estimate for the threshold would be 32 km (20 mi).

38
Summary of Observations with Visibility Rating of “4”
Maximum observed distance: 31.9 km (19.8 mi)
Minimum observed distance: 6.4 km (4.0 mi)
A visibility rating of “4” describes facilities that would be obvious, and of sufficient size or contrast to compete with other landscape elements, but not large enough or contrasting strongly enough to attract and hold visual attention. This rating level makes clear reference to the surrounding landscape elements, and thus is context-specific, but is useful as an indicator of likely perceived impact, as a rating of “4” would be expected to correspond to a moderate visual impact in most settings. In this study, the maximum distance at which facilities received an average visibility rating of “4” was 31.9 km (19.8 mi), but with no additional ratings reaching an average of “4”until approximately 22.5 km (14.0 mi). While Visibility Rating Level “4” is not suitable for use as an impact threshold, the data suggest that in the case of the Cedar Creek facility, which has a somewhat cluttered foreground/midground in the distance range of 22.5 km (14.0 mi), the facility would likely be causing moderate impacts for sensitive viewers at this distance.
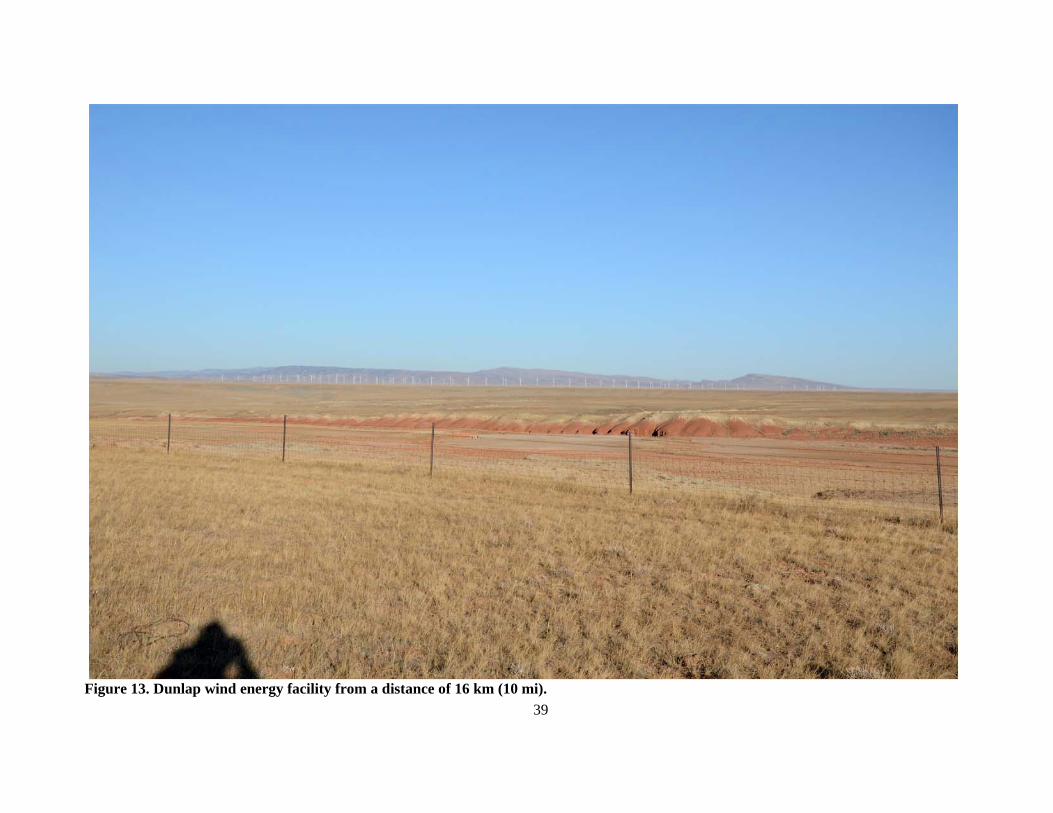
Summary of Observations with Visibility Rating of “5”
Maximum observed distance: 19.3 km (12.0 mi)
Minimum observed distance: 3.2 km (2.0 mi)
Recommended threshold distance: 16 km (10 mi)
A visibility rating of “5” describes facilities that would be a major focus of visual attention, tending to attract and hold visual attention because of strong contrast in form, line, texture, color, or motion. In this study, the maximum distance at which facilities received an average visibility rating of “5” was 19.3 km (12.0 mi), with several observations receiving ratings of “5” by some observers up to distances of 21.4 km (13.3 mi). Observations for Seven Mile and Dunlap include these distance ranges and are slightly lower than those for the Cedar Creek facility. Factoring in the Seven Mile and Dunlap observations, a conservative distance estimate for the threshold would be 16 km (10 mi). A photograph of the Dunlap facility taken from a distance of 16 km (10 mi) is shown in Figure 13.
39
Figure 13. Dunlap wind energy facility from a distance of 16 km (10 mi).
40
Summary of Observations with Visibility Rating of “6”
Maximum observed distance: 6.4 km (4.0 mi)
Minimum observed distance: 0.8 km (0.5 mi)
A visibility rating of “6” describes facilities that are a major focus of visual attention, but also of such large size that they occupy much of the observer’s field of view and cannot be “taken in” in one view; i.e., the observer’s head must be turned significantly to see the entire facility in focus. In these situations, the wind facility is a commanding visual presence that may completely fill or exceed the visible horizon in the direction of view. This rating level is ultimately dependent on the size of the facility in view, and thus is context-specific, but is useful as an indicator of likely perceived impact, as a rating of “6” would almost always correspond to a major visual impact. In this study, the maximum distance at which facilities received an average visibility rating of “6” was 6.4 km (4.0 mi), with several observations receiving ratings of “6” by some observers up to distances of 9.7 km (6.0 mi).
Applying the results of the visibility ratings discussed above to the threshold model proposed above results in the visual impact threshold distances shown in Figure 14 below.
Figure 14. Proposed impact threshold distances for utility-scale wind facilities in the study region. (VR = Visibility Rating.)
41
Using the conservative estimates based on the visibility ratings for the facilities observed, the following distances and corresponding impact thresholds are suggested as reasonable but general guidelines for visual impact assessments for moderate-sized utility-scale wind energy facilities in regions of the western U.S. with unobstructed views of the facilities:
1) Limit of visibility: approximately 58 km (36 mi)
This is suggested as a reasonable limit of visibility of wind turbines in daylight settings. Visibility beyond this distance would probably require exceptional circumstances, but in any event, the turbines would be extremely difficult for most people to notice.
2) Suggested limit of analysis: approximately 48 km (30 mi)
This is suggested as a reasonable limit for viewshed analyses and impact descriptions. Facilities beyond this distance might sometimes be noticed by casual observers, but would appear to be so small as to have negligible impacts.
3) Limit of casual visibility: approximately 32 km (20 mi)
At this distance, under normal viewing conditions, including cloudy weather with shaded turbines, facilities would be noticed by casual observers, and potentially cause moderate impacts, depending on setting, viewer sensitivity, and other impacting factors.
4) Limit of visual preeminence: approximately 16 km (10 mi)
At this distance, the wind facility is a major focus of visual attention, drawing and holding visual attention. The facility may occupy a substantial portion of the field of view, with the repeated vertical lines of the towers contrasting strongly with horizontal landforms and blade motion and color contrasts also strongly attracting visual attention in some circumstances. The facility as a whole is likely to be perceived by some viewers as having a large visual impact.
Cautions for Use of Suggested Impact Thresholds
The following cautions are appropriate to consider in using the suggested impact thresholds for analytical purposes:
1. The facilities studied had between 75 and 100 wind turbines visible in most views, even

42
though the total number of turbines at the Cedar Creek facility was substantially higher. For wind facilities with substantially larger numbers of turbines in view, the appropriate threshold distances might be farther. For wind facilities with substantially fewer turbines in view, the appropriate threshold distances might be shorter. Viewshed analyses should be used to determine the number of turbines likely to be in view.
2. The turbine models in the observed facilities ranged from ~90 to 120 m (300 to 400 ft) in height. For wind facilities with substantially larger or small turbine models, adjustments to the impact threshold distances may be required.
3. The Cedar Creek facility, observations of which form the bulk of the analysis in this study, is located on a low mesa. This is a common siting situation in much of the western U.S., but may tend to focus views on the facility, and make it less subject to topographic, vegetative, or structural screening. Where facilities are sited on valley floors or subject to partial screening, threshold distances might be slightly smaller. In this study, partial screening of facilities depressed visibility ratings substantially.
Other Observations
Though not a focus of this paper, some other observations from the study are worth noting. Observers noted the visibility of transient visual effects, such as blade glinting, and rotating blade shadows falling on turbine towers. These effects, while of limited duration, may substantially increase visibility of the wind facilities while they are observed; generally by drawing the eye toward facilities that might not have been the focus of visual attention.
Blade glinting is the brief, often repeated flash of point-like light reflection from wind turbine blades, typically seen near the hub. In the authors’ experience, glinting may last from a few seconds to tens of seconds, occasionally longer, and is subject to rapid appearance and disappearance or fluctuation from minor changes in rotor orientation with respect to the sun angle.
In the course of the study, glinting was observed 18 times; in all cases except one, the distance was less than 16 km (10 mi); however in one instance, glinting was clearly visible at a distance of 26.1 km (16.2 mi), and even at that long distance was judged to be very noticeable, and was in fact first observed through a casual glance from a moving vehicle.
Shadows of turbine blades falling on towers when the sun is at a low elevation can cause a strobe-like effect as the blade shadow passes the lit tower repeatedly. In some instances, this can add substantially to the visibility of the wind facility. This common phenomenon was recorded
43
several times in the course of the study, at distances ranging up to 28.3 km (17.6 mi). A notable observation occurred at the Dunlap facility on October 19, at a distance of 16.3 km (10.1 mi). In this instance, just before sunset, the shadowing of turbine towers by blades caused the strobe-like effect to appear on almost all of the visible turbines in the facility, which had the appearance of whole turbines “turning off and on” as each blade passed, but with this effect occurring simultaneously for all of the visible turbines. The effect was very striking, and strongly attracted visual attention.
Visibility of Wind Turbines in Photographs vs. Field Settings
As noted above, visibility ratings were conducted in the field without the use of photographs. At every location, however, high resolution photographs of the wind facilities were taken at a variety of focal lengths, using Ricoh or Nikon digital cameras. Many of the photographs taken are available online at http://web.evs.anl.gov/vitd. The photographs were taken without the use of lens filters, and were not digitally manipulated or enhanced in any way after being taken. Some of the photos are blurred, largely because of the high winds at the time the photographs were taken, and many were taken in less than optimal lighting. Some slight image degradation undoubtedly occurred as a result of the JPEG compression used to convert the files to a manageable size, however, the image resolution is still high.
In the authors’ judgment, based on the many observations for this study, and comparison of the corresponding photographs and narrative records from the observations, the photographs consistently under-represent the degree of visibility observed in the field. While true to some degree for all of the photographs, this is particularly true for photographs of the facilities taken from longer distances. This is not simply an issue of viewing the photographs from the wrong viewing distance, a common and important problem when viewing visual impact simulations (Benson 2005). The photos are less sharp and show less contrast than was observed in the field, and of course, the photographs do not show blade motion, which clearly was a factor in visibility for many of the observations. For some of the long-distance photographs, the turbines are barely visible, but the narrative records for multiple observers describe them as plainly visible. Scottish Natural Heritage (2006) suggests that the camera’s inability to replicate the full contrast range visible to the human eye is a “key limitation of photographs in replicating the human experience.”
The under-representation of visibility in the photographs generated from the study is important to consider when viewing the photos from the study; the authors strongly suggest consulting the narrative record for each observation to get a better understanding of what was actually observed in the field. It is likely that photographs taken under better conditions, with better equipment, and by more skilled photographers would be less subject to the problem of under-representing visibility with respect to sharpness, and contrast (to a degree); however, no still photograph can capture wind turbine blade motion, which the present study has indicated is an important factor in wind turbine visibility, and other studies have shown this as well (Benson 2005).

44
Future Research Needs
The study presented here examined several wind facilities felt to be typical of utility-scale facilities in the western U.S. at this time. Conducting field research of this nature involves many compromises in order to reap the benefits of observing facilities in real landscape settings. Control over important variables is lost, and results are subject to weather and lighting conditions beyond the control of those conducting the study. The choice of facilities and locations for the study immediately precludes many other facilities and locations that may have attributes that would be important to consider in an ideal situation. Finally, the use of professionals rather than members of the public to make judgments about contrasts and visibility also involves difficult but necessary tradeoffs.
Potential studies that would validate, build upon, or improve upon the study presented here include the following:
Studies that use members of the public to conduct visibility ratings;
Studies involving larger or smaller facilities, and in different settings, including different regions of the country;
Studies that address specific visibility factors in a more controlled way, such as through the use of digitally manipulated photos to adjust turbine size, spacing, contrast, etc.; and
Studies that include assessment of impacts to specific sensitive visual resource areas, such as national parks, wilderness areas, or national scenic or historic trails.
As more and larger wind facilities are built throughout the western U.S., finding the answer to the fundamental question that visual impact threshold distance studies address—“How close is too close?”—becomes ever more important. These types of studies are critical to optimal siting of wind facilities to avoid major impacts on important scenic resources such as national parks, national historic trails, and wild and scenic rivers. They also help the wind industry to determine where best to site facilities to ensure acceptance of proposed projects by an increasingly sensitive public. Furthering research toward answering this fundamental question is a worthwhile and important task.

45
VI. References
Apex Wind Energy. 2011. Our Company. Project Experience: Cedar Creek Wind Farm, Colorado. http://www.apexwind.com/our-company/project-experience-2/cedar-creek-wind-farm-colorado/. Accessed 20 December 2011.
Benson, John F. 2005. The Visualization of Windfarms. In Ian D. Bishop and Eckhart Lange (Eds.), Visualization in Landscape and Environmental Planning (184-192). New York.: Taylor & Francis.
Bishop, Ian D. 2002. Determination of Thresholds of Visual Impact: The Case of Wind Turbines. Environment and Planning B: Planning and Design Vol. 29: pp. 707-718.
Bishop, Ian D., and David R. Miller. 2007. Visual Assessment of Off-shore Wind Turbines: The Influence of Distance, Contrast, Movement and Social Variables. Renewable Energy Vol. 32: pp. 814-831.
BLM (Bureau of Land Management). 1984. Visual Resource Management. BLM Manual Handbook 8400, Release 8-24, U.S. Department of the Interior, Washington, D.C.
BLM (Bureau of Land Management). 1986a. Visual Resource Contrast Rating. BLM Manual Handbook 8431-1, Release 8-30, U.S. Department of the Interior, Washington, D.C.
BLM (Bureau of Land Management). 1986b. Visual Resource Inventory. BLM Manual Handbook 8410-1, Release 8-28, U.S. Department of the Interior, Washington, D.C.
BLM (Bureau of Land Management). 2008. Wind Energy Development Policy. Instruction Memorandum No. 2009-043, U.S. Department of the Interior, Washington, D.C. http://www.blm.gov/wo/st/en/info/regulations/Instruction_Memos_and_Bulletins/national_instruction/2009/IM_2009-043.html. Accessed 22 February 2012.
Campaign for the Protection of Rural Wales. 1999. The “Sinclair-Thomas Matrix” in Evidence to the House of Lords European Communities Committee, Sub-Committee B-Energy and Transport. Appendix 1: The Potential Visual Impact of Wind Turbines in Relation to Distance. http://www.cprw.org.uk/wind/Hlords/hlcont.htm. Accessed 16 January 2012.
Cheyenne Light, Fuel, and Power. 2011. Renewable Energy at Cheyenne Light, Fuel & Power. http://www.cheyennelight.com/renewable.htm. Accessed 20 December 2011.
Coates Associates. 2007. Cumbria Wind Energy Supplementary Planning Document. Part 2. Landscape and Visual Considerations. Prepared for the Cumbria County Council.

46
http://www.cumbria.gov.uk/elibrary/Content/Internet/538/755/2789/3943512467.pdf. Accessed 11 January 2012.
European Commission. 1995. ExternE. Externalities of Energy. Vol. 6. Wind & Hydro. http://www.externe.info/oldvolumes/vol6.pdf. Accessed 25 August 2011.
FAA (Federal Aviation Administration). 2007. Advisory Circular AC 70/7460-1K Obstruction Marking and Lighting. http://rgl.faa.gov/Regulatory_and_Guidance_Library/rgAdvisoryCircular.nsf/list/B993DCDFC37FCDC486257251005C4E21/$FILE/AC70_7460_1K.pdf. Accessed 17 February 2012.
GE (General Electric). 2011. GE’s 1.5-77 (Class I). http://www.ge-energy.com/content/multimedia/_files/downloads/GEA18768_Wind_1.5-77_Broch_r7.pdf. Accessed 14 February 2012.
Hull, R. Bruce, and Ian Bishop. 1988. Scenic Impacts of Electricity Transmission Towers: The Influence of Landscape Type and Observer Distance. Journal of Environmental Management Vol. 27: pp. 182-195.
Jallouli, Jihen, and Guillaume Moreau. 2009. An Immersive Path-Based Study of Wind Turbines’ Landscape: A French Case in Plouguin. Renewable Energy Vol. 34: pp. 597-607.
Miller, D.R., S. Bell, M. McKeen, P.L. Horne, J.G. Morrice, and D. Donnelly. 2010. Assessment of Landscape Sensitivity to Wind Turbine Development in Highland. Summary Report. Prepared by Macaulay Land Use Research Institute for the Highland Council. http://www.highland.gov.uk/NR/rdonlyres/97585EC2-C6B9-4662-B62A-434D9A36DE17/0/Item7Appendix1.pdf. Accessed 16 January 2012.
RICS Research. 2007. What is the Impact of Wind Farms on House Prices? Findings in Built and Rural Environments. http://www.rics.org/site/download_feed.aspx?fileID=3524&fileExtension=PDF. Accessed 17 May 2011.
Rocky Mountain Power. 2010a. Dunlap I. Wind Project. http://www.pacificorp.com/content/dam/pacificorp/doc/Energy_Sources/EnergyGeneration_FactSheets/RMP_GFS_Dunlap.pdf. Accessed 20 December 2011.
Rocky Mountain Power. 2010b. Rocky Mountain Power’s Wyoming Wind Projects. http://www.rockymountainpower.net/content/dam/rocky_mountain_power/doc/About_Us/Newsroom/2190-14_RMP_WYWindProjects_Flyer_v2.pdf. Accessed 20 December 2011.

47
Scottish Government. 2011. Onshore Wind Turbines. Specific Advice Sheet. http://www.scotland.gov.uk/Resource/Doc/212607/0120077.pdf. Accessed 16 January 2012.
Scottish Natural Heritage. 2006. Visual Representations of Windfarms. Good Practice Guidance. March 29, 2006. Prepared by Horner and Maclennan and Envision. http://www.snh.org.uk/pdfs/publications/heritagemanagement/Visual%20Representation%20of%20windfarms%20-%20excerpt.pdf. Accessed November 3, 2011.
Shang, Haidong, and Ian D. Bishop. 2000. Visual Thresholds for Detection, Recognition, and Visual Impact in Landscape Settings. Journal of Environmental Psychology Vol. 20: pp. 125-140.
SNH. 2009. Siting and Designing Windfarms in the Landscape. Version 1. http://www.snh.gov.uk/docs/A337202.pdf. Accessed 16 January 2012.
Tsoutsos, Theocharis, Zacharias Gouskos, Stefanos Karterakis, and Elpida Peroulaki. 2007. Aesthetic Impact from Wind Parks. http://www.massland.org/files/Aesthetic_impact_from_wind_parks.pdf. Accessed 7 June 2011.
University of Newcastle. 2002. Visual Assessment of Windfarms Best Practice. Scottish Natural Heritage Commissioned Report F01AA303A. http://www.snh.org.uk/pdfs/publications/commissioned_reports/f01aa303a.pdf. Accessed 3 June 2011.
Vissering, Jean. 2011. A Visual Impact Assessment Process for Wind Energy Projects. Clean Energy States Alliance. http://www.cleanenergystates.org/assets/2011-Files/States-Advancing-Wind-2/CESA-Visual-Impacts-Methodology-May2011.pdf. Accessed 18 November 2011.
View publication statsView publication stats