“earth observation of vegetation dynamics: global
TRANSCRIPT

“Earth observation of vegetationdynamics: global observations,
local issues, national implementation ”
Martin Herold
Wageningen University
www.fao.org/gtos/gofc-goldwww.gofc-gold.uni-jena.de Global Observations of Forest Cover and Land Dynamics
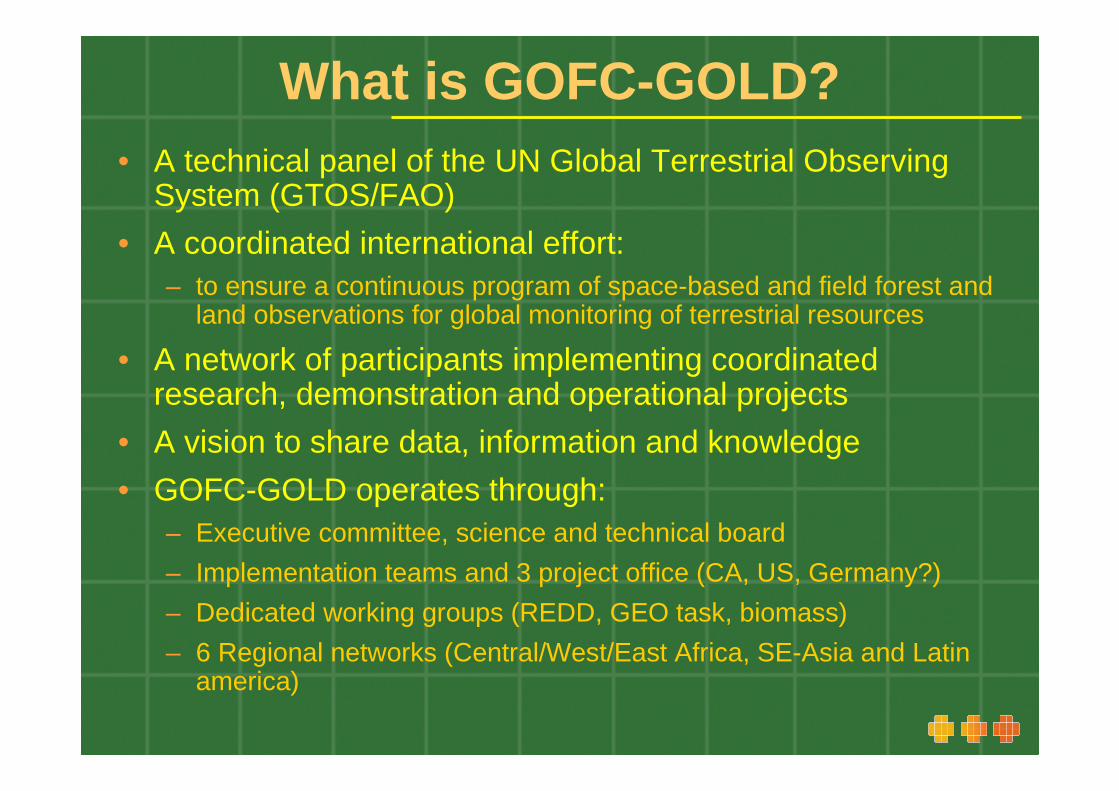
What is GOFC -GOLD?• A technical panel of the UN Global Terrestrial Observing
System (GTOS/FAO)
• A coordinated international effort: – to ensure a continuous program of space-based and field forest and
land observations for global monitoring of terrestrial resources
• A network of participants implementing coordinated research, demonstration and operational projects
• A vision to share data, information and knowledge
• GOFC-GOLD operates through:– Executive committee, science and technical board
– Implementation teams and 3 project office (CA, US, Germany?)
– Dedicated working groups (REDD, GEO task, biomass)
– 6 Regional networks (Central/West/East Africa, SE-Asia and Latin america)

Integrated land cover observations
From Herold et al 2008, IEEE Systems
Effort
for f
requen
t updat
e
Thematic detail
Spa
tial d
etai
l
high
highlow
Assuming observation continuity and consistency
IN-SITU (+ IKONOS type)periodically (usually 1-10 yrs)
Detailed physiognomyFloristics and species distributionLand use: i.e. crop type/rotationCalibration and validation
high
LANDSAT/SPOT – typeinter-annual (1-5 yrs)
Vegetation physiognomy
Land change processes
Land type/Phenology
MODIS
/MERIS
(intra
-)ann
ual
patte
rnLo
ng-te
rm
trend
s

In-situperiodically(10-15 yrs)
In-situperiodically(10-15 yrs)
high
high
highlowthematic detail
spat
iald
etai
lup
date
effo
rt
�veg. physionomy �local patterns
�phenology
Integrated concepts for ecosystem assessment
land-cover information
LandsatInter-annual
1-3 yrs
�life form �cover�height�species richness�species abundance�soil properties
MODIS8 days

Vegetation type mapping in the Kalahari
Bottom-up vegetation mapping
422 relevé point data available
Upscaling from point to a coarse MODIS scale (232-m pixel size)
Classification of 16-day MODIS time series using Random Forests
In-situ
Landsat
MODIS

Vegetation type mapping in the Kalahari
(Hüttich et al. 2009)

Effect of aquisition time and temporal composite on mapping accuracy

Integrated land cover observations
From Herold et al 2008, IEEE Systems
Effort
for f
requen
t updat
e
Thematic detail
Spa
tial d
etai
l
high
highlow
Assuming observation continuity and consistency
IN-SITU (+ IKONOS type)periodically (usually 1-10 yrs)
Detailed physiognomyFloristics and species distributionLand use: i.e. crop type/rotationCalibration and validation
high
LANDSAT/SPOT – typeinter-annual (1-5 yrs)
Vegetation physiognomy
Land change processes
Land type/Phenology
MODIS
/MERIS
(intra
-)ann
ual
patte
rnLo
ng-te
rm
trend
s

Harmonized land cover characterization
Existing global land cover datasets
Deciduous
ArtificialSnow & Ice
BareHerbaceous
Shrubs
Common land cover classifiers (LCCS)
Trees
Cover type/ life form
Evergreen
Leaf longevity
Leaf type
Broadleaved
Needle-leaved Cultivated/managedAquatic/
flooded
“Living” validation database for comparative assessment

SYNMAP – for carbon cycle modeling
SYNMAP – a global synthesis product of existing global land cover maps to provide a targeted and improved land cover map for carbon cycle modelling purposes; here shown as life form assemblages (Source: M. Jung et al. 2006, Remote Sensing of Environment).

GLOBCOVER (2005/6)
Dataset release: September 2008

Thematic standards Reference database (GLC2000)
Comparative validation & assessment

Thematic standards Reference database (GLC2000)
Comparative validation & assessment
Probability

FAO FRA 2010 –remote sensing survey
~ 13,500 monitoring
sites

IPCC 4th assessment report
Source: http://ipcc-wg1.ucar.edu/wg1/Report/AR4WG1_Pub_TS.pdf

Local issues
Martin Herold
Wageningen University
www.fao.org/gtos/gofc-goldwww.gofc-gold.uni-jena.de Global Observations of Forest Cover and Land Dynamics

Integrated land cover observations
From Herold et al 2008, IEEE Systems
Effort
for f
requen
t updat
e
Thematic detail
Spa
tial d
etai
l
high
highlow
Assuming observation continuity and consistency
IN-SITU (+ IKONOS type)periodically (usually 1-10 yrs)
Detailed physiognomyFloristics and species distributionLand use: i.e. crop type/rotationCalibration and validation
high
LANDSAT/SPOT – typeinter-annual (1-5 yrs)
Vegetation physiognomy
Land change processes
Land type/Phenology
MODIS
/MERIS
(intra
-)ann
ual
patte
rnLo
ng-te
rm
trend
s

Ground-based LIDAR measuremehts
3/15/2010
Ground-based full waveform lidar. Lidar pulses (1064nm) strike a rotating mirror at an angle of 45°, provide a scan through zenith angles of ±130°in a v ertical circle. As the instrument rotates on its vertical axis, data from all azimuths are acquired.
Courtesy/Cooperation/Boston University and CSIRO Australia

Hard & Soft Returns in EVI DataHard & Soft Returns in EVI Data
Tree Trunk Foliage
Courtesy/Cooperation/Boston University and CSIRO Australia

McKinley Sequoia Grove
Courtesy/Cooperation/Boston University and CSIRO Australia

Laboratory spectro�goniometer system
full BRDF
Angular measurements of:
- ReflectanceASD Fielspec 3 + Solar illuminator
- TemperatureNEC imaging thermal camera
- FluorescenceLaser + camera / fieldspec

Soil spectroscopy for Methane emissions: Data collection
� Soil sampling� Profile descriptions along transects� Plot sampling (dec vs slightly dec)� Spectral measurements� Chemical analysis for model
calibration (pH, C, N, K, P)
� Vegetation descriptions� Species composition� Fractional cover estimates� Spectral measurements
� Hyperion image
Art, Science and Applications of Reflectance Spectroscopy Symposium, February 23�25, 2010, Boulder, CO, USA

Soil spectral analysis
2.511.972.651.171.79RPD
4.6940.257171.64636.8970.4RMSE
0.8410.7470.8560.3010.683R2
99964No of Factors
MCMCMCMCCentre/scale
Med10Med8Med8SG23De-noising
R2LogR2LogR2LogR2LogR2LogData transformations
Total C(%)
Total N(%)
Total K(mg/100g)
Total P(mg/100g)
pH

National issues and implementation
Martin Herold
Wageningen University
www.fao.org/gtos/gofc-goldwww.gofc-gold.uni-jena.de Global Observations of Forest Cover and Land Dynamics

Prominent international political drivers
1. United Framework Convention on Climate Change:
� Reduce uncertainties in monitoring the global climate system through observing
essential climate variables (ECV)
� Capacity building needs to address stronger role of developing countries in post-
2012 agreement - Reducing emissions from deforestation (REDD)
2. Provide societal benefits through evolving land
observations as part of a Global Earth Observation
System of Systems (GEOSS)
4. Global Monitoring for Environment and Security
(GMES)
5. Effectiveness for global assessments:
� IPCC, UN-FAO forest resources assessment etc.
� Ongoing global land cover mapping activities (GLOBCOVER, MODIS)

Key issues for observing ECV ’s
www.fao.org/gtos/topcECV.html
1. Building upon coordinated observations
2. Standardized and integrated mapping
3. Independent accuracy assessment
4. Synergy among datasets and different ECV products
5. User engagement

Observing land cover as ECV
www.fao.org/gtos/topcECV.html

Current distribution of aboveground biomass

Terrestrial carbon lost through human activities
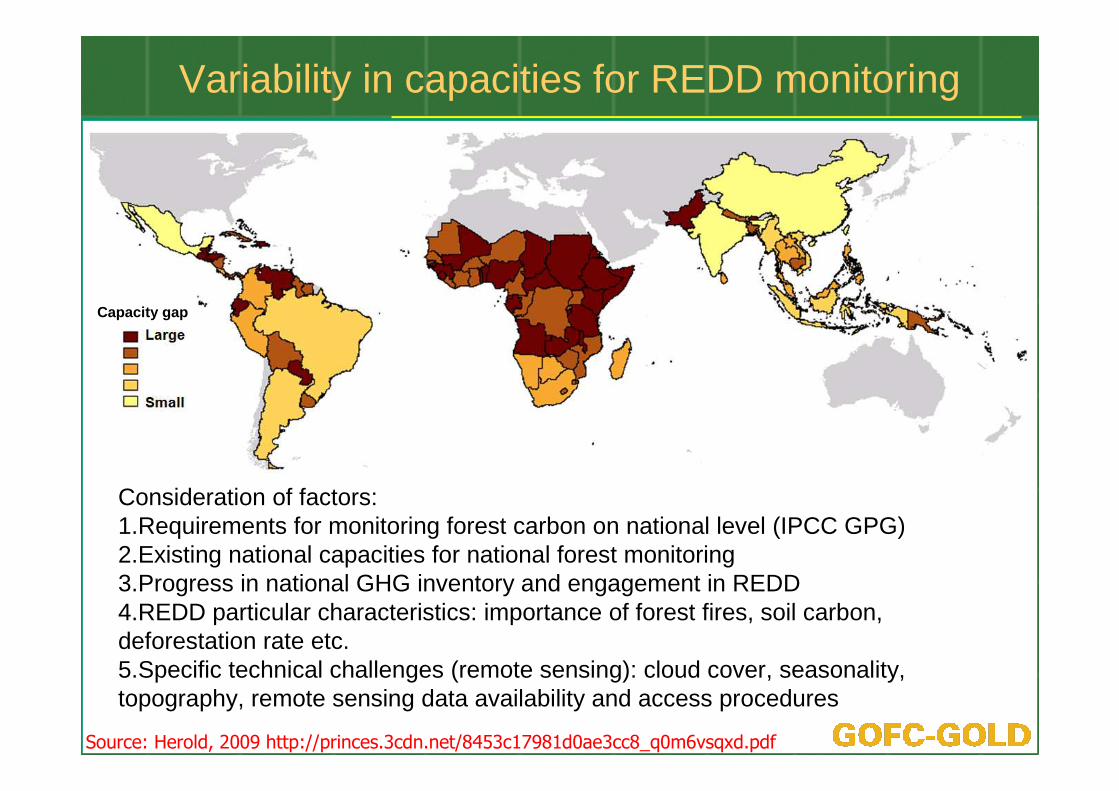
Variability in capacities for REDD monitoring
Consideration of factors:1.Requirements for monitoring forest carbon on national level (IPCC GPG)2.Existing national capacities for national forest monitoring3.Progress in national GHG inventory and engagement in REDD4.REDD particular characteristics: importance of forest fires, soil carbon, deforestation rate etc.5.Specific technical challenges (remote sensing): cloud cover, seasonality, topography, remote sensing data availability and access procedures
Capacity gap:
Capacity gap
Source: Herold, 2009 http://princes.3cdn.net/8453c17981d0ae3cc8_q0m6vsqxd.pdf
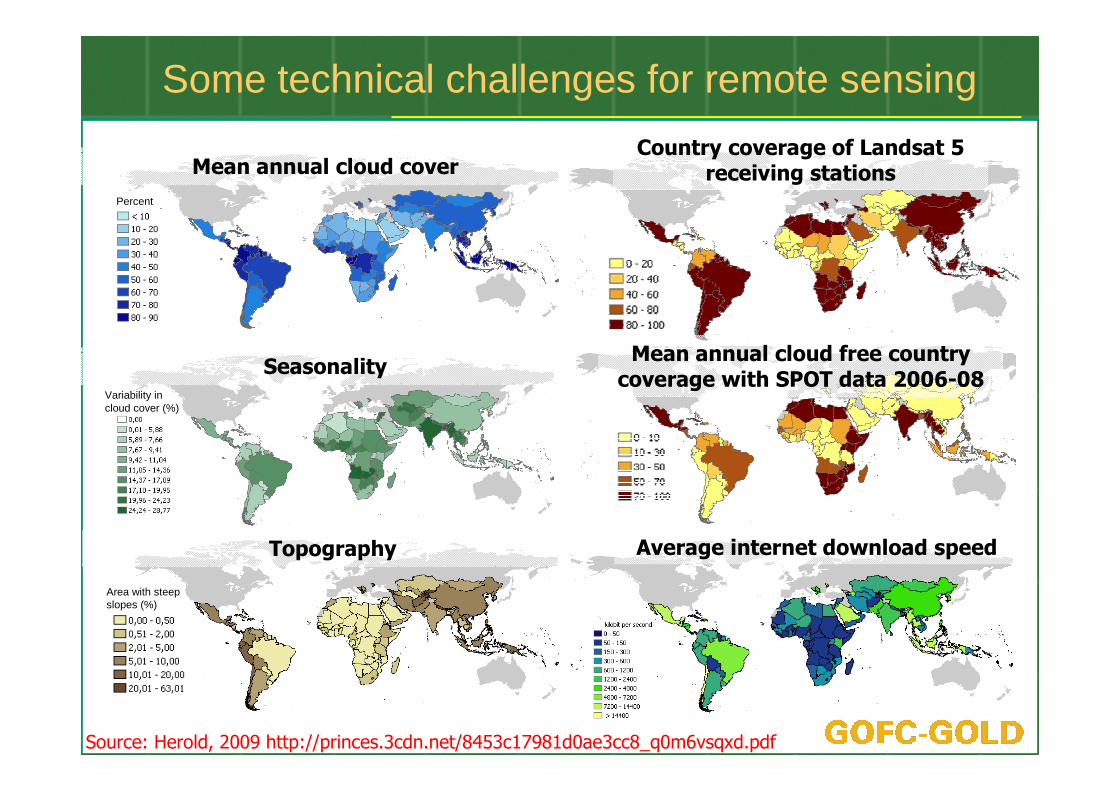
Some technical challenges for remote sensing
Mean annual cloud cover
Seasonality
Topography
Country coverage of Landsat 5 receiving stations
Mean annual cloud free country coverage with SPOT data 2006-08
Average internet download speed
Percent
Variability in cloud cover (%)
Area with steep slopes (%)
Source: Herold, 2009 http://princes.3cdn.net/8453c17981d0ae3cc8_q0m6vsqxd.pdf

Earth observation contribution to UNFCCC-REDD
2005
GOFC-GOLD working group est.
COP11Montreal
GTOSsubmission I
Subm. of view by parties I
1st GOFC-GOLD workshop
ED/GOFCSBSTA
side event
SBSTA 24
1st SBSTA workshop
GTOS/GOFCreport
COP12Nairobi
ESA/GOFCSide event +
booth
Subm. of view by parties II
2nd SBSTA workshop
SBSTA 26
2nd GOFC-GOLD workshop
ESA/GOFC-GOLD
side event
GTOSsubmission II
COP13Bali
1.+ 2. REDD Sourcebook draft
WINROCK/GOFC-GOLDside event
2006 2007 2008 2009
Subm. of view by parties III + IV
GTOSsubmission III
SBSTA 28
GTOS/GOFC-GOLD
side event
3rd GOFC-GOLD workshop
COP14Poznan
3rd SBSTA workshop
SBSTA 30COP15Copenh.
PNG / GOFC-GOLDside event
Informal REDDworkshop
GOFC-GOLDside event
3. REDD Sourcebook version
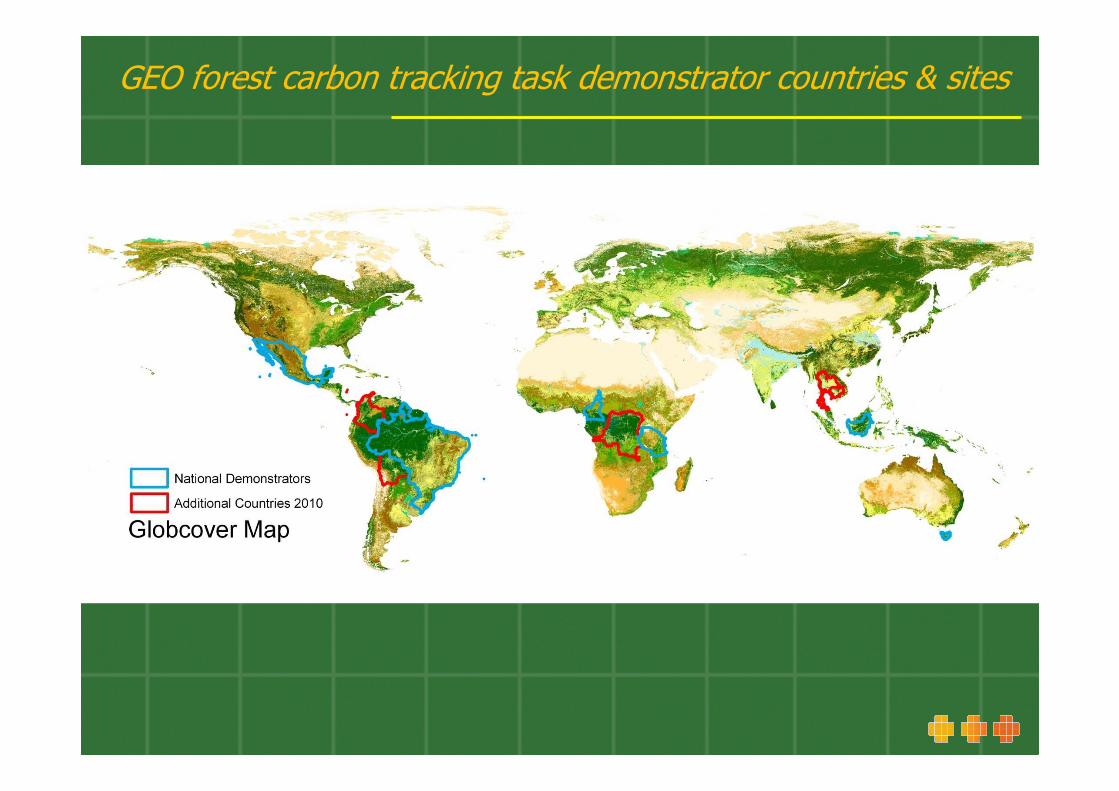
GEO forest carbon tracking task demonstrator countries & sites

Remote sensing support for carbon estimation
�Direct quantitative biomass mapping from space remains
a challenge for national level estimations
�Existing capabilities:
� Satellite observation may help to map some specific forest
types (i.e. mangroves, plantations etc.)
� Targeted remote surveys to support carbon monitoring:
• Very high resolution satellite or airborne data of air-photo quality to assist field surveys
• Sensitivity of LIDAR and long-wave RADAR observations
• Integration of in-situ and satellite data for large scale biomass mapping
• Direct estimation of emissions from fire radiative power
� Technologies are not operational globally but evolving

Some key issues• Availability of baseline observations on all scales
• In situ data as weakest point?
• Take advantage of full remote sensing potentials• New sensors (Sentinels, ESA-BIOMASS)
• Verification of land (area) change for scientific credibility and compliance
• From land cover to change in land use and dynamic biophysical parameters
• Synergy different ECV observations and products (i.e. fire, biophysical parameters, snow)
• Global monitoring, local issues and cal/val, and national implementation are country specific issues!

WRSLN: Werkgemeenschap voor
remote sensing in landbouw en
natuurbeheer

Members
� vacancy (chair)
� ir. M.C. Bronsveld, ITC
� dr.ir. A. van Dijk, DHV
� dr. R.J.A. Grim (NSO)
� ir. P. Hoefsloot (Hoefsloot Software)
� ir. I. Janssen, RWS�DID
� prof.dr. S.M. de Jong, UU
� dr.ir. R.E.E. Jongschaap, PRI
� ir. A. Klaasse, WaterWatch
� dr.ir. H.J.C. van Leeuwen (Argeops)
� Dr.ir. C.A. Mücher, Alterra
� dr.ir. P.J. van Oevelen, GEWEX
� ir. A. Rosema, EARS
� ir. C. v.d. Sande, NEO
� ir. C. Schotten, PBL
� dr. R. Sluiter (KNMI)
� prof.dr. W. Verhoef, ITC
� dr. R.A. Roebeling, KNMI
� dr.ir. J.G.P.W. Clevers (secretary)
In white the “active” members

Mission
� The WRSLN is an independent platform where experts from government, science and industry participate on the theme remote sensing and land applications.
� The group promotes national cooperation, coordinates research activities, informs (potential) users and advises authorities in organizational, programmatic and research specific issues within the mentioned theme.

Objectives
� Act as intermediate between the field and (inter)national agencies
� Stimulate cooperation and exchange of information between persons and institutions active in the field of land applications with RS
� Develop a vision on the chances and threats of RS for the land domain, supported by members from government, industry and research
� Increase awareness of remote sensing possibilities for land applications

Some key issues
� Political developments poses new requirements on land remote sensing of national and international importance
� Lack of strategic investments in land remote sensing within the Netherlands
� Potential to foster improved services (uses and users national/international), education and more fundamental research (new sensors, technologies and applications)
� NSO perspectives on roles and mandates for WRSNL
� WRSNL should be ready to respond
� WUR remote sensing keen to continue/increase efforts