ears5136slide 1 introduction to reservoir-scale deformation and structural core description
TRANSCRIPT

EARS5136 slide 1
Introduction toreservoir-scale deformation
and structural core description
EARS5136 slide 2
Reservoir scale deformation
• Small scale faults and fractures plus the internal structure of faults revealed by core and image logs
• Introduce basics of structural core description
• Aim to visit core store later in course
EARS5136 slide 3
Core basics
• Various diameters: 2” to 6”, 4” (10cm) commonest
• Runs of up to 120 feet per core (30’ to 60’ common)
• ‘Drillers’ depth not measured (log) depth
• Usually slabbed before logging
• Stored in 3ft, 4ft, 1m boxed lengths
• Half cut common
• Resinated ‘museum’ core also common

EARS5136 slide 4
Core orientationL R
Up
Core marked to show ‘way-up’

EARS5136 slide 5
Core to log shift
• Core taken whilst drilling
• Logs taken after drilling
• Stretch of log tool cable means that measured depth (log) and driller’s depth (core) do not correspond
• Apply a shift +’ve or –’ve to correlate core and logs
• Core gamma used to pick shifts

EARS5136 slide 6
What to record?
• Core width
• Continuous core sections
• Fault or fracture length - cuts centreline?
• Fault or fracture width
• Number of tips/terminations: upper or lower
• Layer boundaries?
• Displacement
• Slip sense/direction

EARS5136 slide 7
What to record 2
• Fracture spacing
• Cross-cutting relationships
• Intersection angle of sets
• Fault rock type: cataclasites/disaggregation, PFFR, clay-smear
• Shale/phyllosilicate smear – abrasion– shear zone– injection
• Cementation: whole or part

EARS5136 slide 8
What to record 3
• Clast sizes - cataclasite to breccia
• Distribution with respect to lithology
• Surface markings – fractography
• Rubble zones
• Natural vs. Induced

EARS5136 slide 9
Recognition of natural fractures
• Cementation
• No geometric relationship with core
• Shear offset
• Planar
• Propagation along bedding not down core
• Multiple sets
EARS5136 slide 10
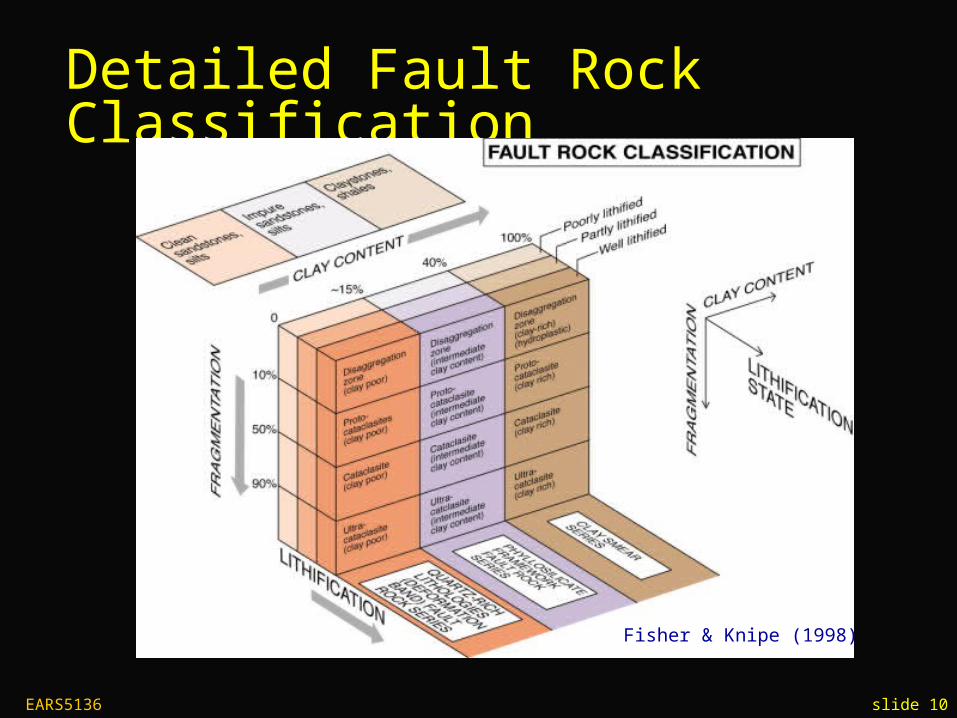
Detailed Fault Rock Classification
Fisher & Knipe (1998)

EARS5136 slide 11
Faults in core
EARS5136 slide 12
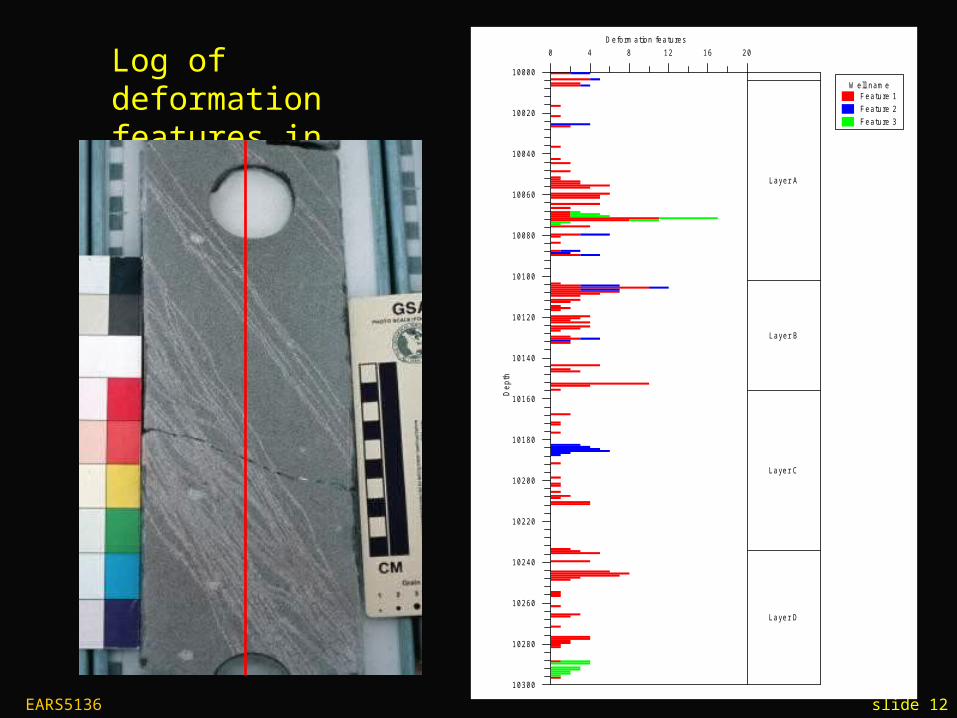
Log of deformation features in core
0 4 8 12 16 20
D eform ation features
10000
10020
10040
10060
10080
10100
10120
10140
10160
10180
10200
10220
10240
10260
10280
10300
De
pth
Layer A
Layer B
Layer C
Layer D
W ell nam eFeature 1
Feature 2
Feature 3

EARS5136 slide 13
Naturalfractures
Fracture spacing and layer boundaries in Chalk core

EARS5136 slide 14
S p a cin g :th ickn e ss ra tioM axim um S /T = 0 .92
Average S /T = 0.42
M in im um S /T = 0.09
0 0.5 1 1.5Fra ctu re sp a cin g (m )
0
0.5
1
1.5
La
yer
thic
kne
ss (
m)
C ore d iam eter10cm
M axim um layerth ickness 1.22m
Average layerth ickness 0.49m
M inim um layerth ickness 0.16m
Fracture spacing vs. layer thickness: what is visible in core?
Closer than average
Wider than average
EARS5136 slide 15
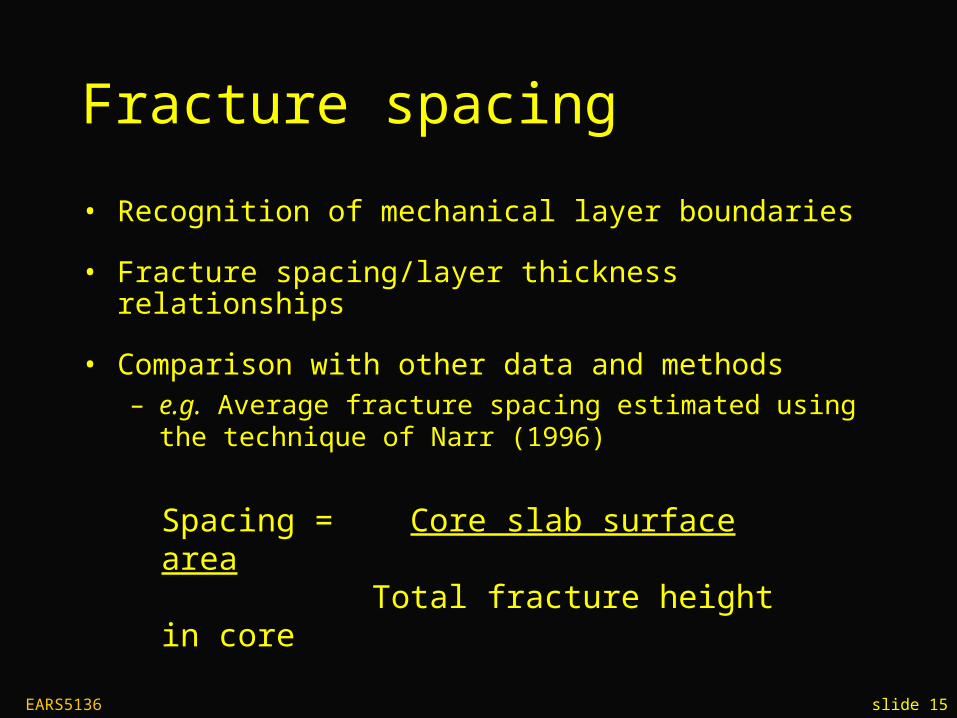
Fracture spacing
• Recognition of mechanical layer boundaries
• Fracture spacing/layer thickness relationships
• Comparison with other data and methods– e.g. Average fracture spacing estimated using the technique
of Narr (1996)
Spacing = Core slab surface area Total fracture height in core

EARS5136 slide 16
Core orientation
• Scribed core
• Palaeomagnetic
• Dipmeter
• Image logs

EARS5136 slide 17
Orientation of deformation features relative to bedding

EARS5136 slide 18
Fracture spacing
EARS5136 slide 19
Coring induced fractures
• Can be mistaken for natural uncemented fractures and so influence identification of productive zones
• Types recognized using characteristic fracture surface morphology or fracture geometry:
– Centreline fractures
– Petal fractures
– Torsional fractures
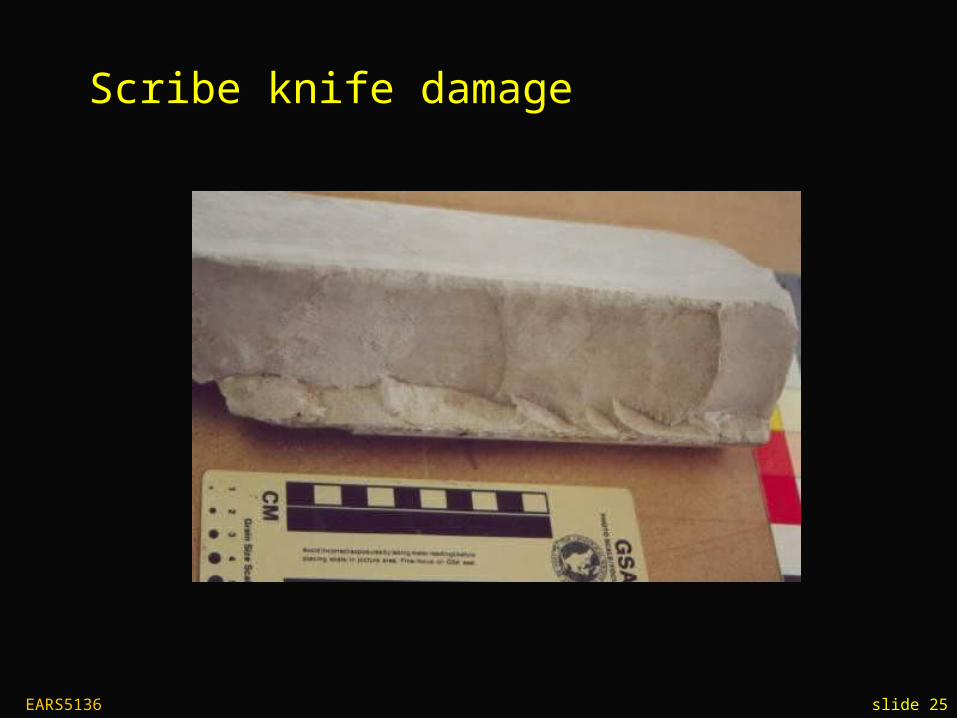
– Scribe-knife related
– Core-plug related
– Unloading

EARS5136 slide 20
Fracture surface morphology

EARS5136 slide 21
Arrest lines indicating Propagation down core

EARS5136 slide 22
Petal-centreline fractures
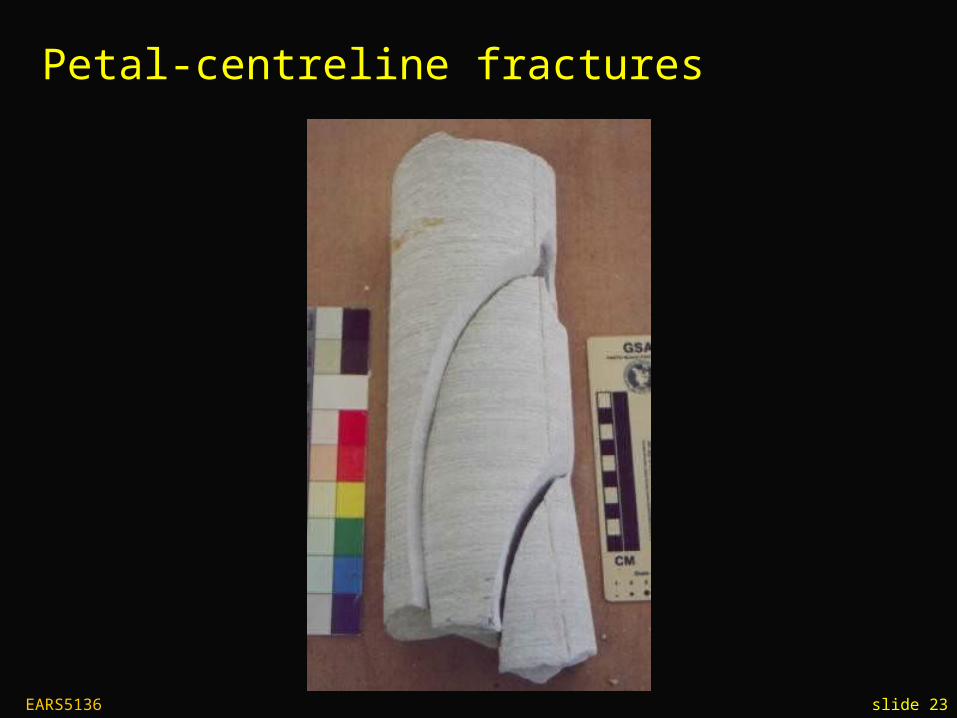
EARS5136 slide 23
Petal-centreline fractures
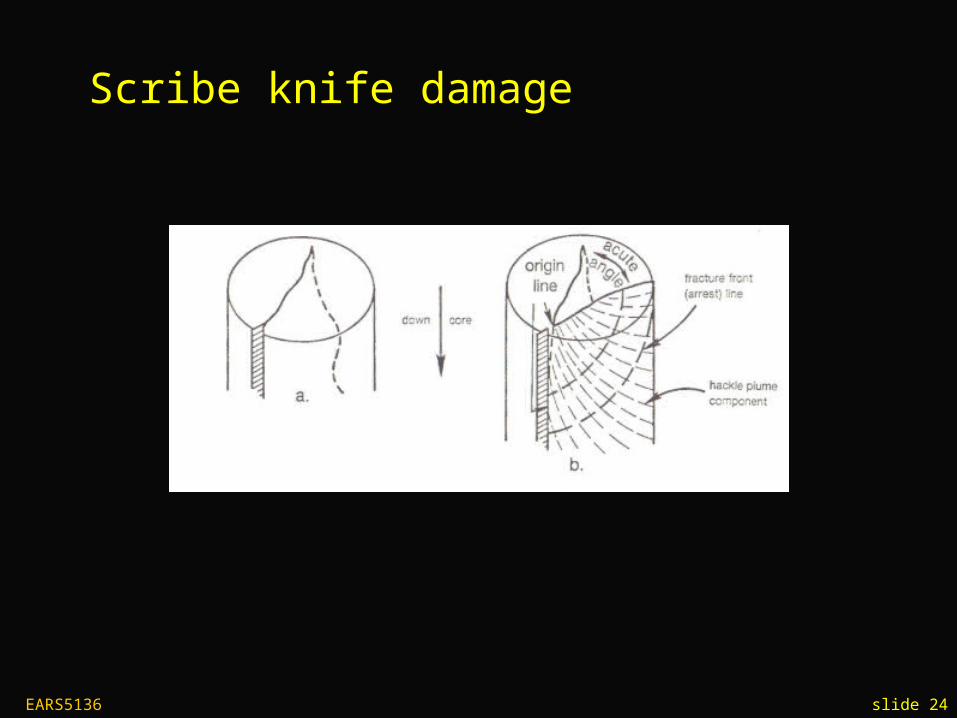
EARS5136 slide 24
Scribe knife damage
EARS5136 slide 25
Scribe knife damage

EARS5136 slide 26
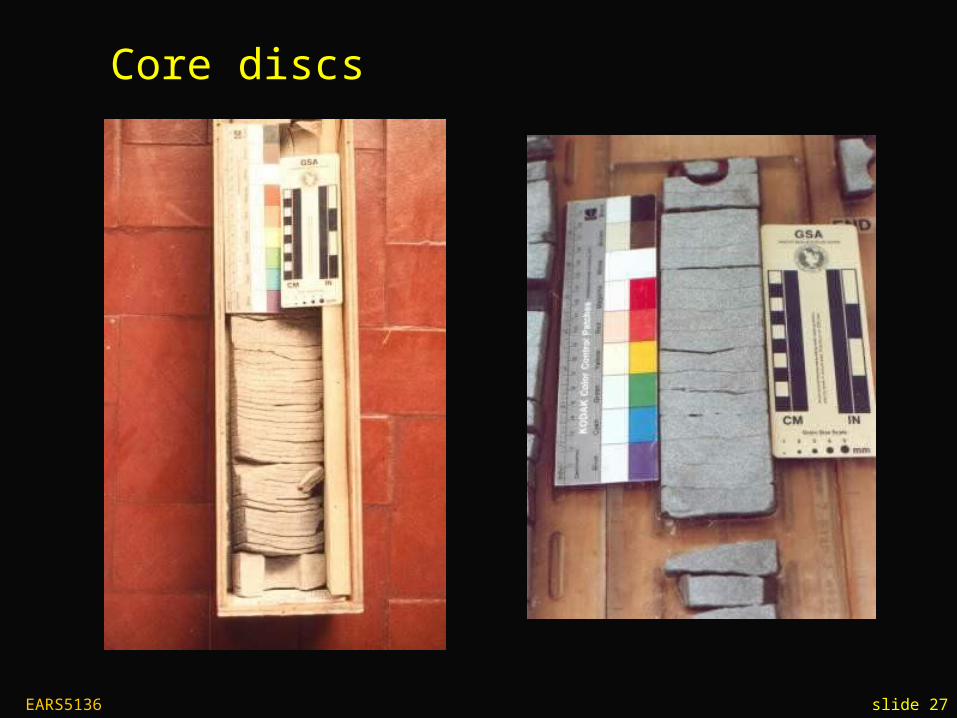
Core discs
EARS5136 slide 27
Core discs

EARS5136 slide 28
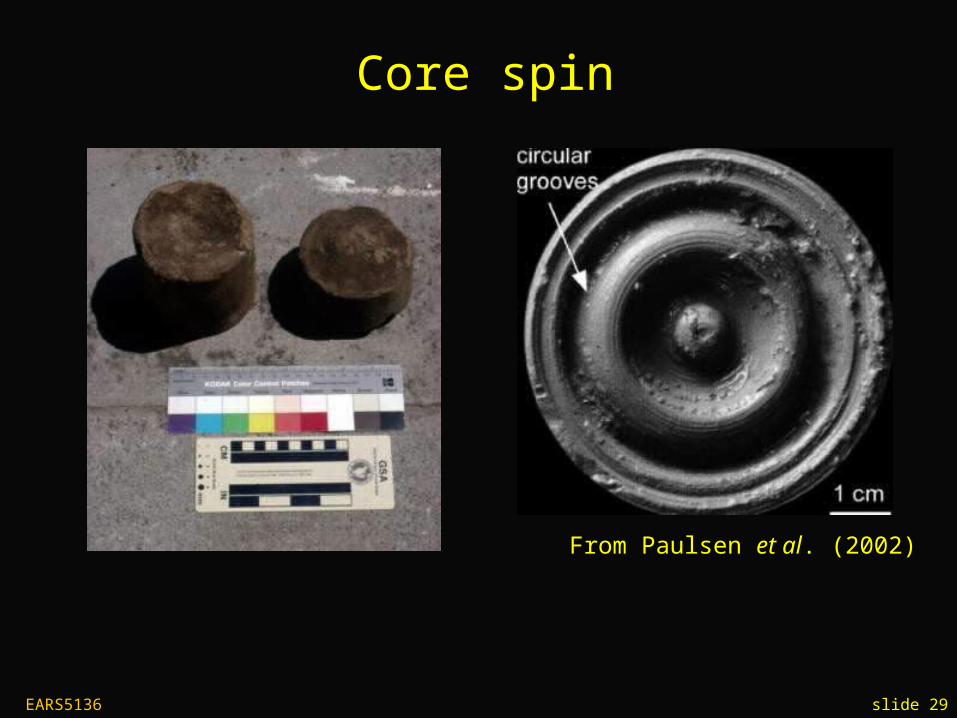
Torsional fracturesCore disc
EARS5136 slide 29
Core spin
From Paulsen et al. (2002)

EARS5136 slide 30
Rubble zones in core
• Induced
• Often at base of a core
• Can develop where lithologies change
• May correlate with ROP changes

EARS5136 slide 31
Image logs
• Sonic or resistivity tools
• FMI – Shows a resistivity image of the borehole wall
• UBI/CBIL – Show an acoustic image of the borehole wall
EARS5136 slide 32
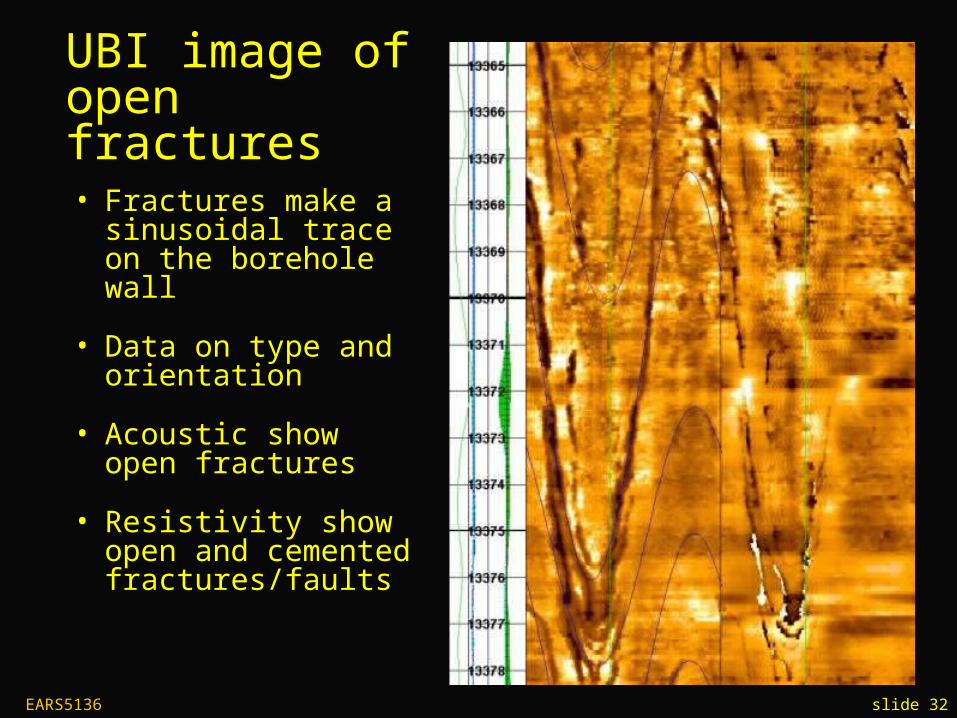
UBI image of open fractures
• Fractures make a sinusoidal trace on the borehole wall
• Data on type and orientation
• Acoustic show open fractures
• Resistivity show open and cemented fractures/faults

EARS5136 slide 33
Faults on FMI log
• Offsets visible although throw is difficult to measure
• Dip changes may be visible
• Core to log – about 5 times number of features observable in core.

EARS5136 slide 34
High resolution image logs allow identification of minor, narrow-aperture fractures when calibrated against core