earnings release cresud iq12
TRANSCRIPT
Earnings Release
IQ FY 2020
1
CRESUD invites you to participate in its first quarter of the Fiscal Year 2020 conference call
Tuesday, November 12, 2019, at 10:00 AM (Eastern Time)
The call will be hosted by:
Alejandro Elsztain, CEO
Carlos Blousson, Gen Mgr of Argentina & Bolivia
Matías Gaivironsky, CFO
If you would like to participate, please call:
1-412-317-6377 (International) or
1-844-686-3840 (Toll Free USA)
54-11-39845677 (Argentina Dial-In)
ID#CRESUD
In addition, you can access through the following webcast:
https://webcastlite.mziq.com/cover.html?webcastId=1c7d1324-260e-4a0f-bc3d-d80ff0941cac
Preferably, 10 minutes before the call is due to begin.
The conference will be held in English.
PLAYBACK
Available until November 19, 2019
1-877-344-7529
1-412-317-0088
Access Code: 10136634
Contact Information Tel: +54 11 4323 7449
Alejandro Elsztain – CEO E-mail: [email protected]
Matías Gaivironsky – CFO Website: http://www.cresud.com.ar
2
• Net result for the first quarter of fiscal year 2020 recorded a gain of ARS 6,942 million compared to a gain of
ARS 5,377 million in the same quarter of fiscal year 2019 mainly explained by the result from the loss of control
and deconsolidation of the company Gav- Yam in the Israel business center through IRSA.
• Net result attributable to the controlling shareholder registered a loss of ARS 2,335 million compared to a gain
of ARS 919 million in the first quarter of 2019.
• Adjusted EBITDA for the period reached ARS 6,811 million, of which ARS 1,273 million come from the
agricultural business due to higher productive results of sugarcane and cattle activity offset by lower results
from farmland sales and ARS 5,538 million come from the urban properties and investments business (IRSA).
• A 2020 campaign with good weather conditions is projected in the region in which we expect to plant
approximately 268,000 ha.
• Regarding farmland sales, our subsidiary Brasilagro has completed a partial sale of 1,134 hectares of its Jatobá
farm (Jaborandi - Bahía) for an amount of BRL 22.7 million.
• On October 30, our Shareholders' Meeting has approved a distribution among its shareholders of 13,000,000
treasury shares, representing 2.6% of the share capital.
Main Highlights
3
I. Brief comment on the Company’s activities during the period, including references to significant events
occurred after the end of the period.
Consolidated Results
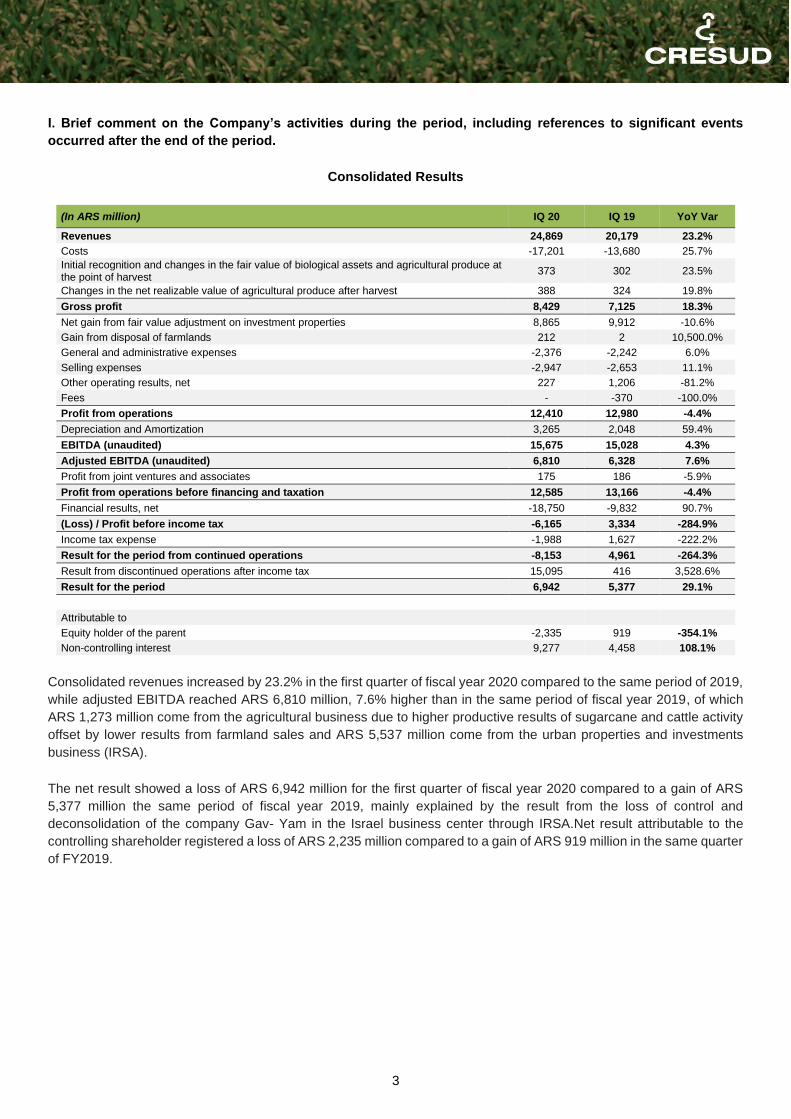
(In ARS million) IQ 20 IQ 19 YoY Var
Revenues 24,869 20,179 23.2%
Costs -17,201 -13,680 25.7%
Initial recognition and changes in the fair value of biological assets and agricultural produce at the point of harvest
373 302 23.5%
Changes in the net realizable value of agricultural produce after harvest 388 324 19.8%
Gross profit 8,429 7,125 18.3%
Net gain from fair value adjustment on investment properties 8,865 9,912 -10.6%
Gain from disposal of farmlands 212 2 10,500.0%
General and administrative expenses -2,376 -2,242 6.0%
Selling expenses -2,947 -2,653 11.1%
Other operating results, net 227 1,206 -81.2%
Fees - -370 -100.0%
Profit from operations 12,410 12,980 -4.4%
Depreciation and Amortization 3,265 2,048 59.4%
EBITDA (unaudited) 15,675 15,028 4.3%
Adjusted EBITDA (unaudited) 6,810 6,328 7.6%
Profit from joint ventures and associates 175 186 -5.9%
Profit from operations before financing and taxation 12,585 13,166 -4.4%
Financial results, net -18,750 -9,832 90.7%
(Loss) / Profit before income tax -6,165 3,334 -284.9%
Income tax expense -1,988 1,627 -222.2%
Result for the period from continued operations -8,153 4,961 -264.3%
Result from discontinued operations after income tax 15,095 416 3,528.6%
Result for the period 6,942 5,377 29.1%
Attributable to
Equity holder of the parent -2,335 919 -354.1%
Non-controlling interest 9,277 4,458 108.1%
Consolidated revenues increased by 23.2% in the first quarter of fiscal year 2020 compared to the same period of 2019,
while adjusted EBITDA reached ARS 6,810 million, 7.6% higher than in the same period of fiscal year 2019, of which
ARS 1,273 million come from the agricultural business due to higher productive results of sugarcane and cattle activity
offset by lower results from farmland sales and ARS 5,537 million come from the urban properties and investments
business (IRSA).
The net result showed a loss of ARS 6,942 million for the first quarter of fiscal year 2020 compared to a gain of ARS
5,377 million the same period of fiscal year 2019, mainly explained by the result from the loss of control and
deconsolidation of the company Gav- Yam in the Israel business center through IRSA.Net result attributable to the
controlling shareholder registered a loss of ARS 2,235 million compared to a gain of ARS 919 million in the same quarter
of FY2019.

4
Description of Operations by Segment
3M 2020
Urban Properties and Investments
Variation
Agribusiness Argentina Israel Subtotal Total 3M 20 vs.
3M 19
Revenues 6,394 2,642 15,329 17,971 24,365 24.7%
Costs -5,500 -544 -10,554 -11,098 -16,598 27.9%
Initial recognition and changes in the fair value of biological assets and agricultural produce at the point of harvest
340 - - - 340 26.9%
Changes in the net realizable value of agricultural produce after harvest
388 - - - 388 19.8%
Gross profit 1,622 2,098 4,775 6,873 8,495 18.7%
Net gain from fair value adjustment on investment properties 18 9,248 - 9,248 9,266 -16.7%
Gain from disposal of farmlands 212 - - - 212 10,500.0%
General and administrative expenses -275 -473 -1,643 -2,116 -2,391 6.2%
Selling expenses -563 -220 -2,175 -2,395 -2,958 11.3%
Other operating results, net 259 -56 -6 -62 197 -83.4%
Profit from operations 1,273 10,597 951 11,548 12,821 -12.0%
Share of profit of associates 81 253 -463 -210 -129 -66.1%
Segment Profit 1,354 10,850 488 11,338 12,692 -10.5%
3M 2019
Urban Properties and Investments
Agribusiness Argentina Israel Subtotal Total
Revenues 3,903 2,765 12,875 15,640 19,543
Costs -3,234 -559 -9,185 -9,744 -12,978
Initial recognition and changes in the fair value of biological assets and agricultural produce at the point of harvest
268 - - - 268
Changes in the net realizable value of agricultural produce after harvest
324 - - - 324
Gross profit 1,261 2,206 3,690 5,896 7,157
Net gain from fair value adjustment on investment properties -11 11,138 - 11,138 11,127
Gain from disposal of farmlands 2 - - - 2
General and administrative expenses -291 -470 -1,491 -1,961 -2,252
Selling expenses -297 -258 -2,102 -2,360 -2,657
Other operating results, net 558 9 618 627 1,185
Profit from operations 1,222 12,625 715 13,340 14,562
Share of profit of associates 11 14 -405 -391 -380
Segment profit 1,233 12,639 310 12,949 14,182
Agricultural Business
Period Summary
The 2020 Campaign is beginning with good weather conditions in the region. A neutral “Niño” phenomenon with good
water profile is expected again, so we expect a good level of crop production, average yields and controlled costs.
Regarding farmland sales, our subsidiary Brasilagro has completed in the first quarter of FY 2020 the sale of a fraction
of 1,134 hectares of the “Jatobá” farm located in Jaborandi, State of Bahia, Brazil for an amount of BRL 22.7 million and
subsequently, it has sold a small fraction of 85 hectares of its “Alto Taquarí” farm, located in the State of Mato Grosso,
for BRL 5.5 million.
5
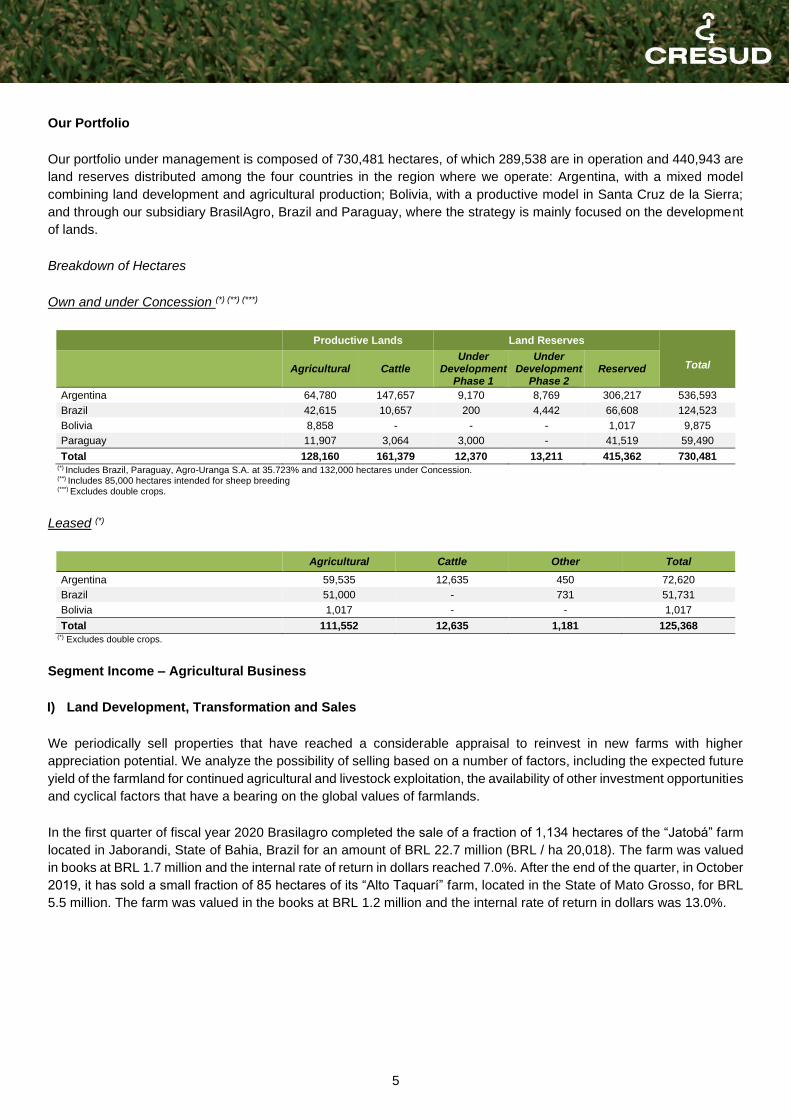
Our Portfolio
Our portfolio under management is composed of 730,481 hectares, of which 289,538 are in operation and 440,943 are
land reserves distributed among the four countries in the region where we operate: Argentina, with a mixed model
combining land development and agricultural production; Bolivia, with a productive model in Santa Cruz de la Sierra;
and through our subsidiary BrasilAgro, Brazil and Paraguay, where the strategy is mainly focused on the development
of lands.
Breakdown of Hectares
Own and under Concession (*) (**) (***)
Productive Lands Land Reserves
Total
Agricultural Cattle
Under Development
Phase 1
Under Development
Phase 2 Reserved
Argentina 64,780 147,657 9,170 8,769 306,217 536,593
Brazil 42,615 10,657 200 4,442 66,608 124,523
Bolivia 8,858 - - - 1,017 9,875
Paraguay 11,907 3,064 3,000 - 41,519 59,490
Total 128,160 161,379 12,370 13,211 415,362 730,481 (*) Includes Brazil, Paraguay, Agro-Uranga S.A. at 35.723% and 132,000 hectares under Concession. (**) Includes 85,000 hectares intended for sheep breeding (***) Excludes double crops.
Leased (*)
Agricultural Cattle Other Total
Argentina 59,535 12,635 450 72,620
Brazil 51,000 - 731 51,731
Bolivia 1,017 - - 1,017
Total 111,552 12,635 1,181 125,368 (*) Excludes double crops.
Segment Income – Agricultural Business
I) Land Development, Transformation and Sales
We periodically sell properties that have reached a considerable appraisal to reinvest in new farms with higher
appreciation potential. We analyze the possibility of selling based on a number of factors, including the expected future
yield of the farmland for continued agricultural and livestock exploitation, the availability of other investment opportunities
and cyclical factors that have a bearing on the global values of farmlands.
In the first quarter of fiscal year 2020 Brasilagro completed the sale of a fraction of 1,134 hectares of the “Jatobá” farm
located in Jaborandi, State of Bahia, Brazil for an amount of BRL 22.7 million (BRL / ha 20,018). The farm was valued
in books at BRL 1.7 million and the internal rate of return in dollars reached 7.0%. After the end of the quarter, in October
2019, it has sold a small fraction of 85 hectares of its “Alto Taquarí” farm, located in the State of Mato Grosso, for BRL
5.5 million. The farm was valued in the books at BRL 1.2 million and the internal rate of return in dollars was 13.0%.

6
in ARS million IQ 20 IQ 19 Var a/a
Revenues - - -
Costs -5 -6 -16.7%
Gross loss -5 -6 -16.7%
Net gain from fair value adjustment on investment properties 18 -11 -
Gain from disposal of farmlands 212 2 10,500.0%
General and administrative expenses -1 - -
Other operating results, net 95 308 -69.2%
Profit from operations 319 293 8.9%
Segment profit 319 293 8.9%
EBITDA 320 296 8.1%
Adjusted EBITDA 302 1,519 -80.1%
Area under Development (hectares) Projected for
2019/2020 Developed in
2018/2019
Argentina 8,769(1) 2,946
Brasil 4,442 4,442
Paraguay - 1,976
Total 13,211 9,364
(1) Includes 5,823 has for wood production
During this campaign, we expect to transform 13,211 in the region: 8,769 hectares in Argentina and 4,442 hectares in Brazil.
II) Agricultural Production
The result of the Farming segment increased by ARS 92 million, from ARS 730 million gain during the three-month
period of fiscal year 2019 to ARS 822 million gain during the same period of 2020.
in ARS million IQ 20 IQ 19 Var a/a
Revenues 4,527 2,234 102.6%
Costs -3,972 -1,955 103.2%
Initial recognition and changes in the fair value of biological assets and agricultural produce at the point of harvest
331 271 22.1%
Changes in the net realizable value of agricultural produce after harvest 388 324 19.8%
Gross profit 1,274 874 45.8%
General and administrative expenses -182 -194 -6.2%
Selling expenses -409 -169 142.0%
Other operating results, net 126 213 -40.8%
Profit from operations 809 724 11.7%
Profit from associates 13 6 116.7%
Segment profit 822 730 12.6%
EBITDA 1,086 860 26.3%
Adjusted EBITDA 1,086 860 26.3%

7
II.a) Crops and Sugarcane
Crops
in ARS million IQ 20 IQ 19 Var a/a
Revenues 2,880 1,178 144.5%
Costs -2,410 -1,017 137.0%
Initial recognition and changes in the fair value of biological assets and agricultural produce
at the point of harvest -102 47 -
Changes in the net realizable value of agricultural produce after harvest 388 324 19.8%
Gross profit 756 532 42.1%
General and administrative expenses -89 -98 -9.2%
Selling expenses -374 -149 151.0%
Other operating results, net 121 217 -44.2%
Profit from operations 414 502 -17.5%
Share of loss of associates 13 6 116.7%
Segment profit 427 508 -15.9%
Sugarcane
in ARS million IQ 20 IQ 19 Var a/a
Revenues 1,274 913 39.5%
Costs -1,254 -825 52.0%
Initial recognition and changes in the fair value of biological assets and agricultural produce
at the point of harvest 500 336 48.8%
Gross profit 520 424 22.6%
General and administrative expenses -57 -58 -1.7%
Selling expenses -11 -6 83.3%
Other operating results, net 3 -2 -
Profit from operations 455 358 27.1%
Segment profit 455 358 27.1%
Operations
Production Volume1) 3M20 3M19 3M18 3M17 3M16
Corn 285,831 103,688 240,927 223,377 165,041
Soybean 1,270 -686 4,842 - 256
Wheat -164 77 208 - 58
Sorghum 3,229 1,048 606 298 298
Sunflower -1 - - - -
Cotton 3,237 - - - -
Others 198 1,790 718 816 2,959
Total Crops (tons) 293,600 105,917 247,301 224,491 168,612
Sugarcane (tons) 1,168,915 957,663 907,075 441,851 556,485
(1) Includes Brasilagro, Acres del Sud, Ombú, Yatay and Yuchán. Excludes Agro-Uranga.
Volume of 3M20 3M19 3M18 3M17 3M16
Sales (1) D.M F.M Total D.M F.M Total D.M F.M Total D.M F.M Total D.M F.M Total
Corn 152.5 18.1 170.6 65.3 - 65.3 134.4 - 134.4 121.8 - 121.8 62.6 23.6 86.2
Soybean 67.5 38.4 105.9 14.3 29.2 43.5 21.1 5.8 26.9 29.8 - 29.8 41.3 8.6 49.9
Wheat 1.5 - 1.5 4.4 - 4.4 6.4 - 6.4 0.4 0.1 0.5 5.1 28.9 34.0
Sorghum - - - - - - - - - 0.1 - 0.1 0.1 - 0.1
Sunflower 4.3 - 4.3 2.0 - 2.0 0.4 - 0.4 0.7 - 0.7 0.6 - 0.6
Others 0.3 - 0.3 - - - 0.6 - 0.6 1.5 - 1.5 1.1 - 1.1
Total Crops (thousands of tons)
226.1 56.5 282.6 86.0 29.2 115.2 162.9 5.8 168.7 154.3 0.1 154.4 110.8 61.1 171.9
Sugarcane (thousands of tons)
1,056.6 - 1,056.6 890.9 - 890.9 895.1 - 895.1 441.9 - 441.9 554.0 - 554.0
D.M.: Domestic market F.M.: Foreign market (1) Includes Brasilagro, CRESCA at 50%, Acres del Sud, Ombú, Yatay and Yuchán. Excludes Agro-Uranga.
8
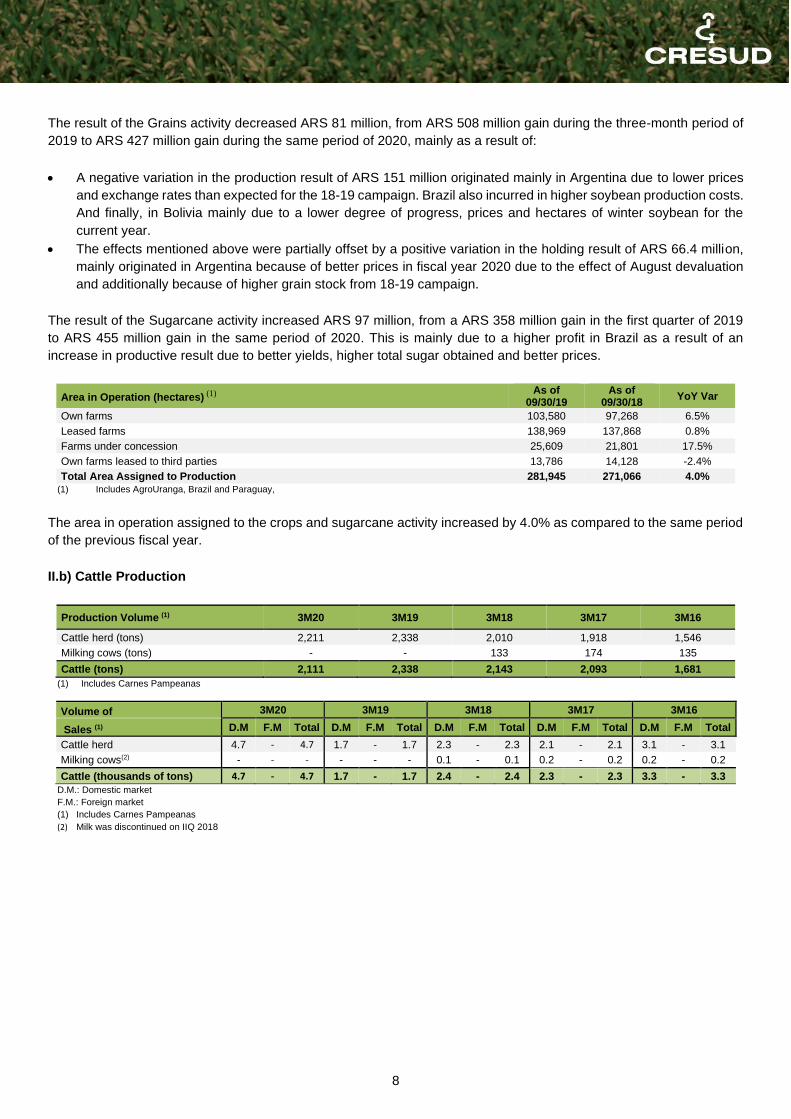
The result of the Grains activity decreased ARS 81 million, from ARS 508 million gain during the three-month period of
2019 to ARS 427 million gain during the same period of 2020, mainly as a result of:
• A negative variation in the production result of ARS 151 million originated mainly in Argentina due to lower prices
and exchange rates than expected for the 18-19 campaign. Brazil also incurred in higher soybean production costs.
And finally, in Bolivia mainly due to a lower degree of progress, prices and hectares of winter soybean for the
current year.
• The effects mentioned above were partially offset by a positive variation in the holding result of ARS 66.4 million,
mainly originated in Argentina because of better prices in fiscal year 2020 due to the effect of August devaluation
and additionally because of higher grain stock from 18-19 campaign.
The result of the Sugarcane activity increased ARS 97 million, from a ARS 358 million gain in the first quarter of 2019
to ARS 455 million gain in the same period of 2020. This is mainly due to a higher profit in Brazil as a result of an
increase in productive result due to better yields, higher total sugar obtained and better prices.
Area in Operation (hectares) (1) As of
09/30/19 As of
09/30/18 YoY Var
Own farms 103,580 97,268 6.5%
Leased farms 138,969 137,868 0.8%
Farms under concession 25,609 21,801 17.5%
Own farms leased to third parties 13,786 14,128 -2.4%
Total Area Assigned to Production 281,945 271,066 4.0% (1) Includes AgroUranga, Brazil and Paraguay,
The area in operation assigned to the crops and sugarcane activity increased by 4.0% as compared to the same period
of the previous fiscal year.
II.b) Cattle Production
Production Volume (1) 3M20 3M19 3M18 3M17 3M16
Cattle herd (tons) 2,211 2,338 2,010 1,918 1,546
Milking cows (tons) - - 133 174 135
Cattle (tons) 2,111 2,338 2,143 2,093 1,681
(1) Includes Carnes Pampeanas
Volume of 3M20 3M19 3M18 3M17 3M16
Sales (1) D.M F.M Total D.M F.M Total D.M F.M Total D.M F.M Total D.M F.M Total
Cattle herd 4.7 - 4.7 1.7 - 1.7 2.3 - 2.3 2.1 - 2.1 3.1 - 3.1
Milking cows(2) - - - - - - 0.1 - 0.1 0.2 - 0.2 0.2 - 0.2
Cattle (thousands of tons) 4.7 - 4.7 1.7 - 1.7 2.4 - 2.4 2.3 - 2.3 3.3 - 3.3
D.M.: Domestic market
F.M.: Foreign market
(1) Includes Carnes Pampeanas
(2) Milk was discontinued on IIQ 2018
9
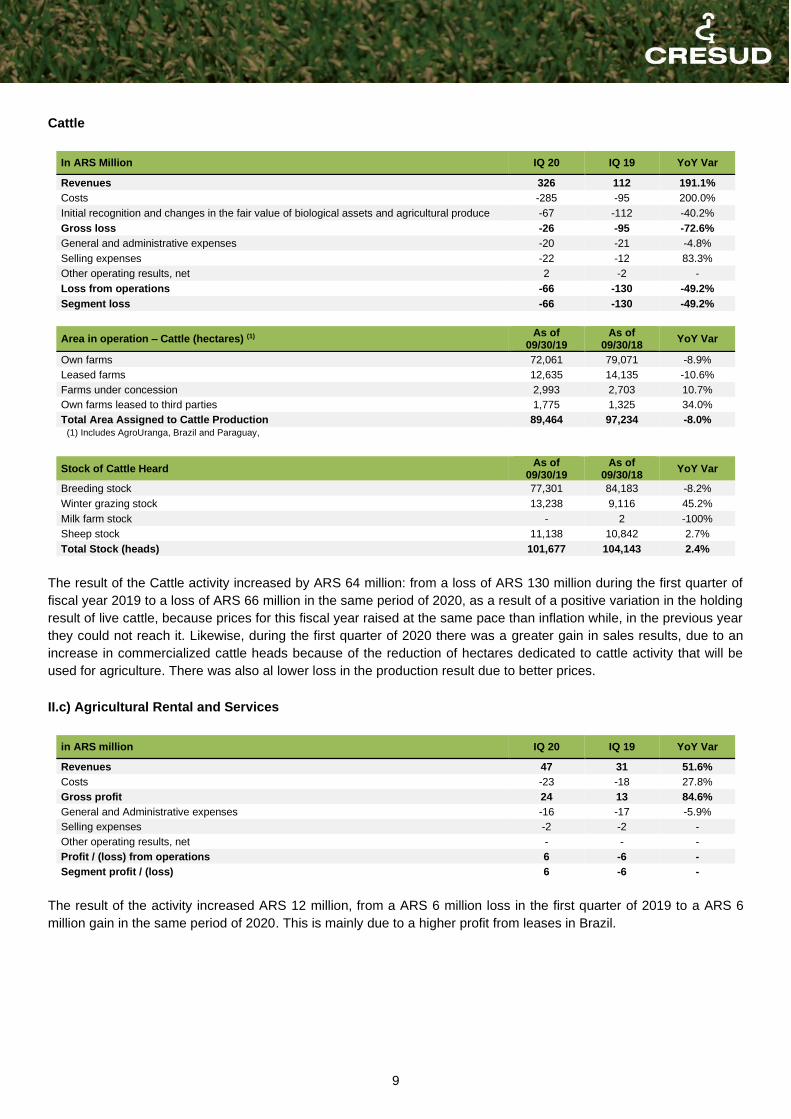
Cattle
In ARS Million IQ 20 IQ 19 YoY Var
Revenues 326 112 191.1%
Costs -285 -95 200.0%
Initial recognition and changes in the fair value of biological assets and agricultural produce -67 -112 -40.2%
Gross loss -26 -95 -72.6%
General and administrative expenses -20 -21 -4.8%
Selling expenses -22 -12 83.3%
Other operating results, net 2 -2 -
Loss from operations -66 -130 -49.2%
Segment loss -66 -130 -49.2%
Area in operation – Cattle (hectares) (1) As of 09/30/19
As of 09/30/18
YoY Var
Own farms 72,061 79,071 -8.9%
Leased farms 12,635 14,135 -10.6%
Farms under concession 2,993 2,703 10.7%
Own farms leased to third parties 1,775 1,325 34.0%
Total Area Assigned to Cattle Production 89,464 97,234 -8.0% (1) Includes AgroUranga, Brazil and Paraguay,
Stock of Cattle Heard As of
09/30/19 As of
09/30/18 YoY Var
Breeding stock 77,301 84,183 -8.2%
Winter grazing stock 13,238 9,116 45.2%
Milk farm stock - 2 -100%
Sheep stock 11,138 10,842 2.7%
Total Stock (heads) 101,677 104,143 2.4%
The result of the Cattle activity increased by ARS 64 million: from a loss of ARS 130 million during the first quarter of
fiscal year 2019 to a loss of ARS 66 million in the same period of 2020, as a result of a positive variation in the holding
result of live cattle, because prices for this fiscal year raised at the same pace than inflation while, in the previous year
they could not reach it. Likewise, during the first quarter of 2020 there was a greater gain in sales results, due to an
increase in commercialized cattle heads because of the reduction of hectares dedicated to cattle activity that will be
used for agriculture. There was also al lower loss in the production result due to better prices.
II.c) Agricultural Rental and Services
in ARS million IQ 20 IQ 19 YoY Var
Revenues 47 31 51.6%
Costs -23 -18 27.8%
Gross profit 24 13 84.6%
General and Administrative expenses -16 -17 -5.9%
Selling expenses -2 -2 -
Other operating results, net - - -
Profit / (loss) from operations 6 -6 -
Segment profit / (loss) 6 -6 -
The result of the activity increased ARS 12 million, from a ARS 6 million loss in the first quarter of 2019 to a ARS 6
million gain in the same period of 2020. This is mainly due to a higher profit from leases in Brazil.

10
III) Other Segments
We include within "Others" the results coming from our Agroindustrial activity, developed in our meatpacking facility in
La Pampa and our investment in FyO.
The result of the segment increased by ARS 9 million, going from an ARS 259 million gain for the first quarter of fiscal
year 2019 to a gain of ARS 250 million for the same period of 2020. This is due to a lower profit from FyO grain trading
operations due to the fact that in this year lower margins were obtained in the collection positions, although offset by
the financial results generated by the effect of exchange rate variations and rates in these positions that are not captured
at the level of the operating result. Likewise, this trend in the operating result was partially offset by the best results of
the commissions of brokerage of grains, product of the greater volumes transacted. This decrease is partially offset by
a positive variation in associates results from Agrofy S.A. and a higher gain from the meatpacking facility as a result of
the growth of external market sales over total sales (20% in IQ 19 vs. 37% in IQ 20) along with the positive impact of
the exchange rate depreciation, additionally local market sales decreased but their prices remained slightly above
inflation.
In ARS million IQ 20 IQ 19 YoY Var
Revenues 1,867 1,669 11.9%
Costs -1,523 -1,273 19.6%
Initial recognition and changes in the fair value of biological assets and agricultural produce at the point of harvest
9 -3 -
Gross profit 353 393 -10.2%
General and administrative expenses -55 -48 14.6%
Selling expenses -154 -128 20.3%
Other operating results, net 38 37 2.7%
Profit from operations 182 254 -28.3%
Profit from associates 68 5 1260.0%
Segment Profit 250 259 -3.5%
EBITDA 195 268 -27.2%
Adjusted EBITDA 195 268 -27.2%
IV) Corporate Segment
The negative result of the segment increased by ARS 12 million, going from a loss of ARS 49 million in the first quarter
of 2019 to a loss of ARS 37 million for the same period of 2020.
In ARS million IQ 20 IQ 19 YoY Var
General and administrative expenses -37 -49 -24,5%
Loss from operations -37 -49 -24,5%
Segment Loss -37 -49 -24,5%
EBITDA -37 -49 -24,5%
Adjusted EBITDA -37 -49 -24,5%
11
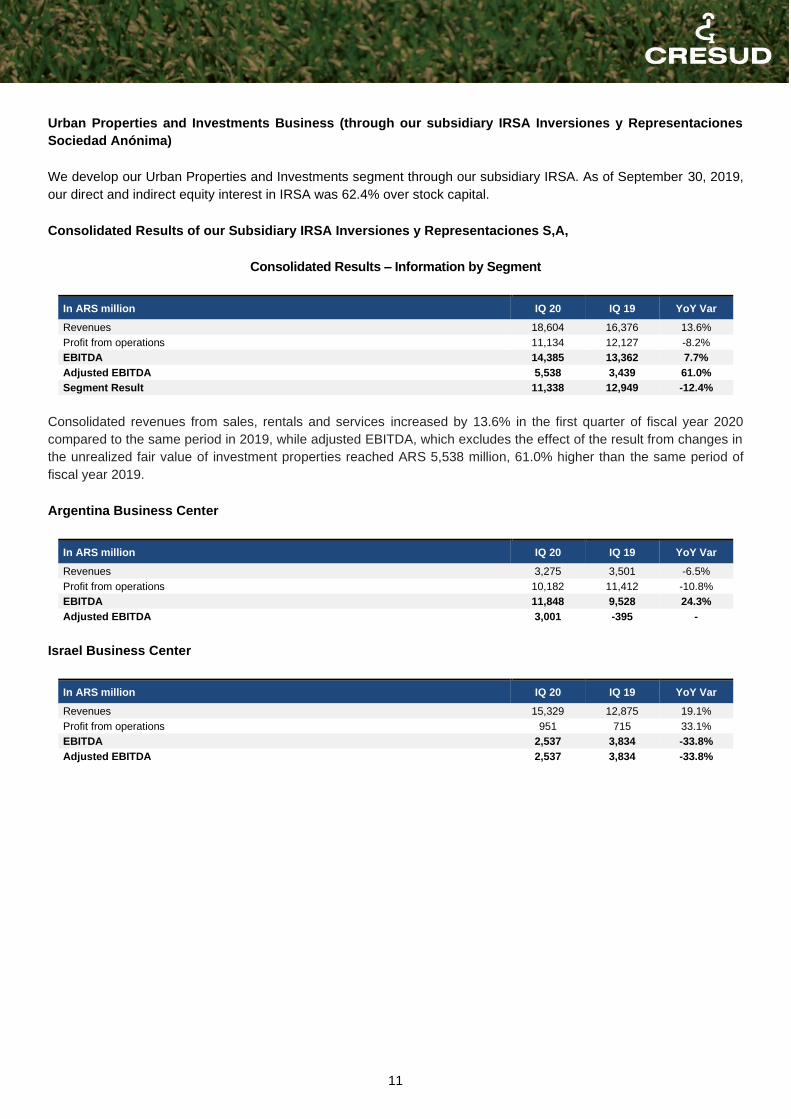
Urban Properties and Investments Business (through our subsidiary IRSA Inversiones y Representaciones
Sociedad Anónima)
We develop our Urban Properties and Investments segment through our subsidiary IRSA. As of September 30, 2019,
our direct and indirect equity interest in IRSA was 62.4% over stock capital.
Consolidated Results of our Subsidiary IRSA Inversiones y Representaciones S,A,
Consolidated Results – Information by Segment
In ARS million IQ 20 IQ 19 YoY Var
Revenues 18,604 16,376 13.6%
Profit from operations 11,134 12,127 -8.2%
EBITDA 14,385 13,362 7.7%
Adjusted EBITDA 5,538 3,439 61.0%
Segment Result 11,338 12,949 -12.4%
Consolidated revenues from sales, rentals and services increased by 13.6% in the first quarter of fiscal year 2020
compared to the same period in 2019, while adjusted EBITDA, which excludes the effect of the result from changes in
the unrealized fair value of investment properties reached ARS 5,538 million, 61.0% higher than the same period of
fiscal year 2019.
Argentina Business Center
In ARS million IQ 20 IQ 19 YoY Var
Revenues 3,275 3,501 -6.5%
Profit from operations 10,182 11,412 -10.8%
EBITDA 11,848 9,528 24.3%
Adjusted EBITDA 3,001 -395 -
Israel Business Center
In ARS million IQ 20 IQ 19 YoY Var
Revenues 15,329 12,875 19.1%
Profit from operations 951 715 33.1%
EBITDA 2,537 3,834 -33.8%
Adjusted EBITDA 2,537 3,834 -33.8%

12
Financial Indebtedness and Other
The following tables contain a breakdown of company’s indebtedness:
Agricultural Business
Description Currency Amount (2) Interest Rate Maturity
Bank overdrafts ARS 37.1 Variable < 30 days
Cresud 2020 NCN, Series XXIV USD 73.6 9.00% 16-Nov-20
Cresud 2020 NCN, Series XXV USD 59,6 9.00% 16-Nov-20
Cresud 2023 NCN, Series XXIII (1) USD 113.0 6.50% 16-Feb-23
Other debt USD 168.8 - -
CRESUD’s Total Debt (3) 452.1
Cash and cash equivalents (3) 8.1
Total Net Debt 444.0
Brasilagro’s Total Net Debt 33.0
(1) Net of repurchases (2) Principal amount stated in USD (million) at an exchange rate of 57.59 ARS/USD and 4.187 BRL/USD, without considering accrued interest or elimination of balances with subsidiaries. (3) CRESUD stand-alone.
Urban Properties and Investments Business
Operations Center in Argentina
The following table describes our total debt as of September 30, 2019:
Description Currency Amount (1) Interest Rate Maturity
Bank overdrafts ARS 10.2 Floating < 360 days
Series II Non-Convertible Notes (USD) USD 71.4 11.50% Jul-20
Series II Non-Convertible Notes (CLP) CLP 44.2 10.50% Aug-20
Series I Non-Convertible Notes USD 181.5 10.00% Nov-20
Loan with IRSA CP USD 28.5 - Nov-22
Other debt USD 29.4 - Feb-22
IRSA’s Total Debt 365.2
Cash & Cash Equivalents + Investments (3) USD 0.6
IRSA’s Net Debt USD 364.5
Bank overdrafts ARS 17.3 - < 360 d
PAMSA loan USD 35.0 Fixed Feb-23
IRCP NCN Class IV(2) USD 137.7 5.0% Sep-20
IRSA CP NCN Class II USD 360.0 8.75% Mar-23
IRSA CP’s Total Debt 550.0
Cash & Cash Equivalents + Investments (3) 203.3
Consolidated Net Debt 346.7
(1) Principal amount in USD (million) at an exchange rate of Ps. 57.59 ARS /USD, without considering accrued interest or eliminations of balances with subsidiaries. (2) Net of repurchase. (3) “Cash & Cash Equivalents plus Investments” includes Cash & Cash Equivalents and Investments in Current Financial Assets.
Israel Business Center
Financial debt as of June 30, 2019:
Indebtedness(1) Net (NIS million)
IDBD’s Total Debt 2,173
DIC’s Total Debt 2,661 (1) Cash in IDB includes NIS 430 million as a collateral of Clal swap transaction
13
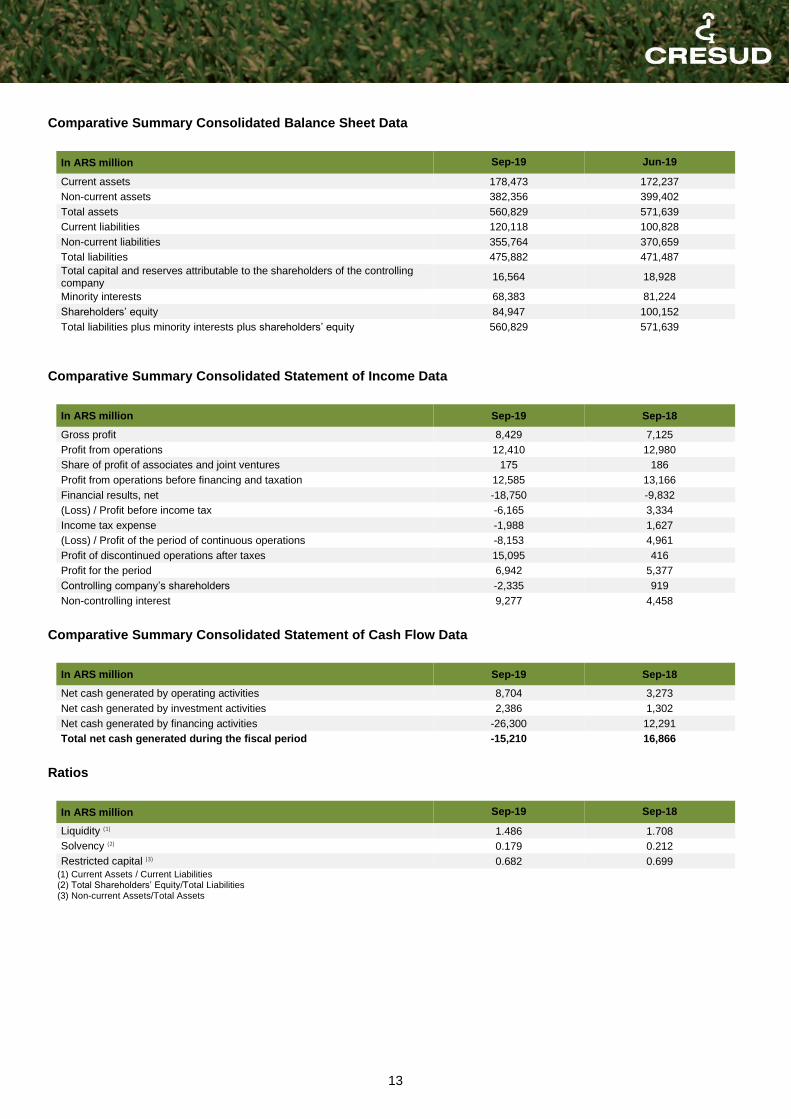
Comparative Summary Consolidated Balance Sheet Data
In ARS million Sep-19 Jun-19
Current assets 178,473 172,237
Non-current assets 382,356 399,402
Total assets 560,829 571,639
Current liabilities 120,118 100,828
Non-current liabilities 355,764 370,659
Total liabilities 475,882 471,487
Total capital and reserves attributable to the shareholders of the controlling company
16,564 18,928
Minority interests 68,383 81,224
Shareholders’ equity 84,947 100,152
Total liabilities plus minority interests plus shareholders’ equity 560,829 571,639
Comparative Summary Consolidated Statement of Income Data
In ARS million Sep-19 Sep-18
Gross profit 8,429 7,125
Profit from operations 12,410 12,980
Share of profit of associates and joint ventures 175 186
Profit from operations before financing and taxation 12,585 13,166
Financial results, net -18,750 -9,832
(Loss) / Profit before income tax -6,165 3,334
Income tax expense -1,988 1,627
(Loss) / Profit of the period of continuous operations -8,153 4,961
Profit of discontinued operations after taxes 15,095 416
Profit for the period 6,942 5,377
Controlling company’s shareholders -2,335 919
Non-controlling interest 9,277 4,458
Comparative Summary Consolidated Statement of Cash Flow Data
In ARS million Sep-19 Sep-18
Net cash generated by operating activities 8,704 3,273
Net cash generated by investment activities 2,386 1,302
Net cash generated by financing activities -26,300 12,291
Total net cash generated during the fiscal period -15,210 16,866
Ratios
In ARS million Sep-19 Sep-18
Liquidity (1) 1.486 1.708
Solvency (2) 0.179 0.212
Restricted capital (3) 0.682 0.699 (1) Current Assets / Current Liabilities (2) Total Shareholders’ Equity/Total Liabilities (3) Non-current Assets/Total Assets
14
Material events of the quarter and subsequent events
July 2019: Local Notes Issuance
On July 3, 2019, we issued the Series XXV Notes in the local capital markets, for an amount of USD 59.6 million, bearing
a fixed interest rate of 9.0% payable semiannually, which matures on July 11, 2021. The proceeds were used to pay
short term liabilities and working capital in Argentina.
August 2019: Share repurchase plan
On August 21, 2019, the Board of Directors has approved the terms and conditions for the acquisition of the common
shares issued by the Company under the provisions of Section 64 of Law Nº 26,831 and the Rules of the Comisión
Nacional de Valores.
(i) Maximum amount of the investment: Up to ARS 300,000,000.
(ii) Maximum number of shares to be acquired: Up to 10% of the capital stock of the Company, in the form of
common shares or American Depositary Shares.
(iii) Daily limitation on market transactions: Up to 25% of the average volume of the daily transactions for the
Shares and ADS in the markets during the previous 90 days.
(iv) Payable Price: Up to ARS 10.00 per ADS and in the case of common shares, up to a maximum value in
ARS equivalent to the maximum price per ADS divided by ten and multiplied by the value of the buyer
exchange rate of the Argentine National Bank in force at the time of each repurchase.
(v) Period in which the acquisitions will take place: Until 120 days, beginning the day following to the date of
publication of the information in the Daily Bulletin of the Buenos Aires Stock Exchange.
(vi) Origin of the Funds: The acquisitions will be made with realized and liquid earnings pending of distribution
of the Company.
As of the financial statements’ issuance date, no repurchase has yet been made under this program.
October 2019: Loan to Inversiones Financieras del Sur S.A.
By letter dated October 18, 2019, the Board of Directors of the company has approved the granting of a loan of 3,235,000
American Depositary Receipts (ADRs) of IRSA Inversiones y Representaciones Sociedad Anónima, held by the
Company, to Inversiones Financieras del Sur S.A., a company controlled by the Company’s president. The loan has
been guaranteed by Inversiones Financieras del Sur S.A. with shares of equivalent value.
Having consulted the Audit Committee in the terms of Chapter III of the Rules of the National Securities Commission,
as well as articles 72 and 110 Inc. h) Section IV of the Capital Market Law Nº26.831, it has issued an opinion without
objections to be made regarding the transaction above mentioned. Such opinion is at disposal of the Shareholders in
the corporate headquarters.

15
October 2019: General Ordinary and Extraordinary Shareholders’ Meeting
In October 30, 2019, our General Ordinary and Extraordinary Shareholders’ Meeting was held. The following matters.
inter alia, were resolved by majority of votes:
• Absorb accumulated losses as of June 30, 2019 with the special reserve and the special reserve RG
609/12
• Distribution of treasury own shares for up to 13.000.000.
• Designation of board members.
• Compensations to the Board of Directors for the fiscal year ended June 30, 2019
• Capital increase for up to the sum of nominal value ARS 180,000,000, by issuing up to 180,000,000
ordinary shares of ARS 1 Nominal Value each and one vote per share equivalent to 33.49% of the
current Capital Stock.
• Incentive plan for employees. management and directors to be integrated without premium for up to 1%
of the Capital Stock.
November 2019: Distribution of treasury shares
It has been arranged to distribute the company's own treasury shares for a total of 13,000,000 ordinary shares of 1 vote
per share and ARS 1 N/V each.
Process start date: November 13, 2019 Payment address: Caja de Valores S.A. 25 de Mayo 362, City of Buenos Aires
Time: Monday to Friday from 10:00 a.m. to 3:00 p.m.
Amount approved by the Assembly: 13,000,000 shares.
The aforementioned distribution of the shares constitutes 0.02660982197 shares per ordinary share and 0.2660982197
per ADR, a percentage of 2.591485395% of the stock capital of ARS 501.642.804.- and 2.660982197% of the stock
capital net of treasury shares.
The fractions of shares will be settled in cash in accordance with the regulations of the Bolsas y Mercados Argentinos
S.A. on fractions less than 1 share or 1 ADR.
It is recorded that the shares mentioned above will be received in the respective proportion by the holders of outstanding
shares of the company as of November 13, 2019.
The settlement date will be on November 14, 2019.
16
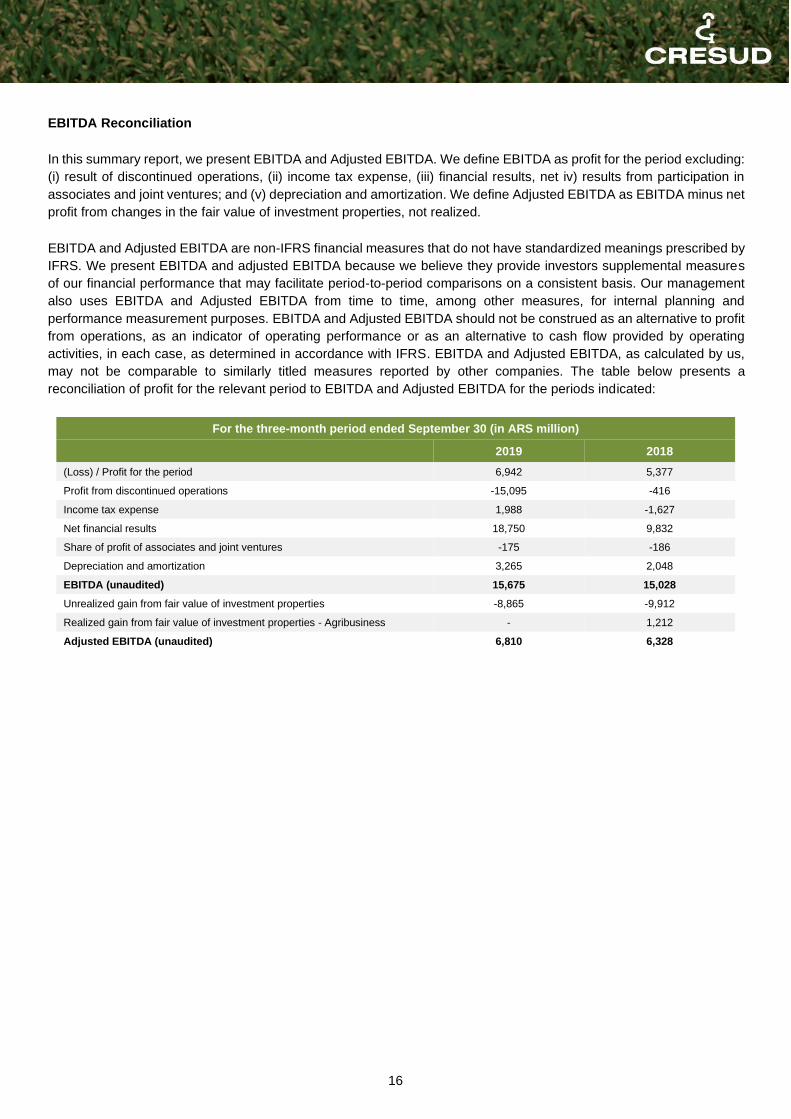
EBITDA Reconciliation
In this summary report, we present EBITDA and Adjusted EBITDA. We define EBITDA as profit for the period excluding:
(i) result of discontinued operations, (ii) income tax expense, (iii) financial results, net iv) results from participation in
associates and joint ventures; and (v) depreciation and amortization. We define Adjusted EBITDA as EBITDA minus net
profit from changes in the fair value of investment properties, not realized.
EBITDA and Adjusted EBITDA are non-IFRS financial measures that do not have standardized meanings prescribed by
IFRS. We present EBITDA and adjusted EBITDA because we believe they provide investors supplemental measures
of our financial performance that may facilitate period-to-period comparisons on a consistent basis. Our management
also uses EBITDA and Adjusted EBITDA from time to time, among other measures, for internal planning and
performance measurement purposes. EBITDA and Adjusted EBITDA should not be construed as an alternative to profit
from operations, as an indicator of operating performance or as an alternative to cash flow provided by operating
activities, in each case, as determined in accordance with IFRS. EBITDA and Adjusted EBITDA, as calculated by us,
may not be comparable to similarly titled measures reported by other companies. The table below presents a
reconciliation of profit for the relevant period to EBITDA and Adjusted EBITDA for the periods indicated:
For the three-month period ended September 30 (in ARS million)
2019 2018
(Loss) / Profit for the period 6,942 5,377
Profit from discontinued operations -15,095 -416
Income tax expense 1,988 -1,627
Net financial results 18,750 9,832
Share of profit of associates and joint ventures -175 -186
Depreciation and amortization 3,265 2,048
EBITDA (unaudited) 15,675 15,028
Unrealized gain from fair value of investment properties -8,865 -9,912
Realized gain from fair value of investment properties - Agribusiness - 1,212
Adjusted EBITDA (unaudited) 6,810 6,328
17
Prospects for next fiscal year
This Fiscal Year presents challenges in both operations centers: Argentina and Israel. In Argentina, the political and
economic outlook as of the issuance date of the financial statements is in a transition process, mainly motivated by the
outcome of the general elections held in October of this year whose result produced a change in the Executive Power
since next December with the consequent uncertainty regarding future political, economic a social decisions of the new
administration. To this is added the situation in the region with some political and economic instability. Globally, we find
the existence of trade conflicts between different countries and a slowdown in global growth that also has a negative
impact on Latin America. The appreciation of international markets with respect to Argentina has become unstable as
a result of the country's economic crisis and has influenced development expectations.
Regarding agribusiness, the 2020 Campaign is beginning with good weather conditions in the region. A neutral “Niño”
phenomenon with good water profile is expected again, so we expect a good level of crop production, average yields
and controlled costs. Regarding the markets, in the case of oilseeds, the price trend will continue to be influenced by
the development of the trade conflict between China and the US. In case of continuing this dispute, we would see lower
prices in the US and stronger in South America due to China's demand orientation towards this origin, while, in case of
being solved, we would see a positive reaction of the Chicago quotes at the expense of FOB premiums in South
America. The market in general will be influenced by the volatility of the exchange rate in the region, mainly in Argentina,
where the peso depreciated approximately 25% at the beginning of the campaign.
Regarding livestock activity, we will focus on improving productivity by minimizing the impact of increased costs due to
the economic situation, working efficiently to achieve the highest possible operating margins. We will continue
concentrating our cattle production in our own farms, mainly in the Northwest of Argentina and consolidating the cattle
activity in Brazil.
Regarding Farmland development, we hope to get the permits to increase the area under development and migrate
from livestock to agricultural hectares, whose business is mainly for export, with more technology and greater price
predictability, taking advantage of the dilution in dollars of transformation costs with the recent exchange depreciation
in Argentina. Likewise, as part of our business strategy, we will continue selling the farms that have reached their
maximum level of appreciation.
In relation to our urban properties and investment segment, we expect that the businesses from our subsidiary IRSA
reflect good results in its two operations centers: Argentina and Israel.
On the national and international framework above mentioned, the Company is analyzing alternatives to appreciate its
shares value. In that sense, the Board of Directors of the Company will continue in the evaluation of financial, economic
and / or corporate tools that allow the Company to improve its position in the market in which it operates and have the
necessary liquidity to meet its obligations. Within the framework of this analysis, the indicated tools may be linked to
corporate reorganization processes (merger, spin-off or a combination of both), disposal of assets in public and / or
private form that may include real estate as well as negotiable securities owned by the Company, incorporation of
shareholders through capital increases through the public offering of shares to attract new capital -as it was approved
in the Shareholders’ Meeting that took place on October 30, 2019-, repurchase of shares and instruments similar to
those described that are useful to the proposed objectives.
We believe that Cresud, owner of a diversified rural and urban real estate portfolio, with a management of many years
of experience in the sector and a great track record in accessing to the capital market, will have great possibilities to
take advantage of the best opportunities that occur in the market.
Alejandro G. Elsztain
CEO
18
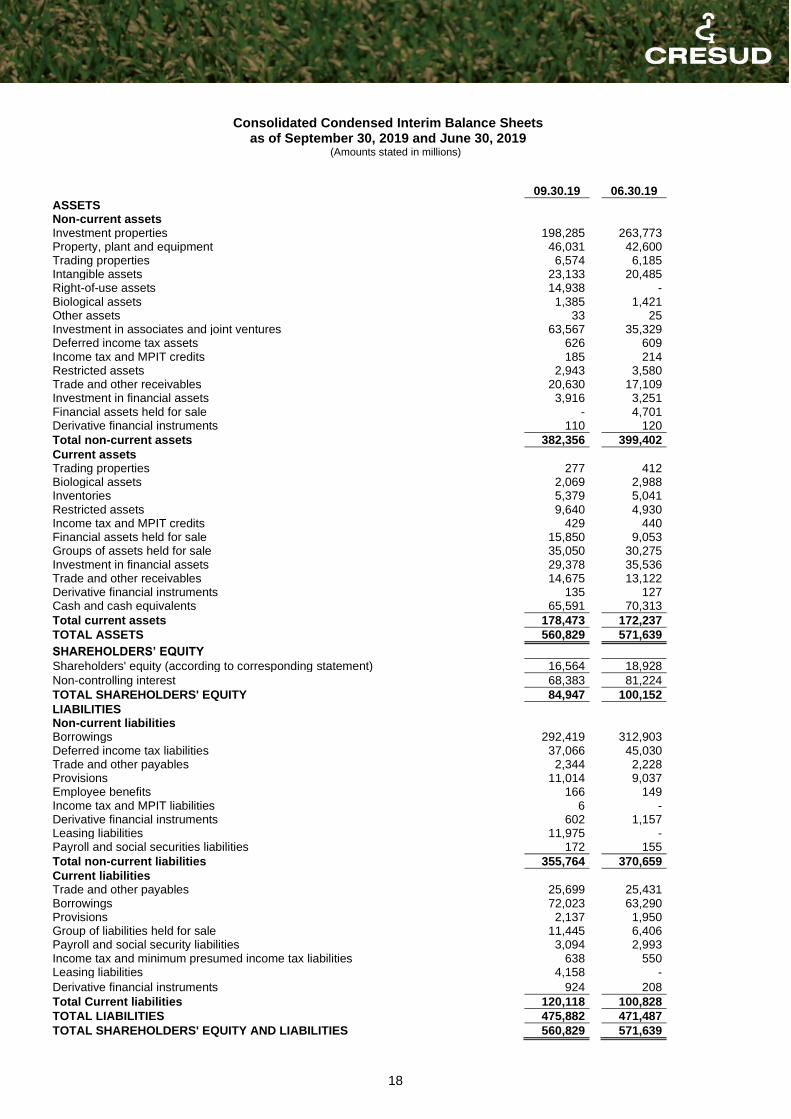
Consolidated Condensed Interim Balance Sheets as of September 30, 2019 and June 30, 2019
(Amounts stated in millions)
09.30.19 06.30.19
ASSETS
Non-current assets
Investment properties 198,285 263,773 Property, plant and equipment 46,031 42,600 Trading properties 6,574 6,185 Intangible assets 23,133 20,485 Right-of-use assets 14,938 - Biological assets 1,385 1,421 Other assets 33 25 Investment in associates and joint ventures 63,567 35,329 Deferred income tax assets 626 609 Income tax and MPIT credits 185 214 Restricted assets 2,943 3,580 Trade and other receivables 20,630 17,109 Investment in financial assets 3,916 3,251 Financial assets held for sale - 4,701 Derivative financial instruments 110 120
Total non-current assets 382,356 399,402
Current assets
Trading properties 277 412 Biological assets 2,069 2,988 Inventories 5,379 5,041 Restricted assets 9,640 4,930 Income tax and MPIT credits 429 440 Financial assets held for sale 15,850 9,053 Groups of assets held for sale 35,050 30,275 Investment in financial assets 29,378 35,536 Trade and other receivables 14,675 13,122 Derivative financial instruments 135 127 Cash and cash equivalents 65,591 70,313
Total current assets 178,473 172,237
TOTAL ASSETS 560,829 571,639
SHAREHOLDERS’ EQUITY
Shareholders' equity (according to corresponding statement) 16,564 18,928
Non-controlling interest 68,383 81,224
TOTAL SHAREHOLDERS' EQUITY 84,947 100,152
LIABILITIES
Non-current liabilities
Borrowings 292,419 312,903 Deferred income tax liabilities 37,066 45,030 Trade and other payables 2,344 2,228 Provisions 11,014 9,037 Employee benefits 166 149 Income tax and MPIT liabilities 6 - Derivative financial instruments 602 1,157 Leasing liabilities 11,975 - Payroll and social securities liabilities 172 155
Total non-current liabilities 355,764 370,659
Current liabilities
Trade and other payables 25,699 25,431 Borrowings 72,023 63,290 Provisions 2,137 1,950 Group of liabilities held for sale 11,445 6,406 Payroll and social security liabilities 3,094 2,993 Income tax and minimum presumed income tax liabilities 638 550 Leasing liabilities 4,158 - Derivative financial instruments 924 208
Total Current liabilities 120,118 100,828
TOTAL LIABILITIES 475,882 471,487
TOTAL SHAREHOLDERS' EQUITY AND LIABILITIES 560,829 571,639

19
Consolidated Condensed Interim Statements of Income and Other Comprehensive Income for the three-
month period ended September 30, 2019 and 2018 (Amounts stated in millions)
09.30.19 09.30.18
Revenues 24,869 20,179 Costs (17,201) (13,680) Initial recognition and changes in the fair value of biological assets and agricultural products at the point of harvest
373 302
Changes in the net realizable value of agricultural products after harvest 388 324
Gross profit 8,429 7,125
Net gain from fair value adjustment of investment properties 8,865 9,912 Gain from disposal of farmlands 212 2 General and administrative expenses (2,376) (2,242) Selling expenses (2,947) (2,653) Other operating results, net 227 1,206 Management fees - (370)
Profit from operations 12,410 12,980
Share of profit of associates and joint ventures 175 186
Profit before financial results and income tax 12,585 13,166
Finance income 265 288 Finance cost (6,430) (4,718) Other financial results (12,268) (5,547) Inflation adjustment (317) 145
Financial results, net (18,750) (9,832)
(Loss) / Profit before income tax (6,165) 3,334
Income tax (1,988) 1,627
(Loss) / Profit for the period from continuing operations (8,153) 4,961
Profit for the period from discontinued operations 15,095 416
Profit for the period 6,942 5,377
Other comprehensive income / (loss):
Items that may be reclassified subsequently to profit or loss:
Currency translation adjustment 9,807 15,120 Change in the fair value of hedging instruments net of income taxes (13) (6) Items that may not be reclassified subsequently to profit or loss:
Revaluation of fixed assets transferred to investment properties - 787
Actuarial loss from defined benefit plans (51) -
Other comprehensive income for the period from continuing operations 9,743 15,901
Other comprehensive income for the period from discontinued operations 3,811 7,275
Total other comprehensive income for the period 13,554 23,176
Total comprehensive income for the period 20,496 28,553
Total comprehensive income from continuing operations 1,590 20,862 Total comprehensive income from discontinued operations 18,906 7,691
Total comprehensive income from the period 20,496 28,553
(Loss) / profit for the period attributable to:
Equity holders of the parent (2,335) 919 Non-controlling interest 9,277 4,458 (Loss) / profit from continuing operations attributable to:
Equity holders of the parent (6,519) 857 Non-controlling interest (1,634) 4,104 Total comprehensive (Loss) / income attributable to:
Equity holders of the parent (1,728) 5,657 Non-controlling interest 22,224 22,896 (Loss) / profit for the period per share attributable to equity holders of the parent:
Basic (4.801) 1.917 Diluted (4.801) 1.830 (Loss) / profit per share from continuing operations attributable to equity holders of the parent:
Basic (13.40) 1.837 Diluted (13.40) 1.754

20
Consolidated Condensed Interim Cash Flow Statements for the three-month periods ended September 30, 2019 and 2018
(Amounts stated in millions)
09.30.19 09.30.18
Operating activities:
Net cash generated from operating activities before income tax paid 7,819 3,057
Income tax paid (260) (94)
Net cash generated from continuing operating activities 7,559 2,963
Net cash generated from discontinued operating activities 1,145 310
Net cash generated from operating activities 8,704 3,273
Investing activities: Increase of interest in associates and joint ventures (4) (80) Acquisition of associates and join ventures (2,288) - Capital contributions to associates and joint ventures (110) - Increase of interest in associates and joint ventures (899) (51) Increase in cash due to deconsolidation of subsidiary - 54 Acquisition and improvements of investment properties - (1,898) Proceeds from sales of investment properties 36 11 Acquisitions and improvements of property, plant and equipment (1,050) (1,039) Advance payments (4) (26) Acquisition of intangible assets (714) (701) Proceeds from sales of property, plant and equipment 2,537 2 Net increase of restricted deposits - (295) Dividends collected from associates and joint ventures 54 146 Proceeds from sales of interest held in associates and joint ventures 39 (8) Proceeds from loans granted 33 92 Acquisitions of investments in financial assets (8,336) (8,105) Proceeds from disposal of investments in financial assets 12,512 12,263 Proceeds from financial assets interest 277 296
Dividends received 67 203 Proceeds from intangible assets sales 75 - Loans granted (609) - Decrease in securities (1,577) Proceeds from liquidation of associate - 631
Net cash generated from continuing investing activities 39 1,495
Net cash generated from discontinued investing activities 2,347 (193)
Net cash generated from investing activities 2,386 1,302
Financing activities: Borrowings and issuance of non-convertible notes 13,794 23,332 Payment of borrowings and non-convertible notes (22,661) (5,106) Obtention of short-term loans, net 525 5,012 Interest paid (5,435) (2,818) Repurchase of own shares - (1,026) Repurchase of non-convertible notes (8,590) (6,872) Acquisition of non-controlling interest in subsidiaries (180) (368) Proceeds from sales of non-controlling interest in subsidiaries - 11 Loans received from associates and joint ventures, net - 86 Dividends paid to non-controlling interest in subsidiaries - (356) Proceeds from derivative financial instruments, net 57 238 Payment of seller financing - (2)
Net cash (used in) / generated from continuing financing activities (22,490) 12,131
Net cash (used in) / generated from discontinued financing activities (3,810) 160
Net cash (used in) / generated from financing activities (26,300) 12,291
Net (Decrease) / Increase in cash and cash equivalents from continuing activities (14,892) 16,589
Net (Decrease) / Increase in cash and cash equivalents from discontinued activities (318) 277
Net (Decrease) / Increase in cash and cash equivalents (15,210) 16,866
Cash and cash equivalents at beginning of the period 70,313 67,663 Cash and cash equivalents reclassified to held for sale 26 (298) Foreign exchange gain on cash and changes in fair value of cash equivalents 10,462 25,822
Cash and cash equivalents at the end of the period 65,591 110,053
21
Headquarters
Moreno 877 23º Piso
Tel +(54 11) 4814-7800/9
Fax +(54 11) 4814-7876
www.cresud.com.ar
C1091AAF – Cdad. Autónoma de Buenos Aires – Argentina
Investor Relations
Alejandro Elsztain – CEO
Matías Gaivironsky - CFO
Tel +(54 11) 4323 7449
e-mail [email protected]
Legal Advisors
Estudio Zang. Bergel & Viñes
Tel +(54 11) 4322 0033
Florida 537 18º Piso
C1005AAK – Cdad. Autónoma de Buenos Aires – Argentina
Audit Commetee
PricewaterhouseCoopers Argentina
Tel +(54 11) 4850-0000
Bouchard 557 Piso 7°
C1106ABG – Cdad. Autónoma de Buenos Aires – Argentina
Registry and Transfer Agent
Caja de Valores S.A.
Tel +(54 11) 4317 8900
25 de Mayo 362
C1002ABH – Cdad. Autónoma de Buenos Aires – Argentina
Depositary Agent ADS´s
The Bank of New York Mellon
Tel. 1 888 BNY ADRS (269-2377) Tel. 1 610 312 5315
P.O. Box 11258 Church Street Station
New York. NY 10286 1258 – Estados Unidos de Norteamérica
Símbolo BYMA: CRES
Nasdaq Symbol: CRESY