early voting reforms and american...
TRANSCRIPT
Early Voting Reforms and American Elections
Paul Gronke Reed College
August, 2004
Paper presented at the Annual Meeting of the American Political Science Association, Chicago IL, September 2-5, 2004. This research was supported in part by the Alta Corbett Fund and Daniel R. Levine Fund at Reed College. The author acknowledges the advice of R. Michael Alvarez, Robert Stein, James Thurber, Michael Traugott, Chrisopher Zorn, and the participants in the Reed College Summer Research Seminar. Special thanks go out to Paddy McGuire at the Oregon Secretary of State’s Office and John Kauffman, Director, Multnomah County Office of Elections. All errors and omissions remain the responsibility of the author. All right reserved, Paul Gronke, 2004.
GRONKE, EARLY VOTING
- 1 -
Introduction The United States is in the midst of a reform era. After the controversy
surrounding the 2000 election results, Congress passed the Help America Vote Act
(HAVA) of 2002. As a result of HAVA, every state in the nation will have to establish a
statewide voter registration system by 2006. Disabled citizens will have guaranteed
access to the polls. America’s men and women in the armed forces will have their ballots
counted in a timely fashion. And Native Americans, Latinos, and other disadvantaged
groups that have traditionally faced barriers to participation will have these barriers
reduced or eliminated altogether. Since 2000, non-partisan groups, political parties, and
candidate organizations have paid far closer attention to the mechanics of ballot counting.
Legal challenges have forced some states to abandon mechanical vote-counting systems
in favor of presumably more reliable technologies (such as optical character scanning and
touch screen).
These are the reforms that were mandated by Congress, endorsed by the
President, and are being implemented nationwide. There is, however, a quieter set of
reforms that have been advancing across the nation for more than a decade, a set of
reforms that have a far greater potential to change the way that elections are being
conducted, not only in the U.S. but worldwide. States and localities have been
systematically relaxing the requirements for absentee balloting; others provide for a
period of in-person early voting (where citizens can cast their ballots as early as a month
before election day); and finally, the State of Oregon mandated 100% voting by mail
since 1998.
For an increasing number of Americans, then, “election day” is a historical relic.
Instead, ballots are cast at the individual’s convenience, up to three weeks before the
scheduled date of the election. Why has this change taken place? What consequences
might this change have for the behavior of candidates, non-partisan political groups, and
the voters themselves? Does early voting augur well for the quality of democratic
decision making in the United States?
This paper takes a look at these important political questions. In the first section,
I describe the advancement of early voting systems, a process that started slowly in the
GRONKE, EARLY VOTING
- 2 -
1980s but has accelerated rapidly in the past few years, followed by a review of the
scholarly literature on the subject. Next, I provide the theoretical motivation and
methodological approach of my research. I argue that, for campaigners, early voting
alters their strategic calculus. It increases the uncertainty about turnout and as a result
increases campaign costs. For voters who are well-informed and confident in their
choices, early voting provides an opportunity to express their preferences quickly and
conveniently. It is less clear how early voting will impact less well-informed voters.
Finally, I subject these hypotheses to empirical tests, drawing upon aggregate data on
rates of early voting and individual level ballot return data from the state of Oregon. The
empirical results show that early voting varies in reasonable ways: voters who are willing
to identify with a political party, voters from areas with higher commute times, incomes,
and average educational levels tend to cast their ballots earlier. I close by suggesting
avenues for future research, focusing particularly on ways to combine contextual,
campaign, and individual level approaches to a model of voter decision making under
systems that allow early voting.
What is Early Voting? For the purposes of this paper, early voting is a blanket term used to describe any
system where voters can cast their ballot before the official election day. This covers a
bewildering array of different electoral systems in the United States and, increasingly,
abroad. Primarily I use the term to mean in-person early voting, no-excuse absentee
balloting, and vote by mail (see Table One for a summary).
In-person early voting is when a voter can cast a ballot, most commonly at the
local elections office, but increasingly at satellite locations such as community centers,
churches, or even grocery stores.1 The important distinction between in-person early
voting and other early voting systems is the requirement that individuals show up in
person to cast a ballot. If we believe that getting to the polls imposes a significant barrier
to participation, then in-person systems only partially relieve this burden.
1 Examples were drawn from the early voting sites provided in the most recent election in Harris County, TX (www.harrisvotes.org), Johnson County, IA (www.johnson-county.com/auditor) and Shelby County, TN (www.shelbyvote.com).
GRONKE, EARLY VOTING
- 3 -
No-excuse absentee balloting is where voters do not have to provide a reasonable
excuse for voting absentee (in some states, notably California, a voter can also request
“permanent” absentee status, essentially becoming a vote-by-mail voter). Thus, I do not
discuss absentee balloting as we have traditionally understood it: casting your ballot
before election day because you are infirm, out of the country (in the military or living
overseas), away at college, or otherwise unable to make it to the polls. This form of
absentee balloting has historically been quite restrictive, and the proportion of ballots cast
via this method very low. No-excuse absentee balloting, in contrast, has exploded in
many states and localities.
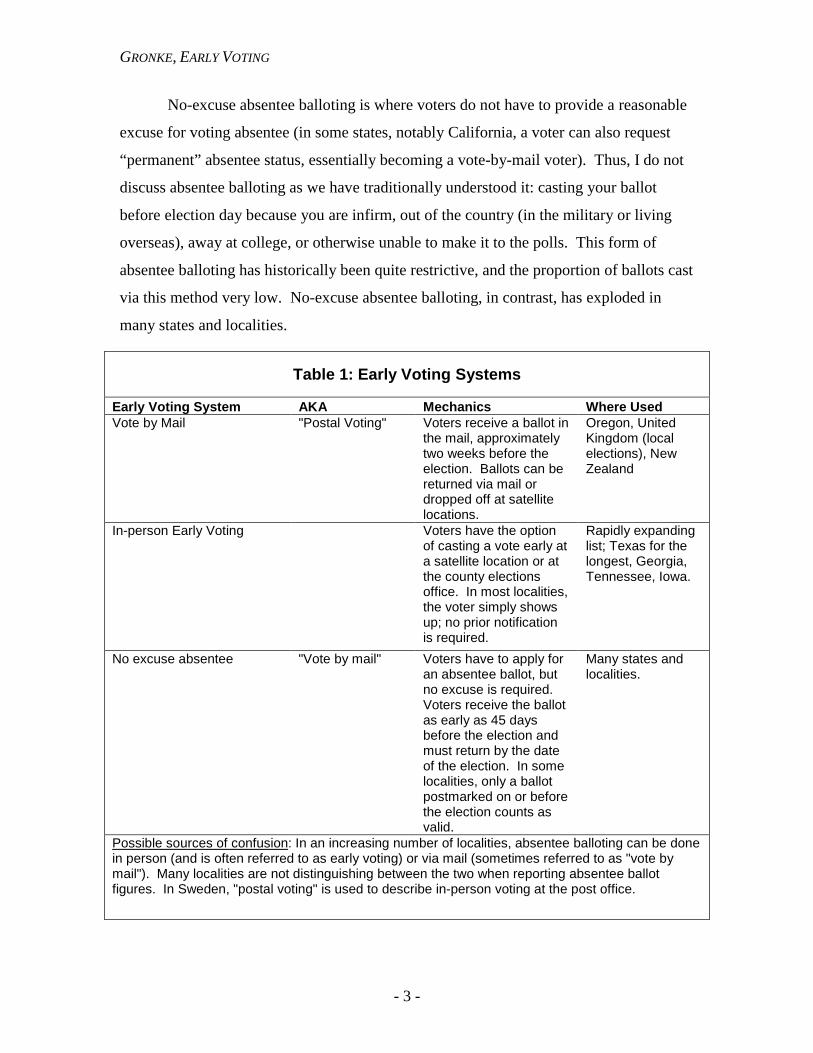
Table 1: Early Voting Systems
Early Voting System AKA Mechanics Where Used Vote by Mail "Postal Voting" Voters receive a ballot in
the mail, approximately two weeks before the election. Ballots can be returned via mail or dropped off at satellite locations.
Oregon, United Kingdom (local elections), New Zealand
In-person Early Voting Voters have the option of casting a vote early at a satellite location or at the county elections office. In most localities, the voter simply shows up; no prior notification is required.
Rapidly expanding list; Texas for the longest, Georgia, Tennessee, Iowa.
No excuse absentee "Vote by mail" Voters have to apply for an absentee ballot, but no excuse is required. Voters receive the ballot as early as 45 days before the election and must return by the date of the election. In some localities, only a ballot postmarked on or before the election counts as valid.
Many states and localities.
Possible sources of confusion: In an increasing number of localities, absentee balloting can be done in person (and is often referred to as early voting) or via mail (sometimes referred to as "vote by mail"). Many localities are not distinguishing between the two when reporting absentee ballot figures. In Sweden, "postal voting" is used to describe in-person voting at the post office.
GRONKE, EARLY VOTING
- 4 -
Finally, vote-by-mail (VBM) is a system that has been used by the State of
Oregon for all elections since 1998 (the first election conducted in this manner was a
1996 special election). Under VBM, the voter receives a voter’s guide approximately
three weeks before election day, followed by the ballot, generally mailed 18 days before
the election. The voter may return the ballot any time after it is received, usually 15 days
or closer to election day.2
Citizens have voted with their feet (or stamps), increasingly choosing early voting
over precinct voting on election day. This has led to a rapid growth in early voting
among those states that have relaxed their requirements. In Oregon, survey data shows
that Oregonians love vote by mail. They express a very high level of satisfaction with the
system and claim that it makes them more likely to turn out to vote (Southwell 2004a,
2004b, 1998, 1996). Almost three-quarters of Oregonians say they like it for the
convenience; “saves them time” and “gives them more time to read the ballot” are also
commonly cited benefits to vote by mail.
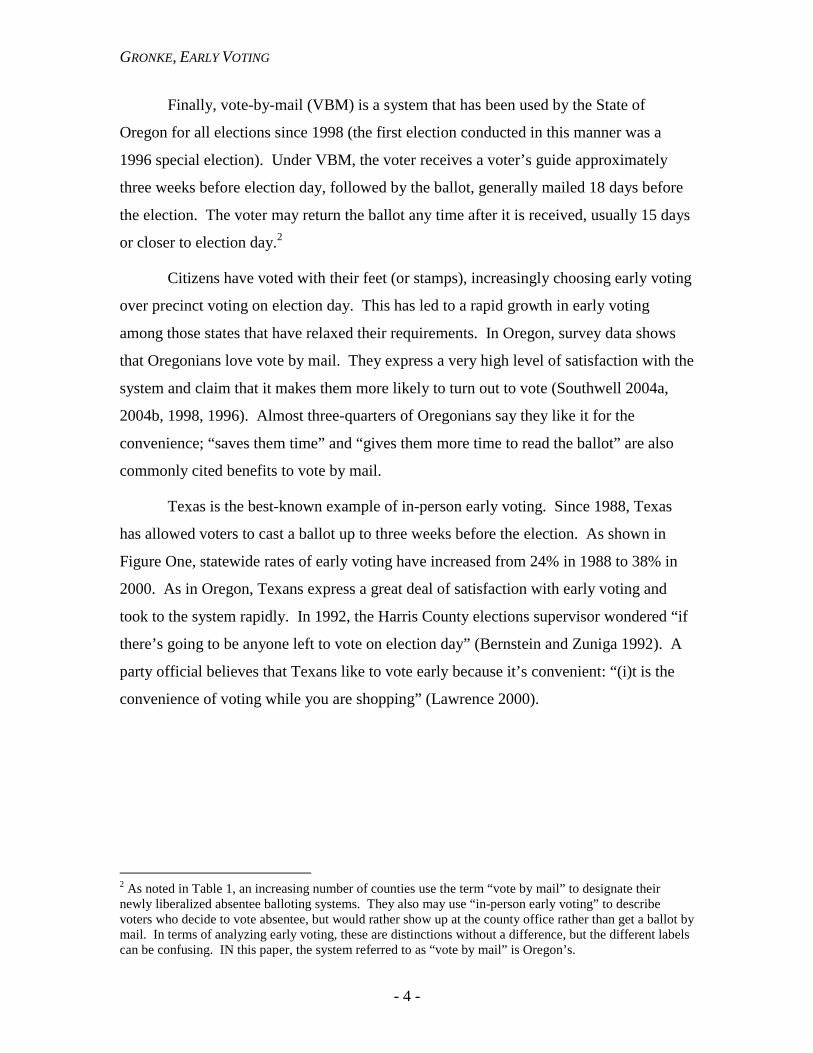
Texas is the best-known example of in-person early voting. Since 1988, Texas
has allowed voters to cast a ballot up to three weeks before the election. As shown in
Figure One, statewide rates of early voting have increased from 24% in 1988 to 38% in
2000. As in Oregon, Texans express a great deal of satisfaction with early voting and
took to the system rapidly. In 1992, the Harris County elections supervisor wondered “if
there’s going to be anyone left to vote on election day” (Bernstein and Zuniga 1992). A
party official believes that Texans like to vote early because it’s convenient: “(i)t is the
convenience of voting while you are shopping” (Lawrence 2000).
2 As noted in Table 1, an increasing number of counties use the term “vote by mail” to designate their newly liberalized absentee balloting systems. They also may use “in-person early voting” to describe voters who decide to vote absentee, but would rather show up at the county office rather than get a ballot by mail. In terms of analyzing early voting, these are distinctions without a difference, but the different labels can be confusing. IN this paper, the system referred to as “vote by mail” is Oregon’s.
GRONKE, EARLY VOTING
- 5 -
Figure One: Trends in Early Voting in Texas
0
0.1
0.2
0.3
0.4
0.5
1988 1990 1992 1994 1996 1998 2000 2002
Perc
ent V
otin
g Ea
rly (S
tate
wid
e)
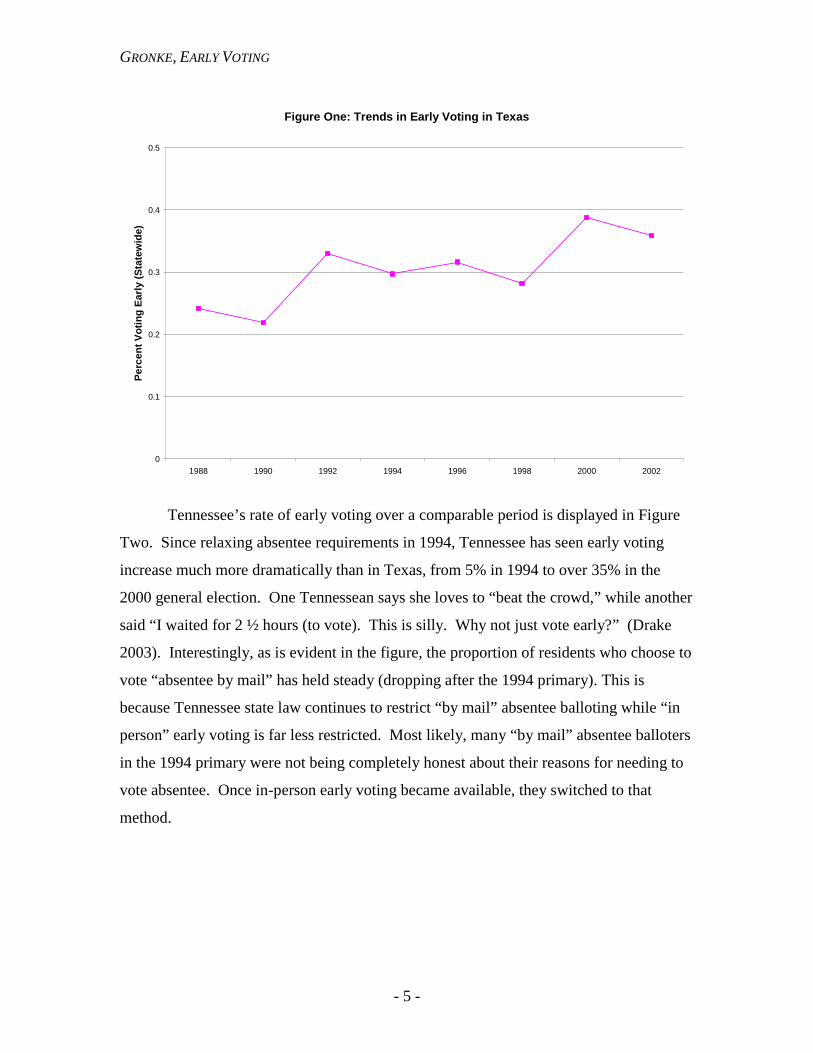
Tennessee’s rate of early voting over a comparable period is displayed in Figure
Two. Since relaxing absentee requirements in 1994, Tennessee has seen early voting
increase much more dramatically than in Texas, from 5% in 1994 to over 35% in the
2000 general election. One Tennessean says she loves to “beat the crowd,” while another
said “I waited for 2 ½ hours (to vote). This is silly. Why not just vote early?” (Drake
2003). Interestingly, as is evident in the figure, the proportion of residents who choose to
vote “absentee by mail” has held steady (dropping after the 1994 primary). This is
because Tennessee state law continues to restrict “by mail” absentee balloting while “in
person” early voting is far less restricted. Most likely, many “by mail” absentee balloters
in the 1994 primary were not being completely honest about their reasons for needing to
vote absentee. Once in-person early voting became available, they switched to that
method.
GRONKE, EARLY VOTING
- 6 -
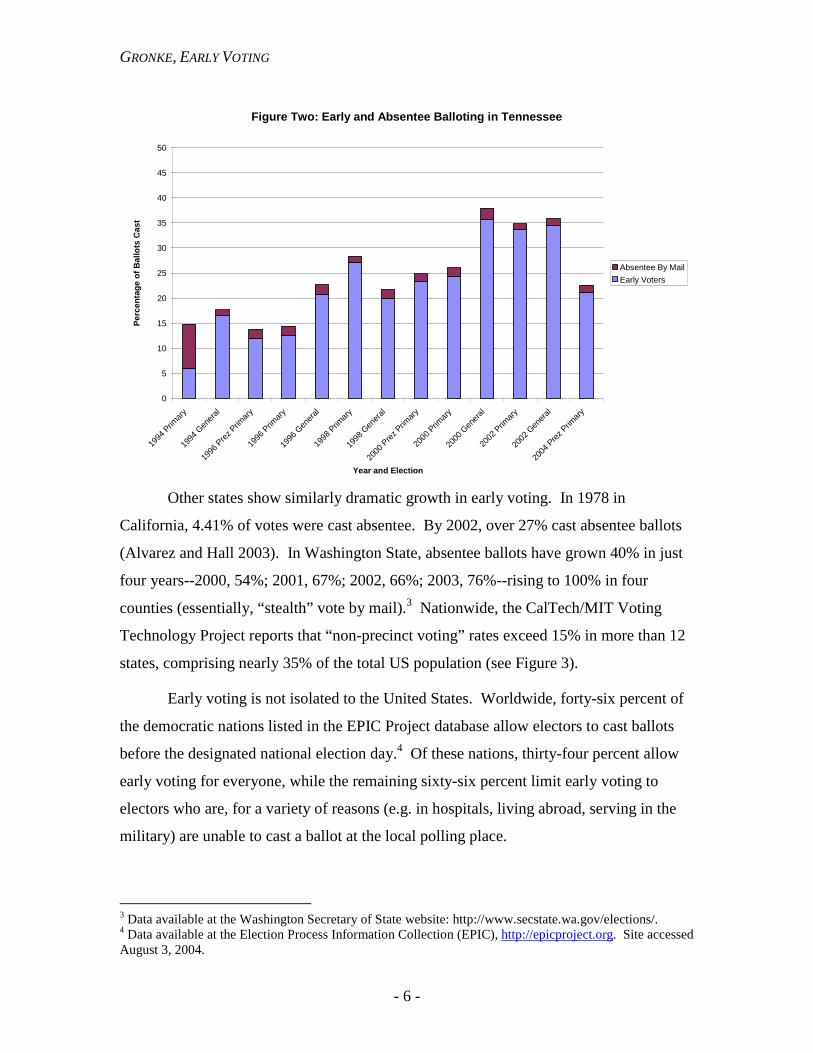
Other states show similarly dramatic growth in early voting. In 1978 in
California, 4.41% of votes were cast absentee. By 2002, over 27% cast absentee ballots
(Alvarez and Hall 2003). In Washington State, absentee ballots have grown 40% in just
four years--2000, 54%; 2001, 67%; 2002, 66%; 2003, 76%--rising to 100% in four
counties (essentially, “stealth” vote by mail).3 Nationwide, the CalTech/MIT Voting
Technology Project reports that “non-precinct voting” rates exceed 15% in more than 12
states, comprising nearly 35% of the total US population (see Figure 3).
Early voting is not isolated to the United States. Worldwide, forty-six percent of
the democratic nations listed in the EPIC Project database allow electors to cast ballots
before the designated national election day.4 Of these nations, thirty-four percent allow
early voting for everyone, while the remaining sixty-six percent limit early voting to
electors who are, for a variety of reasons (e.g. in hospitals, living abroad, serving in the
military) are unable to cast a ballot at the local polling place.
3 Data available at the Washington Secretary of State website: http://www.secstate.wa.gov/elections/. 4 Data available at the Election Process Information Collection (EPIC), http://epicproject.org. Site accessed August 3, 2004.
Figure Two: Early and Absentee Balloting in Tennessee
0
5
10
15
20
25
30
35
40
45
50
1994
Prim
ary
1994
Gen
eral
1996
Prez
Prim
ary
1996
Prim
ary
1996
Gen
eral
1998
Prim
ary
1998
Gen
eral
2000
Prez
Prim
ary
2000
Prim
ary
2000
Gen
eral
2002
Prim
ary
2002
Gen
eral
2004
Prez
Prim
ary
Year and Election
Perc
enta
ge o
f Bal
lots
Cas
t
Absentee By MailEarly Voters
GRONKE, EARLY VOTING
- 7 -
Figure 3: Non-Precinct Voting in 2000, from “Voting: What Is, What Could Be.” CalTech/MIT Voting Technology Project Report, July 2001.
In the United Kingdom, the option to vote by mail is open to anyone, but as if
2001, only four percent too advantage of it. In response to concerns over declining voter
turnout in local elections, the UK has begun to test new ways of voting. Starting in 2002,
30% of local electoral authorities experimented with new balloting methods—basically .5
New Zealand also allows vote by mail for local, but not national elections. Sweden has
allowed early voting at the post office (rather confusingly called “postal voting) since the
Second World War, but has recently stepped up its efforts to encourage early voting, and
has announced plans to adopt internet voting within the next decade.6 In all three cases,
early voting reforms have been adopted as a way to increase turnout, particularly in low
turnout, low interest contests.
It should come as no surprise that candidates, parties, and other political
organizations have adapted to this shifting electoral climate. Terry Holt, spokesperson
5 Documents from the UK Commission overseeing this transition can be found at http://www.electoralcommission.org.uk. 6 This description of “voting by post” is taken from the Riksdagen guide to voting: http://www.samhallsguiden.riksdagen.se.
GRONKE, EARLY VOTING
- 8 -
for the Bush/Cheney 2004 campaign, describes early voting as an expanded “strike zone
… (e)lection day is more than just one day now and state and national parties have had to
adjust” (Vascarello 2004). Bush’s campaign director, Ken Mehlman, says that early
voting mobilization efforts will have a “huge impact” (Harwood 2004). The Kerry
campaign plans to make an “aggressive and robust effort to help voters make their voices
heard early” (Vascarello 2004). Washington Post columnist David Broder cites an effort
by the Republican-leaning Business and Industry PAC (BIPAC) to mobilize early voters
among their member companies7 (Broder 2004), while John Harwood quotes a liberal
activist from ACT: “(y)ou think of election day as a one-day sale, but Iowa has five
whole weeks of Election Day” (Harwood 2004).
Citizens like early voting because it is convenient. Candidates like early voting
because it allows them to focus their mobilization efforts on people who vote early and
vote often, thus saving time and money for the final push at the close of the campaign.8
Election officials like early voting because it is cheaper (you do not have to hire extra
workers to count ballots on election day) and more accurate (according to the
CalTech/MIT Voting Technology project, absentee ballots are among the most accurately
counted).
Election officials—and some political commentators (see Broder’s (2004) recent
column)--also claim that early voting is superior on normative grounds. In democratic
elections, David Broder writes, “the more participants, the better.” The UK Electoral
Commission describes the 59.1% turnout in the 2001 British general as “shocking” and
argues that new voting technology will reengage the electorate (UK Electoral
Commission 2003). Not only does early voting lead to more participation, it also
promotes higher quality participation. The Oregon Secretary of State says that vote by
mail “results in more thoughtful voting, (thus) enhancing the democratic process.” (State
of Oregon 2004). It is seldom the case that a major institutional change has unalloyed
benefits. The reality is that early voting, while helping in some ways, hurts in others, but
7 Their employer’s guide is available at http://helpingamericansvote.org. 8 As we shall see below, the cost-saving element of early voting depends on whether the county or state makes ballot return information available to the campaign on an ongoing basis.
GRONKE, EARLY VOTING
- 9 -
mostly, these reforms are too recent to render judgment. In the next section, I review
scholarly research to date on early voting.
Previous Research on Early Voting According to the scholars at CalTech/ MIT Voting Technology Project, there are
at two ways to evaluate electoral reforms. First, does the reform increase the level of
participation, and second, does the reform improve the quality of participation
(CalTech/MIT 2001). Enough research has accumulated on the first question to state a
scholarly consensus: early voting does not increase turnout by bringing new voters into
the system. What it does is encourage regular voters to participate in lower intensity
contests that they might otherwise skip. Research on the second question—on the quality
of democratic decision making—is only just beginning to emerge. The empirical data are
too sparse to make any conclusions about how candidate behavior or voter decision
making may change under early voting.
Relaxed voting systems are more commonly taken advantage of by politically
activated segments of the population. VBM increases turnout more by retaining likely
voters in less intense campaigns (e.g. midterm and local elections) than by recruiting new
voters into the system (Berinsky et al. 2001, Southwell and Burchett 2000b, Southwell
1998). 9 Two studies of absentee balloting indicate that rates of absentee voting vary
positively with levels of partisan mobilization: candidates harvest absentee voters in
localities where party organizations are strong, and Republican candidates are more likely
to harvest absentee voters (Patterson and Caldeira 1985, Oliver 1996). Stein’s study of
in-person early voting in Harris County, Texas showed that that there were significantly
larger numbers of Democrats and strong partisans among the “early voters” (Stein 1998).
In a recent review of this literature, Berinsky (2004, 1) writes: “(w)hat has not
been widely recognized … is that this wave of reforms has exacerbated the
socioeconomic biases of the electorate.” Berinsky’s claim is sustained in compositional
studies of all three systems: in-person early voting (Stein 1998), liberalized absentee
balloting (Patterson and Caldeira 1985, Oliver 1996) and VBM (Karp and Banducci 9 Curtis Gans believes that early voting actually decreases turnout (Gans 2001). However, Gans’s studies are hampered by a lack of multivariate controls. The CSAE staff compares turnout increases in states with early voting provisions to those without. A more complete analysis is needed in order to test this claim.
GRONKE, EARLY VOTING
- 10 -
2000, Berinsky et al. 2001, Southwell and Burchett 2000b). Thus, we know that early
voting reforms have compositional effects. We also have good evidence that early voting
systems do not benefit one party or another (Hamner and Traugott 2004; Stein and
Leighley 2003).
What we do not know, however, is anything about the variation in rates of early
voting. All of the studies of VBM, for instance, compare the demographic (and to a
limited degree political) characteristics of those who voted to either the general
population or the voting-eligible population. Similarly, the two studies of absentee
balloting fail to examine whether liberalized absentee requirements encourage voters to
return their ballots well before the date of election. Only Stein’s three studies in Texas,
which explicitly studied the in-person early voting system, can be used to make
inferences about who votes early. And the problem with these studies is that, due to data
limitations, neither considered the date of the vote, only to whether an individual voted
early or not (Stein 1998; Stein and Garcia-Monet 1997).
Up to now, most of the studies of early voting have concentrated on its effect on
turnout. This is understandable, given the importance of political participation in the
democratic process. However, as the CalTech/MIT researchers point out, we also should
attend to the quality of participation. On this question, extant research has been mostly
silent. Addressing the impact of voting reforms on how individuals make up their minds
is a challenging assignment. Finally, we might want to know how voting reforms affect
the strategic decision making of candidates for office. In this area, political science has
also been mostly silent. In the next section, I offer some initial thoughts on early voting,
political candidates, and voter decision making.
Campaigns and Early Voting Political candidates avoid uncertainty. Whether candidates are “running scared”
(Mann 1978), engaged in “superstitious learning” (Kingdon 1968), or are discouraging
their opposition (Jacobson and Kernell 1981), in all cases candidates are attempting to
reduce the uncertainty inherent in democratic elections. Campaign efforts to mobilize
their supporters, a key part of any electoral effort, are also a way to reduce uncertainty.
GRONKE, EARLY VOTING
- 11 -
How do early voting systems alter this electoral calculus? The campaign calendar
runs on a regular cycle. In American presidential elections, for example, the general
election effort traditionally swings into action after Labor Day, followed since 1976 by a
series of candidate debates in September and October, with a final election push toward
November. Other federal, state, and local elections follow similar routines. Early voting
disrupts this cycle. Candidates cannot be certain that their mobilization and conversion
efforts are not being wasted on citizens who have already voted. Candidates cannot time
campaign appeals or launch last minute attacks to coincide with election day. This
implies that early voting will increase costs, as campaigns expend additional resources to
reduce this uncertainty.
This prediction holds only if early voting really does increase uncertainty. If
campaigns are able to find out who has cast a vote before election day, the opposite effect
will obtain. Early voting will actually reduce campaign costs, although it should still
undermine the ability of campaigns to launch last minute attacks. This leads to the
following hypothesis:
H1: Early voting (E) increases the costs of campaigns. If campaigns are able to find out who has voted early, then EV will reduce campaign costs.
Results10 The evidence I have accumulated thus far is strictly anecdotal, yet the results are
very consistent. What campaigners refer to as “mixed systems”--election systems that
have large numbers of absentee or early voters and precinct voters—substantially
increase uncertainty and raise campaign costs. Contrary to my hypothesis, however, I
have found no evidence that early voting combined with full data release by the state or
county reduces costs. Campaigners under these systems complain just as bitterly about
the necessity of carrying on an ongoing GOTV effort as those mired in “mixed” systems.
Newspaper accounts of campaigns of in-person early voting and liberalized
absentee systems highlight the importance of lengthy mobilization efforts (Nagourney
10 These results draw on three sources. First, I collected news stories that discussed the relationship between early voting and campaigns by searching on all three terms in Lexis Nexis since the 2000 election. Second, I conducted a series of interviews with get out the vote activists in Portland, OR. Third, I participated in a conference on vote by mail in Portland, OR that included political candidates, consultants, academics, and elected officials.
GRONKE, EARLY VOTING
- 12 -
2002, Wayne 2000). Local campaigners in Texas say they spend resources to recruit
“early voters.” In Washington State, no candidate can afford to ignore the 76% of the
electorate who currently mail in their ballot. At a recent conference, campaign
consultants expressed frustration at the increasing costs involved in getting to voters in
Washington, many of whom had already voted long before they were contacted (CCPS
2003). National parties, statewide campaigns, and even local candidates are devoting
increasing resources to “get out the early vote” (Harwood 2004, Vascarello 2004,
Nagourney 2002).
Candidates and activists in Oregon make similar claims about VBM even though
ballot return information is available from county officials on a daily basis. At a recent
conference, Congressman David Wu (OR-2) was asked to reflect on his experiences as a
candidate, first under traditional polling place elections, and then under VBM. Wu, no
great advocate of VBM, compared it to “Groundhog Day, the movie. You never know
where you are on any day until Election Day.” (“Vote by Mail Conference”)11 Another
political consultant describes Oregon as not “… hav(ing) an Election Day anymore. We
have an election fortnight. You have to peak sooner and sustain longer.” (Pat
McCormick, quoted in Cole 2002) While not based on systematic data, additional
discussions and presentations from elected officials, campaign consultants, and
journalists both at this conference and during confirmed Wu’s point: VBM increases the
costs of campaigning, primarily because get out the vote (GOTV) efforts and campaign
communications have to be spread over a longer period of time.
The results are consistent over time and across each type of reform: early voting
reforms increase candidate uncertainty and raises candidate costs. The worst case
scenario for campaigns is what already exists in many states and localities: a “mixed”
system where large portions of the electorate choose to cast an absentee or early vote and
the rest vote on election day. At present, I have no evidence that early voting systems
undermine the ability of campaigns to time appeals or target negative attacks. Lacking a
more comprehensive appraisal of campaign experiences over early voting systems, a
11 In the 1993 film Groundhog Day, the main character, played by Bill Murray, is stuck in time, endlessly repeating the same day, “groundhog day.” This popular metaphor in Oregon politics was in fact first coined by political consultant David Lavey, quoted in AP (2000).
GRONKE, EARLY VOTING
- 13 -
wider survey of newspaper reports from states undergoing these changes, or quantitative
evidence on campaign costs, these results are preliminary.
Who Votes Early? Aggregate and Individual Patterns We have preliminary evidence that early voting alters the strategic calculus of
candidates, requiring them to spend more time, energy, and money contacting voters. For
voters, does an extended election day alter their decision calculus? It may be that early
voters, as a group, differ in significant ways from later voters. Yet even if this aggregate
difference exists, it still does not mean that early voting matters. It may be that, other
than submitting the ballot earlier, the individual voter behaves no differently than they
would have on election day. Suppose, for example, that all early voters are strong
partisans. These same partisans may cast a straight ticket vote 14 days before election
day, or on election day. In that case, early voting makes no difference. In the paragraphs
that follow, I propose some reasons why we should expect to find aggregate differences
between early and late voters. I also suggest ways that early voting may, in fact, change
individual level decision making. I end by turning to some data that bear on both of these
questions.
It is well known that voters behave differently during hard fought, intense
campaigns than they do during low-intensity contests. During a high intensity contest,
voters are more likely to incorporate new information, rely on policy information, and are
less likely to rely on pre-existing beliefs, partisanship, or ideology (Gronke 2000, Kahn
and Kenney 1999). During low-intensity contests, voters rely on ideology, partisanship,
and other more stable long term political orientations (Gronke 2000, Alvarez 1998).
What does this mean for early voting? My expectation is that voters will hold
onto their ballots during high intensity contests, such as presidential elections, hard
fought Senatorial and gubernatorial races, and high profile initiatives and referenda. In
contrast, during low intensity contests (many state and local contests and perhaps U.S.
House races), voters will be more likely to vote early. First, there is a compositional
effect: in low-intensity contests, a higher proportion of those who turn out are well-
informed, habitual voters who have standing commitments to one or the other political
party. Second, campaign information flow is low enough during these campaigns that
GRONKE, EARLY VOTING
- 14 -
there is little new information to be gained by holding onto the ballot. This leads to the
second hypothesis:
H2: In the aggregate, rates of early voting should be negatively correlated with campaign intensity.
The same logic applies at the individual level, but now we can take advantage of
both contextual features that make voting more or less convenient, campaign features that
increase or decrease information flow, and individual level characteristics that make it
more or less likely that a voter will participate.
The fundamental turnout model is well-known in the literature: an individual
turns out to vote if the perceived benefit from voting multiplied by the probability that a
vote will make a difference, minus the costs of voting, exceeds zero:
For the purposes of this paper, I am only going to note a number of campaign, contextual,
and individual level characteristics that I believe make it more likely that an individual
will vote early. I have far too limited in the scope of my data collection to go much
further.
Convenience: One of the costs of voting is how easy it is to physically get to the
polling place. “Convenience” can be captured many ways. In Gimpel and Schuknecht’s
recent work, they correlate turnout with ballot box accessibility. They discover a
curvilinear relationship: distance imposes the most burdens in suburban precincts, not
rural precincts as we might naively assume. The reason is that even moderate travel (6-
10 miles) in a rural area can be relatively fast and easy to maneuver, while shorter
distances in suburban areas may involve difficult driving on congested streets (Gimpel
and Schuknecht 2003). This leads to my third hypothesis regarding early voting:
H3: Rates of early voting are negatively related to the ease or convenience of voting at the precinct place.
Individual Predispositions: A substantial body of research in public opinion and
electoral behavior indicates that greater amounts of information flow and longer exposure
CpB −<0 :if Vote
GRONKE, EARLY VOTING
- 15 -
to elite debate (assuming attentiveness) results in more informed decisions (Alvarez
1998, Delli Carpini and Keeter 1996). This supports the claims made by advocates of
early voting systems that they will lead to more informed, reflective decisions. However,
Zaller’s seminal work shows that only those in the midrange of exposure and interest are
likely to be influenced by campaigns, so early voting may encourage reflection only for a
subset of the voting population (Zaller 1992).
Research that directly targets time-of-voting decision shows this sort of
heterogeneity. Time-of-voting decision mediates campaign effects. Box-Steffensmeier
and Kimball (1999), for instance, argue that respondents who report making their minds
up early are more heavily influenced by long-term forces, such as partisanship and
ideology, while voters who make up their minds at the last minute are more likely to
respond to short-term campaign effects. Fournier et al. (2004) similarly argue that
campaign events, such as debates, are more influential among late deciders. According to
Fournier et al. (2004), electoral scholars, by ignoring the time-of-voting decision, have
“grossly underestimate(d) the strength of campaign effects by estimating them across the
entire electorate…”
These gross underestimates will only be exacerbated as rates of early voting
increase. In this research, I expect that committed partisans will cast their ballots early,
thus missing late breaking campaign information and decreasing the “quality” of their
decision. In contrast, the early arrival of the ballot encourages uncommitted voters to
attend more to campaign information and to reflect more before casting their ballot.
They will return their ballot relatively later. Thus, my fourth and fifth hypotheses:
H4: Early voters will include both the most and the least informed voters, but as a group, early voters will be less informed about campaign events.
H5: Rates of early voting will be conditional on voter partisanship and prior political information
Data and Methods In order to test the hypotheses presented above, I need data from four sources.
First, I need data on rates of early voting across as wide a variety of localities as possible.
GRONKE, EARLY VOTING
- 16 -
Second, I need some measure of campaign intensity for those same localities. Third, I
need surrogates for “convenience” of the precinct polling places. Fourth, I would need
individual level data on partisanship and campaign exposure.
Not surprisingly, much of these data are not available at this juncture. This is a
first report as part of a larger research effort. However, I have been able to accumulate
some evidence for each of these hypotheses.
Rates of Early Voting: It is not clear how many states keep records on rates of
early voting, nor whether those records distinguish between “by mail” early voting and
“in person” early voting. The HAVA requirement of statewide registration records by
2006 may significantly improve this situation. At this stage, a number of states and
counties keep limited historical records on early voting, and an even smaller number keep
data on ballot returns by date (Harris County, TX, Johnson County, IA, Tennessee
counties, and Oregon counties). Therefore, in order to test campaign effects, I am strictly
limited to aggregate comparisons of rates over time and across campaigns (e.g.
presidential, midterm, and off year elections). This leads to an amended version of
hypothesis 2:
H2a: Rates of early voting will be higher in off-year elections, followed by midterm elections, with the lowest rates of early voting in presidential election years.
Individual Level Ballot Return Data: The Oregon election law is somewhat
unique in that the date that the ballot is processed by election officials is a public record,
and can be obtained on a nearly real-time basis by campaigners, GOTV groups, and
others.12 One jurisdiction, Multnomah County, OR, made available to me the individual
level ballot return data for the past five elections (the list of elections is contained in the
Appendix). Future plans are to obtain these data throughout the state of Oregon, but this
involves contacting (and paying for) each individual county. Unfortunately, these five
elections do not span a presidential and a midterm election year, and they include some
very high profile ballot measures that may complicate any test of H2.
12 The only limit, as in many states, is that the data not be put to a commercial use. Note that the date reported in these data is not necessarily the date that the voter chose, nor the date that the ballot was returned. It is the date that the ballot was processed by county officials. There is an unavoidable gap.
GRONKE, EARLY VOTING
- 17 -
Attached to these records are the individual’s partisan affiliation and zip code.
Therefore, I am able to test directly hypothesis 5, but only in Oregon:
H5a: Rates of early voting by mail will be higher among individuals who are willing to identify a partisan affiliation on their voter registration form
Finally, note that there are no real “precincts” at all in Oregon. While “vote by mail”
makes it sound like you are only able to return the ballot by mail. In fact, in the most
recent election in Multnomah County, 16,000 ballots were returned to the local public
library, 11,000 were returned to “express” locations (the local grocery stores), 8000 were
returned by mail, and 6000 were returned to the county elections office.13 With all those
caveats, for the purposes of this study, I will use the average commute time (per zip code)
as a surrogate for precinct convenience. As a measure of political information, I employ
a very poor surrogate: median income level. As other controls in the model, I add the
percentage of the area that is non-white and the percent that is urban. All data are
collected from the 2000 Census. Thus:
H3a: Rates of early voting will be higher for individuals who live in areas with higher average commute times.
H4a: Rates of early voting will be higher for individuals who live in areas with higher media income levels.
Model Estimation for Individual Ballot Returns: The dependent variable in the
models that follow is the date that the ballot was returned. This variable runs from the
date of the first processed ballot (generally 14 days before election day) to zero. Data of
this format are variously described as event data, event history data, or event counts,
where the “event” in our case indicates that a ballot was returned. Alternatively, one may
think of the “duration” or “survival” rate as the period running from the first day that a
ballot can be returned up to election day.
The appropriate specification is event history or survival analysis (for reasons
why ordinary least squares regression cannot be used, see the texts listed below). The
Cox-Proportional hazards model provides the greatest amount of flexibility with regards
13 This is another often ignored element of the “Vote by Mail” system in Oregon, and one on which I am currently collecting data. As with other examples in this paper, the frequency and quality of mode of ballot return data are highly variable.
GRONKE, EARLY VOTING
- 18 -
to the underlying form of the data and is the functional form chosen here. The
coefficients in the tables will be converted to hazard rates. These can be interpreted at
the “risk” that a case will “fail”--in this case, vote--during any specified period. Fuller
descriptions of duration models can be found in Box-Steffensmeier and Jones (2004),
Zorn (2003), and Box-Steffensmeier and Zorn (2001).
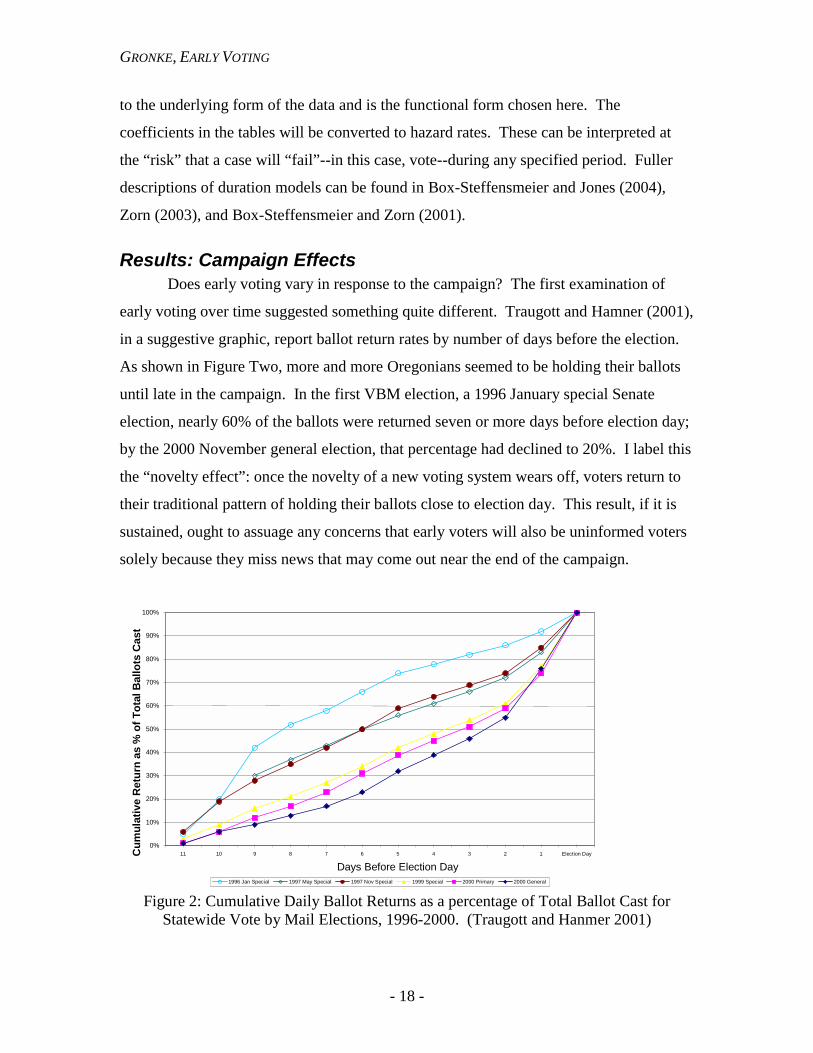
Results: Campaign Effects Does early voting vary in response to the campaign? The first examination of
early voting over time suggested something quite different. Traugott and Hamner (2001),
in a suggestive graphic, report ballot return rates by number of days before the election.
As shown in Figure Two, more and more Oregonians seemed to be holding their ballots
until late in the campaign. In the first VBM election, a 1996 January special Senate
election, nearly 60% of the ballots were returned seven or more days before election day;
by the 2000 November general election, that percentage had declined to 20%. I label this
the “novelty effect”: once the novelty of a new voting system wears off, voters return to
their traditional pattern of holding their ballots close to election day. This result, if it is
sustained, ought to assuage any concerns that early voters will also be uninformed voters
solely because they miss news that may come out near the end of the campaign.
Figure 2: Cumulative Daily Ballot Returns as a percentage of Total Ballot Cast for
Statewide Vote by Mail Elections, 1996-2000. (Traugott and Hanmer 2001)
0% 10% 20% 30% 40% 50% 60% 70% 80% 90%
100%
11 10 9 8 7 6 5 4 3 2 1 Election Day Days Before Election Day
Cum
ulat
ive
Ret
urn
as %
of T
otal
Bal
lots
Cas
t
1996 Jan Special 1997 May Special 1997 Nov Special 1999 Special 2000 Primary 2000 General
GRONKE, EARLY VOTING
- 19 -
An alternative explanation of this pattern, however, is that which I have proposed
here: campaign variability. What Traugott and Hanmer read as a linear decline in the
likelihood of early voting may indicate the difference between a special election and a
hard-fought presidential contest. More recent data from Oregon support this hypothesis,
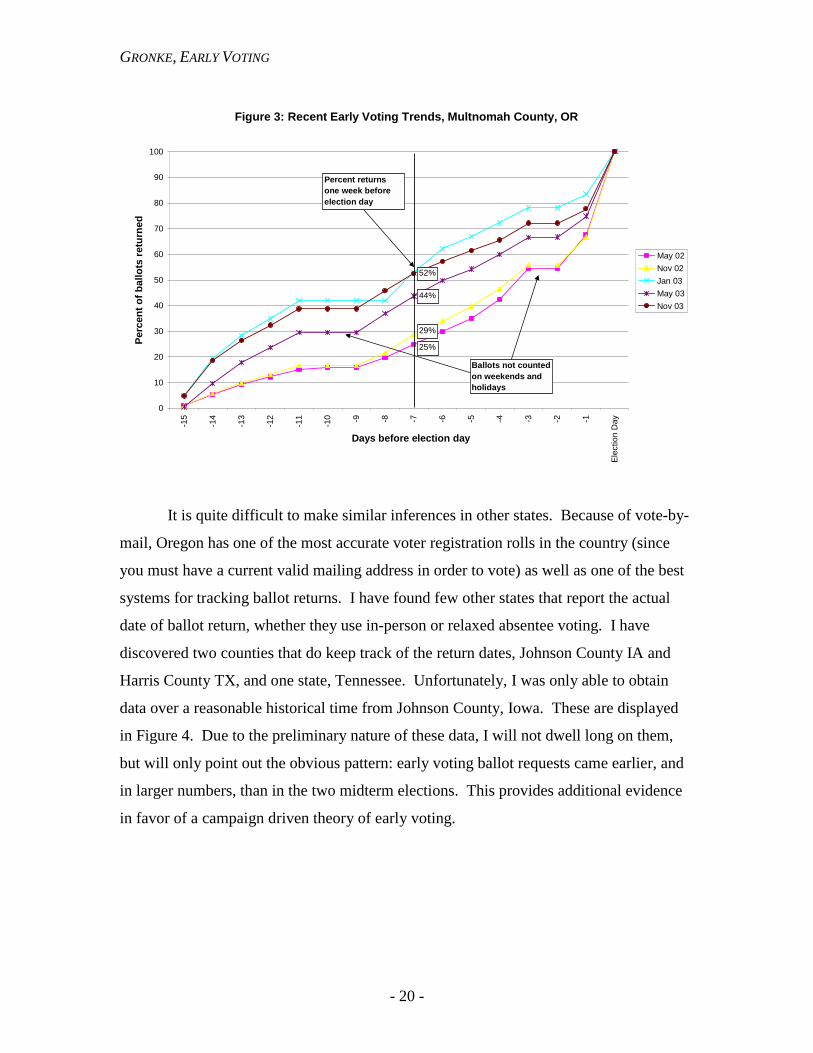
or at least call into question the novelty hypothesis. Figure 3 below plots early voting
rates for five recent elections in Multnomah County. With some variations in 2003, it
would be accurate to say that the ballots were held longest in the two elections held in
2002, while each election in 2003 showed higher rates of early voting. The elections in
which voters held their ballots longest were the 2002 primary election, one in which there
were competitive primaries on both the Republican and Democratic sides for governor,
followed by the 2002 general election, which featured a competitive gubernatorial contest
(but non-competitive Senate race). Interestingly, the highest rate of early voting occurred
in January 2003, during an extremely hard fought campaign for a statewide income tax
increase intended to plug a budget gap. Perhaps the issue of the Oregon budget deficit
and the legislature’s solution—a surcharge on income taxes—was one on which many
Oregonians had made up their mind early, regardless of the local and national attention
paid to the issue.
GRONKE, EARLY VOTING
- 20 -
Figure 3: Recent Early Voting Trends, Multnomah County, OR
0
10
20
30
40
50
60
70
80
90
100
-15
-14
-13
-12
-11
-10 -9 -8 -7 -6 -5 -4 -3 -2 -1
Elec
tion
Day
Days before election day
Perc
ent o
f bal
lots
retu
rned
May 02Nov 02Jan 03May 03Nov 03
25%
52%
44%
29%%
Percent returns one week before election day
Ballots not counted on weekends and holidays
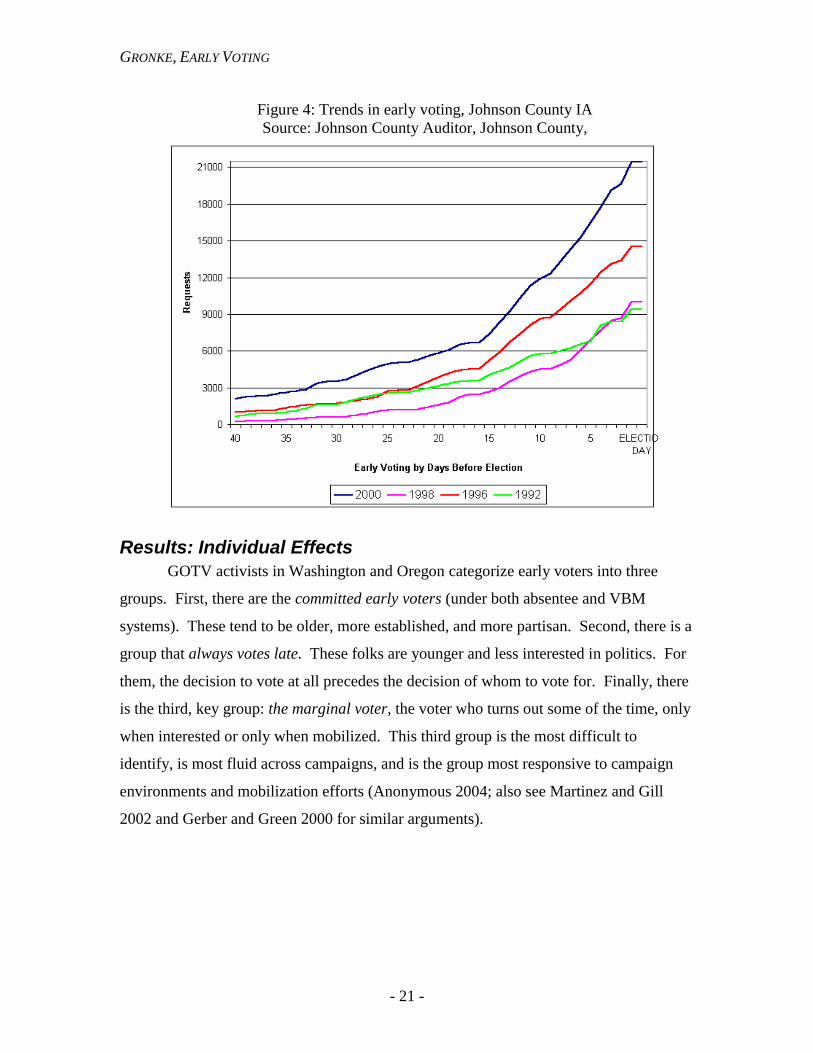
It is quite difficult to make similar inferences in other states. Because of vote-by-
mail, Oregon has one of the most accurate voter registration rolls in the country (since
you must have a current valid mailing address in order to vote) as well as one of the best
systems for tracking ballot returns. I have found few other states that report the actual
date of ballot return, whether they use in-person or relaxed absentee voting. I have
discovered two counties that do keep track of the return dates, Johnson County IA and
Harris County TX, and one state, Tennessee. Unfortunately, I was only able to obtain
data over a reasonable historical time from Johnson County, Iowa. These are displayed
in Figure 4. Due to the preliminary nature of these data, I will not dwell long on them,
but will only point out the obvious pattern: early voting ballot requests came earlier, and
in larger numbers, than in the two midterm elections. This provides additional evidence
in favor of a campaign driven theory of early voting.
GRONKE, EARLY VOTING
- 21 -
Results: Individual Effects GOTV activists in Washington and Oregon categorize early voters into three
groups. First, there are the committed early voters (under both absentee and VBM
systems). These tend to be older, more established, and more partisan. Second, there is a
group that always votes late. These folks are younger and less interested in politics. For
them, the decision to vote at all precedes the decision of whom to vote for. Finally, there
is the third, key group: the marginal voter, the voter who turns out some of the time, only
when interested or only when mobilized. This third group is the most difficult to
identify, is most fluid across campaigns, and is the group most responsive to campaign
environments and mobilization efforts (Anonymous 2004; also see Martinez and Gill
2002 and Gerber and Green 2000 for similar arguments).
Figure 4: Trends in early voting, Johnson County IA Source: Johnson County Auditor, Johnson County,
GRONKE, EARLY VOTING
- 22 -
Variable CoefficientHazard
Change CoefficientHazard
Change CoefficientHazard
ChangeDemocrat 0.0435 ** 0.0445 0.0787 ** 0.0818 0.1104 ** 0.1167Republican 0.0482 ** 0.0493 0.0924 ** 0.0968 0.1225 ** 0.1303Percent Urban 0.0477 0.0115 0.0143 0.0034 0.1586 ** 0.0195Median Income -0.0010 -0.0189 -0.0006 -0.0105 0.0002 0.0000Commute Minutes 0.0080 ** 0.0412 0.0050 ** 0.0255 0.0103 ** 0.0996Percent Non-White -0.0807 ** -0.0156 -0.0876 ** -0.0171 -0.1967 ** -0.3924Constant -2.6820 -- -2.6093 -- -2.5957 --N of CasesLR Chi (d.f.=6)
Variable CoefficientHazard
Change CoefficientHazard
ChangeDemocrat 0.0687 ** 0.0711 0.0460 ** 0.0471Republican 0.0948 ** 0.0994 0.1464 ** 0.1576Percent Urban 0.0287 0.0072 0.1052 ** 0.0266Median Income 0.0003 ** 0.0058 -0.0014 ** -0.0258Commute Minutes 0.0140 ** 0.0739 0.0161 ** 0.0838Percent Non-White -0.1670 ** -0.0319 -0.0141 -0.0027Constant -2.7058 -- -2.6558 --N of CasesLR Chi (d.f.=6)
Jan 03
May 03133.61
192194 150179
May 02 Nov 02
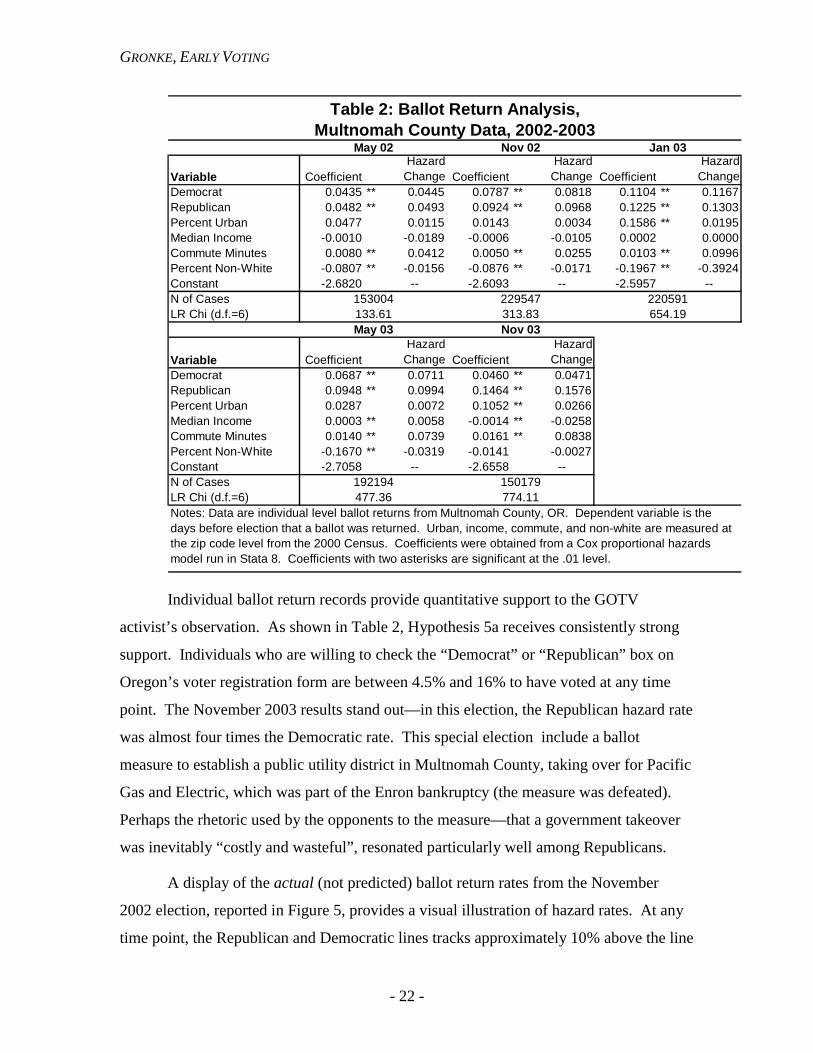
Table 2: Ballot Return Analysis, Multnomah County Data, 2002-2003
Notes: Data are individual level ballot returns from Multnomah County, OR. Dependent variable is the days before election that a ballot was returned. Urban, income, commute, and non-white are measured at the zip code level from the 2000 Census. Coefficients were obtained from a Cox proportional hazards model run in Stata 8. Coefficients with two asterisks are significant at the .01 level.
774.11477.36
654.19313.83Nov 03
153004 229547 220591
Individual ballot return records provide quantitative support to the GOTV
activist’s observation. As shown in Table 2, Hypothesis 5a receives consistently strong
support. Individuals who are willing to check the “Democrat” or “Republican” box on
Oregon’s voter registration form are between 4.5% and 16% to have voted at any time
point. The November 2003 results stand out—in this election, the Republican hazard rate
was almost four times the Democratic rate. This special election include a ballot
measure to establish a public utility district in Multnomah County, taking over for Pacific
Gas and Electric, which was part of the Enron bankruptcy (the measure was defeated).
Perhaps the rhetoric used by the opponents to the measure—that a government takeover
was inevitably “costly and wasteful”, resonated particularly well among Republicans.
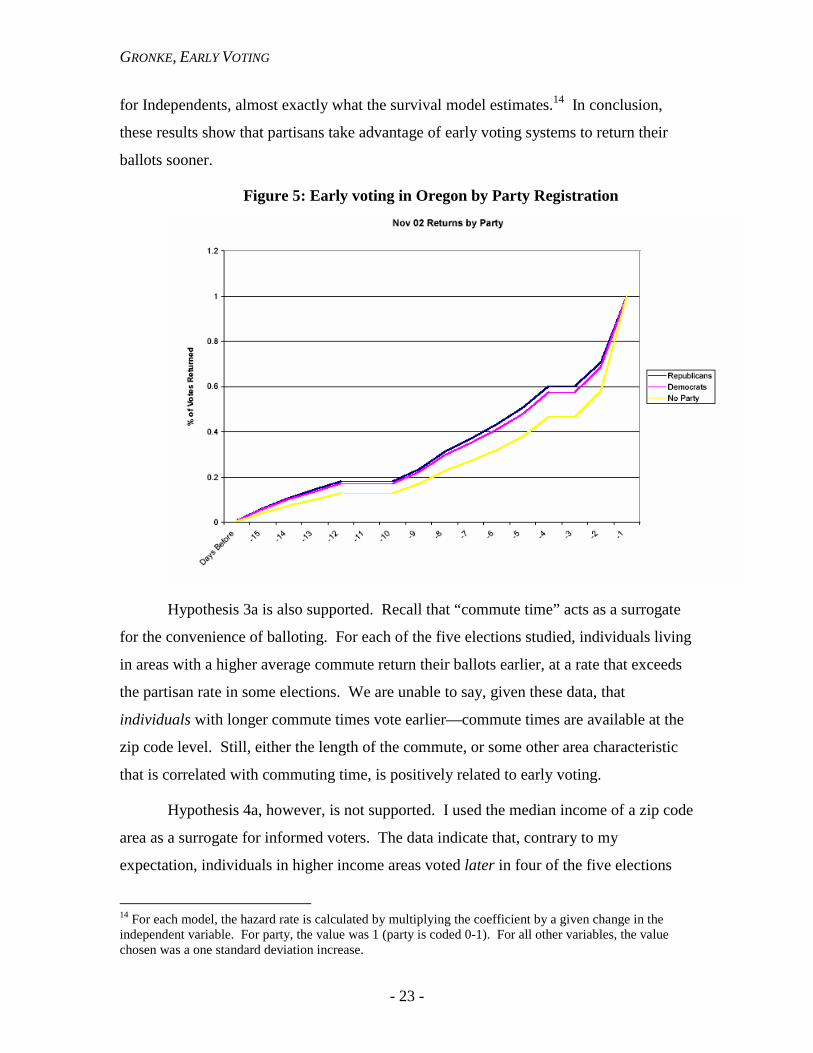
A display of the actual (not predicted) ballot return rates from the November
2002 election, reported in Figure 5, provides a visual illustration of hazard rates. At any
time point, the Republican and Democratic lines tracks approximately 10% above the line
GRONKE, EARLY VOTING
- 23 -
for Independents, almost exactly what the survival model estimates.14 In conclusion,
these results show that partisans take advantage of early voting systems to return their
ballots sooner.
Figure 5: Early voting in Oregon by Party Registration
Hypothesis 3a is also supported. Recall that “commute time” acts as a surrogate
for the convenience of balloting. For each of the five elections studied, individuals living
in areas with a higher average commute return their ballots earlier, at a rate that exceeds
the partisan rate in some elections. We are unable to say, given these data, that
individuals with longer commute times vote earlier—commute times are available at the
zip code level. Still, either the length of the commute, or some other area characteristic
that is correlated with commuting time, is positively related to early voting.
Hypothesis 4a, however, is not supported. I used the median income of a zip code
area as a surrogate for informed voters. The data indicate that, contrary to my
expectation, individuals in higher income areas voted later in four of the five elections
14 For each model, the hazard rate is calculated by multiplying the coefficient by a given change in the independent variable. For party, the value was 1 (party is coded 0-1). For all other variables, the value chosen was a one standard deviation increase.
GRONKE, EARLY VOTING
- 24 -
under study (although these results are statistically significant in only two elections).
Finally, it is interesting to note that percent non-white is consistently related to later
voting (the coefficient is negative, implying that individuals in areas with higher
proportions of non-white residents vote later). I have no explanation for this pattern.
In summary, individual level analysis supports two of the three hypotheses.
Partisans are significantly more likely to vote early, with intriguing variations across
campaigns that bear further examination. Individuals in areas with longer commute times
also take advantage of the early voting system, supporting the “convenience” result
among absentee balloters found by Gimpel and Schuknecht (2003). Finally, my
hypothesis about income and early voting was not sustained, although income is probably
a poor surrogate for political information, the key theoretical variable.
Future Directions: Campaign Dynamics and Early Voting Where to go from here? Thus far, I have suggested some hypotheses about how
early voting may alter campaign strategies and voter decision making, but the evidence is
very preliminary. To close, I would like to suggest directions that future research may
take to integrate these two perspectives. Surely, rates of early voting are a consequence
of both context, campaigns, and individuals (see Johson, Shively, and Stein 2003 for a
similar argument). A theory that incorporates all three would take us a long way toward
understanding the long term direction of early voting. I provide some suggestive
empirical evidence on these relationships below.
One direction for future research would consider how early voting—or absentee
balloting generally (if ballot return dates are not available)--varies across space. The next
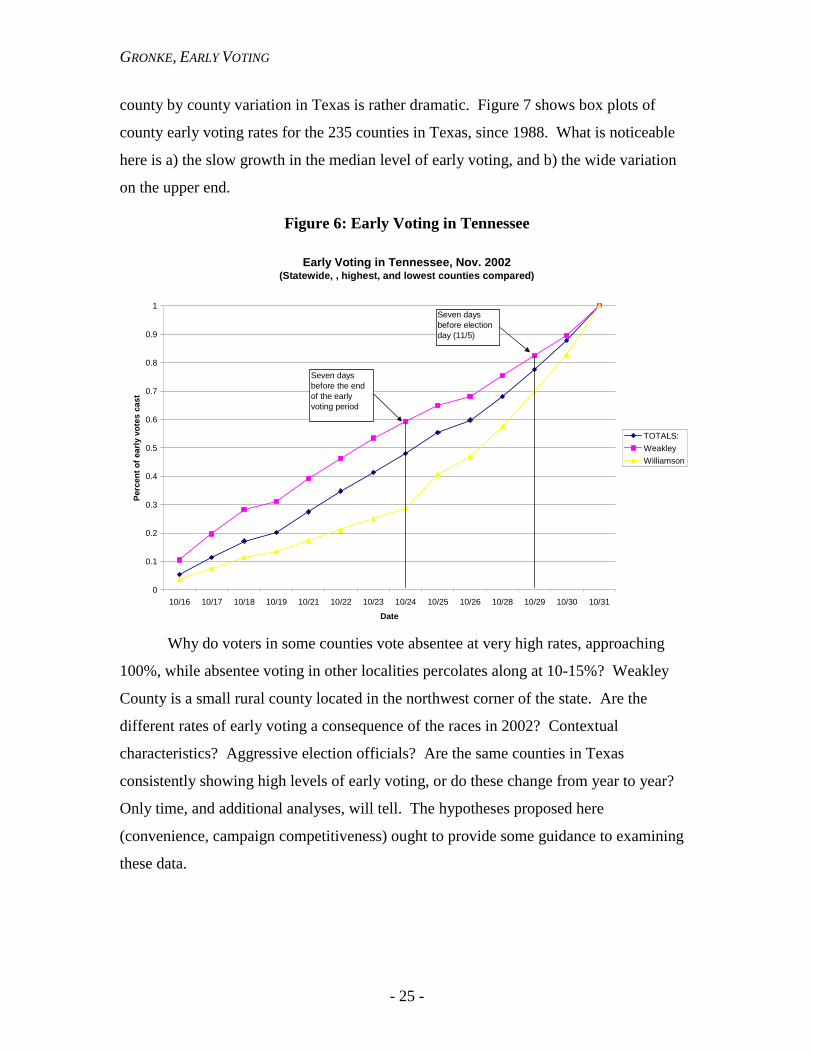
two graphics plot early voting rates in Tennessee and Texas. What is interesting about
both of these figures is the dramatic variation in early voting rates across counties. In
Figure 6, I plot the daily ballot returns from Tennessee in the 2002 general election.
Overall, the rate of ballot return (the middle line) is fairly regular. But notice the
dramatic differences between the Weakley County, with the highest level of the early
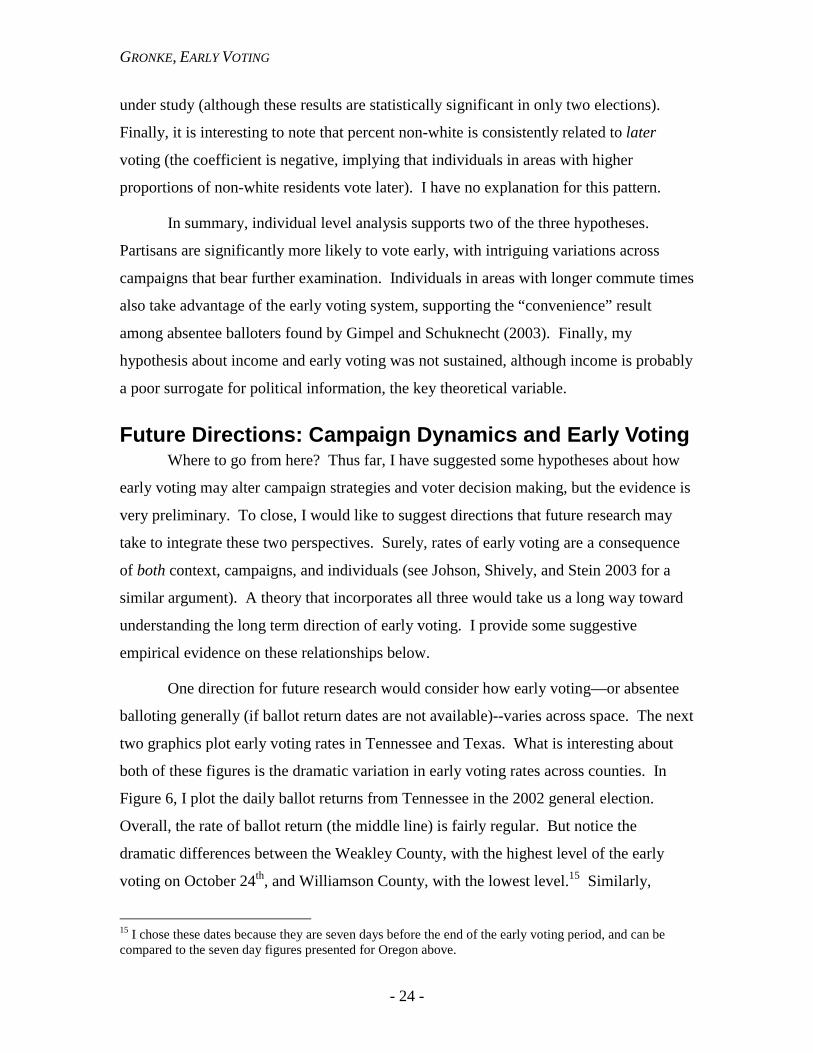
voting on October 24th, and Williamson County, with the lowest level.15 Similarly,
15 I chose these dates because they are seven days before the end of the early voting period, and can be compared to the seven day figures presented for Oregon above.
GRONKE, EARLY VOTING
- 25 -
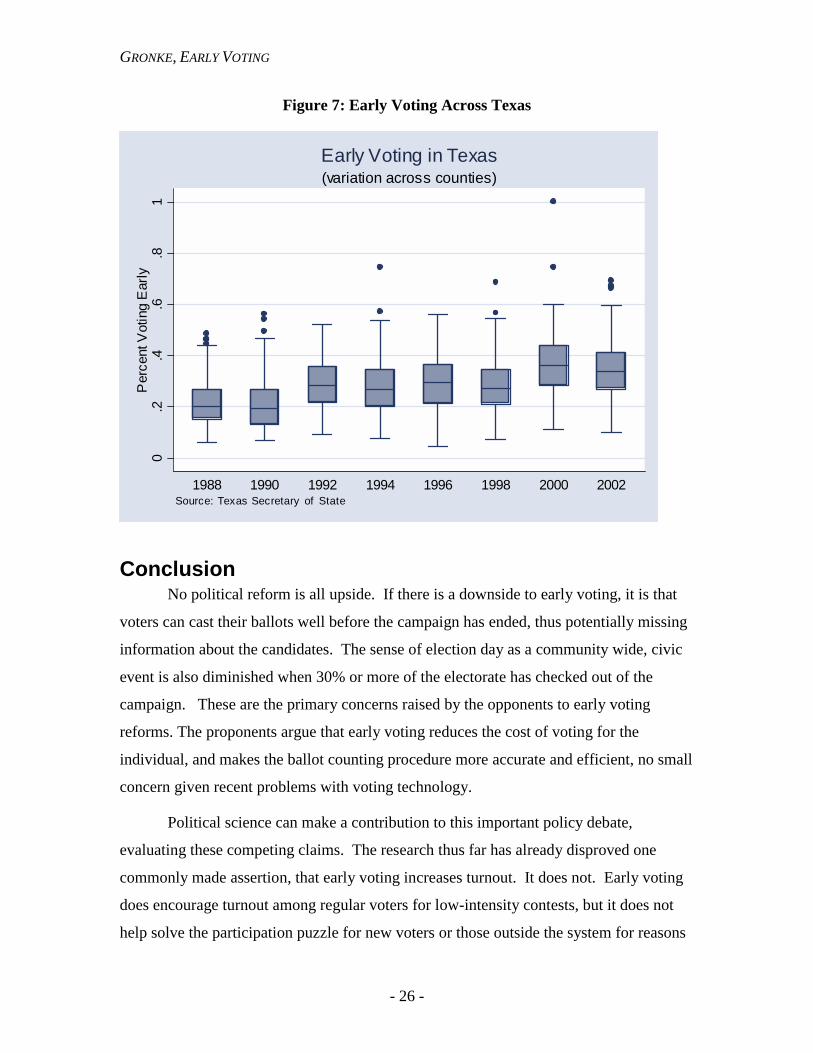
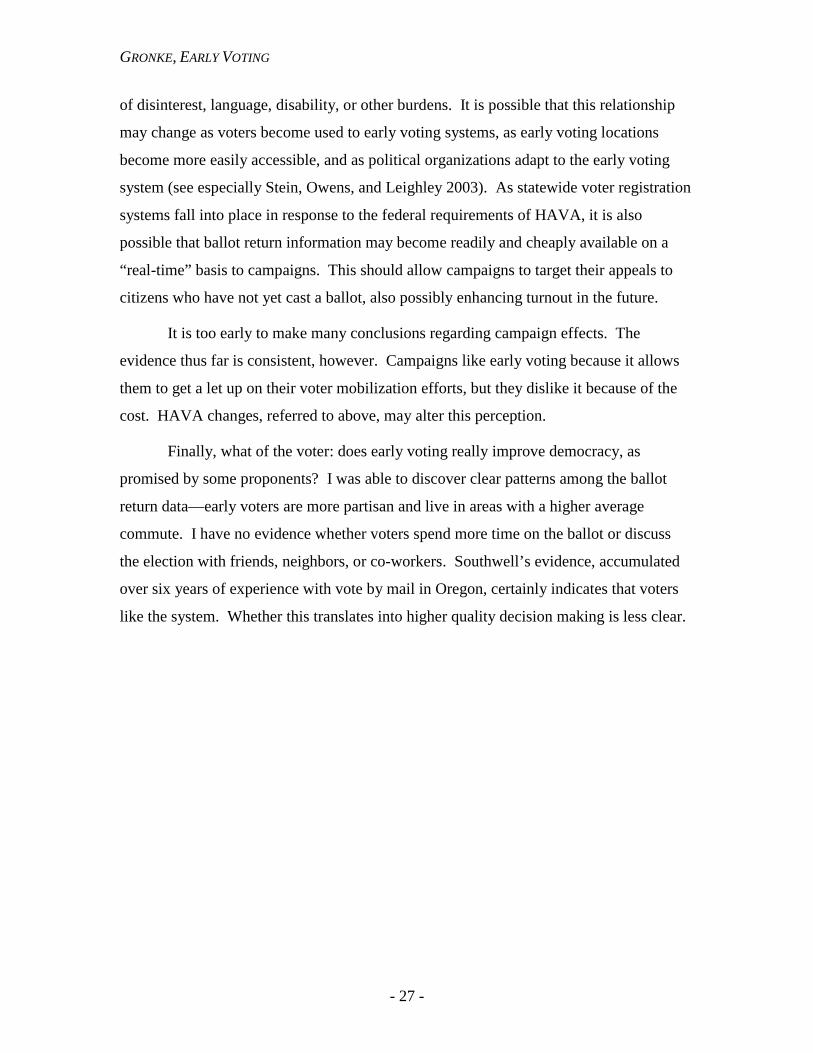
county by county variation in Texas is rather dramatic. Figure 7 shows box plots of
county early voting rates for the 235 counties in Texas, since 1988. What is noticeable
here is a) the slow growth in the median level of early voting, and b) the wide variation
on the upper end.
Figure 6: Early Voting in Tennessee
Early Voting in Tennessee, Nov. 2002(Statewide, , highest, and lowest counties compared)
0
0.1
0.2
0.3
0.4
0.5
0.6
0.7
0.8
0.9
1
10/16 10/17 10/18 10/19 10/21 10/22 10/23 10/24 10/25 10/26 10/28 10/29 10/30 10/31
Date
Perc
ent o
f ear
ly v
otes
cas
t
TOTALS:WeakleyWilliamson
Seven days before the end of the early voting period
Seven days before election day (11/5)
Why do voters in some counties vote absentee at very high rates, approaching
100%, while absentee voting in other localities percolates along at 10-15%? Weakley
County is a small rural county located in the northwest corner of the state. Are the
different rates of early voting a consequence of the races in 2002? Contextual
characteristics? Aggressive election officials? Are the same counties in Texas
consistently showing high levels of early voting, or do these change from year to year?
Only time, and additional analyses, will tell. The hypotheses proposed here
(convenience, campaign competitiveness) ought to provide some guidance to examining
these data.
GRONKE, EARLY VOTING
- 26 -
Figure 7: Early Voting Across Texas
0.2
.4.6
.81
Per
cent
Vot
ing
Ear
ly
1988 1990 1992 1994 1996 1998 2000 2002Source: Texas Secretary of State
(variation across counties)Early Voting in Texas
Conclusion No political reform is all upside. If there is a downside to early voting, it is that
voters can cast their ballots well before the campaign has ended, thus potentially missing
information about the candidates. The sense of election day as a community wide, civic
event is also diminished when 30% or more of the electorate has checked out of the
campaign. These are the primary concerns raised by the opponents to early voting
reforms. The proponents argue that early voting reduces the cost of voting for the
individual, and makes the ballot counting procedure more accurate and efficient, no small
concern given recent problems with voting technology.
Political science can make a contribution to this important policy debate,
evaluating these competing claims. The research thus far has already disproved one
commonly made assertion, that early voting increases turnout. It does not. Early voting
does encourage turnout among regular voters for low-intensity contests, but it does not
help solve the participation puzzle for new voters or those outside the system for reasons
GRONKE, EARLY VOTING
- 27 -
of disinterest, language, disability, or other burdens. It is possible that this relationship
may change as voters become used to early voting systems, as early voting locations
become more easily accessible, and as political organizations adapt to the early voting
system (see especially Stein, Owens, and Leighley 2003). As statewide voter registration
systems fall into place in response to the federal requirements of HAVA, it is also
possible that ballot return information may become readily and cheaply available on a
“real-time” basis to campaigns. This should allow campaigns to target their appeals to
citizens who have not yet cast a ballot, also possibly enhancing turnout in the future.
It is too early to make many conclusions regarding campaign effects. The
evidence thus far is consistent, however. Campaigns like early voting because it allows
them to get a let up on their voter mobilization efforts, but they dislike it because of the
cost. HAVA changes, referred to above, may alter this perception.
Finally, what of the voter: does early voting really improve democracy, as
promised by some proponents? I was able to discover clear patterns among the ballot
return data—early voters are more partisan and live in areas with a higher average
commute. I have no evidence whether voters spend more time on the ballot or discuss
the election with friends, neighbors, or co-workers. Southwell’s evidence, accumulated
over six years of experience with vote by mail in Oregon, certainly indicates that voters
like the system. Whether this translates into higher quality decision making is less clear.

GRONKE, EARLY VOTING
Appendix
Multnomah County Elections Analyzed in this Paper Election Turnout Description Number of
Ballots23 Turnout
May 21, 2002, Primary Election
Six major candidates running for Governor; non-competitive races for Senate
161,544 47%
November 5 2002,
General Election
Races for US Senate and the Governorship
245,860 68%
January 28, 2003 Special Election
Vote on Measure 28, a statewide tax increase, to solve a budget gap
235,760 65%
May 20, 2003, Special Election
Multiple local races and a countywide tax increase to solve the budget gap
204,662 56%
November 4, 2003,
Special Election
Measures to create, fund, and oversee a “People’s Utility District,” for a publicly held power utility
160,328 46%
GRONKE, EARLY VOTING
References Newspaper and Magazine Articles AP. October 2000. “Oregon First to use Mail-In Ballot.” Available at
http://lists.electorama.com/pipermail/election-methods-electorama.com/2000-October/004465.html
Broder, David. August 19, 2004. “Election Extension.” Washington Post. A25.
Drake, Sheri. October 5, 2003. “Early Voting Ends: 35,000 Cast Ballots.” The Commercial Appeal (Memphis TN). Accessed at lexis-nexis.com on August 3, 2004.
Harwood, John. August 18, 2004. “Early Ballots Could Weigh Heavily in Fall Elections.” Wall Street Journal. Accessed at online.wsj.com on August 19, 2004.
Nagourney, Adam. 2002. “Early Voting Puts Many Candidates in Early Overdrive.” New York Times October 14, 2002, Section A, Page 1.
Vascarello, Jessica E. August 14, 2004. “More voters seen opting for early decision.” Boston Globe. Accessed at http://www.boston.com on August 20, 2004.
Voting Reports, Guides, and Other Materials ACE Project Page. 2004. Website contains reports by the Administration and Cost of
Elections Project, Stockholm, Sweden. Available at http://www.aceproject.org.
Caltech/MIT Voting Technology Project. 2001. Voting: What is, What Could Be. California Institute of Technology and Massachusetts Institute of Technology.
Center for Congressional and Presidential Studies (CCPS). November 14, 2003. “Vote by Mail Conference,” Portland, OR. Streaming video available at http://www.american.edu/spa/ccps/video.html.
Helping Americans Vote: A Non-partisan, online service to make voting early for employees. Available at http://www.helpingamericansvote.org.
Institute for Democracy and Electoral Assistance (IDEA). “Postal Voting and Voting on the Internet.” Accessed at http://www.idea.int/vt/analysis/Postal_Voting_Internet_Voting.cfm on August 3, 2004.
Southwell, Priscilla L. 1996. “Final Report Survey of Vote-By-Mail Senate Elections.” Report presented to the Vote-By-Mail Citizen Commission, State of Oregon April 3, 1996.
State of Oregon. 2004. “Vote By Mail.” Available from the Oregon Secretary of State’s office or online at http://www/arcweb.state.or.us.
Traugott, Michael W. and Michael Hamner. 2001. “Oregon Vote-by-Mail Project: Report to the League of Conservation Voters Education Fund.” University of Michigan.
GRONKE, EARLY VOTING
“Vote by Mail Conference.” November 14, 2003, Portland, OR. Sponsored by the Center for Congressional and Presidential Studies, American University. Streaming video available at http://www.american.edu/spa/ccps/video.html.
Scholarly Research Alvarez, R. Michael. 1998. Information and Elections (revised edition). Ann Arbor,
MI: University of Michigan Press.
Berinsky, Adam. 2004. “The Perverse Consequences of Electoral Reform in America.” Working paper, Department of Political Science, Massachusetts Institute of Technology.
Berinsky, Adam, Nancy Burns, and Michael Traugott. 2001. “Who Votes By Mail? A Dynamic Model of the Individual-Level Consequences of Voting-By-Mail Systems.” Public Opinion Quarterly 65: 178-97.
Box-Steffensmeier, Janet and Bradford Jones. 2004. Event History Modeling. New York: Cambridge University Press.
Box-Steffensmeier, Janet and David Kimball. 1999. “The timing of voting decisions in presidential campaigns.” Paper presented at the Annual Meeting of the Midwest Political Science Association, Chicago, IL.
Box-Steffensmeier, Janet and Christopher Zorn. 2001. “Duration Models and Proportional Hazards in Political Science.” American Journal of Political Science 45:951-67.
Delli Carpini, Michael X. and Scott Keeter. 1996. What Americans Know About Politics and Why It Matters. New Haven, CT: Yale University Press.
Fournier, Patrick, Richard Nadeau, Andre Blais, Elizabeth Gidengil, and Neil Nevitte. Forthcoming (2004). “Time of voting decision and susceptibility to campaign effects.” Electoral Studies.
Gans, Curtis. 2001. “Two Pro-Participation Reforms Actually Harm Turnout; Other Reforms Suggested.” Press release from the Center for the Study of the American Electorate dated January 9, 2001.
Gimpel, J.G. and J.E. Schuknecht. 2003. “Political participation and the accessibility of the ballot box.” Political Geography 22: 471-88.
Gronke, Paul. 2000. The Electorate, the Campaign, and the Office. Ann Arbor, MI: University of Michigan Press.
Jacobson, Gary C. and Samuel Kernell. 1981. Strategy and Choice in Congressional Elections. New Haven CT: Yale University Press.
Johnson, Martin, W. Philips Shively, and Robert Stein. 2002. “Contextual Data and the Study of Elections and Voting Behavior: Connecting Individuals to Environments.” Electoral Studies, 21:63-77.
Hamner, Michael J. and Michael W. Traugott. Forthcoming (2004). “The Impact of Voting By Mail on Voter Behavior.” American Politics Research.
GRONKE, EARLY VOTING
Kahn, Kimberly Fridkin and Patrick Kenney. 1999. The Spectacle of US Senate Campaigns. Princeton, NJ: Princeton University Press.
Karp, Jeffrey A. and Susan A. Banducci. 2000. “Going postal: How all-mail elections influence turnout.” Political Behavior 22(3): 223-239.
Kingdon, John W. 1968. Candidates for Office: Beliefs and Strategies. New York: Random House.
Mann, Thomas. 1978. Unsafe at any Margin: Interpreting Congressional Elections. Washington DC: American Enterprise Institute.
Oliver, J. Eric. 1996. “The Effects of Eligibility Restrictions and Party Activity on Absentee Voting and Overall Turnout.” American Journal of Political Science 40(2): 498-514.
Rabiroff, Aaron. 2004. “Democracy Signed, Sealed, and Delivered. Oregon’s Vote by Mail System.” Undergraduate thesis, Department of Political Science, Reed College, Portland OR.
Richardson, Lilliard and Grant W. Neeley. 2001. “Who is early voting? An individual-level examination.” Social Science Journal 38: 381-92.
Richey, Sean. 2002. Voting By Mail: Institutional Reform and Political Participation in Oregon. Unpublished PhD dissertation, City University of New York.
Southwell, Priscilla L. 1998. “Vote by mail in the State of Oregon.” Willamette Law Review 34(2): 345-56.
---------. 2000. “From Experiment to Status Quo: The Adoption of Vote-By Mail in Oregon.” Paper presented at the Annual Meeting of the American Political Science Association, Washington, DC
--------. 2004a. “Five Years Later: A Re-assessment of Oregon’s Vote by Mail Electoral Process.” PS: Politics and Political Science 98(1).
--------. 2004b. Vote by Mail: Voter Preferences and Self-Reported Voting Behavior.” Paper presented at the Annual Meeting of the American Political Science Association, Chicago IL.
Southwell, Priscilla L. and Justin I. Burchett. 2000a. “The Effect of All-Mail Elections on Voter Turnout.” American Politics Quarterly 28:72-9.
--------. 2000b. “Does changing the rules change the players? Vote by mail and the composition of the electorate.” Social Science Quarterly. 81(4): 837-45
Stein, Robert. 1998. “Early Voting.” Public Opinion Quarterly 62: 57-69.
Stein, Robert and Patricia A. Garcia-Monet. 1997. “Voting Early, but Not Often.” Social Science Quarterly 78: 657-71.
Stein, Robert, Chris Owens, and Jan Leighley. 2003. “Electoral Reform, Party Mobilization, and Voter Turnout.” Paper presented at the Annual Meeting of the Midwest Political Science Association, Chicago IL.
GRONKE, EARLY VOTING
Zaller, John. 1992. The Nature and Origins of Mass Opinion. New York: Cambridge University Press.
Zorn, Christopher. 2003. “Advanced MLE: Week Two, Duration Models.” Notes from the ICPSR Summer Session, available online at http://www.polisci.emory.edu/zorn/Classes/ICPSR2003/notes1.pdf.