early intervention for foster children philip a. fisher, ph.d. oregon social learning center
TRANSCRIPT

Early Intervention for Foster Children
Philip A. Fisher, Ph.D.
Oregon Social Learning Center


Outcomes Outcomes at 6 mo at 6 mo
intervals thru intervals thru middle middle
childhoodchildhood
The Early Intervention Foster Care Study, 1999-
N= 117N= 117
PreschoolPreschool
AgedAged
Foster Foster
ChildrenChildren
Random Random AssignmentAssignment
MTFC-P MTFC-P interventionintervention
Regular foster Regular foster carecare
6060
5757
Community comparison group Community comparison group (60)(60)

Adrift in the foster care system
Birth 1yr 2yrrs 3yrs 4yrs 5yrs 6yrs 7yrs
Child 3
*
Child 2
Child 1
Overall sample characteristics
Mean age at first foster placement 3.4152
Age at first placement
Number of living transitions at study start Frequency Percent
1.00 17 14.5 2.00 27 23.1 3.00 21 17.9 4 or more 52 44.4
Valid
Total 117 100.0
Frequency Percent birth to 6 mons 3 2.6 6 mons to 12 mons 7 6.0 12 to 24 mons 8 6.8 24 to 36 mons 18 15.4 36 to 48 mons 37 31.6 48 mons or order 44 37.6
Valid
Total 117 100.0

When foster care works…
Child 4
Child 5
Birth 1yr 2yrrs 3yrs 4yrs 5yrs 6yrs 7yrs
Child 6

(adapted from Fisher, Burraston, & Pears, 2005)
1 2 3 4 5 6 7+
90
80
70
60
50
40
30
20
10
0
%
Number of placements
Percent of placement failures based on number of prior placements

HPA axis dysregulation associated with early life stress
0
0.2
0.4
0.6
0.8
1
wakeup midmorning bedtime
00.20.4
0.60.8
1
wakeup mid morning bedtime
typical daytime HPA activity
ug/
dl
typical
low daytime HPA activity
ug/
dl
chronically elevated daytime HPA activity
ug/
dl
0
0.2
0.4
0.6
0.8
1
wakeup midmorning bedtime
stress-induced ‘blunted’patterns
0
0.2
0.4
0.6
0.8
1
wakeup midmorning bedtime
00.20.4
0.60.8
1
wakeup mid morning bedtime
typical daytime HPA activity
ug/
dl
typical
low daytime HPA activity
ug/
dl
chronically elevated daytime HPA activity
ug/
dl
0
0.2
0.4
0.6
0.8
1
wakeup midmorning bedtime
stress-induced ‘blunted’patterns
00.20.4
0.60.8
1
wakeup mid morning bedtime
typical daytime HPA activity
ug/
dl
typical
low daytime HPA activity
ug/
dl
chronically elevated daytime HPA activity
ug/
dl
0
0.2
0.4
0.6
0.8
1
wakeup midmorning bedtime
00.20.4
0.60.8
1
wakeup mid morning bedtime
typical daytime HPA activity
ug/
dl
typical
low daytime HPA activity
ug/
dl
low daytime HPA activity
ug/
dl
chronically elevated daytime HPA activity
ug/
dl
chronically elevated daytime HPA activity
ug/
dl
0
0.2
0.4
0.6
0.8
1
wakeup midmorning bedtime
stress-induced ‘blunted’patterns
(downregulation via chronic stress)
Anxiety and affective disorders

Some, but not all, foster children show altered HPA axis function
Bruce, Fisher, Pears, & Levine (submitted)
HighAverageLow
Cortisol Classification
70.0%
60.0%
50.0%
40.0%
30.0%
20.0%
10.0%
0.0%
Perc
enta
ge o
f C
hild
ren
CC
FCGroup
HighAverageLow
Cortisol Classification
70.0%
60.0%
50.0%
40.0%
30.0%
20.0%
10.0%
0.0%
Perc
enta
ge o
f C
hild
ren
CC
FCGroup
Percentage of comparison and foster children with typical, low, and high cortisol patterns
0
10
20
30
40
50
60
70
80
90
Typical Low High
Cortisol pattern
Perc
enta
ge o
f ch
ildre
n
Comparison
Foster
Percentage of comparison and foster children with typical, low, and high cortisol patterns
0
10
20
30
40
50
60
70
80
90
Typical Low High
Cortisol pattern
Perc
enta
ge o
f ch
ildre
n
Comparison
Foster
Oregon Delaware
Dozier et al. (2007)
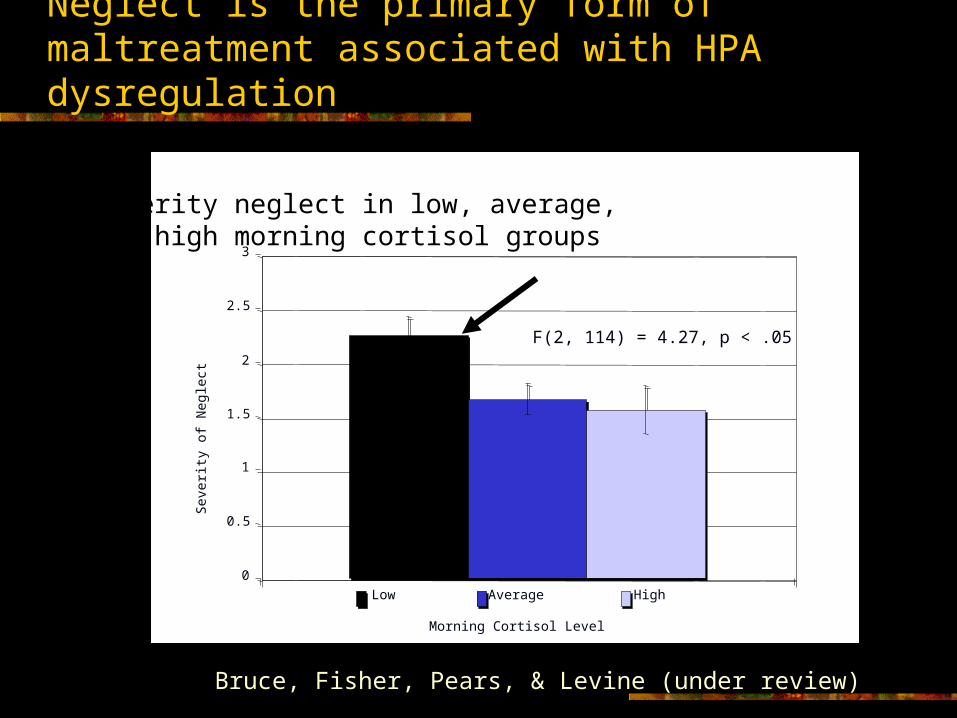
Neglect is the primary form of maltreatment associated with HPA dysregulation
Bruce, Fisher, Pears, & Levine (under review)
Relation between Neglect and Morning CortisolLevels
0
0.5
1
1.5
2
2.5
3
Morning Cortisol Level
Severi
ty o
f N
eg
lect
Low Average High
F(2, 114) = 4.27, p < .05
Severity neglect in low, average, and high morning cortisol groups
0
0.5
1
1.5
2
2.5
3
Morning Cortisol Level
Severi
ty o
f N
eg
lect
Low Average High
F(2, 114) = 4.27, p < .05

Prefrontal Cortex Regions
Inhibitory control
Working memory
Planning
Decision-making in context of rewards and consequences
ADHD Substance abuse

1.501.000.500.00-0.50-1.00-1.50-2.00
Executive Functioning
6.00
5.00
4.00
3.00
2.00
1.00
0.00
r = -.22, p = .02
# o
f p
lacem
en
ts
Association Between # of Prior Placements and Executive Functioning

Neurobiological vulnerabilities from early stress for foster children
HPA system
Severity of neglect
Dis
rupt
ed d
aily
rhy
thm
Prefrontal cortex
# of placements
Imp
aire
d ex
ecut
ive
fun
ctio
n•Neurobiologically informed interventions
•Interventions with neurobiological targets

Early intervention in foster care works
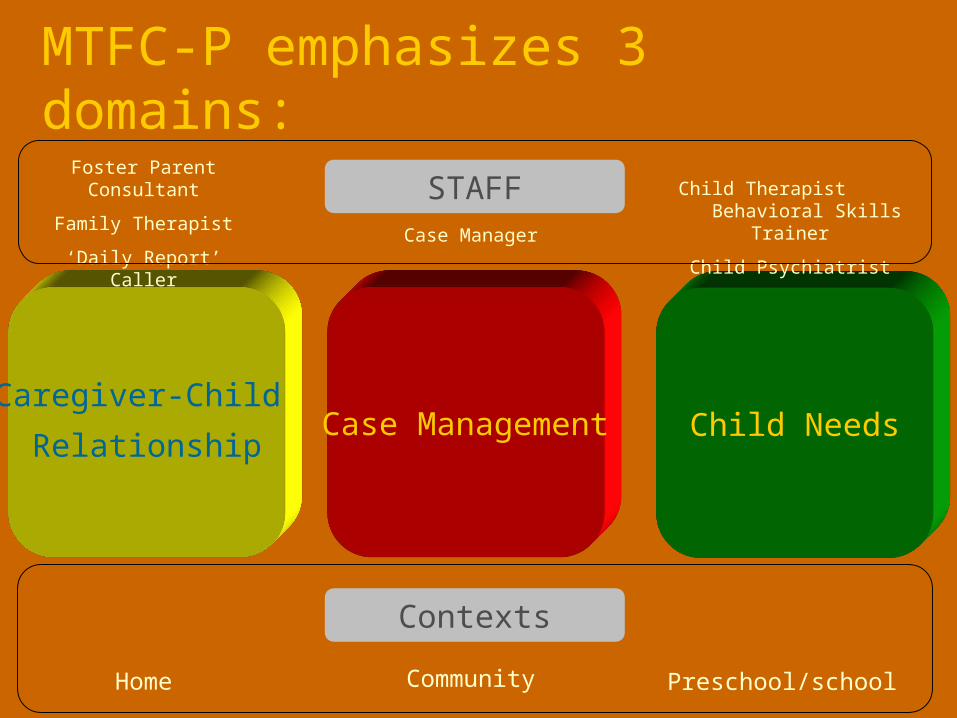
MTFC-P emphasizes 3 domains:
Child NeedsCaregiver-Child
RelationshipCase Management
Foster Parent Consultant
Family Therapist
‘Daily Report’ Caller Case Manager
Child Therapist Behavioral Skills Trainer
Child Psychiatrist
STAFF
Home Community Preschool/school
Contexts

5 Key Program Components
Foster parent support & consultation services Pre-placement training Weekly group meeting 24/7 on call support
Child treatment services
Parenting support for birth/adoptive families
Daily Report telephone check-in w/caregiver
Clearly specified staff roles & responsibilities

0
0.2
0.4
0.6
0.8
1
wakeup mid morning bedtime
Initial
3 Month
6 Month
HPA Plasticity
Therapeutic intervention

Group effects on morning cortisol levels across time for all children
MTFC-PReg foster care
Comm-unity Comp
Fisher, Gunnar, Dozier, Bruce, & Pears (2007), Annals NYAS

Intervention effects on executive functioning:Feedback negativity at Fz (prefrotnal center electrode site)
-12
-10
-8
-6
-4
-2
0
2
4
6
8
10
12
14
16
-200 -100 0 100 200 300 400 500 600 700 800
CC CorrectIncorrect
RFC CorrectIncorrect
Group:F(2, 31) = 1.80, nsInteraction:F(2, 31) = 5.11, p < .05
Bruce, Martin-McDermott, Fisher, & Fox (under review)
-12
-10
-8
-6
-4
-2
0
2
4
6
8
10
12
14
16
-200 -100 0 100 200 300 400 500 600 700 800
MTFC-P CorrectIncorrect
-12
-10
-8
-6
-4
-2
0
2
4
6
8
10
12
14
16
-200 -100 0 100 200 300 400 500 600 700 800

Month
Ca
reg
ive
r S
tre
ss
2 4 6 8 10 12 14
0.1
00
.15
0.2
00
.25
0.3
00
.35
RFCTFC
Fisher & Stoolmiller (in press)
Conditional probability of caregiver stress given child behavior problems
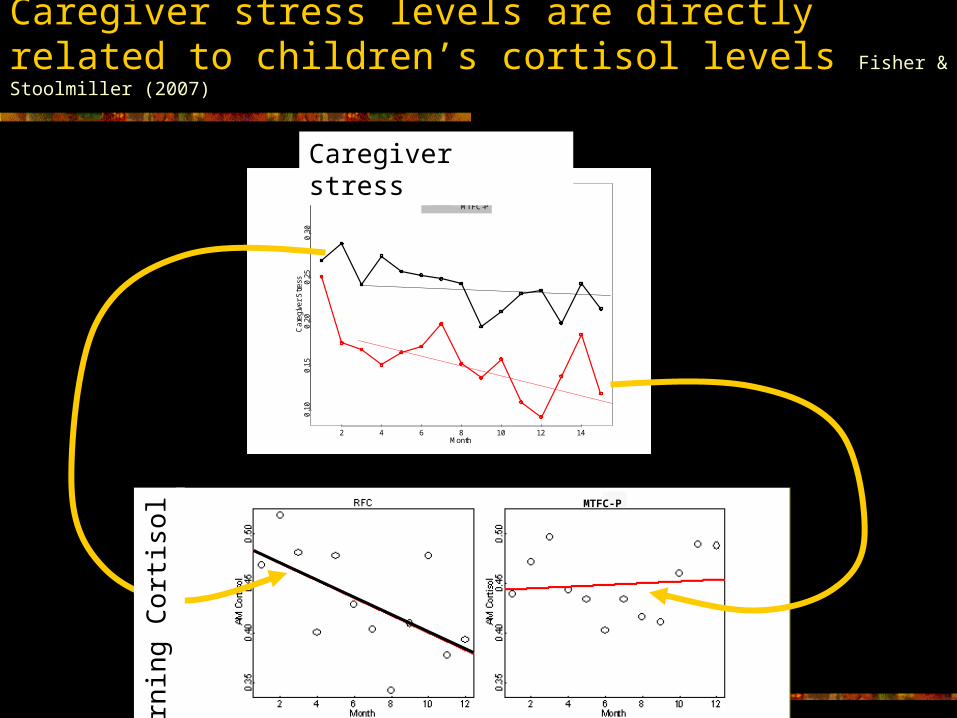
Caregiver stress levels are directly related to children’s cortisol levels Fisher & Stoolmiller (2007)
Month
Car
egiv
er S
tres
s
2 4 6 8 10 12 14
0.10
0.15
0.20
0.25
0.30
0.35
RFCMTFC-P
Month
Car
egiv
er S
tres
s
2 4 6 8 10 12 14
0.10
0.15
0.20
0.25
0.30
0.35
RFCMTFC-P
Caregiver stress
MTFC-P
Mo
rnin
g C
ort
isol

Change in attachment (% secure behavior)
0.6
0.7
0.8
0.9
T1 T2 T3 T4 T5
Time
Secu
re b
eh
avio
r
Reg Foster Care MTFC-P Community Comparison

Early intervention improves permanency outcomes
Birth 1yr 2yrrs 3yrs 4yrs 5yrs 6yrs 7yrs
Child 7
Child 8
Child 9
Intervention begins

Successful permanent placements for children with 4 or more prior placements at study start
Regular foster care 9 of 23 (39%) MTFC-P 23 of 29 (79%)
0
5
10
15
20
25
RFC MTFC-P
Perm
No Perm


Acknowledgements NIMH MTFC-P StudyKatherine Pears
Jackie BruceKristen Greenley
Hyoun Kim
NIDA Transdisciplinary Prevention Center
John ReidPatti Chamberlain
Leslie LeveDavid DeGarmo
Mike Stoolmiller Rebecca Fetrow
NIMH Early Experience, Stress Neurobiology &
Prevention Science Network
Megan Gunnar Paul PlotskyGig Levine
Steve SuomiNathan FoxSeth PollakMary Dozier
Charles Neal James Black
Mar Sanchez Delia Vasquez
Ron Barr_
NIH Institutes
NIMH, NIDA, NICHD