earls court project · the internal road layout has been designed in line with manual for ......
TRANSCRIPT

Earls Court ProjectLondon Borough of Hammersmith & FulhamApplication 2
Transport Assessment
Prepared for EC Properties Ltdby WSP and Hacrow
February 2012
Properties

Application 2 Transport Assessment i
Executive Summary
1 Introduction 8
2 Relevant Policy & Guidance 16
3 Baseline Conditions – Land Uses & Local Area 22
4 Baseline Conditions – Local Highway Network 24
5 Baseline Conditions – Public Transport 33
6 Baseline Conditions - Walking & Cycling 42
7 Trip Generation 49
8 Demolition & Construction 62
9 Phased Trip Generation 66
10 Impacts - Road Network 73
11 Impacts – Parking 102
12 Impacts - Public Transport 109
13 Impacts – Walking and Cycling 126
14 Mitigation 133
15 Conclusions 141

Application 2 Transport Assessment 2
Executive Summary
INTRODUCTION
This report replaces the Transport Assessment (TA) submitted in support of Application 2 in June 2011. The TA has been revised to reflect changes to the development quantum and to incorporate comments from TfL and the Boroughs.
This report is submitted in relation to the development proposals for the Earls Court Site. It forms part of a suite of documents that support two planning applications. Planning Application 1 relates to land within the Royal Borough of Kensington and Chelsea (RBKC) and Planning Application 2 relates to land within the London Borough of Hammersmith and Fulham (LBHF), plus a small area of land within RBKC. This TA assesses the Site Wide Development Option (“the Development”, comprising Planning Applications 1 + 2) and all committed developments plus background growth in 2031. As a cumulative scenario, it also assesses the Development and all committed developments plus background growth in combination with the Seagrave Road proposals in 2031
Planning Application 1 and the Seagrave Road proposals are both the subject of separate Transport Assessments.
THE PROPOSALS
The proposals comprise a high-quality mixed-use development with up to 6,775 homes and Business space; retail; education; medical facilities; hotels/serviced apartments; and community, cultural and leisure uses. The Development proposals have been guided by a sustainable transport strategy, which is to be realised through a combination of design and management measures.
The Earls Court Site is currently impermeable due to the West London Line and other rail infrastructure which forms a barrier to east-west and north-south pedestrian and cyclist movements. The detailed access and outline layout proposals address this by creating a permeable network of pedestrian and cyclist routes throughout the site, including a new east-west route across the West London Line. This will improve connectivity and travel choices for the surrounding communities as well as for the Development. This permeability will also increase Public Transport Accessibility Levels by reducing walking distances for LBHF residents to Earls Court and West Brompton stations.
The Development would provide a highly walkable environment, integrated with existing and improved walking and cycling routes to provide attractive and easy connections to and from the area.
The Development would be an exemplar project to establish a cycling culture. It would encourage cycling by having a high standard of on-site cyclist facilities. In addition, provision is being made for Barclays Cycle Hire stations to be established within the Development.
The Development would include residential car parking in accordance with London Plan standards so that off-site parking pressures would not be generated on the surrounding roads. Meanwhile, non-residential parking would be constrained as part of the strategy to reduce the amount of cars being attracted into the Development.

Application 2 Transport Assessment 3
The on-site parking provision would meet the requirements of Blue Badge holders and provide for a Car Club to be established so that all occupiers would have access to the shared use of pay-as-you-go vehicles. Provision is also made for electric vehicle charging at 20% of non-residential spaces and up to 40% of all residential parking spaces, with rapid charge points among the on-street parking spaces for the benefit of short stay visitors.
A management strategy has been developed to encourage the efficient and sustainable movement of goods and deliveries. This would reduce the transport impacts associated with servicing so that goods and services can be delivered, and waste removed, in a safe, efficient and environmentally-friendly way.
The access layouts and proposed highway alterations have been the subject of Stage 1 Road Safety Audits (Appendix C). The Safety Audit recommendations have been reviewed, and they can all be addressed as the access designs progress towards more detailed layouts following any grant of outline planning permission.
The internal road layout has been designed in line with Manual for Streets principles, along with TfL and Borough guidance documents. The Design Guidelines for the Development include details such that pedestrians and cyclists are prioritised with permeable movement throughout the site encouraged by shared surface spaces with at-grade pedestrian crossings and routes.
Overall, it is concluded that the Development proposals encourage sustainable travel patterns from the outset, and these would be reinforced through the Framework Travel Plan measures (Appendix S).
Detailed mode-by-mode assessments have been carried out for all transport options and are summarised below for the highway network, underground rail, overground rail, buses, walking and cycling.
HIGHWAY NETWORK
Analyses show that with appropriate mitigation, the highway network would accommodate the Development traffic, and as part of this assessment, a number of improvements have been proposed across the highway network.
Traffic signal timings would be adjusted at a number of junctions across the network in order to improve the coordination and performance of the local highway network, consistent with the Mayor’s objective to smooth traffic flows. In addition to the proposed signalisation of the Lillie Road / North End Road junction and the provision of north-south and east-west through routes to improve route choice on the surrounding highway network, highway mitigation is proposed as follows:
a left turn filter from North End Road into the A4 westbound. This would run in conjunction with the right turn from the A4 into North End Road
improve signal staging at the A4 / Warwick Road junction so that the pedestrian crossings run each cycle, and more time can be given to main movements in the signal plan
accommodating the left turn from North End Road into Lillie Road and the right turn from Lillie Road into North End Road on the new highway network within the Development, with these movements being banned at the proposed signalised junction
The assessment of highway impact is robust:
it includes for all of the forecast background traffic growth, and assumes that the Development is entirely additional to the London Plan growth forecasts for London, rather than being any part of the delivery of those forecasts

Application 2 Transport Assessment 4
it assesses the impact of Development against a baseline which ignores the existing traffic and travel demand generated by Earls Court exhibition centre events
it does not take account of the mode shifts from cars towards public transport, walking and cycling which would result from the extensive Travel Plan measures
It should be noted the Development traffic models each accommodate more traffic movements than are generated by the Development. This is due to improvements in network performance resulting from the Development mitigation, which then attract some of the Base traffic from other parts of the wider road network. As such, the assessment is testing more than just the impact of Development traffic.
The analyses show some increases in journey times along the A4. It should be noted that the VISSIM models cannot fully simulate the journey time benefits arising from SCOOT signal optimisation and coordination and that the A4 journey times with the Development would therefore be faster than forecast by the VISSIM models.
It is envisaged that further detailed traffic modelling will be required in due course as part of the standard TfL process for procuring new traffic signals and altering existing signals, after the acceptability in principle of the Development has been established.
The accident analysis has found clusters of pedestrian, cyclist and motorcyclist accidents along Lillie Road and North End Road during hours of darkness, so it is proposed to improve street lighting as part of the access designs and to make financial contributions for lighting improvements as part of the public realm strategy.
LONDON UNDERGROUND
The Earls Court Site has good access to Earls Court, West Kensington and West Brompton stations, which provide a total of 84, 28 and 27 services per hour respectively.
The Piccadilly and District Lines are to be upgraded in line with the Mayor’s Transport Strategy commitment to deliver passenger capacity increases of up to 19% on the District Line and 30% on the Piccadilly Line.
Analyses using TfL’s Railplan model show that travel demand from the Development plus the Seagrave Road proposals would result in a negligible change on the underground network in 2031. The assessment in 2031 shows the network performing at a similar level to the existing situation, due to background growth plus the cumulative development demands being matched by the committed increases in capacity.
At Earls Court station, the gatelines at both ticket halls would not be materially impacted by the Planning Application 2 proposals in conjunction the cumulative impact of Seagrave Road in 2031 and interchange capacity between the District Line and Piccadilly Line would be improved.
Application 1 includes the re-commissioning of the existing pedestrian tunnel entrance, accessed from the basement of the Earls Court Exhibition Centre. This would be of significant benefit to the station by reducing the number of passengers using the eastbound District Line platforms as a route to the Piccadilly Line platforms and also reduce background growth pressures on the Warwick Road gateline.
At West Kensington station, the cumulative impact of the Development plus Seagrave Road does not generate any material change in passenger congestion

Application 2 Transport Assessment 5
and queuing. In terms of mitigation requirements at West Kensington, an additional gate along the existing gateline (a total of 5 gates) would return passenger densities to below the 2009 levels.
However, the Applicant proposes that a comprehensive improvement of the station is undertaken and the preferred option includes for a rationalised ticketing suite with increased ticket hall area plus three new gates, and it is proposed to address the step free access deficiencies of Platform 1.
OVERGROUND RAIL
The Development would have good access to West London Line services at West Brompton station, where London Overground and Southern Trains run approximately 10 two-way mainline trains per hour in the peak. The West London Line upgrade is being implemented and increases peak capacity by 97% northbound and 65% southbound.
The cumulative impact of the Development plus Seagrave Road would result in future standing densities significantly less than the Existing Base and would involve a maximum change from the 2031 Base of only five passengers per carriage between Imperial Wharf and West Brompton.
BUSES
The cumulative impact of the Development plus Seagrave Road would be well within the overall seating capacities from Railplan. It is assessed that the Development impact would be minor. However, the detailed implications of these changes in passenger numbers are to be assessed by TfL Buses, taking account of peaks in demand above the average peak period conditions which can occur due to service disruption and other operational factors.
Quality audits of bus stops on all routes within walking distance of the Site have found a range of existing deficiencies which require some improvement. A financial contribution is therefore proposed for the improvement of bus stops on Lillie Road, and North End Road, in addition to the bus stop improvements on Old Brompton Road, Warwick Road and Earls Court Road which are associated with Application 1.
Further contributions are proposed for new bus stops within the development; new bus layover and driver facilities within the site; and for the improvement of existing bus routes or to establish new bus routes, as agreed with TfL.
WALKING
A qualitative audit of the pedestrian environment found a lack of signage and information provision, together with some sub-standard surfacing and a lack of dropped kerbs and other facilities. The clear widths of existing footways were found to be compromised by street furniture on Lillie Road, around West Brompton station, on North End Road and around West Kensington station.
Footway capacities were assessed and improvements are proposed on Lillie Road and North End Road as part of Application 2, in addition to the Warwick Road and Old Brompton Road improvements around West Brompton station in Application 1.
Detailed pedestrian crossing assessments of the cumulative development demands were carried out at the Warwick Road and West Brompton crossings, finding that the existing 10m width of the Warwick Road crossing would be satisfactory and that the West Brompton crossing should be widened from 3m to at least 5m.
Application 1 includes mitigation to improve the Warwick Road and West Brompton crossings. Application 2 includes mitigation in the form of a new pedestrian and cyclist crossing and associated pedestrian and cyclist improvements on North End Road at Star Road, and improved pedestrian crossing facilities at the North End

Application 2 Transport Assessment 6
Road / Lillie Road junction. These works are within the planning application boundary and it is proposed that they would be implemented as part of the consented proposals.
Other potential mitigation would be the subject of financial contributions for:
off-site pedestrian improvements, as part of a comprehensive public realm strategy for the surrounding area; and
a wayfinding strategy for the local area in accordance with Legible London guidelines.
CYCLING
At present, there are limited routes and cycle parking facilities in the surrounding area.
The Development is forecast to contribute to the Mayor’s target for cycling to reach a 5% share of all journeys by 2026 and it would encourage cycling by having a high standard of on-site cyclist facilities. In addition, provision is being made for Barclays Cycle Hire stations to be established within the Development.
This would be further supported by potential financial contributions towards off-site cyclist improvements for existing routes and new routes around the site, such as Star Road. This would form part of a new cycle route between Hammersmith and Earls Court town centres.
POLICY COMPLIANCE
The Development proposals have been assessed relative to transport and development policies at National, London and Borough levels.
In terms of strategic policies:
the Development proposals have been shown to promote sustainable transport choices and this is reflected in the low car driver mode shares of only 6-10% depending on the time of day
the land use mix and the Development’s location in a high PTAL area reduce the need to travel, especially by car
the Development proposals include an extensive range of measures which have been designed-in or are the subject of proposed commitments through the Framework Travel Plan to encourage sustainable travel.
Turning to more detailed local policy requirements:
the Development proposals improve the walking environment by creating an attractive and permeable link through the site; by improving crossing points; widening footways; and proposing contributions for improving the wider public realm and introducing a wayfinding strategy
cycling is encouraged by the high standard of on-site cyclist facilities and the provision being made for Barclays Cycle Hire stations within the Development, plus potential financial contributions towards off-site cyclist improvements around the site
the Development proposals accord with bus policies by assessing the quality of the surrounding bus network, and nearby bus stops and making provision for potential financial contributions towards bus stop improvements
the parking proposals comply with published car parking standards and provide for Blue Badge holders, electric vehicle charging and a Car Club.

Application 2 Transport Assessment 7
The Development proposals provide for all servicing, deliveries and refuse collection to take place away from the public highway, and to be controlled through a Delivery and Servicing Plan. The Plan sets out a management strategy so that goods and services can be delivered, and waste removed, in a safe, efficient and environmentally-friendly way.

Application 2 Transport Assessment 8
1 Introduction
1.1 BACKGROUND
1.1.1 EC Properties Limited has submitted planning applications for the redevelopment of the Earls Court Site. This is part of the Earls Court and West Kensington Opportunity Area (ECWKOA), and includes land in the London Borough of Hammersmith and Fulham (LBHF) and the Royal Borough of Kensington and Chelsea (RBKC).
1.1.2 The Earls Court Site comprises four main landholdings:
Earls Court Exhibition Centres One and Two - on land owned by TfL on land within RBKC and LBHF;
The West Kensington and Gibbs Green Housing Estates - on land mostly owned by LBHF;
The Lillie Bridge Depot and associated land - owned by Transport for London; and
The railway lines which pass north-south through the main site – owned by Network Rail.
1.1.3 LBHF, RBKC and the Greater London Authority (GLA) have produced a revised draft Supplementary Planning Document framework dated November 2011 to guide potential redevelopment in the ECWKOA.
1.1.4 This document assesses the Site Wide Development Option (“the Development”, comprising Planning Applications 1 + 2). It is the revised Transport Assessment (TA) for the development proposals for the Earls Court Site. It forms part of a suite of documents that support two planning applications for the Earls Court Site (referred to as Planning Application 1 and Planning Application 2). Planning Application 1 relates only to land within RBKC. Planning Application 2 almost entirely relates to land within LBHF, but also includes a small area of land within RBKC. These planning applications are described fully in the Development Specification (Appendix A). Figure 1.1 shows the relevant site boundaries. This document replaces the June 2011 TA and has been revised to reflect changes to the development quantum and to incorporate responses to comments received from TfL and the Boroughs regarding the June 2011 document.
1.1.5 This document does not consider the implementation of Planning Application 2 as a standalone development. This is not considered a realistic option due to the nature of the Development proposals and the anticipated development phasing. This is explained further in the Development Specification.
1.1.6 A separate planning application has been submitted for the Seagrave Road Site (which is located to the south of the Earls Court Site, south of Lillie Road). Together the three planning applications propose the redevelopment of the Earls Court & West Kensington Opportunity Area (ECWKOA) as designated in the London Plan 2011.
1.1.7 Each application is accompanied by a separate TA. This Application 2 TA assesses the Development alongside cumulative assessments including the Seagrave Road proposals.

Application 2 Transport Assessment 9
1.2 DEVELOPMENT QUANTUM
1.2.1 The Development contains the following:
Table 1.1: Site Wide Development Option Land Use Use Class Maximum Floorspace
GIA (sqm) GEA (sqm)
Residential C3 718,465 756,279
Business B1 94,409 97,833
Retail A1-5 25,796 26,732
Hotel / Serviced Apartments C1 15,748 16,319
Private Hospital C2 10,208 10,578
Community / Education / Health / Culture / Leisure
D1 / D2 30,714 31,827
895,339 939,568
1.2.2 The layout is shown on Figure 1.2 and the Development could accommodate up to 6,775 units depending on the final mix of unit sizes.
The Seagrave Road Proposals
1.2.3 The development proposals for Seagrave Road comprise 808 units and some 1,200sqm of gymnasium and café uses.
1.3 ACCESS PROPOSALS
1.3.1 The Earls Court Site is currently impermeable due to the West London Line and other rail infrastructure which forms a barrier to east-west and north-south pedestrian and cyclist movements. The detailed access and outline layout proposals address this by creating a permeable network of pedestrian and cyclist routes throughout the site. This will improve connectivity and travel choices for the surrounding communities as well as for the Development. This permeability will also increase Public Transport Accessibility Levels by reducing walking distances for LBHF residents to Earls Court and West Brompton stations.
1.3.2 The access strategy is based on the need to provide for permeable movement by all modes and to allow for the Development to be built out in phases. Access will be provided to the site from North End Road, Old Brompton Road, Warwick Road, Lillie Road and directly from the A4 with all street level vehicle accesses shared with pedestrians and cyclists and supplemented by some pedestrian/ cyclist only accesses, as described further below.
1.3.3 The planning application seeks permission to carry out works to existing highways and the creation of new site access roads. These works comprise the following;
Access to and egress from the development via a new a new signalised junction located on the A4 West Cromwell Road between North End Road and Warwick Road
Access to and egress from the development via a new access road passing through the 100 West Cromwell Road site
Access to and egress from the development via modified junctions at Warwick Road in the location of the existing EC1 forecourt

Application 2 Transport Assessment 10
Access to and egress from the development via a modified priority junction at Old Brompton Road opposite West Brompton Station entrance
Improvements to Old Brompton Road and Lillie Road between West Brompton station and Ongar Road
Access to and egress from the development via a new priority junction at Lillie Rd opposite Ongar Road
Access to and egress from the development via a new priority junction at Lillie Road located approximately 100m east of North End Road
Signalisation and associated improvements to the Lillie Road/North End Road junction
Improvements to the North End Road/Thaxton Road junction
Improvements to North End Road between Thaxton Road and May Street
Access to and egress from the development via a new priority junction at North End Road opposite Star Road
Access to and egress from the development via a new priority junction at North End Road opposite May Street
Improvements to the North End Road/Beaumont Avenue junction.
1.3.4 The access layouts and their descriptions are contained in Appendix B. The access layouts have all been checked to ensure that large delivery, emergency and refuse vehicles can be accommodated. The check has used standard “TRACK” software to simulate the swept paths of vehicle movements, and the TRACK plots are included in Appendix B.
1.3.5 Each access has been the subject of Stage 1 Road Safety Audits, which are attached as Appendix C. The Safety Audit recommendations have been reviewed, and the Designers Response (also in Appendix C) shows they can all be addressed as the access designs progress towards more detailed layouts.
1.3.6 The Development is designed to feel like an attractive part of London, and therefore the design and public realm strategy have the objective that pedestrians would be encouraged to walk into and through the site via the proposed pedestrian crossings around the periphery of the site and enhanced footways. The internal street layout (Figure 1.2) has been designed in line with Manual for Streets principles, along with TfL’s Streetscape Guidance 2009. The layout and scheme principles see pedestrians and cyclists prioritised with permeable movement throughout the site encouraged by shared surface spaces with at-grade pedestrian crossings and routes. It is expected that the predominant desire for movement would be to Earls Court, West Kensington and West Brompton stations and the street configuration responds to these desire lines.
1.4 PARKING, TAXIS & CAR CLUB PROVISION
1.4.1 The overall residential parking provision is based on a ratio of 0.6 space per dwelling, which is the level of car ownership anticipated by the Applicant. This equates to a provision for 4,065 residential car parking spaces on the Application 2 site, and a total of 4,674 across the Earls Court Site.
1.4.2 The Earls Court Site currently accommodates 1,527 parking spaces, in addition to the 1,070 spaces on the Seagrave Road car park site. The proposed residential parking would therefore be a net increase of 3,147 spaces on the Earls Court Site.

Application 2 Transport Assessment 11
1.4.3 The residential parking spaces will mostly be provided underground. Parking will be designed in detail on a plot by plot basis, based on the access positions shown on the parameter plan “Vehicular Access and Circulation”. The on-street parking locations and proposed designations are shown on Figure 1.3. These show short stay Pay and Display parking along the High Street and The Broadway, with residential parking on the private streets.
1.4.4 Blue Badge parking will be provided at a ratio of 10% of the overall number of spaces, unless agreed otherwise with TfL and LBHF. Additional on-street Blue Badge parking will be provided for commercial, leisure and retail uses.
1.4.5 Commercial parking is proposed at the following ratios:
Business: 1 space per 1000 m²
Hotel / Serviced Apartments: 1 space per 40 rooms
Leisure: Disabled only with on-street visitor
Culture: Disabled only with on-street visitor
Retail: Disabled with on-street visitor.
1.4.6 In line with the London Plan 2011 standards, 20% of parking spaces will be provided with active electric charging. A further 20% will have “passive” provision to allow for further expansion as electric vehicles become more prevalent. The adoption of these standards for the Development equates to 813 residential spaces having electric charging facilities with another 813 being passively prepared for adoption of the technology when demand is sufficient. In addition, 20% of the on-street spaces will be equipped for electric vehicle charging.
1.4.7 The travel demand assessment includes forecasts of taxi demand, and the requirement for on-site taxi facilities will be discussed with TfL. If required, some of the on-street parking areas could be converted to taxi ranks.
1.4.1 Discussions with Streetcar, a Car Club operator which is active in LBHF and RBKC indicate a demand for up to 20 on-street spaces to be provided within the site. Streetcar acknowledge that the number of spaces and demand could be greater and therefore this will be monitored and suitable provision made should demand be relaised and depending on the success of the scheme.
1.5 CYCLE AND MOTORCYCLE PARKING
1.5.1 Cycling is likely to be a popular mode of transport both within and through the Development. This creates a need for high-quality cyclist facilities, including secure cycle parking, carriageways of sufficient width to comfortably accommodate cyclists, and showering / changing facilities throughout the proposed land uses.
1.5.2 The London Plan 2011 residential cycle parking standard is one space per 1 or 2 bed unit and two spaces per 3 or more bed unit, plus . This equates to a total of 8,740 on-plot spaces. The Early Minor Alterations to the London Plan, published for consultation on 07 November 2011 proposes a visitor cycle parking space for every 40 dwellings. The Development proposal exceeds this, with visitor cycle parking proposed at a level of 0.1 spaces per dwelling equating to 678 visitor spaces to be provided on-street across the site. Non-residential cycle parking would be provided in accordance with London Plan cycle parking standards in a mixture of on-plot and on-street locations.
1.5.3 On-plot motorcycle parking will be provided at a ratio of one space per 20 dwellings, totalling some 340 spaces. Some of the on-street parking areas shown on Figure 1.4 could be reserved for motorcycle use.

Application 2 Transport Assessment 12
1.6 SERVICING AND DELIVERIES
1.6.1 The principles of provision for deliveries are that :
residential and hotel deliveries will take place from basement areas to be finalised in the detail design of each plot or from on-street bays
basement servicing access for vans will use the car park ramps, subject to headroom restrictions, with larger vehicles accessing the basements from a new access road which generally follows the alignment of the consented Northern Access Road
the townhouses (plots WV02 and WV05) will be serviced from their street frontages
retail and community / culture uses along the High Street and The Broadway will be serviced from dedicated on-street loading bays
commercial and larger leisure units will have dedicated off-street servicing bays, located at grade or in basements and will be finalised in the detail design of each plot
the energy centres will be accessed at basement level from the new access road and by a basement ramp for large vehicles accessing form the A4
the estate roads will be actively managed by on-site estate management staff to prevent these streets from being used by vehicles unconnected with the development
1.6.2 The preferred strategy for residential waste disposal within the site is a Vacuum Waste System, which allows users to deposit different waste bags into different inlets. The waste is transported through an underground pipe network. If a Vacuum Waste System is not adopted then communal refuse rooms would be provided in individual buildings at ground or basement levels. Standard waste and recycling bins would be provided within these facilities. For robustness, this TA includes vehicle movement calculations which include for non-vacuum waste removal by vehicles.
1.6.3 Commercial waste is subject to the “Duty of Care” and “Controlled Waste” as set out in the 1990 Environmental Protection Act – Waste Management, The Duty of Care Code of Practice. The overall waste strategy will aim to coordinate the individual commercial waste collection arrangements while taking account of specialised requirements such as clinical waste and cooking oil.
1.6.4 The internal access roads leading to servicing areas have been designed to accommodate the largest vehicle types that can reasonably be expected to service each occupier within the site. These vehicles are as follows:
16.5 Artic HGV (Width 2.5; Length 16.5m; Height 4.0m)
11m Rigid HGV (Width 2.5m; Length 11m; Height: 3.7m);
Large Refuse Vehicle (Width 2.5m; Length 9.9m; Height: 3.7m);
Fire Pump Appliance (Width 2.3m; Length 8.5m; Height: 3.7m); and
Transit Van (Width 2.2m; Length 5.5m; Height: 2.4m).
1.6.5 The proposed management of servicing, refuse collection and deliveries is set out in the Framework Delivery and Servicing Plan (Appendix T).

Application 2 Transport Assessment 13
1.7 BUS LAYOVER
1.7.1 The development will provide a bus layover facility at the location identified on the Farrell’s Public Transport Parameter Plan ECM2-PA-03-115-A SK01 and presented in Figure 1.4. This will be in accordance with the summary specification set out below.
A bus standing area, including posts and flags (specifying the bus stop name, relevant bus route numbers and the bus stop code), sufficient to park three buses and allow passengers to alight.
The bus standing area will comply with TfL’s technical advice note BP1/06 (entitled ‘Accessible Bus Stop Design Guidance’) and the detailed design will be agreed with TfL.
The bus standing area will include three bus cages to be a minimum of 12.5 metres in length and 3 metres in width. A 6 metre spacing will be provided between each cage.
A toilet facility for use solely by bus drivers.
1.8 CONTEXT OF TECHNICAL ASSESSMENT
1.8.1 This Transport Assessment has been undertaken following the substantial technical work undertaken as part of the Earls Court Transport Study (ECTS).
1.8.2 The ECTS was undertaken in four stages and in accordance with an agreed TfL methodology. The primary objective of the ECTS was to understand the transport capacity of the ECWKOA with regard to all modes by testing a range of development scenarios.
1.8.3 The ECTS considered the implications of development in the Earls Court West Kensington Opportunity Area (ECWKOA) through a series of reporting stages:
Stage 1 - Inception Report
Stage 2a - Development and Transport Scenarios Definition
Stage 2b - Review of Existing Models and Analysis
Stage 3 - Forecasting and Analysis
Stage 4 - Local Capacity Study
1.8.4 The Stage 4 report was produced in parallel with the development of the ECWKOA Supplementary Planning Document (SPD) and informed the draft SPD in terms of identifying transport issues, their implications for different scales of development and their potential mitigation. The Stage 4 report focussed on more local and detailed transport considerations, whereas the Stage 3 report considered impacts at a strategic level.
1.8.5 The ECTS has been audited, on behalf of TfL, by MVA Consultancy. The study concluded that a level of travel demand associated with ECWKOA development of some 8,300 residential units and some 24,000 jobs could be accommodated on the transport networks subject to appropriate and agreed levels of mitigation.
1.9 CONSULTATION
1.9.1 The development proposals have been the subject of consultation with TfL and both Boroughs, largely through the Earls Court Transport Study Steering Group plus other consultations and briefings arranged by TfL Land Use Planning and Surface Transport.

Application 2 Transport Assessment 14
1.9.2 A TA Scoping Study dated 25th February 2011 was provided to TfL, LBHF and RBKC. The Scoping Study was prepared in accordance with the TfL guidelines set out in TfL’s ‘Transport Assessment Best Practice’ (April 2010) guidance document and formed the basis for discussion at pre-application meetings held with TfL, LBHF and RBKC. A consultation response was received from TfL on 26 April 2011. Copies of the Scoping Study and its response are provided as Appendix D.
1.9.3 Consultation continued with these bodies throughout the pre-application process, and continued after the planning submissions in June 2011. In addition to statutory consultation, pre-application public consultation on the masterplan proposals was held at the Earls Court Exhibition Centre during March 2011, together with other consultation exercises as summarised in the Statement of Community Engagement.
1.10 CUMULATIVE ASSESSMENTS AND FORECAST GROWTH
1.10.1 The cumulative development scenarios include the Development plus the Seagrave Road proposals. In common with the Environmental Impact Assessment (EIA), consideration has been given to other schemes located within 1 km. These schemes comprise consented schemes and schemes under construction. In addition, and for increased robustness, those schemes resolved to be granted consent subject to S106 have been considered. To be considered as significant, the schemes identified either comprise over 50 residential units or provide over 10,000sqm of floorspace. The schemes include:
G-Gate, Olympia, Corner of Lyons Walk and Hammersmith Road -2008/00547/FUL. Call-in decision – Approved – 3 December 2009.
72 Farm Lane, London, SW6 1QA – 2008/01550/FUL. Granted - 18 February 2010.
Ibis Hotel, 47 Lillie Road, SW6 – 2007/00608/OUT. Granted – 10 June 2009.
The Commonwealth Institute, 224-238 Kensington High Street PP/09/00839; CC/09/00841; LB/09/00840. Resolution to Grant – 17 October 2009.
245 Warwick Road (TA Centre) – PP/08/00218. Resolution to Grant – 30 April 2008.
181-183 Warwick Road – PP/06/02568. Resolution to Grant – 26 August 2008.
Odeon Cinema, Kensington High Street – PP/07/01071. Resolution to Grant – 19 November 2008.
Telephone Exchange, 213-215 Warwick Road – PP/08/01214. Resolution to Grant – 11 December 2008.
Charles House, 375 Kensington High Street and The Radnor Arms, 247 Warwick Road, London, W14 8QH – PP/08/01178. Resolution to Grant - 30/04/2010.
Olympia Exhibition Centre, Hammersmith Road, W14 8UX – 2010/02180/FUL and 2010/02181/LBC. Resolution to grant – 13/10/2010.
1.10.2 This TA aims to ensure that these schemes are taken into account without double-counting their traffic into the forecasts of background traffic growth. Each TA for the above developments has been reviewed against TfL’s London Transportation Study (LTS) growth forecasts, using with LTS Version 6.2.2 as provided by TfL for use with this TA. LTS includes forecasts for all of the London

Application 2 Transport Assessment 15
Plan proposals and presents these for the years 2021 and 2031. The detail of this review is set out in Appendix E, confirming that the additional travel demand for all of the above schemes is already counted into the background growth forecasts.
1.10.3 It should be noted that four entries in Appendix E appear to show negative LTS growth in Zone 2030 between 2007 and 2031. As explained in the right hand column of the table, this is due to adjustments being made to Zone 2030 which reallocate the additional trips to adjacent zones. These adjustments improve the accuracy of the model and do not remove trips from the overall forecasts. There is one planning application for the Olympia Exhibition Centre which shows a trip generation in excess of the LTS forecast, and this is due to the LTS forecasts being based on population and employment growth. For the same reason, the baseline forecasts for the Earls Court Exhibition Centre do not take account of existing event trips and the overall change in travel demand due to the Development is over-estimated as a result. The background growth forecasts are therefore robust.
1.10.4 In addition to these specific schemes, the TA takes account of the Tesco site proposals at 100 West Cromwell Road. Discussions with TfL have confirmed that further cumulative assessments are being progressed by their consultants to clarify any strategic implications of the “Western Arc” developments. These include the White City Opportunity Area, where Westfield has recently submitted a planning application.
1.11 ASSESSMENT SCENARIOS
1.11.1 Where the impact of the Site Wide Development Option is considered, it is undertaken in the context of the following scenarios:
Scenario 1 - The Site Wide Development Option at completion. This considers the development in combination with the 2031 Base (as derived from LTS). This is identical to Scenario 3 of the Application 1 TA. There is also a requirement to assess the development phasing and intermediate scenarios, which include the Development in 2021, prior to the A4 junction being open to traffic.
Scenario 2 – The Site Wide Development Option and the Seagrave Road proposals (2031). This is identical to Scenario 4 of the Application 1 TA.

Application 2 Transport Assessment 16
2 Relevant Policy & Guidance
2.1 INTRODUCTION
2.1.1 Section 3, of TfL’s “Transport Assessment Best Practice Guidance”, states that a key consideration in the appraisal of development in transport terms is to assess the conformity of development proposals with policy. A review of transport-related national, regional and local policy is therefore provided below.
2.1.1 The extent to which the development proposals accord with these policies is detailed in section 14 “Conclusions”.
2.2 NATIONAL POLICIES
2.2.1 The high-level principles of adopted national transport policy for development proposals are set out in PPG13 “Transport”; PPS3 “Housing”; PPS4 “Planning for Sustainable Economic Growth”; and PPG12 “Local Spatial Planning”.
2.2.2 As an overview, these documents stress the importance of promoting sustainable transport choices and reducing the need to travel, especially by car. They aim to improve the integration of land use planning and transport in order to achieve more sustainable patterns of development.
2.2.3 The key recurring themes include the importance of complimentary land uses being accessible by public transport, walking and cycling, and for car parking levels to promote sustainable transport policies. The draft National Planning Policy Framework retains these key principles.
2.3 LONDON POLICIES
2.3.1 The Mayor’s transport and development policies are set out in the London Plan and related documents, which reflect the overall national policies and add London-specific details.
THE LONDON PLAN 2011
2.3.2 The overall strategic approach is summarised in Policy 6.1 as being the closer integration of transport and development. Paragraph 6.1 explains that the transport policies are primarily intended to support delivery of the Mayor’s sixth objective - that London should be a city where it is easy, safe and convenient for everyone to access jobs, opportunities and facilities with an efficient and effective transport system which actively encourages more walking and cycling and makes better use of the Thames.
2.3.3 Policy 6.1 encourages closer integration of transport and development by:
Encouraging patterns of development that reduce the need to travel, especially by car
Improving the capacity and accessibility of public transport, walking and cycling, particularly in areas of greatest demand
Supporting development that generates high levels of trips at locations with high levels of public transport accessibility
Improving interchange between different forms of transport, particularly around major rail and Underground stations

Application 2 Transport Assessment 17
Facilitating the efficient distribution of freight whilst minimising its impacts on the transport network
Supporting measures that encourage shifts to more sustainable modes and appropriate demand management
Promoting greater use of low carbon technology so that CO2 and other contributors to global warming are reduced
Promoting walking by ensuring an improved urban realm
2.3.4 Policy 6.3 seeks the assessment of development impacts on transport capacity, through Transport Assessments and their associated Travel Plans, Construction Logistics Plans and Delivery & Servicing Plans.
2.3.5 Policy 6.4 says the Mayor will work with strategic partners to improve London’s public transport system to support future development and regeneration priority areas and increase public transport capacity. Boroughs should identify development opportunities related to locations which will benefit from increased public transport accessibility.
2.3.6 Policy 6.7 says the Mayor will work with TfL and Boroughs to implement London-wide improvements to the quality of bus, bus transit and tram services. Boroughs should promote these networks by allocating road space and priority with good access and direct, secure, accessible and pleasant walking routes to stops; implementing TfL’s Accessible Bus Stop Design Guidance; ensuring that bus standing, garaging and driver facilities are provided; and making provision for interchanges.
2.3.7 Policy 6.9 sets out a target for cycling to account for at least 5 per cent of modal share by 2026. Developments are expected to provide cycle parking and facilities, and to facilitate the Cycle Super Highways and central London cycle hire scheme.
2.3.8 Policy 6.10 aims for a significant increase in walking. Pedestrian environments in and around new developments should emphasize the quality of pedestrian and street space. Boroughs should identify, promote and complete their relevant sections of strategic walking routes, and implement convenient direct routes to town centres, transport nodes and other key uses. They should also promote the ‘Legible London’ initiative to improve pedestrian wayfinding and provide for audits of existing pedestrian infrastructure. Boroughs should also encourage a higher quality pedestrian and street environment, including the use of shared space principles, simplified streetscape, decluttering, and access for all.
2.3.9 Policy 6.11 aims for a coordinated approach to smoothing traffic flows and tackling congestion. It sets out a range of measures to help mitigate the congestion impacts of population and economic growth, ensuring more reliable journey times on the road network than would otherwise be the case.
2.3.10 Policy 6.12 supports the need for limited improvements to London’s road network to address clearly identified significant strategic or local needs. In assessing such proposals a net overall benefit is sought against a range of criteria which includes the contribution to London’s sustainable development and regeneration; the extent of any additional traffic and the extent to which congestion is reduced; the net benefit to London’s environment; conditions for pedestrians, cyclists, public transport users, freight and local residents; and how safety for all is improved. Proposals must show how any disbenefits will be mitigated.
2.3.11 Policy 6.13 says that the Mayor wishes to see an appropriate balance being struck between promoting new development and preventing excessive car parking provision that can undermine cycling, walking and public transport use by

Application 2 Transport Assessment 18
applying maximum car parking standards while making provision for disabled people, electric car charging and minimum cycle parking standards.
2.3.12 Policy 6.14 seeks to improve freight distribution, with developments that generate high numbers of freight movements being located close to major transport routes, and promoting the Freight Operators Recognition Scheme, Construction Logistics Plans and Delivery & Servicing Plans.
2.4 BOROUGH POLICIES
LBHF LOCAL DEVELOPMENT FRAMEWORK (LDF)
2.4.1 The Development Plan comprises the London Plan 2011 and the LBHF Core Strategy which was adopted on 19 October 2011. The Core Strategy is the overarching LDF document, and sets out strategic objectives for transport to ensure there is high quality transport infrastructure to support development, to improve transport accessibility, reduce congestion and the need to travel, reduce and mitigate local causes of climate change, and promote healthier lifestyles.
2.4.2 The Borough-wide Strategic Policy T1 aims to improve transport provision and accessibility, especially on north-south routes and by seeking better connections to rail services. The development-related aspects of this policy seek:
access improvements for all, particularly people with disabilities, as part of planning permissions for new developments
to ensure appropriate parking is provided to meet the essential needs of development without impacting on the quality of the urban environment
to relate the intensity of development to public transport accessibility and highway capacity.LBHF
UNITARY DEVELOPMENT PLAN
2.4.3 The ‘saved’ policies of the Unitary Development Plan (UDP) sit alongside the Core Strategy and together with the London Plan policies form the basis for planning policy within LBHF. The Hammersmith and Fulham Local Development Framework (LDF) will replace the UDP in due course.
2.4.4 The transport policies of the UDP form part of an overall strategy in conformance with national and London policy to tackle a wide range of issues including personal accessibility; road traffic congestion and public transport service performance; the environmental consequences of transport provision; and the allocation of resources to different forms of travel.
2.4.5 Policy G4: Transportation and Accessibility aims to achieve the following objectives:
“Development will be guided to locations that minimise the need to travel, and will be required to incorporate access arrangements that encourage the use of sustainable modes of travel and transport;
The intensity of development will be related to accessibility by public transport, with new development expected to include measures designed to promote traffic restraint and reduction, so as to reduce congestion and air pollution and to avoid the need for increased road capacity; and
The siting, design and layout of development will be required to provide easy access by disabled people, safe, secure and direct access by pedestrians, and facilities to encourage travel to and from the development by cycling and other sustainable modes of travel and transport.”

Application 2 Transport Assessment 19
2.4.6 Additionally, measures will be sought to:
“Secure necessary improvements to, and development of, public transport systems and services, including additional stations on the west London line;
Minimise vehicle parking demand both by controlling the amount of on-site parking provision and by securing the introduction of complementary parking controls and traffic management measures to control off-site parking;
Promote the use of rail and water for freight transport; and
Protect residential areas and main shopping streets from the environmental impact of traffic generated by development proposals.”
EARLS COURT AND WEST KENSINGTON OPPORTUNITY AREA DRAFT SPD
2.4.7 The first draft ECWKOA SPD was published in March 2011 and a Revised Draft for consultation was published in November 2011. The draft SPD provides supplementary detail to policies contained within LBHF’s adopted Core Strategy (October 2011) and RBKC’s adopted Core Strategy (December 2010). It also provides supplementary detail to the adopted London Plan.
2.4.8 There are 26 transport Key Principles set out in the initial consultation draft:
TRN1: Any development proposals should demonstrate by way of robust Transport Assessments that the impact of development on the transport networks is acceptable
TRN2: Development should be supported by robust Transport Assessments that set out phase by phase what the cumulative impact of development will be and how it will be mitigated at each phase
TRN3: All streets within the Opportunity Area (OA) should be built to adoptable standards and offered to the Highway Authority for adoption
TRN4: All streets within the OA should be accessible to all with appropriate gradients where changes in level are experienced, generous footway widths and accessible crossing facilities. The streets should provide safe and direct north-south and east-west movement for pedestrians and cyclists and integrate well with the surrounding streets.
TRN5: Development should provide a coherent pedestrian wayfinding strategy in and around the OA
TRN6: New development should fund environmental improvements and deliver wider, clearer and higher quality footways on the existing streets surrounding the OA and contribute towards the A4 improvement scheme
TRN7: New development should deliver new pedestrian crossings and improve existing crossings in order to meet the increase demand from development and significantly improve the pedestrian environment and access into and out of the OA
TRN8: New development should deliver improved onward connections for cyclists into the streets surrounding the OA
TRN9: New development should deliver increased levels of cycle parking to London Plan and Local Development Plan standards, particularly at key

Application 2 Transport Assessment 20
public transport interchanges, and the Mayor’s Cycle Hire Scheme should be extended into the OA
TRN10: New development should deliver physical improvements to all three stations to accommodate the forecast increase in passenger numbers
TRN11: Development in the OA should not result in excessive crowding or delay on the London Underground or National Rail and Overground networks, compared to predicted levels in 2031
TRN12: New development should provide capacity and environmental improvements to Earl’s Court Station, including the reopening of the existing pedestrian tunnel beneath Warwick Road, as part of ensuring the station can accommodate the forecast increase in passenger numbers
TRN13: New development should deliver extra capacity at the gate lines, ticket halls and circulation space at West Brompton and West Kensington stations in order to accommodate the development related trips
TRN14: Step-free access should be provided at West Brompton and West Kensington stations and any new entrance at Earl’s Court Station
TRN15: New development should deliver platform lengthening to accommodate eight car trains on the West London Line platforms at West Brompton
TRN16: New development should deliver significantly enhanced interchange facilities at all three stations
TRN17: Additional bus services, routes and stops funded by development will be necessary within and around the OA to accommodate new development trips
TRN18: Development should include taxi rank and coach parking facilities within the OA
TRN19: Development traffic cannot be accommodated on the existing road network without significant capacity improvements, which should be clearly identified in development proposals along with appropriate funding mechanisms to ensure improvements are delivered before development demand is introduced
TRN20: Development proposals should include deliverable and funded road network improvements that reduce delays on the A4 to 2009 levels
TRN21: Development should not worsen traffic conditions to unacceptable levels on existing streets and a review of local traffic management arrangements should be undertaken to address this and provide funded mitigations where necessary
TRN22: New development should investigate improvements to the Earl’s Court One Way System, including to the pedestrian environment, and should fund a package of measures as identified in the investigation
TRN23: All junctions from the OA on to the existing road network and road links across the OA should be assessed to ensure they have no unacceptable impacts on the existing road network in terms of vehicle capacity, road safety and urban design
TRN24: Car parking levels should be minimised in order to restrain car trips, except for parking for car club vehicles, which are encouraged in order to provide an alternative to private car ownership and use

Application 2 Transport Assessment 21
TRN25: Development proposals should be supported by an on-street parking strategy
TRN26: Development proposals should be supported by substantial measures to minimise the impact of freight, including during the construction period.

Application 2 Transport Assessment 22
3 Baseline Conditions – Land Uses & Local Area
3.1 EXISTING LAND USE & CONTEXT
3.1.1 The Earls Court Site (which comprises the Application 1 and Application 2 areas) falls within the ECWKOA and is currently occupied by:
the Earls Court Exhibition Centre. The Earls Court 1 and 2 buildings reach 91m from the base of the deck on which they sit and are surrounded by their loading/unloading areas. Beneath the two exhibition centres run a number of train lines, including the District Line branches, the Piccadilly Line, the West London Line and the London Underground depot and associated tracks. The site also includes an area to the north-west of Philbeach Gardens, which is occupied by the Clear Channel International Ltd headquarters Business and is accessed from Cluny Mews.
Empress State Building. Located to the west of Earls Court 2 is the 31-storey (110m) Empress State Building, which is the highest building within the immediate area and currently occupied by the Metropolitan Police Service.
West Kensington & Gibbs Green Estates. The western section of the ECWKOA is occupied by two estates – West Kensington (to the south) and Gibbs Green (to the north) – which are typically 1960s in their form and character. Though a few blocks of 9, 10 and 11 storeys are present, the estate accommodation is primarily low and medium scale density buildings. This area also includes the Gibbs Green School, as well as a low rise factory building. While the school was closed in March 2009, it currently provides temporary accommodation for some pupils from the Queensmill Primary School.
Lillie Bridge Depot. This light maintenance and stabling yard and rail tracks are located in the central and northern portions of the ECWKOA. The depot is located on TfL land and operated by London Underground. A nine storey Business building (Ashfield House) on the northern edge of the ECWKOA is used as a TfL training facility.
3.1.2 The surrounding area contains a wide range of complimentary land uses which support the principle of residential development on the application site.
3.2 EXISTING CAR PARKING
3.2.1 WSP carried out a parking capacity survey (including Seagrave Road car park) in January 2009, finding that 2,597 parking spaces are currently available within the ECWKOA red line.
3.2.2 The Earls Court Exhibition Centre has operational car parking spaces in its Red and Blue Car Parks and at the Seagrave Road Car Park. The Red Car Park has 400 spaces and is used by exhibition vehicles and by visitors to exhibitions. The Blue Car Park has 185 spaces, and the Seagrave Road Car Park is currently a surface level car park with 1,070 parking spaces, which have been used for:
A car rental business;
Public visitors to exhibitions, both in cars and in coaches, either on a pre-booked or a turn-up and park basis; and

Application 2 Transport Assessment 23
Marshalling traffic for exhibitors’ goods vehicles associated with the build-up and the break-down of events at the Earls Court Exhibition Centre.
3.2.3 Adding the 24 parking spaces surveyed on the Lillie Road forecourt and east of Empress Place gives a sub-total of 1,679 parking spaces associated with Earls Court.
3.2.4 The other ECWKOA uses have the following parking numbers:
West Kensington and Gibbs Green Estates - 615 spaces.
Lillie Road depot - 120 spaces.
Ashfield House and Rootstein Mannequins - 32 spaces.
Kensington Hall Gardens - 26 spaces.
Empress State Building. - 190 spaces.
3.3 EVENTS AT EARLS COURT
3.3.1 Earls Court Exhibition Centre (EC1 and EC2) receives over 600,000 visitors per year. The diverse range of events varies in scale from several hours to several weeks in duration. Most of the events are exhibitions and trade fairs which open during the daytime. These are complemented by special evening events, such as pop concerts, awards ceremonies and corporate staff parties.
3.3.2 The baseline traffic surveys (described further in section 4) were all undertaken during non-event periods and so the TA baseline will reflect average non-event days at Earls Court Exhibition Centre.

Application 2 Transport Assessment 24
4 Baseline Conditions – Local Highway Network
4.1 EXISTING HIGHWAY NETWORK
4.1.1 As shown by Figure 1.1, the Earls Court Site is bounded by the A4 West Cromwell Road, Warwick Road, Cluny Mews, Philbeach Gardens, Eardley Crescent, Old Brompton Road, Lillie Road and North End Road.
4.1.2 The A4 West Cromwell Road is part of the Transport for London Road Network (TLRN), where Transport for London is the Highway Authority. LBHF and RBKC are the Highway Authority for the other roads in the respective Boroughs. Warwick Road and Earls Court Road are one-way northbound and southbound respectively, and form the Earls Court One Way System (ECOWS) which is also part of the TLRN and part of the strategic north-south corridor between the A40 Westway and Chelsea Embankment.
4.1.3 Baseline conditions on the existing highway network are summarised below in terms of traffic flows and conditions, accident records, on-street parking designations and on-street parking supply and demand. Other important aspects of the highway network such as pedestrian, cyclist and public transport facilities are described in sections 5 and 6.
4.2 EXISTING HIGHWAY CONDITIONS
4.2.1 Existing Baseline two way traffic flow information for the AM (0800 – 0900) and PM (1700 – 1800) weekday peak hours is presented on Figures 4.1 and 4.2 respectively. These are based on survey data collected as part of the Earls Court Transport Study. These weekday peak hours have been found to represent the most critical conditions on the road network, including both existing traffic and the future traffic generation of the proposals (as described in section 7). For completeness Saturday and Sunday peak traffic flows were also assessed, but were found to be lower than the weekday AM and PM peaks. The assessment is therefore based on the weekday AM and PM peaks.
4.2.2 These Figures show that the dominant movement through the area is east-west through traffic, and then north-south through traffic. The detail of the individual junction turning movement surveys also shows there is a substantial west–south through movement from the A4, turning right onto Earls Court Road and then continuing south on Redcliffe Gardens. The reverse movement from Finborough Road north to Warwick Road and then turning left onto the A4 westbound is also a dominant movement (approximately half of the Warwick Road traffic approaching the A4 subsequently turns left onto the A4).
4.2.3 Due to the complex nature of the highway network under consideration, a microsimulation model was needed in order to assess the network with a reasonable degree of accuracy and to produce a 2009 Base Year model against which to assess traffic growth, the impact of development and potential traffic engineering measures. The VISSIM microsimulation software was considered to be the most appropriate tool to use in the development of this model.
4.2.4 The assignment of the highway trips from CLoHAM allows for cordon matrices to be developed for the more detailed highway modelling to be undertaken using VISSIM. In order to define the study area for detailed highway assessment using VISSIM, the extent of highway impact was reviewed in CLoHAM.

Application 2 Transport Assessment 25
4.2.5 In the AM peak, the main roads showing flow increases as a result of the Development were the A4 westbound (on both sides of the new junction) and Lillie Road westbound, west of the North End Road junction. Additional delays as a result of the development were largely limited to the approaches to the new junction on the A4 in both directions; and to the northbound North End Road approach to the A4.
4.2.6 In the PM peak, the most significant increases in flow were apparent on the A4 west of the site eastbound and east of the site westbound; and Finborough Road south of Old Brompton Road. Lillie Road west of the North End Road junction showed increased flows in both directions
4.2.7 From this review of CLoHAM outputs, it was assessed that the network to be assessed in detail using VISSIM should extend from the North End Road junction with the A4 to the north-west, the Lillie Road junction with North End Road to the south west and then east to include the Earls Court One Way System and the junctions of Warwick Road and Earls Court Road with the A4.
4.2.8 The development and calibration of this 2009 Base VISSIM model and details of its validation against observed highway conditions are set out in the Local Model Validation Report (Appendix F). The model validation was accepted by TfL in September 2011, confirming that TfL was satisfied with the model as a suitable platform for assessing the highway network.
4.2.9 The overall performance of the local network can be summarised as follows:
In the AM peak the A4 / North End Road junction has queues and delays due to junction capacity limitations, with westbound and northbound traffic having the most delays. North End Road northbound has significant queuing across the modelled hour whilst the A4 westbound has queues of around 100 metres. In the PM peak a similar pattern can be observed. Generally all queued traffic along the A4 is able to discharge within a single cycle with queues remaining on the side arm of North End Road.
In the AM peak the northbound approach to the A4 / Warwick Road junction has delays due to a combination of traffic flows and the signal strategy employed by TfL that sees the providing with significant priority above other routes. Northbound queues on Warwick Road can therefore be observed to reach 600 metres in length. The maximum queues on the A4 are eastbound where queues of over 250 metres are observed. In the PM peak the pattern is similar with significant queuing on Warwick Road northbound as a result of signal timings employed at the junction with the A4.
The southbound approach to the Earls Court Road / Old Brompton Road junction also has delays due to a combination of traffic flows and buses stopping on Earls Court Road just to the north of the junction, and on Old Brompton Road just to the west of the junction. Significant queuing therefore occurs on this arm of the junction. In the PM peak similar queue lengths can be observed.
The northbound approach to the Finborough Road / Old Brompton Road junction has large queues due to the proximity of a bus stop near the junction and the gating of traffic on this arm proper to discharge into Warwick Road. Queues extend to a distance of 300 metres. Some additional queuing occurs eastbound on Old Brompton Road. In the PM peak queuing is similar but the northbound queue on Finborough Road is reduced in magnitude.

Application 2 Transport Assessment 26
4.3 EXISTING ACCESS ARRANGEMENTS AND MOVEMENTS
4.3.1 The Earls Court Site has three access gates for the Exhibition Centres (Warwick Road gate, Old Brompton Road Gate and Lillie Road Gate) which provide access onto Warwick Road, Old Brompton Road and Lillie Road respectively.
4.3.2 In addition Beaumont Avenue, Beaumont Crescent, Mund Street, and Thaxton Road also provide access via North End Road into the LBHF site. All accesses and crossovers are in a good condition with all except Thaxton Road having tactile paving and raised table entries
4.3.3 Gate counts into and out of Earls Court 1 and 2 were undertaken by camera surveys over the period 18-30 January 2008 at each of the three access gates to the Earls Court Exhibition Centre (Lillie Road Gate, Brompton Gate, and the Warwick Road Forecourt). These counts reflect the existing use of the site during different events. The survey data is contained in Appendix G.
4.3.4 The surveys recorded the following scenarios:
the “ATE” exhibition build-up, open and break-down periods;
the “Broadcast” exhibition build-up and open periods; and
the “Destinations” exhibition build-up period; and
Non-event periods.
4.3.5 The existing traffic surveyed at the Earls Court Site accesses have been extracted from Figures 4.1 and 4.2 and are set out below in Table 4.1.
Table 4.1: Existing Site Traffic (Non Event Day) PCUs
Gate AM Peak PM Peak
IN OUT 2-way IN OUT 2-way
Beaumont Avenue 20 10 30 23 25 48
Mund Street 25 34 59 17 16 33
Thaxton Road 35 34 69 34 34 68
Lillie Road Gate 55 23 78 15 49 64
Brompton Gate 47 23 69 17 31 48
Warwick Gate 18 5 23 7 53 60
Totals 200 128 328 113 208 321
4.4 ACCIDENT ANALYSIS
4.4.1 Personal Injury Accident (PIA) records for the period to end-November 2010 have been obtained from TfL’s Accident Analysis Unit. An analysis of the PIA data has been undertaken to ascertain if there are any safety issues or accident black spot areas on the local highway network. The full data is contained within Appendix H whilst a summary of accidents in the area is displayed in Figure 4.3
4.4.2 The following sub-sections review the existing accident records around each of the proposed access locations. The accidents within 50m of each access and their reference numbers are shown on Figure 4.4.
WARWICK ROAD ACCESS
4.4.3 A total of four slight injury accidents (reference numbers 42, 72, 181, 196 in Appendix H) were recorded over the past three years in the vicinity of the proposed Warwick Road access.

Application 2 Transport Assessment 27
4.4.4 Inspection of the accident records shows that two of these accidents were the result of vehicles travelling too close behind motorcyclists, resulting in a collision from the rear. Another accident involved a cyclist being struck by an overtaking bus or coach. The other accident (number 196) occurred onboard a bus, when a passenger lost their footing on the stairs.
WEST BROMPTON ACCESS
4.4.5 A total of nine accidents (reference numbers 97, 112, 156, 162, 178, 197, 199, 200, 222) were recorded over the past three years in the vicinity of the West Brompton access.
4.4.6 Four of the accidents (numbers 97, 178, 199, 222) occurred at the junction of Old Brompton Road and Eardley Crescent, although a detailed review of the accident descriptions does not suggest a particular deficiency with the highway layout. Four of the accidents involved cyclists, but no particular pattern is apparent from the accident descriptions.
LILLIE ROAD EASTERN ACCESS
4.4.7 Eight accidents were recorded over the past three years (reference numbers 5, 22, 37, 81, 152, 155, 160, 205). All resulted in injuries to vulnerable road users.
4.4.8 Four of the accidents involved cyclists, two involved motorcyclists and the other two involved serious injury to pedestrians. Seven of the accidents occurred during hours of darkness, suggesting a possible issue with street lighting which can be improved if necessary as part of the access design.
LILLIE ROAD WESTERN ACCESS
4.4.9 No accidents were recorded here.
THRAXTON ROAD ACCESS
4.4.10 Eight accidents were recorded within 50m of this access location over the past three years (reference numbers 34, 47, 59, 65, 142, 153, 189, 241). All resulted in injuries to vulnerable road users
4.4.11 Six of the accidents involved motorcyclists, one a cyclist, and the other a pedestrian crossing North End Road near Chesson Road. Only two of the accidents occurred during hours of darkness.
ACCESS NEAR STAR ROAD
4.4.12 Eight accidents were recorded within 50m of this access location over the past three years (reference numbers 6, 7, 16, 40, 77, 134, 141, 169, 216). All resulted in injuries to vulnerable road users
4.4.13 Six of the accidents involved motorcyclists and two involved cyclists. Five of the accidents occurred during hours of darkness, again suggesting a possible issue with street lighting which can be improved if necessary as part of the access design. .
ACCESS NEAR MAY STREET
4.4.14 Three accidents were recorded within 50m of this access location over the past three years (reference numbers 117, 186, 208). All resulted in injuries to vulnerable road users, and all occurred during daytime.
4.4.15 One accident involved a child playing on the road. One involved a motorcyclist being injured while overtaking by a car pulling out of a traffic queue, and the other a cyclist being injured while undertaking injured by a car turning left.

Application 2 Transport Assessment 28
BEAUMONT CRESCENT ACCESS
4.4.16 Three accidents were recorded within 50m of this access location over the past three years (reference numbers 46, 96, 174). Two of them resulted in injuries to vulnerable road users
4.4.17 One accident involved a pedestrian crossing North End Road on a pedestrian crossing point. One involved a motorcyclist being injured by a driver who failed to stop, and the other accident was a rear-end shunt between cars. All of the accidents occurred during hours of darkness, again suggesting a possible issue with street lighting which can be improved if necessary as part of the access design. .
BEAUMONT AVENUE ACCESS
4.4.18 Six accidents were recorded within 50m of this access location over the past three years, although some of these were in fact on the immediate approach of North End Road to the A4. Three of them resulted in injuries to vulnerable road users
4.4.19 There were two pedestrian accidents; one being seriously injured on a pedestrian crossing and the other involving slight injuries to pedestrians crossing North End Road between cars. One accident involved a motorcyclist, reported to be overtaking a car on the nearside. Only two of the accidents occurred during hours of darkness.
A4/ WARWICK ROAD
Car Driver/Passenger Accidents
4.4.20 A total of 11 accidents involving car drivers/passengers have been recorded at this junction over the past three years. Only one involved injuries of a serious nature. Four of the accidents occurred during hours of darkness indicating a possible issue with street lighting.
4.4.21 Seven accidents (64%) occurred when a stationary vehicle waiting at the junction was hit from behind by another vehicle either following too closely or exceeding the speed limit.
Motorcyclist Accidents
4.4.22 Four accidents involving motorcyclists have been recorded. Two of these involved injuries of a serious nature whilst all occurred during hours of darkness. One of these accidents was caused in a head to head collision where a car driver had been travelling in the incorrect lane.
Cyclist Accidents
4.4.23 Five accidents involving cyclists have been recorded. None of these accidents resulted in injuries of a serious nature. Two of the accidents occurred due to vehicles travelling too close to the cyclist.
Pedestrian Accidents
4.4.24 A total of four accident s involving pedestrians have been recorded. None of these accidents resulted in injuries of a serious nature. Two of the accidents occurred during hours of darkness and both were due to incorrect use of a crossing facility.
A4/ NORTH END ROAD
Car Driver/Passenger Accidents
4.4.25 A total of 15 accidents involving car drivers/passengers have been recorded at this junction over the past three years. Of these 15 accidents, two

Application 2 Transport Assessment 29
involved injuries of a serious nature. Five of the accidents occurred during hours of darkness indicating a possible issue with street lighting.
4.4.26 Six of these accidents (40%) occurred when a stationary vehicle waiting at the junction was hit from behind by another vehicle either following too closely or exceeding the speed limit.
Motorcyclist Accidents
4.4.27 Five accidents involving motorcyclists have been recorded. Of these five, two involved injuries of a serious nature. Three of these accidents occurred due to drivers of other vehicles failing to look properly and colliding with the motorcyclist.
Cyclist Accidents
4.4.28 Two accidents involving cyclists have been recorded. One of these accidents resulted in injuries of a serious nature and occurred when the cyclist attempted to pre-empt the traffic signal.
Pedestrian Accidents
4.4.29 Seven accidents involving pedestrians have been recorded. One of these accidents resulted in injuries of a serious nature. Two of the accidents occurred during hours of darkness and the majority (57%) occurred due to incorrect use of a crossing facility.
NORTH END ROAD/ LILLIE ROAD
Car Driver/Passenger Accidents
4.4.30 A total of three accidents involving car drivers/passengers have been recorded at this junction over the past three years. None involved injuries of a serious nature whilst one accident occurred during hours of darkness.
Motorcyclist Accidents
4.4.31 One accident involving a motorcyclist has been recorded. This accident resulted in a slight injury resulting from a collision on the mini-roundabout.
Cyclist Accidents
4.4.32 Three accidents involving cyclists have been recorded. None of these accidents resulted in injuries of a serious nature. Two of the accidents occurred during hours of darkness and both were due to a failure to look properly.
OLD BROMPTON ROAD/ FINBOROUGH ROAD
Car Driver/Passenger Accidents
4.4.33 One accident involving a car driver/passenger has been recorded at this junction over the past three years. This accident resulted in a slight injury occurring when a stationary vehicle waiting at the junction was hit from behind by another vehicle following too closely.
Cyclist Accidents
4.4.34 One accident involving a cyclist has been recorded. This accident resulted in a slight injury occurring after ignoring the traffic signal and colliding with a vehicle on the junction.
Pedestrian Accidents
4.4.35 One accident involving a pedestrian has been recorded. This accident occurred during hours of darkness and resulted in a slight injury after the pedestrian ignored the traffic signal and collided with a vehicle on the junction.

Application 2 Transport Assessment 30
OLD BROMPTON ROAD/ EARLS COURT ROAD
Car Driver/Passenger Accidents
4.4.36 A total of two accidents involving car drivers/passengers have been recorded at this junction over the past three years. Both accidents resulted in a slight injury to the car drivers.
Motorcyclist Accidents
4.4.37 Two accidents involving motorcyclists have been recorded. Both accidents occurred during hours of darkness possible highlighting a possible issue with street lighting.
Cyclist Accidents
4.4.38 One accident involving a cyclist has been recorded. This accident resulted in a slight injury and occurred during hours of darkness when a vehicle disobeyed the give way markings on the junction.
Pedestrian Accidents
4.4.39 One accident involving a pedestrian has been recorded. This accident occurred during hours of darkness and resulted in a slight injury after the pedestrian failed to look properly when using the crossing.
EARLS COURT ROAD/ A4
Car Driver/Passenger Accidents
4.4.40 A total of three accidents involving car drivers/passengers have been recorded at this junction over the past three years. All accidents resulted in slight injury and occurred during hours of darkness highlighting a possible issue with street lighting.
4.4.41 Two of the accidents resulted from a failure to look properly when changing lanes whilst the last accident occurred when a vehicle mistook the green light for the filter light and proceeded to collide with another vehicle.
Motorcyclist Accidents
4.4.42 Three accidents involving motorcyclists have been recorded. Two of the accidents occurred during hours of darkness whilst all were caused by other vehicles disobeying the traffic signal and colliding with the motorcyclist.
Pedestrian Accidents
4.4.43 Three accidents involving pedestrians have been recorded at this junction over the past three years. Two of these accidents occurred during hours of darkness and were due to pedestrians ignoring a red signal.
4.5 ON-STREET PARKING
4.5.1 Daytime car parking availability in the area surrounding the ECWKOA has been established through surveys undertaken on the 12th October 2010. Two events were taking place at Earls Court Exhibition Centre that day – The Restaurant Show and The Halal Capital Markets Conference 2010. It was apparent from on-site observations during the survey that there was little or no off-site parking impact from those relatively small events. The surveys were undertaken by the Vincent Knight independent survey company using a standard methodology for data collection.
4.5.2 The purpose of the surveys was to determine on-street parking capacity for resident permit holders and for non-residents during controlled parking hours. The full parking survey data is contained in Appendix I.

Application 2 Transport Assessment 31
4.5.3 A full analysis of the existing parking provision up to two kilometres from the ECWKOA and has been informed through the parking assignment model within LTS that has been used to generate trips for Earls Court Transport Study.
4.5.4 Parking controls in RBKC allocate bays to specific users which are categorised as follows:
Resident Bays
Pay and Display (P & D) Bays
Car Club Bays
Diplomatic Bays
Disabled Bays
4.5.5 It should be noted that RBKC does not utilise a parking zoning system and therefore residents are permitted to park in resident bays anywhere within RBKC.
4.5.6 The surveys undertaken established the following parking availability and usage in RBKC for all categories of parking.
Table 4.2: RBKC Parking Survey Summary
Parking Type Number of Available
Bays
Number of Parked Cars
Parking Stress
Free Spaces
Residents 9786 7690 78.6% 2096
P & D 1438 843 58.6% 595
Car Club 52 34 65.4% 18
Diplomatic 65 8 12.3% 57
Disabled 38 20 52.6% 18
Total 11379 8595 75.5% 2784 4.5.7 Residents parking and P & D parking are the biggest contributors to the overall parking stock in the RBKC part of the survey area. It is apparent that Resident and P & D parking has some available spare capacity with residents parking operating at 78.6% and P & D parking operating at 58.6%.
4.5.8 In contrast to the RBKC designations, parking controls in LBHF do not allocate bays to specific users and allow all users to use available parking bays as long as they are displaying the appropriate permits. It should be noted that LBHF does have a zoning system and therefore residents are only permitted to park in resident’s bays within the zone in which their car is registered.
4.5.9 The surveys established the following parking availability and usage in LBHF for all categories of parking.
Table 4.3: LBHF Parking Survey Summary
Parking Type Number of Available
Bays
Number of Parked Cars
Parking Stress
Free Spaces
All Bays 12803 7264 56.7% 5539
Total 12803 7264 56.7% 5539 4.5.10 Parking bays in the LBHF part of the survey area are operating at 56.7% of available capacity.

Application 2 Transport Assessment 32
4.5.11 Analysis of both Boroughs indicates that greater parking availability currently exists in LBHF than RBKC. Figure 4.5 illustrates total parking stress for both Boroughs around the site on the day of the surveys.
4.5.12 In terms of parking that can be used by visitors, the parking policies employed by LBHF mean that significant parking stock is available for visitors to park in the streets surrounding the ECWKOA. In RBKC, the designation of specific P&D bays means that on street visitor parking is limited.

Application 2 Transport Assessment 33
5 Baseline Conditions – Public Transport
5.1 ACCESS TO THE TRANSPORT SYSTEM
5.1.1 The Public Transport Accessibility Level (PTAL) methodology has been adopted by the GLA and TfL as a means of quantifying and comparing accessibility to public transport for a given site.
5.1.2 The existing PTAL map for the site is shown in Figure 5.1.
5.1.3 The existing Public Transport Accessibility Level (PTAL) of the Site Wide Development Area varies from a maximum of 6a (“excellent”) around the Warwick Road access near Earls Court station to a minimum of 3 (“moderate”) between the West London Line and North End Road and relates to the element of the site that includes the West Kensington estate. This reduced PTAL relates to the lack of permeability from North End Road across the Earls Court Site. If a connection through the site were to be provided then a future PTAL of 6a (“excellent” public transport accessibility) would be achieved across the Earls Court Site when TfL’s committed District Line, Piccadilly Line and West London Line service frequency improvements are completed.
5.2 EXISTING BUS SERVICES
5.2.1 The existing bus services in and around the study area are shown in Figure 5.2. It should be noted that as a result of the Earls Court One Way System the closest southbound bus stops along this corridor are in Earls Court Road with Warwick Road only providing for northbound services.
5.2.2 The bus stops located within 400 metres walking distance from the Earls Court Site accesses are served by the following bus routes.
Table 5.1: Existing Bus Services (Site Wide Development Option)
Service Route Description Frequency
One Way Buses/hr
9 (N9) Aldwych / South Side to Hammersmith 10
10 (N10) Kings Cross Station / York Way to Hammersmith Bus Station
10
27 (24 hours) Chalk Farm Morrisons to Turnham Green / Sutton Lane North
10
28 Station Terrace to Mapleton Crescent 10
74 Putney Bridge Road to Baker Street Station 8
190 Danebury Avenue / Minstead Gardens to Empress State Building
7
328 Golders Green Station to Limerston Street 9
391 Stands End / Sainsbury’s to Richmond Bus Station
6
430 Danebury Avenue / Minstead Gardens to South Kensington Station
6
C1 Victoria Station to White City Bus Station 6
C3 Falcon Road / Grant Road to Warwick Road Tesco 7
Total (One Way) 89

Application 2 Transport Assessment 34
5.2.3 The bus routes available from the site provide high frequency services with onward connection to Central and West London destinations plus other public transport interchanges.
5.2.4 TfL Buses have advised that the current three-stand provision within the ECWKOA should be retained as part of any redevelopment proposals.
5.2.5 The bus priority network around the study area is relatively sparse, with only limited sections of bus lane on North End Road. The lack of bus priority means that services are vulnerable to delays caused by traffic congestion.
5.2.6 A review of passenger numbers on the local bus network has been assessed through the use of the Railplan model. A summary of bus passenger numbers against available seating capacity along the key corridors in the study area are provided below in Tables 5.2 and 5.3. The figures have been generated from an AM and PM peak 3 hour period through the application of a factor of 0.33 to supply and 0.54 to passenger demand. The flows indicate that bus passenger numbers are higher in the PM peak period than the AM peak hour.
Table 5.2 AM Peak Bus Utilisation (0800-0900)
Link Direction Seating Capacity
Observed Base
% Of Capacity
Used
North End Road NB 733 519 71%
North End Road SB 733 398 54%
Lillie Road EB 1950 457 23%
Lillie Road WB 1117 249 22%
Warwick Road NB 1262 865 69%
Earls Court Road SB 1262 664 53%
Table 5.3 PM Peak Bus Utilisation (1700-1800)
Link Direction Seating Capacity
Observed Base
Capacity Used
North End Road NB 733 561 77%
North End Road SB 733 582 79%
Lillie Road EB 1935 241 13%
Lillie Road WB 1104 498 45%
Warwick Road NB 1094 902 82%
Earls Court Road SB 1095 875 80%
5.2.7 Tables 5.2 and 5.3 indicate that current bus passenger demand can be accommodated on the services currently being provided. This assessment is an aggregate of all services along each corridor and specific bus routes may have a greater level of peak hour utilisation than reported above.
5.3 BUS STOP REVIEW
5.3.1 As part of the ECTS Pedestrian Environment Review System (PERS) assessment, an audit of bus stop facilities was undertaken. This found that none of the bus stops have Real Time Passenger Information (RTPI), nor raised kerbs to assist wheelchair users or prams with level access arrangements. However most of the stops have other facilities, as summarised by Table 5.4.

Application 2 Transport Assessment 35
Table 5.4 Existing Bus Stop Facilities
Street Stop
Letter Shelter RTPI Lighting
Timetable for all routes
Local Area Information
Seating
Warwick Road E x
West Cromwell Road D x
Earls Court Road K x x x x x
Earls Court Road A x
Earls Court Road L x
Finborough Road N x
Warwick Road B x
Old Brompton Road M x
Old Brompton Road O x
Old Brompton Road P x
Lillie Road BA x x x x
Lillie Road BB x
Warwick Road C x
North End Road BR x x x x x
North End Road BT x
North End Road BS x
North End Road T x
North End Road S x
5.3.2 Bus Stops BR, K and BA lack the most facilities.
5.3.3 Bus Stop BR on North End Road lacks a shelter, detailed public transport / local information, seating and lighting for waiting passengers. The bus stop is located along the frontage of the Express Holiday Inn hotel. The bus stop flag is aligned with a litter bin and there is no further street furniture on this section of footway. This means that there is no lighting provided at the bus stop, however the lighting provided on the façade of the hotel illuminates the footway and bus stop.
5.3.4 Bus Stop K, on Earls Court Road near Nevern Place, lacks a shelter, information and lighting for waiting passengers. The lack of a shelter is due to the 2m footway which becomes congested at peak periods. Even without a shelter being available, the bus stop flag and groups of waiting passengers reduce the available footway space for passing pedestrians.
5.3.5 Bus Stop BA, eastbound on Lillie Road west of Seagrave Road, also lacks a shelter and detailed public transport / local information due to the 1.8m footway width. The adjacent street lighting column and the bus stop flag are not aligned and obstruct the footway space available to passing pedestrians.

Application 2 Transport Assessment 36
5.4 RAIL SERVICES
5.4.1 London Overground and Southern trains run services via West Brompton from Kensington Olympia, Clapham Junction, East Croydon, Watford Junction, Willesden Junction and Stratford. These services provide approximately 10 two-way mainline trains per hour (six London Overground and four Southern) in the AM peak hour.
5.4.2 The London Overground is a suburban network of rail services in London managed by TfL since November 2007. By 2011 London Overground will go through 20 of London's 33 boroughs resulting in 30% of all Londoners being less than a 15 minute walk from their local stations.
5.4.3 The London Overground connects to the extended East London line running from Dalston Junction to West Croydon, Crystal Palace and New Cross.
5.5 UNDERGROUND SERVICES
Earls Court Station
5.5.1 Earls Court Station provides access to the District and Piccadilly Lines. The peak hour frequencies by line and direction are summarised in Table 5.5 below.
Table 5.5 Earls Court Station Peak Hour Frequencies
Destination Frequency (trains per hour)
District Line – Ealing Broadway 8
District Line – Kensington Olympia 3
District Line – Richmond 6
District Line – Wimbledon 13
District Line – Edgware Road 6
District Line - Upminster 14
Piccadilly Line – Heathrow Terminal 4 6
Piccadilly Line – Heathrow Terminal 5 6
Piccadilly Line – Uxbridge 4
Piccadilly Line - Cockfosters 18
Total 84
5.5.2 Earls Court Station provides a total of 78 services per hour across the District and Piccadilly Lines which provide access across London including Richmond, Westminster, Heathrow, Ealing Broadway and Uxbridge.
West Brompton Station
5.5.3 West Brompton station provides access to the District Line, Wimbledon Branch. The peak hour frequencies by line and direction are summarised in Table 5.6.

Application 2 Transport Assessment 37
Table 5.6 West Brompton Station Peak Hour Frequencies
Destination Frequency (trains per hour)
District Line – Tower Hill 3
Distrcit Line – Dagenham East 2
District Line – Wimbledon 14
District Line – Edgware Road 5
District Line - Upminster 4
Total 28
5.5.4 West Brompton station provides a total of 24 services in the AM peak hour with onward connections to destinations across London via the District and Piccadilly Lines at Earls Court station, and overground rail services at Wimbledon.
West Kensington Station
5.5.5 West Kensington Station provides access to the District Line. The peak hour frequencies by line and direction are summarised in Table 5.7 below.
Table 5.7 West Kensington Station Peak Hour Frequencies
Destination Frequency (trains per hour)
District Line – Dagenham East 1
District Line – Barking 2
District Line – Ealing Broadway 7
District Line – Richmond 7
District Line – Upminster 10
Total 27
5.5.6 West Kensington Station provides a total of 24 services in the AM peak hour with onward services to destinations across London accessible via the District and Piccadilly Lines at Earls Court Station.
5.6 FUTURE SERVICE IMPROVEMENTS
5.6.1 The public transport improvements which are already proposed by the Mayor’s Transport Strategy (May 2010) and which have direct implications on the surrounding public transport networks have been derived through interrogation of LTS and the Central and Northern Sub Regional Railplan (CNSRRP) model. This model includes:
Upgrade of the Piccadilly and District Lines;
West London Line upgrade;
Crossrail 1.
5.6.2 The upgrades of the Piccadilly and District Lines involve an increase in frequencies and improvements to rolling stock to deliver increased capacity. Table 5.8 illustrates the average number of Trains per Hour (TPH), the corresponding number of available seats in the peak three-hour period and the corresponding crush (7 passengers per m²) capacity.

Application 2 Transport Assessment 38
Table 5.8: Existing Underground Line Peak Hour Capacity (from Railplan)
Service TPH Seats per Peak
Period Capacity per Peak
Period
District Eastbound 30.7 23,498 111,641
District Westbound 31.3 24,041 114,091
Piccadilly Eastbound 23.0 15,731 70,788
Piccadilly Westbound 24.3 16,651 74,928
5.6.3 The changes in TPH and capacity in percentage terms by 2026 are set out in Table 5.9 below.
Table 5.9: 2026 Underground Capacity % Changes (from Railplan)
TPH Seats per Peak
Period Capacity per Peak
Period
District Eastbound 17% 25% 19%
District Westbound 15% 23% 17%
Piccadilly Eastbound 30% 30% 30%
Piccadilly Westbound 23% 23% 23%
5.6.4 The upgrade of the West London Line results in a significant increase in capacity, delivered through changes to rolling stock and service frequency. A summary of TPH, seats per three-hour peak period and associated capacity is set out in Table 5.10.
Table 5.10: West London Line Capacity
TPH Seats per Peak Period
Capacity per Peak Period
WLL Northbound 3.7 2,568 6,905
WLL Southbound 4.3 3,039 8,221
5.6.5 The changes to WLL capacity by 2026 are set out in percentage terms in Table 5.11.
Table 5.11: 2026 West London Line % Changes in TPH and Capacity
TPH Seats per Peak Period
Capacity per Peak Period
WLL North 62% 24% 97%
WLL South 40% 5% 65%
5.6.6 Crossrail 1 is included within both the LTS and the Railplan models, and the capacity benefits are therefore incorporated in the modelling assessment undertaken. Crossrail 1 will provide high frequency, convenient and accessible rail access for London and the South East. It will travel from Maidenhead and Heathrow in the west to Shenfield and Abbey Wood in the east via new twin tunnels under central London, and will serve the West End, the City of London and Canary Wharf.
5.6.7 Its rolling stock will have capacity to carry more than 1500 passengers in each train during peak periods, and will reduce crowding on London's transport network. Although Crossrail 1 will not pass through the immediate area, its delivery

Application 2 Transport Assessment 39
will result in relief to, and increased available capacity on, nearby sections of the public transport networks such as the Piccadilly Line.
5.7 RAIL NETWORK FLOWS
5.7.1 Passenger flows are based on 2007 observed data from TfL for the underground network, and 2010 data for the overground rail network. Appendix J provides directional flows for each tube line for the AM and PM peaks.
5.7.2 The underground line flows show that the AM peak is the critical period, where the Fulham Broadway to Earls Court section of the District Line has a standing density above four passengers / sqm. All other sections of the underground network have lower passenger densities.
5.7.3 The West London Line flows peak between Kensington Olympia and Imperial Wharf stations in the southbound direction during the PM peak. Standing densities exceed four passengers / sqm between Kensington Olympia and Imperial Wharf stations northbound in the AM peak and southbound in the PM peak.
5.8 RAIL STATIONS
5.8.1 The Earls Court Site provides convenient access to Earls Court, West Kensington and West Brompton stations for underground services and West Brompton station for London Overground and Southern train services. Earls Court station has a disused pedestrian access via a tunnel from the Earls Court Exhibition Centre, which passes underneath Warwick Road.
5.8.2 The existing inbound and outbound passenger movements at each station show the AM peak to be marginally busier than the PM peak, with Earls Court station having just over four times as many movements as West Brompton station.
5.8.3 These base year flows have been used to assess each station’s operation during peak periods, as reported further in section 12.
5.9 INTERCHANGE SPACE REVIEW
5.9.1 TfL’s “Interchange Best Practice Guidelines 2009” considers purpose-built “interchange facilities”, and “interchange zones” where interchange takes place in locations where few formal facilities exist. It describes interchange zones as often being gateways which provide an interface between public transport services and the surrounding area. The guidance sets out a Design and Evaluation Framework, based on the four themes of Efficiency, Usability, Understanding and Quality. Each theme has four principles, as follows :
Efficiency- Operations, Movement within an interchange facility, Movement through the wider interchange zone, Sustainability
Usability- Accessibility, Safety and accident prevention, Personal security, Protected environment
Understanding - Legibility, Permeability, Wayfinding, Service information
Quality- Perception, Quality of built design, Urban realm, Sense of place
5.9.2 Earls Court and West Brompton stations are interchange zones, and have been considered against the themes and principles set out in the TfL guidance as summarised below.

Application 2 Transport Assessment 40
Earls Court Station 5.9.3 There are deficiencies in terms of “Movement through the wider interchange zone”. On-site observations indicate that footways are congested at peak times due to the levels of pedestrian flow, and exacerbated by the guardrails and ad hoc cycle parking. Street furniture for lighting, pedestrian signals and general signage also reduces the available width for pedestrians. There is no formal cycle parking at this location nor any dedicated taxi pick up or drop off facilities.
5.9.4 The interchange zone is also lacking in terms of “Legibility” and “Wayfinding”. The nearby street furniture could be rationalised and the directional signage for pedestrians could be improved.
West Brompton Station 5.9.5 The space in front of West Brompton station provides direct interchange opportunities for taxis and pick-up / drop-off, although there are other deficiencies in terms of “Movement through the wider interchange zone”. Guard railing constrains the adjacent footways and the pedestrian movements to the Lillie Bridge signalised crossing.
5.9.6 There are four Sheffield cycle stands directly outside of the station with a further three adjacent to the Lillie Bridge pedestrian crossing whereas the document “Cycle Parking Standards TfL Proposed Guidance” suggests that one cycle parking space per 200 entrants would be required.
5.9.7 The interchange zone is also lacking in terms of “Legibility” and “Wayfinding” as there is currently a lack of signage at West Brompton station to help passengers to continue their journeys by foot.
5.9.8 The “Urban realm” immediately outside the station lacks quality frontage, with large advertising boards on both sides of carriageway.
West Kensington Station
5.9.9 The interchange space in front of West Kensington station provides direct interchange with local bus services at bus stops S and T on North End Road. Bus stop S has a shelter immediately outside the station for southbound travel down North End Road, although there are other deficiencies in terms of “Movement through the wider interchange zone”.

Application 2 Transport Assessment 41
5.9.10 The footway width south of the station access is narrow. Pedestrians looking to cross over to the opposite side of the carriageway are directed to the signalised crossing at the North End Road / A4 West Cromwell Road junction.
5.9.11 There are five Sheffield cycle stands outside the station on the opposite side of the carriageway. A further four Sheffield stands are located on the western footway of North End Road to the south of its junction with Barons Court Road. West Kensington is also considered as a District Interchange; therefore having the same one per 200 entrants TfL cycle parking standard as West Brompton.
5.9.12 The interchange zone is also lacking in terms of “Legibility” and “Wayfinding” as there is currently a lack of signage to help passengers continue their journeys by foot.

Application 2 Transport Assessment 42
6 Baseline Conditions - Walking & Cycling
6.1 PEDESTRIAN NETWORK
6.1.1 This section considers the existing pedestrian and cyclist networks, based on a number of site audits, which have been supplemented through detailed desktop analyses. The study has included an overview of pedestrian and cyclist permeability; pedestrian and cyclist movement surveys; an audit of footway widths and cyclist facilities; and a Pedestrian Environment Review System (PERS) assessment using the standard TfL method to audit the quality of the pedestrian environment and public realm.
6.1.2 The pedestrian network and highway crossing points are shown on Figure 6.1. The pedestrian network largely follows the road network and, with the exception of routes across green spaces such as Brompton Cemetery, there are few dedicated pedestrian-only links in the surrounding area.
6.1.3 East-west and north-south movements are affected by the West London Line and the District Line branches. Together these form a barrier to pedestrian and cycle permeability and to wider connections in the area. The West London Line is bridged by Lillie Road and the A4 but with no additional crossings in the 700m distance between these two bridges. As a result, the community around and west of North End Road lacks pedestrian and cycle permeability to Earls Court station and town centre. Similarly, the District Line is bridged by Warwick Road and North End Road, but with no intermediate crossing in between, which causes severance between the Seagrave Road area and West Kensington north of the A4.
6.1.4 North of the site the principal barrier is the A4, which has a poor quality environment due to its traffic volumes, speed and width of carriageway. This section of the A4 provides crossing points only at the junctions with North End Road and Warwick Road which are 570m apart, although it is acknowledged that the current lack of accessible land uses on either side of the A4 currently means there is limited existing demand to cross the road between the North End Road and Warwick Road junctions. The A4 is a major arterial road with six lanes of traffic, no on-street parking and is overlooked by residential buildings set back from the road. The streetscape contains mature trees, hard landscape, bollards, screening and billboards.
6.1.5 Warwick Road also forms a barrier to pedestrian and cyclist crossing movements due to the volume and speed of traffic, and its three-lane carriageway width. There are four crossing points along the length of Warwick Road that in part reduce the barrier effect of the road and allow access from the site to Earls Court Station and Earls Court Road further east.
6.1.6 In comparison, North End Road and the Old Brompton Road/ Lillie Road corridor have lower traffic flows with more and shorter pedestrian crossing points, and are generally easier for pedestrians to cross.
North End Road / A4 Pedestrian Facilities
6.1.7 The junction currently operates as a three stage signal control; the east-west A4 Talgarth Road discharges, a westbound early cut-off allows right turning traffic southbound into North End Road, followed by the north-south North End Road stage. During the North End Road stage all A4 mainline traffic is stopped and pedestrian phases run over the complete width of Talgarth Road (albeit through staggered layouts).

Application 2 Transport Assessment 43
6.1.8 The junction accommodates significant traffic volumes which contribute to its poor pedestrian environment. The staggered crossings over the A4, despite the pedestrian phase running across the full width of the A4, contribute to the A4 being a barrier to pedestrian movement.
North End Road / Lillie Road Pedestrian Facilities
6.1.9 The junction of North End Road and Lillie Road is a double mini roundabout junction. The layout of the junction requires that pedestrian crossings are provided in the form of zebra crossings.
6.1.10 Zebra crossings are located on each arm of the junction but are located on average 20 metres from the respective stop lines resulting in significant deviations from desire lines. To avoid pedestrians crossing on their desire lines significant lengths of pedestrian guard rail are in place along all arms which in turn reduces pedestrian footway width.
Old Brompton Road / Warwick Road / Finborough Road Pedestrian Facilities
6.1.11 This signalised junction is on the Earls Court One Way System, with Finborough Road and Warwick Road both running northbound only. There are pedestrian crossings on each of the arms, with the Finborough Road crossing running with traffic on Old Brompton Road.
6.1.12 The junction is characterised by substantial footway width and public realm on the northern side of the junction (entry to Warwick Road).
Warwick Road / A4 Pedestrian Facilities
6.1.13 This signalised junction is on the Earls Court One Way System, with Warwick Road both running northbound only. The junction is dominated by the width of carriageway and the volume of traffic passing, resulting in two- or three-stage pedestrian crossings on most of the arms.
Earls Court Road / A4 Pedestrian Facilities
6.1.14 This signalised junction is also dominated by the width of carriageway and the volume of traffic passing through it. However it benefits from better pedestrian crossing facilities and landscaping. The Earls Court Road pedestrian crossing is offset away from the junction on Earls Court Road and therefore requires a diversion from the pedestrian desire line for pedestrians going east/ west along the A4. There are no pedestrian crossing facilities on the A4 western arm.
Earls Court Road / Old Brompton Road / Redcliffe Gardens Pedestrian Facilities
6.1.15 The signalised junction of Earls Court Road and Old Brompton Road is part of the Earls Court One Way System with Earls Court Road and Redcliffe Gardens both running southbound only. The junction has pedestrian crossing facilities on all arms except Redcliffe Gardens.
6.2 CYCLE NETWORK
6.2.1 The existing London Cycle Network (LCN) around the site is also shown on Figure 6.1.
6.2.2 The LCN has a limited coverage around the site and there is limited direct east-west and north-south connectivity. A number of existing routes become fragmented in the immediate vicinity of the site or terminate at or close to the A4. A sign-posted route along Lillie Road and Old Brompton Road connects parts of Fulham to the west with South Kensington in the east. This is supported by advisory cycle lane carriageway markings along Lillie Road and Old Brompton Road before

Application 2 Transport Assessment 44
then continuing eastbound along Kempsford Gardens. There is no further on-carriageway cycle provision in the area.
6.2.3 The provision of the Mayor’s Cycle Superhighways will help to alleviate this lack of connectivity, with Superhighway 9 (CS9) proposed to run along Kensington High Street north of the Earls Court Site.
6.2.4 Cycle parking in the area is limited to small clusters, at the locations indicated on Figure 6.1. There are 3 to 4 stands in locations along Earls Court Road, at the junctions of Penywern Road and Old Brompton Road/ Redcliffe Gardens. A similar level is provided along Warwick Road, with Sheffield stands provided at both junctions with Nevern Square. Ad-hoc cycle parking also takes place along sections of pedestrian guard railing on Warwick Road, and in a number of other locations with street furniture.
6.2.5 North End Road has more cycle parking along its northern end with small pockets of spaces being located close to the junction with Barons Court Road and Beaumont Avenue, close to the junction with Charleville Road, and at Beaumont Crescent. Further south towards the Lillie Road junction, there is less cycle parking available.
6.2.6 The Earls Court Site is on the western fringe of the Barclays Cycle Hire scheme, with an existing docking station located on Warwick Road.
6.3 EXISTING PEDESTRIAN AND CYCLIST ACTIVITY
6.3.1 WSP have obtained a number of pedestrian and cyclist counts. From this data it has been possible to identify where high pedestrian activity exists in the area, as shown in Figures 6.2 and 6.3. The highest levels of pedestrian movement occur around the Earls Court station access on Warwick Road. The next busiest areas are along Lillie Road and Old Brompton Road around West Brompton station. The AM peak flows are higher than the PM flows.
6.3.2 Existing cycle movements have been established from a number of fully classified traffic surveys, as summarised by Figures 6.4 and 6.5. This analysis indicates that Lillie Road and Old Brompton Road have the highest levels of cyclist activity, being more than double the flows on the next-busiest routes – North End Road and Warwick Road. The AM peak flows are higher than the PM flows.
6.3.3 Generally cycling levels in the area are relatively low. The lack of supporting infrastructure in terms of cycle parking and on-street infrastructure, and dominance of vehicular traffic on key links may contribute to this low base.
6.4 PERS AUDIT
6.4.1 A Pedestrian Environment Review System (PERS) assessment has been undertaken to assess the level of service and quality across the existing pedestrian network and public realm. The PERS Audit results are set out in Appendix K.
6.4.2 PERS is used to review the following aspects of the pedestrian environment:
Links – Any footway, footpath or highway.
Crossings – Any designated or undesignated crossing where a pedestrian route intersects with a highway.
Routes – A way that links a trip origin and a trip destination, such as home to work. Routes are made up of any number of links and crossings.
Public Transport Waiting Areas (PTWAs) – Any designated area where people are required to wait in order to use public transport, such as bus and train stops.

Application 2 Transport Assessment 45
Interchange Spaces – The areas around and between public transport stops or termini. They allow travellers to change between transport modes. PERS is used to assess the external public interchange space only, not the interior.
Public Spaces – These vary in size from small plazas to parks, used as part of a pedestrian’s route.
6.4.3 The audit was carried out in accordance with TfL’s ‘Pedestrian Environment Review System, Review Handbook Version 2, May 2006’ and the review forms provided in the PERS Handbook were used to assess each item.
6.4.4 The items which were reviewed included 21 links, 68 crossings, 12 public transport waiting areas (PTWA’s), six interchange spaces, two public spaces and five routes to key services and facilities. These are all itemised on Table 2.1 of Appendix K and the results are summarised below.
Links
6.4.5 All links were assessed as “positive overall” providing good quality surfacing and generally well maintained with dropped kerbs in appropriate locations. However, the audit results show a lack of signage and information provision along all the links. Improved pedestrian signage and ‘wayfinding’ would assist pedestrians.
6.4.6 Specific shortcomings around the Earls Court Site, as identified by the audit are summarised below. These have informed the proposals for public realm improvements.
Earls Court Road
6.4.7 In some locations and despite the adequate overall footway widths, the usable footway width is restricted as a result of street furniture, “clutter”, and private premises signage.
North End Road
6.4.8 Pedestrian conflict and congestion was observed during the survey particularly on the eastern footway. The market stalls on the footway south of Lillie road significantly reduce the footway width available to pedestrians.
6.4.9 The eastern footway narrows immediately south of the West Kensington station entrance, where the building line of some retail units steps out into the footway.
Lillie Road/ Old Brompton Road
6.4.10 A lack of provision of dropped kerbs, cracked or damaged footways and poor surfacing reinstatements were observed in places along the Lillie Road footways.
6.4.11 Generally the footways have an acceptable width for the current level of pedestrians, but there are some pinch points as in the “Footway Widths” sub-section below.
A4 West Cromwell Road
6.4.12 The A4 West Cromwell Road is a heavily trafficked dual carriageway. The section east of Warwick Road has a more pleasant pedestrian environment with footways exceeding 2m in width and residential frontages along the link.
6.4.13 The section west of Warwick Road is dominated by high volumes of traffic and parapet walls / guard railing which limits pedestrian crossing opportunities and detract from the pedestrian environment.

Application 2 Transport Assessment 46
Footway Widths
6.4.14 TfL’s PERS audit guidelines note that 2m is regarded as the desirable minimum effective footway width (ie clear width within the total width of the footway)/ Further and more recent guidance in TfL’s 2010 Pedestrian Comfort Level Guidance recommends different total and clear widths related to pedestrian flows, as follows :
Low Flow (<600/hr) : 2.9m recommended minimum total width, reduced to 2.6m total width on high streets / tourist areas if there is no street furniture (except street lights) and 2.0m on other streets with no street furniture
Active Flow (600-1200/hr) : 4.2m recommended minimum total width, reduced to 3.3m total width on high streets / tourist areas if there is no street furniture (except street lights) and 2.2m on other streets with no street furniture
High Flow (<1200/hr) : 5.3m recommended minimum total width, reduced to 3.3m total width if there is no street furniture
6.4.15 Referring back to Figures 6.2 and 6.3, the footways are in the Low Flow category except for the following sections which fall into the Active Flow category :
North End Road eastern footway south of the West Kensington station entrance
Lillie Road southern footway west of the West Brompton station entrance
Warwick Road eastern footway north of the Earls Court station entrance.
6.4.16 The footway widths along Warwick Road, the A4, North End Road, Lillie Road and Old Brompton Road were all reviewed and measurements were taken to confirm which sections were sub-standard. These sections are highlighted on Figure 6.1 and are described below.
6.4.17 The clear width of footways on Warwick Road is compromised by street furniture including guardrailing and signposts around Earls Court station.
6.4.18 Lillie Road has a 1.25m wide pinch point on the southern footway approximately 50m east of its junction with North End Road, as a result of street furniture.
6.4.19 The existing footway on the north side of Lillie Bridge is 1.9m wide, but the clear width is further reduced to only 1.3m due to the pedestrian guardrail and signal pole for the pedestrian crossing.
6.4.20 The North End Road footways are occasionally restricted by street furniture and crossovers. The most significant reduction in width occurs on the eastern footway just south of West Kensington station, with a pinch point of 1.5m along the frontage of shop premises. The junction of Thaxton Road and North End Road has a large bell-mouth junction where pedestrians must either cross the carriageway at the widest point of the junction or else deviate from their desire line along the North End Road footway in order to cross at a narrower point along Thaxton Road.
Crossings
6.4.21 All crossings were classed as ‘positive’ overall, meaning that the individual components each had a score between 0 and 3. However, even ‘positive’ crossings could still be improved to a higher standard so as to improve the pedestrian environment and public realm.
6.4.22 Generally, the arrangement of crossings on the strategic road corridors is to support the movement of vehicular traffic rather than to provide a high quality pedestrian environment. An example of this is the Warwick Road junction with the A4 where a dedicated left turn slip is provided from Warwick Road into the A4. This

Application 2 Transport Assessment 47
arrangement provides additional highway capacity but requires pedestrians to cross in two stages and wait on a pedestrian refuge island.
6.4.23 There are a number of crossings on the A4 West Cromwell Road where guardrailing constrains the movement of pedestrians. These are labelled C40 and C53 on the A4/ Warwick Road junction plus C52 and C56 at the A4 / North End Road junction.
6.4.24 The pedestrian crossing across Old Brompton Road / Lillie Road (C60) close to West Brompton station lacks pedestrian storage capacity on the northern footway.
6.4.25 Other crossings which are considered to contribute to a poor public realm are at the junction of North End Road and Lillie Road (C60, C28 and C29) where the configuration of junction in association with the pedestrian guard railing results in significant deviation from pedestrian desire lines.
6.4.26 While the existing pedestrian crossings are adequate, these cause delay to pedestrians due to their crossing movements being staggered over two or three stages, with pedestrians having to wait on pedestrian refuge islands.
6.4.27 During the audit it was also noted that the surfacing of the crossing across the A4 West Cromwell Road to the west of its junction with Warwick Road is suffering from cracks and poor reinstatements in places which could represent potential trip hazards to pedestrians.
6.4.28 Provision for sensory and mobility impaired users is lacking at key strategic locations, and the deficiencies are summarised for each parameter in Table 6.1.
Table 6.1 Provision for sensory and mobility impaired users
Street Request
Box Tactile
Info Audible
Info Rotating Cones
Redcliffe Gardens – north of Fulham Road
x x
Earls Court Road – north of Earls Court Road / Bramham Gardens / Earls Court Square junction
x x
Fulham Road – east of Finborough Road
x x
Old Brompton Road / Warwick Road x x x
Hammersmith Road / North End Road x x
Hammersmith Road / east of North End Road
x x
Lillie Road (Lillie Road Bridge) x x
Warwick Road x
6.5 PEDESTRIAN AND CYCLIST SAFETY
6.5.1 Figure 6.6 shows the distribution of pedestrian accidents around the site.

Application 2 Transport Assessment 48
6.5.2 When comparing Warwick Road and North End Road, the latter has more pedestrian accidents despite having lower traffic flows. These North End Road pedestrian accidents have been discussed in section 4.4 and it is therefore important that any highway improvements along North End Road should aim to improve pedestrian safety.
6.5.3 Figure 6.7 shows the distribution of cyclist accidents around the site.
6.5.4 When comparing Lillie Road / Old Brompton Road with North End Road, the latter has a similar number of cyclist accidents despite having lower cyclist flows. These North End Road cyclist pedestrian accidents have also been discussed in section 4.4 and it is therefore important that any highway improvements along North End Road should aim to improve cyclist crossing facilities, lighting and safety.

Application 2 Transport Assessment 49
7 Trip Generation
7.1 INTRODUCTION
7.1.1 The forecast travel demand associated with the Development is set out in this section. The forecast travel demand has been generated through the use of a spreadsheet based Trip Generation Model and has been agreed with the Boroughs and TfL. This section also sets out the approach to forecasting travel demand. The Trip Generation Model is included in Appendix L.
7.2 PERSON TRIP GENERATION BY LAND USE
7.2.1 Person trips for the individual land uses have been derived using the TRAVL database version 8.12. 08:00 - 09:00 and 17:30 - 18:30 have been established as the overall peak hours for trip generation.
7.2.2 In order to identify appropriate sites from which person trips can be established, a set of appropriate criteria has been applied to the selection process and this is also set out below by land use.
Residential 7.2.3 The selection of comparable sites from TRAVL for the proposed residential use was based on the following criteria:
PTAL 3 to 6
> 100 units per site
Inner London location
< 5 years old
7.2.4 The resulting sites are:
Discovery Dock, Tower Hamlets
Stanley Close, Greenwich
Riverside West, Wandsworth - Private and Affordable Units;
Chelsea Bridge Wharf, Wandsworth
Battersea Reach - Private Units only
St George Wharf - Private and Affordable Units.
7.2.5 All sites were surveyed in 2009, with the exception of Discovery Wharf (2008). The resulting average total person trip rates are shown in Table 7.1
Table 7.1 Residential Person Trip Rates
AM Peak (0800 – 0900) PM Peak (1730– 1830)
In Out Total In Out Total
0.12 0.49 0.61 0.33 0.17 0.50
Businesss 7.2.6 To derive person trips for the Business elements of the scheme, TRAVL database trip rates by employee have been used to enable validation against the ECTS outputs.

Application 2 Transport Assessment 50
7.2.7 The average employment density range is taken to be one job per 15 sqm (GEA) which is consistent with agreed figures within the ECTS. The HCA Employment Density Guide 2nd Edition 2010 sets the density of commercial Net Internal Area, which equates to 15 m² of GEA.
7.2.8 The selection of comparable sites from TRAVL was based on the following criteria:
PTAL 3 to 6
All London locations (Inner London alone yielded only one site)
< 10 years old (a 5 year limit resulted in no TRAVL sites being available)
>100 employees.
7.2.9 TRAVL provided the following B1 Business sites:
Association of London Government, Southwark
Baltic Exchange, City of London
Buckingham Palace Road (TfL Business), Westminster
Chiswick Park, Hounslow
Eccleston Place (TfL Business), Westminster
Highbury House Communications, Islington
Marks and Spencer Headquarters, Westminster
Windsor House (TfL Business), Westminster
7.2.10 The resulting Business person trip rates by employee are summarised in Table 7.2.
Table 7.2: Business Person Trip Rates (per employee)
AM Peak (0800 – 0900) PM Peak (1730 – 1830)
In Out Total In Out Total
0.40 0.03 0.43 0.03 0.37 0.40
Education 7.2.11 TRAVL data for these uses is organised into four categories (Day Nurseries, Health Service, Non-Residential School and Other). The Non-Residential School category was interrogated using the following criteria:
PTAL 3 to 6
All London locations (Inner London alone yielded only two sites)
< 10 years old (a 5 year limit resulted in no TRAVL sites being available)
7.2.12 This selection provided the following sites:
Kensington & Chelsea College, RBKC
Kingston College, Kingston upon Thames
Aylward School, Enfield
Wembley Manor Primary School, Brent
7.2.13 The resulting average total person trip rate proposed for the education and other social / local community facilities is shown in Table 7.3.

Application 2 Transport Assessment 51
Table 7.3: Education Facilities Person Trip Rates (per 100sqm)
AM Peak (0800 – 0900) PM Peak (1730 – 1830)
In Out Total In Out Total
6.25 0.87 7.12 0.96 0.86 1.82
Hotels 7.2.14 Advice from King Sturge foresees the development accommodating a mix of hotel types ranging from budget to upmarket. Hotel sites were selected from TRAVL based on the following criteria:
PTAL 3 to 6
All London locations (Inner London alone yielded only two sites)
< 5 years old
7.2.15 The selected sites were:
Carlton Mitre Hotel, Kingston upon Thames
Express Holiday Inn, Camden
Holiday Inn, Newham
Park Plaza County Hall Hotel, Lambeth
St Giles Hotel, Hounslow
Thistle Victoria Hotel, Westminster
7.2.16 Since the split of budget and upmarket rooms is not yet known, the trip rates for the six sites have been averaged. The resulting average person trip rates are shown in Table 7.4.
Table 7.4: Hotel Person Trip Rates (per bedroom)
AM Peak (0800 – 0900) PM Peak (1730 - 1830)
In Out Total In Out Total
0.19 0.40 0.59 0.41 0.31 0.72
Leisure Uses 7.2.17 The Leisure land uses will generally provide local facilities are described as catering for the adjacent new and existing communities, and are therefore likely to generate only secondary and walk-in trips. However, their trip generation has been assessed using the following parameters:
PTAL 3 to 6
Inner London locations
< 5 years old
7.2.18 The selected sites were:
East Dulwich Leisure Centre, Southwark
Surrey Docks Watersport Centre, Southwark
Virgin Active, Wandsworth
7.2.19 The resulting average person trip rates are shown in Table 7.5.

Application 2 Transport Assessment 52
Table 7.5: Leisure Person Trip Rates (per 100sqm)
AM Peak (0800– 0900) PM Peak (1730 - 1830)
In Out Total In Out Total
0.79 0.42 1.21 2.27 1.79 4.06
Cultural Uses 7.2.20 The Cultural land uses will most likely attract people from further afield. The following TRAVL criteria have been used to establish an all mode person trip for these land uses:
PTAL 3 to 6
All London locations (Inner London alone yielded no sites)
< 10 years old (there are no surveys under 5 years old)
7.2.21 The selected and agreed sites were:
Guildhall Art Gallery, City of London
Vestry House Museum, Waltham Forest
William Morris Museum, Waltham Forest
7.2.22 The resulting average person trip rates are shown in Table 7.6. It is apparent that there are no peak hour trips associated with these land uses.
Table 7.6: Culture Person Trip Rates (per 100sqm)
AM Peak (0800– 0900) PM Peak (1730 - 1830)
In Out Total In Out Total
0.00 0.00 0.00 0.00 0.00 0.00
Medical Uses 7.2.23 The Medical land uses have been assessed using the following parameters:
PTAL 3 to 6
All London locations (Inner London alone yielded no sites)
< 5 years old
7.2.24 The selected sites were:
Hounslow Primary Care Trust Heart of Hounslow Health Centre Surrey
NHS Walk-in Centre, Bishopsgate, City of London
7.2.25 The resulting average person trip rates are shown in Table 7.7.
Table 7.7: Medical Person Trip Rates (per 100sqm)
AM Peak (0800-0900) PM Peak (1730-1830)
In Out Total In Out Total
0.63 0.42 1.06 0.81 0.77 1.58
Retail 7.2.26 The Retail land uses will provide a mix of mainly local shops, restaurants/cafes and a larger foodstore for the new development and existing communities. Limited short-stay parking will be provided. The following criteria have been used to establish an all mode person trip for these land uses:
PTAL 3 to 6

Application 2 Transport Assessment 53
Inner London locations
< 5 years old
Mixture of different retail types within a defined centre so that an overall trip rates can be derived (as opposed to individual “front door” rates for the individual units)
7.2.27 One site met these criteria:
Southside Shopping Centre, Wandsworth
7.2.28 It is acknowledged that the form of retail at this site is dis-similar to the proposed development but in order to derive person trips from overall mixed high street shopping facilities, it is considered that the site will offer a good proxy. The resulting average person trip rates are shown in Table 7.8.
Table 7.8: Retail Person Trip Rates (per 100sqm)
AM Peak (0800-0900) PM Peak (1730-1830)
In Out Total In Out Total
1.09 0.60 1.69 1.98 2.72 4.70
All Land Uses 7.2.29 The person trip rates for all land uses are summarised in Table 7.9 below.
Table 7.9: Person Trip Rates by Land Use
Land Use AM Peak (0800-0900) PM Peak (1730-1830)
In Out Total In Out Total
Residential (per unit) 0.12 0.49 0.61 0.33 0.17 0.50
Business (per employee) 0.40 0.03 0.43 0.03 0.37 0.40
Education Facilities (per 100m²)
6.25 0.87 7.12 0.96 0.86 1.82
Hotel (per bedroom) 0.19 0.40 0.59 0.41 0.31 0.72
Leisure (per 100m²) 0.79 0.42 1.21 2.27 1.79 4.06
Culture (per 100m²) 0.00 0.00 0.00 0.00 0.00 0.00
Medical (per 100m²) 0.63 0.42 1.06 0.81 0.77 1.58
Retail (per 100m²) 1.09 0.60 1.69 1.98 2.72 4.70
7.3 DEVELOPMENT TRIP FORECASTS
7.3.1 The Site Wide Development Option comprises:
6,775 Residential units;
97,833 m² of Commercial floorspace
17,327 m² of Education/ Community/ Culture
16,319 m² or 326 room hotels
14,500 m² of Leisure uses
10,578 m² of Medical land uses
26,732 m² of Retail land uses.
7.3.2 The application of the person trip rates previously agreed with TfL for all land uses to the total development proposals shown above provides the gross

Application 2 Transport Assessment 54
number of person trips associated with the proposed development. It should be noted that this calculation at this stage takes no account of existing trips, internal or linked trips. Specific adjustments are made in sections 7.4 and 7.5. Throughout this section of the report, these trips are presented as rounded numbers and therefore when adding column totals the result may not present the exact sum.1
Table 7.10: Person Trips by Land Use (Completed Development)
Land Use AM Peak (0800-0900) PM Peak (1730-1830)
In Out 2-way In Out 2-way
Residential 811 3309 4120 2213 1176 3389
Business 2616 178 2794 218 2395 2613
Education Facilities 188 26 214 29 26 55
Hotel 62 130 192 135 101 236
Leisure 114 61 175 329 260 589
Culture 0 0 0 0 0 0
Medical 67 45 112 86 81 167
Retail 292 159 451 530 728 1258
Total 4149 3908 8056 3540 4766 8306
7.4 TRIP ADJUSTMENTS AND MODE SHARE
7.4.1 All person trips have been disaggregated by journey purpose. Journey Purpose data has been sourced from the London Travel Demand Survey (LTDS) 2006. This survey provides a temporal analysis on the journey purposes throughout the day in London that have a residential trip end.
7.4.2 The 08:00 to 09:00 and 17:30 to 18:30 time periods have been identified as the development peak periods, and the journey purposes relating to these time periods have been applied to the appropriate person trips. For the other land uses which could be considered as destinations within the site, it is assumed for calculation purposes that all trips made during the AM and PM peak hour would have a residential trip end. It is however acknowledged that some trips will just be between non-residential land uses (e.g. retail from work) and not involve a residential trip end although this does not affect total trip numbers, nor have a material impact on the results.
7.4.3 The following journey purposes have been utilised for the development of the trip generation model for the Site Wide Development Option.
Residential to work
Residential to leisure/ shopping/ personal
Residential to Education Primary (incl. escort)
Residential to Education Secondary
Residential to Employers Business
Business from home
Employers Business
Education from Home- Primary
1 The rounding of numbers for presentational purposes has been used throughout this document

Application 2 Transport Assessment 55
Hotels
Leisure from home
Culture from home
Medical from Home
Retail from home
7.4.4 The application of these assumed journey purpose splits to the total person trips allows additional adjustments to be made to account for internalisation.
7.4.5 The Site Wide Development Option is a comprehensive masterplan with a significant potential to provide for a range of complimentary land uses within the masterplan to negate the need for people to travel longer distances by modes other than by foot or cycle with the regeneration of the site being based around attractive and accessible public realm that encourages movement on foot and makes pedestrians feel safe and secure.
7.4.6 As part of the travel demand exercises undertaken by WSP it is estimated that a percentage of total journeys will be undertaken within the site boundaries and will not therefore impact upon the wider transport networks. The adjustments to each of the journey purposes to account for this potential is set out in Table 7.11. The standard definition used to qualify a trip as internal is:
Internal trips begin and end within the development. These trips form part of the total development trip generation but do not use the external transport networks.
Table 7.11: Internal Trip Adjustments Journey Purpose (JP) Adjustment Reason
Residential to work No adjustment
Assumed all employment will be off site
Residential to leisure/ shopping/ personal
20% reduction
Adjusted to account for internal retail trips.
Residential to Education Primary (incl. escort)
25% reduction
School provided on site and assumed that 25% of primary education trips will be made internally.
Residential to Education Secondary
No adjustment
Assumed all school trips will be off site
Residential to Employers Business
No adjustment
Assumed all employment will be off site
Business from home No adjustment
Assumed all employment will be off site
Employers Business No adjustment
Assumed that all employees will be from off site
Education from Home- Primary
25% reduction
School provided on site - assumed that 25% of education trips will be generated internally.
Hotels No adjustment
All hotel demand will be generated externally
Leisure 65% reduction
Facilities for new residents and employees. therefore 65% internal trips have been assumed
Culture from home No adjustment
All cultural uses to generate demand externally
Medical from Home 35% reduction
Medical uses assumed to be for new residents - 35% of trips are considered to be internal.
Retail from home 0.2¹ 0.6² 15% convenience and 43% A3 to A5 uses. 80% of these trips are considered to be internal. 40% of comparison trips assumed to be internal.
¹ Convenience ² Comparison
7.4.7 The application of adjustments set out in Table 7.11 to the person trips is set out in Table 7.12.

Application 2 Transport Assessment 56
Table 7.12: Person Trips by Journey Purpose Adjusted for Internalisation
Land Use AM Peak (0800-0900) PM Peak (1730-1830)
In Out 2-way In Out 2-way
Residential to work 353 1441 1794 948 503 1451
Residential to leisure/ shopping/ personal
44 178 221 629 334 963
Residential to Education Primary (incl. escort)
169 691 860 73 39 112
Residential to Education Secondary
85 345 430 37 19 56
Residential to Employers Business
93 380 473 345 183 528
Business from home 2070 141 2211 160 1756 1916
Employers Business 546 37 583 58 639 697
Education from Home- Primary
141 20 160 22 19 41
Hotels 62 130 192 135 101 236
Leisure from Home 40 21 61 115 91 206
Culture from home 0 0 0 0 0 0
Medical from Home 44 29 73 56 53 109
Retail from home 107 59 166 195 268 463
Total 3752 3471 7223 2772 4006 6778
7.4.8 The adjusted person trips have then been further disaggregated by main mode which is set out below in Table 7.13 for the journey purposes considered.
Table 7.13: Main Mode Share by Journey Purpose Journey Purpose
Mode Main Mode Share Source
Residential to work
Underground 57.2%
Sourced from travel to work census data- residents for the North End and Earls Court Wards
Train 3.8% Bus, minibus or coach 5.4% Taxi or minicab 0.5% Driving a car or van 14.0% Passenger in car or van 0.7% Motorcycle 2.0% Bicycle 3.5% On foot 12.1% Other 0.8%
Residential to leisure/
shopping
Underground 4.5%
Mode share calculated from LATS 2001 Tables B10 & B11
Train 2.0% Bus, minibus or coach 12.0% Taxi or minicab 2.0% Driving a car or van 25.5% Passenger in car or van 15.5% Motorcycle 0.5% Bicycle 1.5% On foot 36.5% Other 0.0%

Application 2 Transport Assessment 57
Table 7.13: Main Mode Share by Journey Purpose cont.
Residential to Education - PRIMARY
Underground 1.3% Sourced from LBHF and RBKC School Travel Plan Data. Car pax includes car, park & walk, and car share
Train 0.7% Bus, minibus or coach 8.6% Taxi or minicab 0.0% Driving a car or van 8.9% Passenger in car or van 17.9% Motorcycle 0.0% Bicycle 11.5% On foot 51.1% Other 0.0%
Residential to Education -
SECONDARY
Underground 12.6% Sourced from LBHF and RBKC School Travel Plan Data. Car pax includes car, park & walk, and car share
Train 6.3% Bus, minibus or coach 44.6% Taxi or minicab 0.0% Driving a car or van 3.9% Passenger in car or van 7.8% Motorcycle 0.0% Bicycle 5.5% On foot 19.2% Other 0.0%
Residential to Employers Business
Underground 57.2%
Sourced from travel to work census data- residents for the North End and Earls Court Wards
Train 3.8% Bus, minibus or coach 5.4% Taxi or minicab 0.5% Driving a car or van 14.0% Passenger in car or van 0.7% Motorcycle 2.0% Bicycle 3.5% On foot 12.1% Other 0.8%
Business from home
Underground 45.4% Sourced from travel to work census data-day time population for North End and Earls Court Ward
Train 20.0% Bus, minibus or coach 7.6% Taxi or minicab 0.3% Driving a car or van 4.7% Passenger in car or van 2.3% Motorcycle 1.9% Bicycle 2.9% On foot 13.4% Other 1.6%
Employers Business
Underground 8.9%
Mode share for purpose derived from TRAVL sites utilised for trip rates
Train 2.8% Bus, minibus or coach 4.5% Taxi or minicab 11.5% Driving a car or van 3.6% Passenger in car or van 0.8% Motorcycle 0.0% Bicycle 0.0% On foot 67.9% Other 0.0%
Education from Home - PRIMARY
Underground 1.3% Sourced from LBHF and RBKC School Travel Plan Data. Car pax includes car, park & walk, and car share
Train 0.7% Bus, minibus or coach 8.6% Taxi or minicab 0.0% Driving a car or van 8.9% Passenger in car or van 17.9% Motorcycle 0.0% Bicycle 11.5% On foot 51.1% Other 0.0%

Application 2 Transport Assessment 58
Table 7.13: Main Mode Share by Journey Purpose cont.
Hotels
Underground 17.8%
Mode share derived from TRAVL sites utilised for trip rates
Train 18.9% Bus, minibus or coach 14.9% Taxi or minicab 12.3% Driving a car or van 16.4% Passenger in car or van 3.2% Motorcycle 0.3% Bicycle 0.2% On foot 16.1% Other 0.0%
Leisure from home
Underground 6.0%
Mode share taken from LATS 2001 Table B10
Train 3.0% Bus, minibus or coach 9.0% Taxi or minicab 3.0% Driving a car or van 25.0% Passenger in car or van 19.0% Motorcycle 0.0% Bicycle 2.0% On foot 33.0% Other 0.0%
Culture from Home
Underground 6.0%
Mode share taken from LATS 2001 Table B10
Train 3.0% Bus, minibus or coach 9.0% Taxi or minicab 3.0% Driving a car or van 25.0% Passenger in car or van 19.0% Motorcycle 0.0% Bicycle 2.0% On foot 33.0% Other 0.0%
Medical from Home
Underground 0.8%
Mode share derived from TRAVL sites utilised for trip rates
Train 0.0% Bus, minibus or coach 12.5% Taxi or minicab 0.0% Driving a car or van 42.1% Passenger in car or van 11.7% Motorcycle 0.1% Bicycle 0.4% On foot 32.3% Other 0.0%
Retail from home
Underground 3.0%
Mode share taken from LATS 2001 Table B11
Train 1.0% Bus, minibus or coach 15.0% Taxi or minicab 1.0% Driving a car or van 26.0% Passenger in car or van 12.0% Motorcycle 0.5% Bicycle 1.0% On foot 40.0% Other 0.5%
7.4.9 It is acknowledged that as part of the first or final journey stage public transport trips will be walk trips and will be assessed accordingly as part of the technical assessments. It is not considered appropriate to redistribute these trips onto other modes given the proximity of bus stops and rail stations on the edge of the site.
7.4.10 The application of the mode share data provides the forecast total trips shown in Table 7.14 by main mode.

Application 2 Transport Assessment 59
Table 7.14: Forecast Trips by Main Mode
Mode AM Peak PM Peak
In Out 2 way In Out 2 way Underground 1277 1195 2472 888 1297 2185 Train 467 155 622 129 427 556 Bus, minibus or coach 309 380 689 251 322 573 Public Transport 2054 1729 3783 1268 2046 3314 Taxi or minicab 82 34 116 48 106 154 Driving a car or van 288 440 728 487 424 911 Passenger in car / van 151 217 368 187 173 360 Motorcycle 49 42 90 34 50 84 Bicycle 119 172 292 77 93 170 On Foot 973 819 1792 658 1078 1736 Other 37 17 55 14 35 49 Total 3752 3471 7224 2772 4006 6778
7.4.11 From Table 7.14 it is apparent that that the majority of the trips made to and from the site will be by public transport. Car driver trips make up some 10% to 13% in the AM and PM peaks respectively. It should be noted that the comparatively high car passenger numbers relate to the primary education and retail journey purposes which see high car occupancy rates.
7.5 EXISTING PERSON TRIPS
7.5.1 The existing on site trip generating land uses that relate to the Site Wide Development Option are as follows:
120 Jobs (Earls Court Exhibition Centre)
100 Jobs (Clear Channel Business, Cluny Mews)
900 employees (TfL Depot and Ashfield House)
150 employees (Mannequin Factory)
869 m² Doctors Surgery
702 Residential Units (West Kensington and Gibbs Green Estates)
7.5.2 In order to capture the peak hour demand associated with these land uses, a number of gate surveys have previously been undertaken for vehicular traffic on a non-event day. It was deemed important to ensure existing traffic conditions were typical and therefore large events were avoided. This approach ensures that comparisons between forecast demand and existing demand are robust.
7.5.3 The vehicular Gate Surveys were undertaken in January 2008 by Capita Symonds. The surveys were undertaken by video and were undertaken over a three week period. The Gates that relate to the Site Wide Option are as follows:
Lillie Road Gate
Brompton Gate
Warwick Gate
7.5.4 In addition to the Gate Surveys, vehicular surveys for the streets into and out of the development site were also surveyed to ensure that the other land uses not related to the Exhibition Centres are also captured. These surveys were undertaken by Count on Us on 14 October 2008 and these streets are as follows:
Beaumont Avenue
Mund Street; and
Thaxton Road

Application 2 Transport Assessment 60
7.5.5 A summary of these vehicular surveys undertaken on a non-event day are set out below in Table 7.15. The surveyed data provides vehicle numbers only and therefore any other existing trips by other modes which would relate to existing employees and residents have had to have been calculated separately. For ease of calculation, transparency and consistency with the approach used by LTS within the ECTS, the same method to calculate existing trips as has been used to calculate the forecast trips whereby the net change in residential unit numbers and employment numbers has been used to establish the incremental travel demand.
Table 7.15: Site Wide Scenario Existing Trips (Surveyed and Calculated)
Gate AM Peak PM Peak
IN OUT 2-way IN OUT 2-way Underground 170 124 293 91 166 257 Train 64 14 78 12 56 68 Bus, minibus or coach 35 37 72 20 34 54 Public Transport 269 175 443 123 256 379 Taxi or minicab 12 2 14 3 15 18 Driving car/ van (PCU) 200 128 328 113 208 321 Passenger in car / van 13 21 33 14 14 28 Motorcycle 6 4 11 3 6 9 Bicycle 13 18 30 7 11 18 On Foot 125 81 207 56 136 192 Other 5 2 7 1 5 6 Total 644 431 1072 321 651 972
Driving a car or van trips are based on gate or junction surveys 7.6 NET ADDITIONAL TRIPS
7.6.1 The difference between the trips shown in Table 7.14 and 7.15 are the net additional demand that will be on the transport networks in the area and these trips are set out below in Table 7.16 below. These trips are to be used for impact testing.
Table 7.16: Site Wide Development Option Net Additional Trips by Mode
Gate AM Peak PM Peak
IN OUT 2-way IN OUT 2-way Underground 1107 1071 2178 797 1131 1928 Train 404 140 544 118 371 489 Bus, minibus or coach 274 344 617 230 288 519 Public Transport 1785 1555 3339 1145 1790 2935 Taxi or minicab 69 32 101 45 91 136 Driving car/ van (PCU) 86 311 408 372 215 587 Passenger in car / van 138 196 335 173 159 332 Motorcycle 42 37 79 31 44 74 Bicycle 107 155 261 69 82 151 On Foot 848 738 1586 602 942 1544 Other 32 15 48 13 30 43 Total 3108 3039 6159 2448 3354 5802

Application 2 Transport Assessment 61
7.7 SERVICING
7.7.1 Additional to the travel demand generated by new residents and workers within the development, account needs to be taken of the servicing trips that are likely to occur during the AM and PM peak hours and the summary trips relating to LGV and HGV vehicle types are shown in Table 7.17.
Table 7.17: Peak Hour Servicing trips
Mode AM Peak PM Peak
In Out 2 way In Out 2 way LGV 28 26 54 9 10 19 HGV 14 13 28 4 4 8 Total 42 39 81 13 14 26
7.7.2 These trips will also be included in any highway impact modelling to ensure that the full operational demands of the Development are assessed.

Application 2 Transport Assessment 62
8 Demolition & Construction
8.1 INTRODUCTION
8.1.1 A detailed analysis of the demolition and construction phases has been undertaken by Mace and Sir Robert McAlpine (SRM) as part of the Environmental Statement construction chapter to provide a basis for assessing the potential impact on the highway network. The analysis includes the indicative demolition and construction programme, predicted construction traffic flows, vehicle routing and access gate locations.
8.1.2 At an early stage in the construction planning process, analyses were undertaken to investigate the feasibility of using rail and water routes during the demolition and construction phases, in line with the London Freight Plan’s aims of reducing dependence on heavy road vehicles. These reports are attached as Appendix M. An initial desktop study by Mace of water options and Halcrow’s examination of rail options established at an early stage that these would not have potential.
8.2 POTENTIAL USE OF RAIL
8.2.1 The use of Rail Freight was initially investigated by Halcrow and the resulting report issued in May 2011 (Appendix M) concluded that Rail Freight was not viable due to a number of key constraints including;
The stabling feasibility would need to be relocated off-site
A 2-3 year lead-in would be required to establish a Rail Freight terminal within the existing deport site
Three HGV loads by road would be saved per hour, based on the full development option (RBKC + LBHF)
Train paths would be restricted to two paths during Engineering Hours and that traffic hours are unavailable for Rail Freight
8.2.2 During recent discussions between the Applicant, TfL and LUL, it became apparent that a number of assumptions made in the May 2011 Halcrow report warranted further assessment, the results of the additional outline feasibility study are as follows;
Rail Freight train paths from Ruislip to Lillie Bridge depot are available during the day
Route approval for the use of 60T Network Rail ‘Falcon’ wagons has been obtained from LUL (See Appendix M)
The use of Lillie Bridge depot for Rail Freight operations requires a six month lead-in
The current anticipated sequencing of demolition and site wide (RBKC + LBHF) construction works provides the potential for the introduction of Rail Freight services for removal of waste and delivery of construction materials over an estimated 12 year period
Although the development would need to retain road freight operations, there may be potential to reduce the use of road freight by an estimated 350 vehicles per month

Application 2 Transport Assessment 63
8.2.3 Further work is being undertaken by EC Properties Limited, Mace, Halcrow, ECH, WSP, Keltbray and TfL/LUL to;
Investigate whether wagons can be located within the development site to prevent ‘double’ handling
Confirm LUL/Network Rail operations can provide the required service capacity/frequency
Confirm the Supply Chain from collection to licensed disposal and loading terminal to site delivery point
Confirm volumes/cost & viability
Review management/contractual arrangements
8.2.4 In summary, recent outline feasibility analysis indicates that there may be potential to introduce a rail freight service (via Lillie Bridge depot) for the removal of waste and delivery of construction materials in connection with development of the site wide scheme.
8.2.5 For the avoidance of doubt, the TA considers road freight volumes in relation to demolition/construction and at present takes no account of potential use of rail freight, thereby presenting a ‘worst case’ scenario.
8.3 POTENTIAL USE OF WATER
8.3.1 A further possibility for complementary removal of waste and delivery of construction material is water, via the existing Blue Ribbon network of inland waterways and canals.
8.3.2 Mace noted that the movement of materials by water could be a cost effective solution only for certain commodities such as aggregates, waste and recyclables, depending on:
the supply chain characteristics of the commodity;
the location of commodity sources and destinations;
infrastructure at transfer points;
the economic viability of moving by water to other modes; and
barge technology, dwell times and availability of transfer equipment.
8.3.3 Mace found that, whilst it could be a cost effective solution for future waste management by the waste authorities, the Blue Ribbon network is too far from the site (1.7 miles by road to the south and 3.7 miles by road to the north) for use during the construction phase. This meant that road transport would still be required. As a large part of road haulage costs are in the loading and unloading times, such double handling of materials is inefficient in terms of both time and energy. There are insufficient local docking points at the closest parts of the Blue Ribbon network and upgrading could be required at these docking points. In addition, water transport has tidal limitations, especially around the River Thames area with its large tidal range of 7 metres. Mace’s overall conclusion was that using the Blue Ribbon Network during the construction period did not make sense environmentally, commercially, and logistically.
8.4 DEMOLITION & CONSTRUCTION PHASING
8.4.1 The demolition and construction activities for the Site Wide Development Option have been planned for implementation in six key phases (Figure 8.2), and a 19 year programme for overall completion is anticipated to commence in July 2013. There are potential overlaps across the development phases meaning that
Application 2 Transport Assessment 64
demolition and construction activities could occur across several of the phases at any point in time.
8.4.2 To assist with assessing the demolition and construction impacts, the 6 phases grouped into logical “Demolition and Construction Sequences” as follows;
Sequence 1 – Phases 1, 2 & 3 which equates to a six year time period;
Sequence 2 – The remainder of Phases 1, 2 & 3 plus Phases 4 & 5, equates to a six year time period
Sequence 3 – The remainder of Phase 5 and Phase 6, which equates to a seven year time period.
8.5 SITE TRAFFIC ACCESS & EGRESS
8.5.1 The initial activities will include establishing secure access points with wheel cleaning facilities and access controls. Discussions will be held with RBKC, LBHF and TfL to agree approach routes to the site and the access locations. Following these discussions, detailed logistics plans will be developed as part of the Construction Environmental Management Plan. Meanwhile, the principles of construction access and management are set out in the Framework Construction Logistics Plan (Appendix N).
8.5.2 The options to access the demolition site include use of a new road in the areas of the site associated with the previously consented Northern Access Road. This new road would connect the existing Earls Court Exhibition Centre podium with Fenelon Place via the existing 100 West Cromwell Road basement coach park (Gate 1 on Figure 8.1). Other entrances can be provided at West Brompton (Gate 2) and Warwick Road (Gate 3).
8.5.3 Initial analysis of the local routes for construction & demolition traffic shows that the A4 and the A40 to the north of the site would be the most suitable routes for the vast majority of vehicle movements. The approach to and egress from Gate 1 would be via the A4 and Fenelon Place and the existing 100 West Cromwell Road basement coach park. This would provide a direct access from the north, avoiding the Earls Court One Way System and residential areas around the perimeter of the site.
8.5.4 Gate locations G1, G2 & G3 will be maintained throughout the construction programme. Subsequent site entrances will be provided at G4 and G6 on North End Rd and G5 on Lillie Rd. The final access point G7 will be formed at the new access location on the A4. G7 will form the second primary access point to complement G1. The current proposal is to establish the new proposed A4 junction within Sequence 1 to minimise the potential congestion on surrounding roads.
8.5.5 To further minimise the likelihood of congestion, strict monitoring and control of vehicles entering, egressing and travelling across the site will be maintained. Delivery schedules will be produced to regulate deliveries and eliminate bottlenecks. A holding area close to the Heathrow/A4 corridor will be used to control the number of construction vehicles coming into the Earls Court area and details of this provision will be provided.
8.5.6 During construction on the land currently occupied by Earls Court Two and of the new stabling facility on the Lillie Bridge depot, a temporary access to the depot via Beaumont Avenue will be required.
8.6 ROAD VEHICLE MOVEMENTS
8.6.1 The number of construction vehicles accessing the site during the programme has been calculated by Mace, based on the expected volumes of material to be removed during demolition and delivered during construction.

Application 2 Transport Assessment 65
8.6.2 In Sequence 1 it is forecast that vehicle movements would peak at 22 to 28 vehicle movements per hour (i.e. a delivery every 4 to 6 minutes) in years 5 and 6. It is anticipated that there would be three or four access gates in operation at this time, so their use would equate to a frequency of one movement every 12 to 18 minutes per access gate.
8.6.3 In Sequence 2 it is forecast that vehicle movements would peak at 37 vehicle movements per hour (i.e. a delivery every 3 minutes) in year 8. In this year it is anticipated that there would be two access gates in operation so their use would equate to a frequency of one movement every 6 minutes per gate.
8.6.4 In Sequence 3 it is forecast that vehicle movements would peak at 20 per hour (i.e. a delivery every 6 minutes) in year 13. Over this year it is anticipated that there would be one main access gate in operation.
8.6.5 In making these forecasts, MACE/SRM have given consideration to reducing the number of vehicle movements by:
the possible reuse of circa 28% of the crushed concrete produced during deconstruction of EC1 and EC2;
reuse of excavated material for filling (based on its suitability);
potential provision of an on-site soil hospital to remediate soil on site (the current extent of contamination and remediation required is unknown at this point);
potential provision of a mortar batching facility on site;
the use of reusable hoardings where they can be used in non-aesthetic locations; and
the potential for the use of prefabrication techniques and modern methods of construction where practical and viable to do so without compromising quality.
8.6.6 It is proposed that a construction stage Travel Plan will be devised. There will be a general policy of not providing any car parking on site and the site labour force will be encouraged to use public transport. Provision will be made for essential parking only and cycling will be encouraged with secure bicycle storage and shower facilities made available on site.

Application 2 Transport Assessment 66
9 Phased Trip Generation
9.1 INTRODUCTION
9.1.1 The forecast travel demand associated with the full Development is set out in Section 7. This section sets out the forecast travel demand over time and phase for the Site Wide Development Option. This is required to enable interim development and infrastructure triggers to be identified.
9.1.2 The interim travel demands have been derived using the Trip Generation Model and associated methodology set out in Section 7, and adjusted to reflect the quantum of occupied development at the following interim years, with the completed Phases identified from Figure 8.2 and programme included as Figure 8.3.
2017 - Part of Phase 1 and 2
2021 - Phase 1, 2 and Part of Phase 3
2025 - Phase 1, 2, 3,4 and Part of Phase 5
9.1.3 The Trip Generation Model for these interim years is included in Appendix L and the timeline for the Development is shown below:
9.2 DEVELOPMENT QUANTUM BY INTERIM YEAR
2017 Part of Phase 1 and 2 (Completions)
1,220 Residential units;
2,137 m² of Commercial floorspace
5,272 m² of Community/ Culture/ Leisure
7,381 m² or 148 room hotels
3,855 m² of Retail land uses.
2021 Phase 1, 2 and Part of Phase 3 (Completions)
3,115 Residential units

Application 2 Transport Assessment 67
20,253 m² of Commercial floorspace
3,019 m² of Education
12,727 m² of Community/ Culture/ Leisure
7,381 m² or 148 room hotels
16,026 m² of Retail land uses.
2025 Phase 1, 2, 3, 4 and Part of Phase 5 (Completions)
5,655 Residential units;
49,424 m² of Commercial floorspace
3,019 m² of Education
27,798 m² of Community/ Culture/ Leisure
16,319 m² or 326 room hotels
24,852 m² of Retail land uses.
9.3 DEVELOPMENT TRIP FORECASTS BY INTERIM YEAR
9.3.1 The application of the person trip rates previously agreed with TfL for all land uses provides the gross number of person trips associated with the proposed development by mode for each of the years considered. These are set out in Tables 9.1, 9.2 and 9.3 as cumulative totals.
9.3.2 As with the end state scenario, it is acknowledged that as part of the first or final journey stage public transport trips will be walk trips and will be assessed accordingly as part of the impact assessments.
9.3.3 Consistent mode shares have been adopted for each of the interim years, as presented in Section 7. The delivery of infrastructure and travel plan measures may affect mode share over time but for robustness the mode shares sourced from existing data have been utilised and no further mode shift adjustments have been made. Levels of internalisation have only been adjusted for 2017 where the levels of complimentary land uses are less and no educational uses are proposed at this stage. The adjusted internalisation factors are shown in the Trip Generation Spreadsheet Model contained in Appendix L.
9.3.4 As with Section 7, the trip totals throughout this section have been rounded for presentational purposes and as such any minor discrepancies relate only to this process.
Table 9.1: Forecast Trips by Main Mode – Interim Year 2017
Mode AM Peak PM Peak In Out 2 way In Out 2 way
Underground 77 212 288 155 104 259 Train 20 30 50 25 24 50 Bus, minibus or coach 28 75 104 51 38 89 Public Transport 124 317 442 232 167 398 Taxi or minicab 6 10 16 13 10 23 Driving a car or van 33 87 120 96 66 162 Passenger in car or van 17 47 64 38 27 64 Motorcycle 3 7 10 6 4 10 Bicycle 10 35 45 14 9 22 On Foot 68 167 235 123 98 221 Other 1 3 4 2 2 4 Total 262 674 936 523 383 906

Application 2 Transport Assessment 68
Table 9.2: Forecast Trips by Main Mode – Interim Year 2021
Mode AM Peak PM Peak In Out 2 way In Out 2 way
Underground 339 532 871 390 382 771 Train 107 64 171 51 104 155 Bus, minibus or coach 103 172 275 114 111 225 Public Transport 549 768 1317 555 596 1151 Taxi or minicab 20 15 35 21 29 50 Driving a car or van 106 198 304 220 170 390 Passenger in car or van 70 100 170 88 72 161 Motorcycle 13 18 31 15 15 30 Bicycle 48 79 128 36 31 67 On Foot 322 370 692 297 340 638 Other 9 7 16 6 9 15 Total 1137 1556 2693 1238 1264 2502
Table 9.3: Forecast Trips by Main Mode – Interim Year 2025
Mode AM Peak PM Peak In Out 2 way In Out 2 way
Underground 742 979 1721 720 805 1525 Train 251 124 375 102 239 341 Bus, minibus or coach 199 315 514 206 217 423 Public Transport 1193 1417 2610 1028 1261 2289 Taxi or minicab 47 30 77 41 65 106 Driving a car or van 194 360 554 395 313 708 Passenger in car or van 111 179 352 155 130 285 Motorcycle 28 34 62 28 31 59 Bicycle 82 143 225 63 61 124 On Foot 606 669 1274 530 683 1213 Other 20 14 34 11 20 31 Total 2281 2846 5127 2250 2564 4814
9.4 EXISTING TRIPS BY INTERIM YEAR
9.4.1 There are trips associated with the existing site which will no longer take place as the development is built out by phase. The existing trips on a phase by phase basis are contained in the Trip Generation Model (Appendix L) and summarised below for each interim year. When a construction phase is commenced, it is assumed that all existing trip will cease.
9.4.2 It should be noted that this approach does not take account of the trips that have been recorded into and out of the Seagrave Road Car Park which would no longer occur as result of the Exhibition Centres being closed. This can therefore be considered a robust basis for assessment. The redevelopment of this site for residential uses is considered to result in a nil-detriment impact to the highway network.
9.4.3 The associated existing development for each of the interim years is set out cumulatively:
2017
702 Residential units on Gibbs Green and West Kensington Estates;
120 jobs associated with exhibition centres
2021
702 Residential units;
120 jobs associated with exhibition centres
900 jobs associated with TfL Depot/ Ashfield House

Application 2 Transport Assessment 69
2025
702 Residential units;
120 jobs associated with exhibition centres
900 jobs associated with TfL Depot/ Ashfield House
150 jobs associated with the Mannequin factory
869 m² Doctors surgery
9.4.4 The associated forecast demand for the existing development for each of the interim years is set out in Tables 9.4, 9.5 and 9.6. As before and for consistency with the approach used by LTS within the ECTS, the method used to calculate the forecast trips has been used to calculate the existing trips so that the net change in residential unit numbers and employment numbers has been used to establish the incremental travel demand.
Table 9.4: Existing Trips by Main Mode – 2017
Mode AM Peak PM Peak In Out 2 way In Out 2 way
Underground 42 115 158 81 55 136 Train 9 11 20 7 9 16 Bus, minibus or coach 11 35 46 18 12 29 Public Transport 62 160 223 106 76 182 Taxi or minicab 2 1 3 2 2 4 Driving a car or van 124 96 220 75 134 209 Passenger in car or van 6 20 26 13 7 20 Motorcycle 2 4 6 3 2 5 Bicycle 5 17 22 7 4 11 On Foot 29 74 102 46 35 81 Other 1 2 3 1 1 2 Total 230 374 604 252 262 514
Table 9.5: Existing Trips by Main Mode – 2021
Mode AM Peak PM Peak In Out 2 way In Out 2 way
Underground 152 122 274 90 150 240 Train 56 14 70 11 50 61 Bus, minibus or coach 32 36 68 19 30 49 Public Transport 239 172 411 120 229 349 Taxi or minicab 11 2 13 3 13 16 Driving a car or van 171 117 288 90 183 273 Passenger in car or van 11 20 31 13 13 26 Motorcycle 6 4 10 3 6 9 Bicycle 12 18 29 7 10 17 On Foot 110 79 189 53 121 174 Other 4 2 6 1 4 5 Total 564 414 979 292 578 870

Application 2 Transport Assessment 70
Table 9.6: Forecast Trips by Main Mode – 2025
Mode AM Peak PM Peak In Out 2 way In Out 2 way
Underground 170 124 293 91 166 257 Train 64 14 78 12 56 68 Bus, minibus or coach 35 37 72 20 34 54 Public Transport 269 175 444 123 256 379 Taxi or minicab 12 2 14 3 15 18 Driving a car or van 193 128 321 115 209 324 Passenger in car or van 13 21 33 14 14 28 Motorcycle 6 4 10 3 6 9 Bicycle 13 18 30 7 11 18 On Foot 125 81 206 56 136 192 Other 5 2 7 1 5 6 Total 636 430 1066 323 652 975
9.5 NET TRIPS BY TEST YEAR AND PHASE
9.5.1 The removal of the trips relating to the existing uses from the forecast trips set out in Tables 9.1, 9.2 and 9.3 result in the net trips forecast to be on the transport networks. These are shown in Tables 9.7, 9.8 and 9.9.
Table 9.7: NET Forecast Trips by Main Mode – 2017
Mode AM Peak PM Peak In Out 2 way In Out 2 way
Underground 34 97 131 74 49 123 Train 11 20 30 18 15 34 Bus, minibus or coach 17 41 58 33 27 60 Public Transport 62 157 219 126 91 217 Taxi or minicab 4 9 13 10 8 19 Driving a car or van -91 -8 -100 21 -68 -47 Passenger in car or van 11 27 38 25 19 44 Motorcycle 1 3 4 3 2 5 Bicycle 5 18 23 7 4 11 On Foot 39 93 132 78 63 141 Other 1 1 2 1 1 2 Total 32 300 332 270 121 391
Table 9.8: NET Forecast Trips by Main Mode – Interim Year 2021
Mode AM Peak PM Peak In Out 2 way In Out 2 way
Underground 187 410 597 300 232 531 Train 51 50 101 40 54 94 Bus, minibus or coach 71 136 207 95 81 175 Public Transport 310 596 905 435 367 802 Taxi or minicab 9 13 22 18 16 34 Driving a car or van -66 81 15 130 -13 117 Passenger in car or van 59 80 139 75 60 135 Motorcycle 7 14 21 12 9 21 Bicycle 37 62 99 28 21 50 On Foot 212 291 503 244 220 464 Other 4 6 10 5 5 10 Total 572 1142 1714 946 686 1632

Application 2 Transport Assessment 71
Table 9.9: NET Forecast Trips by Main Mode – Interim Year 2025
Mode AM Peak PM Peak In Out 2 way In Out 2 way
Underground 573 855 1428 629 639 1268 Train 188 109 297 90 183 273 Bus, minibus or coach 164 278 442 186 184 369 Public Transport 924 1243 2166 905 1005 1910 Taxi or minicab 34 28 62 38 51 88 Driving a car or van 1 233 234 280 103 383 Passenger in car or van 99 159 257 141 116 257 Motorcycle 21 30 51 24 25 49 Bicycle 70 125 195 56 50 106 On Foot 481 588 1069 474 546 1020 Other 15 12 27 9 16 25 Total 1645 2416 4061 1927 1912 3839
9.5.2 Table 9.7 shows that the net traffic impact of the development in 2017 would be negative, as there would be fewer car trips generated within the Earls Court Site than in the present day due to the existing land uses no longer being operational.
9.5.3 Table 9.8 shows that by 2021, the net traffic impact of the development would be negligible in the AM peak and still low in the PM peak. The greatest volume of main mode trips is by public transport which will become walk trips as they access or egress the development.
9.5.4 By 2025, Table 9.9 shows a net traffic impact which is some 57% and 65% of the 2031 net totals for the AM and PM peaks respectively.
9.5.5 It is apparent from this exercise that the development phasing leads to a gradual change in traffic impact, with traffic generation from the Earls Court Site only returning to present day levels between 2017 and 2021.
9.6 SERVICING
9.6.1 As with the ‘end state’ forecasts there will be serving trips associated with these interim years considered. The forecast servicing trips which have been generated using the same methodology as for the end state are as follows in Tables 9.10 to 9.12. It is acknowledged that as the development is built out there will be economies of scale that can be used to reduced demand and impact. However, detailed account has not been taken of this potential for impact testing purposes (see Delivery and Servicing Plan in Appendix T) but the forecasts are therefore considered robust.
Table 9.10: 2017 Peak Hour Servicing trips
Mode AM Peak PM Peak In Out 2 way In Out 2 way
LGV 4 4 8 1 2 3 HGV 2 2 4 1 1 2 Total 6 6 12 2 3 5
Table 9.11: 2021 Peak Hour Servicing trips
Mode AM Peak PM Peak In Out 2 way In Out 2 way
LGV 12 11 23 4 5 9 HGV 5 4 9 2 2 4 Total 16 15 32 6 6 13

Application 2 Transport Assessment 72
Table 9.12: 2025 Peak Hour Servicing trips
Mode AM Peak PM Peak In Out 2 way In Out 2 way
LGV 21 20 41 7 8 15 HGV 10 9 19 4 3 7 Total 31 29 60 11 11 22
9.6.2 These trips will also be included in any highway impact modelling to ensure that the servicing demands are considered in conjunction with the operational demands of the Development by interim year are assessed.
9.7 CONSTRUCTION
9.7.1 In addition to the operational travel demands resulting from the occupation of the development on a phased basis, there will also be traffic associated the construction of the unoccupied phases of the development. The Demolition and Construction strategy is set out in detail in Section 8 of this report but the traffic estimates by phase are set out below in Tables 9.13 to 9.15.
Table 9.13: 2017 Hourly Construction Trips
Mode AM Peak PM Peak
In Out 2 way In Out 2 way HGV 11 11 22 11 11 22 Total 11 11 22 11 11 22
Table 9.14: 2021 Hourly Construction Trips
Mode AM Peak PM Peak
In Out 2 way In Out 2 way HGV 13 13 20 13 13 26 Total 13 13 26 13 13 26
Table 9.15: 2025 Hourly Construction Trips
Mode AM Peak PM Peak
In Out 2 way In Out 2 way HGV 11 11 22 11 11 22 Total 11 11 22 11 11 22
9.7.2 These trips have been included in the highway impact modelling to ensure that the construction demands are considered in conjunction with the operational demands of the Development.

Application 2 Transport Assessment 73
10 Impacts - Road Network
10.1 INTRODUCTION
10.1.1 The analysis of traffic generation in the years 2017, 2021, 2025 and 2031 has shown that the development phasing leads to a gradual change in traffic impact, with traffic generation from the Earls Court Site returning to present day levels between 2017 and 2021. Tables 7.16, 9.8 and 9.9 show that the number of car and van driver trips in the PM peak hour (the worst case) would increase by 266 vehicles from 2021 to 2025, and then by a further 204 trips from 2025 to 2031.
10.1.2 It was agreed during discussions with TfL and the Boroughs that the highway assessment should be conducted for intermediate stages during the construction of the development. It was agreed that a 2021 assessment should be provided, as 2021 is a standard LTS forecast year, and that any requirement for additional assessment years should be considered once the 2021 results were reviewed. The 2021 and 2031 development tests are considered to be worst case assessments. The 2021 test is undertaken prior to the delivery of the new junction onto the A4 whilst the 2031 development test considers the fully built out development and therefore has the highest volume of trips associated with the site.
10.1.3 Assessment in this section of the report relates to the 2021 Development Scenario and Scenario 1. Scenario 2 would result in a reduction in traffic and is not considered.
10.2 BACKGROUND GROWTH AND COMMITTED DEVELOPMENT
10.2.1 Background growth for all modes has been sourced from TfL’s LTS Version 6.2.2 land use and transport model. This methodology is in keeping with the approach adopted for the Earls Court Transport Study (ECTS) and is deemed the most appropriate source of background growth given the 20 year design horizon being considered in the assessment.
10.2.2 LTS is a strategic model, which includes all public transport and all strategically important roads in London. LTS is used in the appraisal of all major transport schemes currently being considered by TfL. The background growth forecast by LTS is incorporated into the Future Base Years used in this TA.
10.2.3 As described in section 1.9, a review has been undertaken of committed developments and schemes with resolutions to grant consent. The detail of this review is set out in Appendix E, confirming that the additional travel demand for all of the relevant schemes is already counted into the background growth forecasts.
10.2.4 LTS has no mechanism for peak period spreading and therefore no account is taken of people changing the timing of their journey to account for congestion. A method of addressing this limitation in the model has recently been developed by TfL for application in the context of LTS 2031 trip matrices. Discussions with TfL have indicated that an adjustment would be valid and realistic and therefore TfL have provided the methodology for use in this TA.
10.2.5 The term ‘peak spreading’ in this context is used to mean spreading outside the peak periods into the inter peak and the rest of the day. It does not refer to spreading from the peak hour in each peak into the shoulder peak hours.
10.2.6 Peak spreading has not been undertaken for development trips. In order to establish a robust basis for assessment, a development trip profile for the one-hour

Application 2 Transport Assessment 74
peak has been established through the use of TRAVL whereby appropriate sites have been examined and the two-way car profile for a peak hour has been derived.
10.2.7 To generate the future base models for 2021 and 2031 from the validated and approved 2009 Base, the background traffic growth from 2009 until 2021 and 2031 has been established using TfL’s strategic LTS model version 6.2.2. The highway growth forecasts were then extracted and input into to TfL’s highway assignment model CLoHAM to establish the baseline traffic patterns in the 2021 and 2031 Base cases (with no development on the Earls Court site).
10.2.8 Future year VISSIM matrices have then been created using a cordon for the relevant area. The difference between the CLoHAM 2008 Base Year and the VISSIM 2009 base year is balanced against the CLoHAM 2008 base year and the various future year scenarios in order to create the adjusted future year OD matrices for the VISSIM models. The background traffic growth forecast for the area for 2021 and 2031 is set out below in Table 10.1.
Table 10.1 LTS 6.2.2 Background Traffic Growth for Earls Court Study Area
AM Peak PM Peak
2021 5.25% 10.28%
2031 5.52% 10.57%
10.2.9 It should be noted that although this forecast of future traffic growth is based on TfL’s strategic LTS model, it runs counter to the long-term trend of declining traffic levels in London (as reported by TfL’s 2010 “Travel in London” report). A significant component of the growth forecast appeared to be associated with the impact of the WEZ removal.
10.2.10 On 03 June 2011, TfL announced initial monitoring results following removal of the WEZ, finding a lower than expected increase in traffic driving into and within the former zone and no discernable impact on air quality. Traffic entering the former zone during charging hours increased by 8% from the same period in 2010, whereas TfL's forecast had been 8% to 15%. Similarly, traffic driving within the former zone increased by 6%, against a 6% to 12% forecast range.
10.3 GENERATED TRAFFIC
10.3.1 The number of vehicle movements generated by the Site Wide Development Option was forecast in section 7 (Tables 7.14 and 7.17), as summarised below in Table 10.2. These are presented as PCU’s where a value of 2 has been used for HGV’s. These trip totals, and others quoted in this document, have been rounded for presentational purposes and as such any minor discrepancies relate only to this process.
Table 10.2 Forecast PCU Trips - 2031
Mode AM Peak PM Peak
In Out 2 Way In Out 2 Way
Taxi or Minicab (PCU 1.0) 82 34 116 48 106 154
Driving a car or van (PCU 1.0) 288 440 728 487 424 911
Servicing (PCU 2.0) 56 52 108 17 18 35
Total 426 495 952 552 548 1100
10.3.2 These vehicle movements result from the completed development in the 2031 assessment year. The traffic generation of the Development would increase
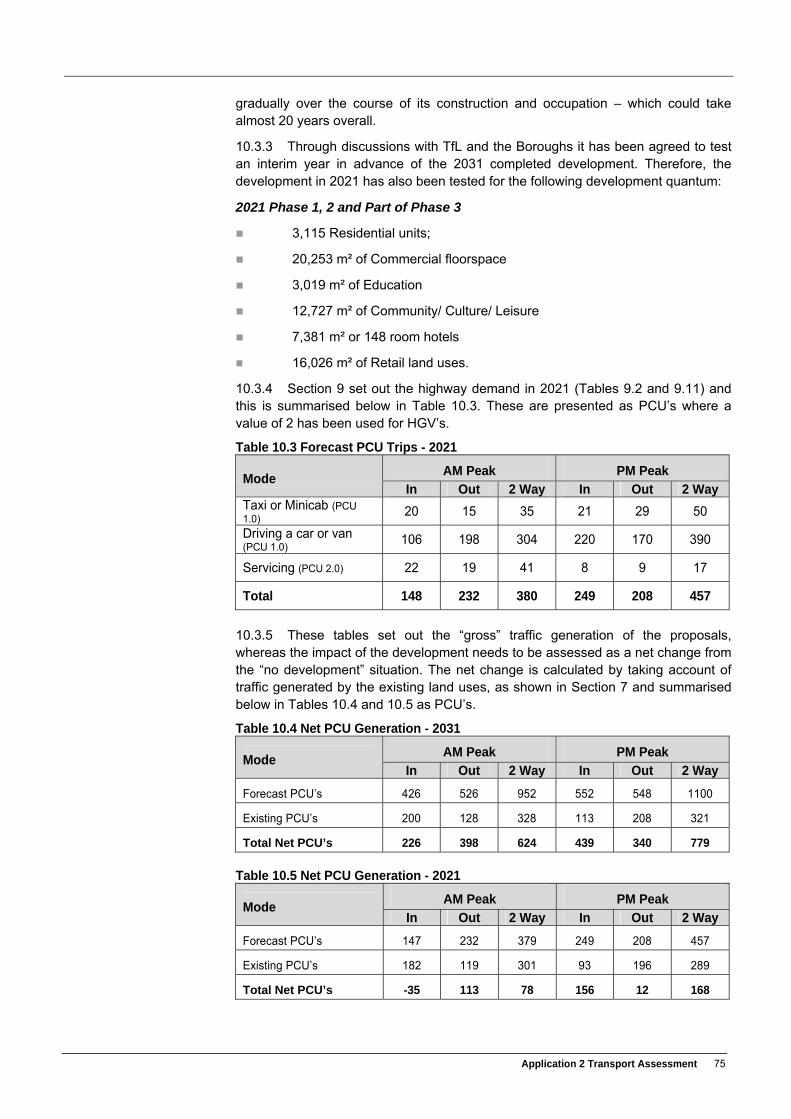
Application 2 Transport Assessment 75
gradually over the course of its construction and occupation – which could take almost 20 years overall.
10.3.3 Through discussions with TfL and the Boroughs it has been agreed to test an interim year in advance of the 2031 completed development. Therefore, the development in 2021 has also been tested for the following development quantum:
2021 Phase 1, 2 and Part of Phase 3
3,115 Residential units;
20,253 m² of Commercial floorspace
3,019 m² of Education
12,727 m² of Community/ Culture/ Leisure
7,381 m² or 148 room hotels
16,026 m² of Retail land uses.
10.3.4 Section 9 set out the highway demand in 2021 (Tables 9.2 and 9.11) and this is summarised below in Table 10.3. These are presented as PCU’s where a value of 2 has been used for HGV’s.
Table 10.3 Forecast PCU Trips - 2021
Mode AM Peak PM Peak
In Out 2 Way In Out 2 Way Taxi or Minicab (PCU 1.0) 20 15 35 21 29 50
Driving a car or van (PCU 1.0) 106 198 304 220 170 390
Servicing (PCU 2.0) 22 19 41 8 9 17
Total 148 232 380 249 208 457
10.3.5 These tables set out the “gross” traffic generation of the proposals, whereas the impact of the development needs to be assessed as a net change from the “no development” situation. The net change is calculated by taking account of traffic generated by the existing land uses, as shown in Section 7 and summarised below in Tables 10.4 and 10.5 as PCU’s.
Table 10.4 Net PCU Generation - 2031
Mode AM Peak PM Peak
In Out 2 Way In Out 2 Way
Forecast PCU’s 426 526 952 552 548 1100
Existing PCU’s 200 128 328 113 208 321
Total Net PCU’s 226 398 624 439 340 779
Table 10.5 Net PCU Generation - 2021
Mode AM Peak PM Peak
In Out 2 Way In Out 2 Way
Forecast PCU’s 147 232 379 249 208 457
Existing PCU’s 182 119 301 93 196 289
Total Net PCU’s -35 113 78 156 12 168

Application 2 Transport Assessment 76
10.4 DISTRIBUTION
10.4.1 The person trips established through the Trip Generation Model have been distributed using LTS Version 6.2.2. This method is in keeping with the approach adopted for the Earls Court Transport Study (ECTS) with exception of the Trip Generation Model which has been developed separately from the LTS process, and agreed with TfL, for the purposes of more refined trip making forecasts by mode and time.
10.4.2 The LTS model utilises a number of zones that relate broadly to administrative boundaries, topographical changes or to changes in urban form, such as major roads or rail corridors. The Development person trips have been assigned to the LTS zones 2120 and 2025 and the proposals broken down into LTS user input parameters as follows.
Number of Households
Total population
Population 5 year old and over
Children aged 5 -15
Workers (16-64) in white collar employment
Workers (16-64) in blue collar employment
Working age (16-64) adult not employed
Pensioners
Number of White collar jobs
Number of Blue collar jobs
10.4.3 LTS is coded with land use and infrastructure changes over time. The land use assumptions and infrastructure which is included within the model will influence trip origins and destinations.
10.4.4 The model has been used to generate distribution patterns for the modes of vehicular traffic (car, taxi, LGV and OGV), public transport and walk and cycle. The application of these distributions to the trips established through the Trip Generation Model allows assignment to be made using specific highway and public transport models.
10.5 HIGHWAY ASSIGNMENT
10.5.1 The vehicle trips established through the Trip Generation Model and the distribution of car trips established through LTS have been assigned to the highway network using TfL’s Central London Highway Assignment Model (CLoHAM).
10.5.2 As part of the preceding ECTS study, there had been a thorough review of the signalised junctions along the primary road network in the study area. This included checking signal timings and saturation flows at most of the key junctions, with additional site visits to check junction layouts and junction operation generally, and reviewing the original calculations of signal timings for CLoHAM, from the timing data provided by TfL.
10.5.3 The calculations underlying the signal timings in CLoHAM generally were found to be robust, with the following caveats:
When identifying cycle times, the standard procedure is to identify the mode time from the timings provided, as opposed to the average. Whilst this was clearly the correct approach on the whole, a small number of instances

Application 2 Transport Assessment 77
were found in which the mode time was biased very much to the low side of the range, untypical of the signal timings as a whole, and the average time was considered more logical. In this situation, the signal timings were re-calculated using the average cycle time.
A small number of significant differences were found between the signal timings recorded on the timing sheets, and the timings identified on the ground, in the site visits. In some cases, the signal stages were different; in others, the stages were the same, but the timings were very different. At many junctions, considerable variability was found in the observed stage timings, cycle by cycle, and obviously in this situation, little weight could be put on the observed results. In other cases, very little variation was apparent. Taking into consideration issues such as this, it was necessary to make a judgement as to which was correct, and where necessary, the timings in the model were modified accordingly. The aspect of the timings which was found to be most in doubt concerned the pedestrian stages; the proportion of time they are called, and the traffic movements which operate during this stage.
In no more than one or two cases, the signal timings used appeared to bear no relation to the signal timings provided, for reasons which were not apparent. In this situation, the signal timings were re-calculated using the timing information provided.
Junction and Network Changes
10.5.4 In order to improve the robustness of the model, revisions were made to the following traffic signal timings in the AM and PM peaks for the junctions are set out in Tables 10.6 and 10.7.
Table 10.6: Junctions modified in AM peak
Node Description Issue
34235 Earls Court Road / West Cromwell Road
Switch from mode to average cycle time
34221 Brompton Road / Cromwell Road
As above
34223 Exhibition Road / Cromwell Road
As above
34225 Pembroke Road / Earls Court Road
Apparent error in signal timings coded
12689 / 12908 Knightsbridge / Brompton Road / Sloane Street
Surveyed timings very different, decided to switch
32109 Hammersmith Broadway / Beadon Road
Switched to surveyed signal timings
32110 Hammersmith Broadway / Hammersmith Road
As above
32115 Hammersmith Broadway / Fulham Palace Road
As above
34260 Old Brompton Road / Warwick Road
Minor adjustment to coded timings

Application 2 Transport Assessment 78
Table 10.7: Junctions modified in PM Peak
Node Description Issue
32115 Hammersmith Broadway / Fulham Palace Road
Switched to surveyed signal timings
34225 Pembroke Road / Earls Court Road
Apparent error in signal timings coded
34234 Warwick Gardens / Pembroke Road
Switched to surveyed timings
34244 Warwick Road / West Cromwell Road
Minor adjustment to coded timings
12689 / 12908 / 12907 Knightsbridge / Brompton Road / Sloane Street
Surveyed timings very different, decided to switch
10.5.5 The minor adjustments made were implemented in the base year and in all the future year tests, and it was not considered necessary to repeat the matrix estimation process in the base. The adjustments were made to rectify a small number of inaccuracies found in the local area signal timings, relating mainly to the methodology used for establishing the overall cycle time. The impact on the model calibration/validation results was checked, and there was found to be virtually no change in either the AM or PM peaks.
10.6 FUTURE YEAR NETWORKS
10.6.1 The future year models are as follows:
2021 and 2031 Base Models
2031 Development Model - Do Minimum Network Test
2031 Development Model – Mitigated Network Test
2021 Development Model – Do Minimum Network Test
2031 Development Model – So Something Network Test
2021 and 2031 Base Models
10.6.2 The 2021 and 2031 Base models have the same highway layouts as the Existing Base model. To reflect TfL’s SCOOT systems, the 2021 and 2031 Base future year VISSIM models have been run with optimised signal timings where necessary in order to optimise the performance of the network. This is reasonable, given that the SCOOT controllers will optimise signal timings as traffic patterns and volumes change. However, as VISSIM has no way of pre-empting actual junction/ phasing redesign as a result of future growth, all staging/ phasing has been kept the same as existing as well as, where possible, keeping any stage optimisation within the range defined by the original timing data.
10.6.3 By having this controlled and limited approach to optimisation, it is felt that the models are able to give the most realistic representation about the potential of the network to cope with background growth.
2021 Development Model (Do minimum network test)
10.6.4 In order to understand the impact of the development on the highway network, a development test has been undertaken whereby the development and associated demand is delivered with the associated access junction arrangements in 2021, the internal road network and the signalisation of the junction of Lillie Road and North End Road. However, no further changes to signal staging at other junctions are made to mitigate the impacts. This assessment is termed the 2021 Do Minimum Network Test. It is considered that the Do Minimum Test is required to

Application 2 Transport Assessment 79
appraise the impact of the development without all proposed mitigation being in place.
10.6.5 The VISSIM network for 2021 Base model was adapted to reflect the proposed 2021 Development highway layout. The internal road network was modelled with reduced vehicle speeds to represent its design features and high level of pedestrian and cyclist activity and space. The 2021 Development model has the following access arrangements:
The A4 junction (Access 1 on Figure 10.1) would be used as a left-in, left-out priority junction for use by construction traffic only
Access to and egress from the development via existing junction onto Warwick Road (Access 2 on Figure 10.1)
Access to and egress from the development via a new priority junction on Old Brompton Road (Access 3 on Figure 10.1)
Access to and egress from the development via two new priority junction at Lillie Road east of North End Road (Access 4 and 5 on Figure 10.1)
Access to and egress from the development via a new priority junction at North End Road opposite Star Road (Access 7 on Figure 10.1)
10.6.6 In addition to the access proposals the following junction changes have also been made:
Signalisation of the Lillie Road / North End Road junction. The left turn from North End Road into Lillie Road and the right turn from Lillie Road into North End Road at the proposed signalised junction are banned. These movements are accommodated on the new highway network within the Development. The cycle time in the PM peak has increased to 100 seconds. (Access 6 on Figure 10.1)
10.6.7 Other than these changes, the Do Minimum Network Test has no additional network changes. In essence, the 2021 Do Minimum Network Test is therefore a test of the development road network and quantum prior to the A4 junction being open to development traffic but with no wider signal strategies being employed to mitigate the impacts.
10.6.8 The access arrangements for the 2021 Development Model are shown on Figure 10.1.

Application 2 Transport Assessment 80
Figure 10.1: 2021 Development Highway Layout
2031 Development Model (Do minimum network Test)
10.6.9 In order to test the development in 2031, the 2021 Development Model as described above has been supplemented with the following additional accesses:
Access to and egress from the development via a new a new signalised junction located on the A4 West Cromwell Road between North End Road and Warwick Road. This is modelled with a single right turn lane into the development from the west with a single lane exit from the site. In 2031 the junction is available for all traffic to use. (Access 1 on Figure 10.2)
New priority junction on North End Road opposite May (Access 8 on Figure 10.2)
New priority junction at North End Road opposite Barons Court Road (Access 9 on Figure 10.2)
10.6.10 Other than these changes, the Do Minimum Network Test has no additional network changes. In essence, the 2031 Do Minimum Network Test is therefore a test of the development road network and quantum but with no wider signal strategies being employed to mitigate the impacts. It is considered that the Do Minimum Test is required to appraise the impact of the development without all proposed mitigation being in place.
1
2
3
4
5
7
6

Application 2 Transport Assessment 81
Figure 10.2: Development Highway Layout
2021 Development Model (Mitigated network Test)
10.6.11 For the 2021 Mitigated Network Test the site access arrangements are as described for the 2021 Do Minimum Network test in Paragraph 10.6.4.
10.6.12 In addition to the access arrangements, traffic signal timings have been adjusted at the following junctions across the network in order to improve the coordination and performance of the local highway network:
A4 /North End Road
A4 / Warwick Road
A4 Earls Court Road
Earls Court Road / North End Road
Earls Court Road / Earls Court Square
Old Brompton Road / Finborough Road.
10.6.13 In addition, the following changes have also been made:
The signals at North End Road and the A4 now include a left turn filter from North End Road into the A4 westbound. This runs in conjunction with the right turn from the A4 into North End Road.
The signals at Warwick Road/ A4 have had the staging altered so that the pedestrian crossings run each cycle which removes a large intergreen between stages and that more time can be given to main movements in the signal plan.
1
2
3
4
5
7
8
9
6

Application 2 Transport Assessment 82
The left turn from North End Road into Lillie Road and the right turn from Lillie Road into North End Road at the proposed signalised junction are banned. These movements are accommodated on the new highway network within the Development. The cycle time in the PM peak has increased to 100 seconds.
Old Brompton Road/ Finborough Road and Old Brompton Road/ Earls Court Road has had the cycle time increased to 80 seconds for the entire region and better co-ordinated the offset between junctions.
10.6.14 In essence, the 2021 Mitigated Development Network Test is a test of the development road network and quantum prior to the A4 junction being open to development traffic but with additional signal changes in place.
2031 Development Model (Mitigated network test)
10.6.15 For the 2031 Mitigated Network Test the site access arrangements are as described for the 2031 Do Minimum Network test in Paragraph 10.6.9.
10.6.16 In addition to the access arrangements changes to traffic signals timings have been adjusted in accordance with those described above for the 2021 Mitigated Network Test.
10.6.17 In essence, the 2031 Mitigated Development Network Test is a test of the development road network and quantum with the A4 junction being open to development and through traffic and with additional signal changes in place.
10.7 VISSIM NETWORK PERFORMANCE SUMMARY
10.7.1 The Earls Court Option Testing report that considers future year performance with and without development is contained in Appendix O. A summary of the performance of the networks is set out below.
2021 and 2031 Base Models
10.7.2 In terms of network performance, the overall patterns are largely similar to the 2009 Base but the principal changes are:
Westbound and northbound traffic at the A4 / North End Road junction experiences increased delays. The traffic signal optimisation of this junction can cancel out some but not all of the increased delay due to TfL’s background traffic growth forecast by 2031. The optimisation at this stage has assumed that TfL will wish to continue to prioritise the smoothing of A4 traffic flows above those on North End Road, but alternative optimisation strategies could be pursued according to TfL’s future priorities for managing the A4 corridor.
The southbound approach to the Earls Court Road / Old Brompton Road junction also has increased delays, particularly for southbound and westbound traffic.
Northbound traffic along Finborough Road and Warwick Road would also have increased delay due to the background traffic growth.
10.7.3 Data has been collected at a network wide level, as a series of average readings relating to per vehicle journey times, speeds and time spent in delay conditions. The total number of cool down trips is the number of vehicles in the matrix that have been unable to complete their journey in the peak hour as a result of queuing and delay within the model. These network statistics therefore provide an overview of comparative network performance,, giving a broad idea of the impact of both future year growth and the addition of development traffic.

Application 2 Transport Assessment 83
10.7.4 A summary of the 2021 network performance when compared to the 2009 Base is shown in Tables 10.8 and 10.9 for the AM and PM peaks respectively.
Table 10.8 AM Peak Hour Network Performance 2021 Base
2009 Base 2021 Base
Total Vehicles in Matrix 12212 12790
Number of Completed Peak Hour Trips
10047 10669
Average Peak Hour Journey time per Vehicle (sec.)
371 366
Average % Delay per Vehicle of Completed Trips
40% 41%
Total Completed Warm-up Trips
1818 1721
Total Cool Down Trips 347 400
Unreleased 0 0
10.7.5 Table 10.8 shows that with future year growth the network performance statistics remain comparable to the base. The increase in traffic from 2009 to 2021 results in only a 1% increase in average per vehicle delay.
Table 10.9 PM Peak Hour Network Performance 2021 Base
2009 Base 2021 Base
Total Vehicles in Matrix 11921 13078
Number of Completed Peak Hour Trips
9708 9633
Average Peak Hour Journey time per Vehicle (sec.)
356 462
Average % Delay per Vehicle of Completed Trips
39% 44%
Total Completed Warm-up Trips
2014 1961
Total Cool Down Trips 199 1022
Unreleased 0 463
10.7.6 Table 10.9 shows that the PM peak experiences a greater impact than the AM peak due to its higher traffic growth forecast. The 2021 Base has a considerable 31% increase in average journey times and a 5% increase in per vehicle delay when compared to the 2009 Base. The 2021 Base model accommodates fewer peak hour trips compared to the 2009 Base model due to the increase in journey times and delay. Most of this delay is caused by the operation and capacity of the Lillie Road/ North End Road double mini roundabout which creates large queues and delay in the PM peak, the extent of which impede the operation of nearby junctions.

Application 2 Transport Assessment 84
10.7.7 A summary of the 2031 network performance when compared to the 2009 Base is shown in Tables 10.10 and 10.11 for the AM and PM peaks respectively.
Table 10.10 AM Peak Hour Network Performance 2031 Base
2009 Base 2031 Base
Total Vehicles in Matrix 12212 12757
Number of Completed Peak Hour Trips
10047 10489
Average Peak Hour Journey time per Vehicle (sec.)
371 409
Average % Delay per Vehicle of Completed Trips
40% 43%
Total Completed Warm-up Trips
1818 1690
Total Cool Down Trips 347 573
Unreleased 0 5
10.7.8 Table 10.10 shows a similar pattern to the 2021 data. The increase in traffic flow from 2009 to 2031 results in a 3% increase in average vehicle delay.
Table 10.11 PM Peak Hour Network Performance 2031 Base
2009 Base 2031 Base
Total Vehicles in Matrix 11921 13049
Number of Completed Peak Hour Trips
9708 9925
Average Peak Hour Journey time per Vehicle (sec.)
356 449
Average % Delay per Vehicle of Completed Trips
39% 47%
Total Completed Warm-up Trips
2014 1976
Total Cool Down Trips 199 913
Unreleased 0 234
10.7.9 Table 10.11 shows the 2031 Base PM model performing similarly to the 2021 model. As with 2021 the overall performance is influenced by the operation and capacity of the Lillie Road/ North End Road double mini roundabout.
2021 Development Model – Do Minimum and Mitigated Network Tests
10.7.10 A summary of the 2021 Development network performance compared to the 2009 Base and 2021 Base is shown in Tables 10.12 and 10.13 for the AM and PM peaks respectively. The performance of both the Do Minimum and Mitigated Tests are provided.

Application 2 Transport Assessment 85
Table 10.12 2021 AM Peak Network Performance
2009 Base 2021 Base 2021
Development Do Minimum
2021 Development
Mitigated
Total Vehicles in Matrix
12212 12790 12903 12903
Number of Completed Peak Hour Trips
10047 10669 10668 11017
Average Peak Hour Journey time per Vehicle (sec.)
371 366 370 347
Average % Delay per Vehicle of Completed Trips
40% 41% 41% 40%
Total Completed Warm-up Trips
1818 1721 1760 1713
Total Cool Down Trips 347 400 450 173
Unreleased 0 0 25 0
10.7.11 Table 10.12 shows that the 2021 Mitigated Development model can accommodate more traffic than the 2021 Base whilst providing comparable overall average journey time statistics. In 2021, the average peak hour journey time would reduce by 19s with the Development and the signal strategies in place and the average delay would reduce by 1%.
10.7.12 In total the 2021 Development Mitigated Model handles an additional 348 peak hour trips over the 2021 Base model. In terms of “cool down” trips, the Development Mitigated model performs better than the 2021 Base model, with 227 fewer vehicles remaining to complete their trips after the peak hour (173 vehicles as opposed to 400 vehicles). The Development mitigation means that more traffic can be accommodated with comparable network performance. It should be noted the additional 348 peak hour trips exceeds the net increase in traffic due to the Development (Tables 9.8, 9.11 and 9.14). This is due to the CLoHAM model re-assigning 2021 Base traffic from other parts of the wider road network due to improvements in network performance resulting from the Development mitigation.
10.7.13 The 2021 Do Minimum Development model would perform less well with a 4s increase in average vehicle delay and 25 vehicles remaining unreleased at the end of the model.

Application 2 Transport Assessment 86
Table 10.13 2021 PM Peak Network Performance
2009 Base 2021 Base 2021
Development Do Minimum
2021 Development
Mitigated
Total Vehicles in Matrix
11921 13078 13202 13202
Number of Completed Peak Hour Trips
9708 9633 10844 10913
Average Peak Hour Journey time per Vehicle (sec.)
356 462 341 311
Average % Delay per Vehicle of Completed Trips
39% 44% 41% 38%
Total Completed Warm-up Trips
2014 1961 2041 1989
Total Cool Down Trips 199 1022 317 300
Unreleased 0 463 0 0
10.7.14 Table 10.13 shows that the 2021 Mitigated Development model accommodates 1,280 more peak hour trips than the 2021 Base, with a significant reduction in average journey time and delay. Again this is due to the Development mitigation and specifically the Lillie Road/ North End Road junction signalisation. Some improvements can also be observed against the 2009 Base model. It should be noted the additional 1,280 peak hour trips significantly exceeds the net increase in traffic due to the Development (Tables 9.8, 9.11 and 9.14).
10.7.15 Overall it is clear that the Development mitigation means that the network operates better than the 2021 Base, despite the additional Base traffic being re-assigned into the VISSIM study area.
10.7.16 A comparison of the 2021 Do Minimum model to the 2021 Base again results in some improvement in performance because of the inclusion of the signalisation of the Lillie Road and North End Road and the on-site infrastructure.
2031 Development Model– Do Minimum and Mitigated Network Tests
10.7.17 A summary of the 2031 Development network performance compared to the 2009 Base and 2031 Base is shown in Tables 10.14 and 10.15 for the AM and PM peaks respectively.

Application 2 Transport Assessment 87
Table 10.14 2031 AM Peak Network Performance
2009 Base 2031 Base 2031
Development Do Minimum
2031 Development
Mitigated
Total Vehicles in Matrix
12212 12757 13552 13552
Number of Completed Peak Hour Trips
10047 10489 10911 11362
Average Peak Hour Journey time per Vehicle (sec.)
371 409 431 362
Average % Delay per Vehicle of Completed Trips
40% 43% 45% 42%
Total Completed Warm-up Trips
1818 1690 2030 2036
Total Cool Down Trips 347 573 599 155
Unreleased 0 5 12 0
10.7.18 Table 10.14 shows that the 2031 Mitigated Development model can accommodate more traffic than the 2031 Base whilst still providing improved journey time statistics. The average peak hour journey time reduces by 47s with the Development, whilst the average delay reduces by 1%. In total the Development model handles an additional 873 peak hour trips over the 2031 Base model. In terms of “cool down” trips, the Development model performs better than the 2031 Base model, with 418 less vehicles remaining to complete their trips after the peak hour (155 vehicles as opposed to 573 vehicles). The Development mitigation and its ability to improve the road network by providing new through routes mean that Development traffic can be accommodated with an overall improvement in network performance.
10.7.19 It should be noted the additional 873 peak hour trips exceeds the net increase in traffic from the Development (Tables 7.16 and 7.17) due to the re-assignment of 2031 Base traffic from other parts of the wider road network. For that reason, the model is testing more than just the impact of Development traffic.
10.7.20 The 2031 Do Minimum Development Test sees an increase in the number of vehicles completing their journeys during the peak hour but also sees an increase in average vehicle delay, trips completed in the cool down period and vehicles left unreleased.

Application 2 Transport Assessment 88
Table 10.15 2031 PM Peak Network Performance
2009 Base 2031 Base 2031
Development Do Minimum
2031 Development
Mitigated
Total Vehicles in Matrix
11921 13049 13760 13760
Number of Completed Peak Hour Trips
9708 9925 10521 11241
Average Peak Hour Journey time per Vehicle (sec.)
356 449 373 328
Average % Delay per Vehicle of Completed Trips
39% 46% 42% 40%
Total Completed Warm-up Trips
2014 1976 2205 2252
Total Cool Down Trips 199 913 819 257
Unreleased 0 234 215 11
10.7.21 Table 10.15 shows that the Development Mitigated model accommodates 1,316 more trips than the 2031 Base, with a significant reduction in average journey time and delay. Again this is due to the Development mitigation.
10.7.22 The Do Minimum Network Test would see an improvement against the 2031 Base but to a lesser extent than the Mitigated model because of the lack of a wider signal strategy being employed.
10.8 2021 JUNCTION PERFORMANCE
LILLIE ROAD / NORTH END ROAD
10.8.1 Figures 23 and 24 of Appendix O shows that in both peaks the 2021 Development Mitigated and Do Minimum model has a substantial overall reduction in average vehicle delay, and enables a much greater traffic volume through the junction. Delay on every approach is reduced considerably, except the eastbound arm which increases slightly, as a result of its signalisation along with the left turn from North End Road into Lillie Road and the right turn from Lillie Road into North End Road being accommodated on the new highway network within the Development.
10.8.2 In terms of queuing, the analysis indicates that southbound queue lengths for both the Mitigated and Do Minimum model are reduced by an average of over 400m in the AM peak and by over 600m in the PM peak when compared to the 2021 Base. Other key queue length reductions are on the northbound approach in both peaks, experiencing in the region of 300m and 400m reductions respectively. In the PM peak, similar queue reductions are apparent the westbound approach experiences queue length reductions of approximately 500m.
A4/ NORTH END ROAD
10.8.3 Figures 25 and 26 of Appendix O show that although there is a large reduction in delay in the PM peak Do Minimum model, allowing an 11% increase in total flow, in the AM peak there is a slight increase in delay at the junction, meaning a lower volume in the peak hour. This delay is mainly attributed to the northbound approach to the junction, which suffers average delays of over 400 seconds in the Do Minimum test.

Application 2 Transport Assessment 89
10.8.4 For the Mitigated test, an additional stage was added, allowing more time for northbound traffic. The results of this can be clearly seen in considerable reduction in delay. Even though this problem was less pronounced in the PM peak, there is still a benefit as a result of the signal mitigation measures.
10.8.5 The queue data aligns well with the delay data. There is a clear reduction in queuing for northbound traffic in the AM peak Mitigated test which reduces from 500 metres in the 2021 Base and Do Minimum test to 200 metres as a result of the new signal staging.
10.8.6 In the PM peak the Do Minimum test results in less delay and greater volume passing through the junction than the 2021 base. The reduction in delay is largely related to the eastbound right turn delay which reduces from over 400 seconds in the 2021 Base to 150 seconds in the Do Minimum test. There is a small further reduction in overall delay and increase in volume at this junction as a result of additional signal stage in the Mitigated test. In terms of queuing, reductions are apparent in both development tests when compared to the 2021 Base but the Mitigated test sees a further aggregate reduction in queuing of 100 metres across all arms.
A4 / WARWICK ROAD
10.8.7 Figures 27 and 28 of Appendix O show that almost all tests remain consistent in average per vehicle delay for all approaches, with the exception of southbound traffic turning from Warwick Road onto the A4 in the AM Do Minimum test model, which is as a result of slight changes to signal offsets.
10.8.8 Although delay does not increase, an increase in queuing (as shown in Figure 28) would occur particularly in the AM peak Mitigated test, where queue lengths increase in comparison to both the 2021 Base and the Do minimum test, mainly for northbound traffic on Warwick Road. This demonstrates that even if queue lengths increase, with the right signal configuration, average per vehicle delay does not need to increase to match.
A4 / EARLS COURT ROAD
10.8.9 Figures 29 and 30 of Appendix O show both the Do Minimum and Mitigated Development tests having a substantial reduction in overall delay in both peaks to that found in the 2021 Base models. This is down to an overall reduction in volume combined with small optimisations to signal timings in the AM peak. The aggregate reduction across all arms is around 80s for both development tests.
10.8.10 During the PM peak, the decrease is caused by reduced queue lengths on Earls Court Road, which causes some exit arm blocking in the base model. This also accounts for the increased volume of traffic able to get through this junction during the peak. The reduction is around 50s for both development models across all arms of the junction.
10.8.11 In both peaks but particularly the AM, there is an overall reduction in queue lengths at this junction. In the AM peak queuing reduces in both Development tests by a total of over 100 metres across all arms. The biggest reduction in queuing occurs for traffic approaching from the north and heading south down Earls Court Road. This is largely to do with signal optimisation, slightly rebalancing the priority given to each stage, but in the PM peak is also to do with the exit arm blocking on the southern arm in the base model as mentioned previously.

Application 2 Transport Assessment 90
EARLS COURT ROAD / OLD BROMPTON ROAD
10.8.12 Figures 31 and 32 of Appendix O show a reduction in delay on all approaches to this junction. This is more pronounced in the PM peak, as signal optimisation makes it possible to create greater benefits for vehicles on the southbound approach along Earls Court Road, particularly in the Mitigated test.
10.8.13 Queue lengths are largely comparable except for those experienced by southbound traffic, where there is an improvement, particularly in the PM peak with queues reducing from around 500 metres to 300 metres.
WARWICK ROAD / FINBOROUGH ROAD / OLD BROMPTON ROAD
10.8.14 Figures 33 and 34 of Appendix O show an increased delay in the AM peak Development test models, particularly for eastbound and northbound traffic. However, this can be largely mitigated with changes to the signal operation in the Mitigated test where increased delay across the junction is increased by 50s.
10.8.15 In the PM peak there is some reduced delay for both of the development tests with the Mitigated test also accommodating considerably more traffic but reducing delay on all approaches. This relates to the tidal nature of traffic flow in conjunction the signal staging – in the PM peak there are more westbound vehicles and this direction runs in two stages rather than just one.
10.8.16 There is an increase in traffic volume on Old Brompton Road as a result of the new north-south link within the development, as well as the improvements to flow as a result of the signalisation of the North End Road/ Lillie Road junction. This does affect queue lengths at this junction in the AM peak; however, through signal optimisation and the changing of the region cycle time from 72 seconds to 80, there is still an increase in the overall through volume during the peak hour in the Mitigated test.
10.9 2031 JUNCTION PERFORMANCE
LILLIE ROAD / NORTH END ROAD
10.9.1 Appendix O Figures 51 and 52 show that in both peaks the Development Do Minimum and Mitigated models have a substantial overall reduction in average vehicle delay, enabling a much greater traffic volume through the junction. Delay on every approach is reduced considerably as a result of its signalisation along with the left turn from North End Road into Lillie Road and the right turn from Lillie Road into North End Road at the being accommodated on the new highway network within the Development.
10.9.2 In terms of queuing, southbound queue lengths are reduced by an average of approximately 200m in the AM Do Minimum test model and approximately 400m in the AM Mitigated test model. Queue lengths for southbound traffic are reduced by almost 600m in the PM peak in both development scenarios.
A4/ NORTH END ROAD
10.9.3 Appendix O Figures 53 and 54 show the Development leading to an overall reduction in delay in both peaks, The performance in the AM peak is comparable with the reference case model, with the Mitigated model achieving greater benefits, however in the PM peak the difference is much more significant. On every approach, with the possible exception of westbound traffic on the A4 where there is little change, there are substantial reductions in delay. This allows increased volume in both development models, particularly in the Mitigated test model.
10.9.4 In the PM peak base reference case model, the delay emanating from the Lillie Road junction impacts on performance of the A4 due to extended queuing

Application 2 Transport Assessment 91
along North End Road. In the development model the Lillie Road junction is signalised, significantly reducing this issue. This is likely to almost entirely explain the improvement demonstrated in this data.
10.9.5 The queue data aligns exactly with the delay data. The A4 Talgarth Road arm of the junction includes both the eastbound traffic and the eastbound right-turning traffic, as they share a stop-line. This means that the queue length for this arm is, in reality, almost entirely made-up of right-turning vehicles, with the three eastbound lanes suffering almost no queuing.
A4 / WARWICK ROAD
10.9.6 Appendix O Figures 55 and 56 show the Development tests resulting in reduced or comparable junction delay in both peaks despite the increased volume of vehicles passing through the junction.
10.9.7 The overall level of queuing at this junction is improved upon in the AM peak, in both development scenarios. However, in the PM peak there is a small increase in queue lengths experienced for northbound traffic on Warwick Road for the Mitigated test. This is a product of the increased volume travelling north in combination with signal timings prioritising the sustaining of base scenario queue levels on the A4.
A4 / EARLS COURT ROAD
10.9.8 Appendix O Figures 57 and 58 show similar levels of delay, with a slight improvement, in the Development Mitigated tests as those found in the base case models, in both peaks. The Do minimum option models results in increases in delay in both peaks. This is largely made up of vehicles attempting to travel southbound on Earls Court Road being delayed by the queuing from the junction with Old Brompton Road causing exit arm blocking towards the end of the peak.
10.9.9 The queue data at this junction largely aligns with the delay data presented. The exception is where southbound traffic delay is being caused by exit arm blocking, but this has not necessarily translated into much bigger queues on the junction approaches.
EARLS COURT ROAD / OLD BROMPTON ROAD
10.9.10 Appendix O Figures 59 and 60 show the Development Do Minimum and Mitigated tests resulting in increased delay for southbound traffic in the AM peak although there is an improvement as a result of the additional signal optimisation in the Mitigated model compared to the Do Minimum. This is due to vehicles getting stuck behind buses at the nearby bus stop, as well as having an increased difficulty in changing lanes as a result of higher average vehicle speeds. The PM peak has an increase in delay in the Do Minimum test model, which is mitigated in the Mitigated test model, which demonstrates a performance increase over both the base and Do Minimum option models.
10.9.11 Despite the increase in delay, there is little overall change in queue lengths in the AM peak, proving that queues are not the main cause of the additional delay. It also shows a considerable reduction in queue lengths for the main southbound queues in the PM peak for Mitigated test.
WARWICK ROAD / FINBOROUGH ROAD / OLD BROMPTON ROAD
10.9.12 Appendix O Figures 61 and 62 demonstrate a reduction in delay on all approaches, in both peaks, in the Mitigated test models. This is as a result of better co-ordination between this junction and the junction at Earls Court Road/ Old Brompton Road, as well as a cycle time increase from 72 seconds to 80.

Application 2 Transport Assessment 92
10.9.13 In the AM peak Do minimum test model, there is a need to artificially penalise northbound traffic in order to stop exponential queuing developing on Old Brompton Road, blocking a large number of routes. This brings a benefit to both eastbound and westbound journeys, and stops as many vehicles travelling northwards on Warwick Road (which also helps to explain the reduced queuing found at the junction with the A4 in this option).
10.9.14 In the Mitigated option, signal staging is simplified at this junction, allowing more time to be assigned to northbound traffic. This distributes the queuing and delay more evenly between this junction and the junction with Warwick Road and the A4, allowing for better overall journey times.
10.9.15 Queuing at this junction is forecast to increase significantly for the Do Minimum test and reduce for the Mitigated tests against the respective 2031 Base models. This indicates the benefit that the additional signal mitigation measures would have at this junction. The increased queue for the AM peak Do Minimum test would be as a result of an increase in eastbound Old Brompton Road queuing of 300 metres (100 metres increasing to 400 metres). The reduction for the Mitigated test occurs because of a reduction in northbound Finborough Road queuing to 180 metres from 350 metres in the 2031 Base. In the PM peak the reduction in queuing for the Mitigated test again relates to reduced queuing on the northbound Finborough Road arm of the junction.
10.10 DEVELOPMENT ACCESSES 2021
10.10.1 This section considers the primary access junctions from the Development onto the wider highway network by 2021. The accesses are shown on Figure 10.1.
10.10.2 The principal accesses in terms of their use by Development traffic are :
Access 2 - Warwick Road Access 4 - Lillie Road Access 7 - North End Road at Star Road
ACCESS 2 - WARWICK ROAD
10.10.3 Tables 10.16 and 10.17 show that both queuing and delay is acceptable. No additional delay or queuing would occur to traffic along Warwick Road because of the left-in and left-out arrangement of the junction. Queuing on the site arm is limited due to traffic being able to discharge onto Warwick Road in the shadow of the pedestrian crossing leading to Earls Court station. In the PM peak a similar pattern can be observed with limited delay and queuing on the site arm. The volume of traffic using this junction is supressed by the limited route choice that it affords as a result of the Earls Court One Way System.
Table 10.16 AM Peak Performance of Warwick Road Access
Movement Number
of Vehicles
Average Queue Length
(m)
Max Queue Length
(m)
Stopped Delay (secs)
Development Do Min Development Arm
Left Out 29 0 15 8
Left In 6
Development Mitigated Development Arm
Left Out 28 1 18 17
Left In 7 - - -

Application 2 Transport Assessment 93
Table 10.17 PM Peak Performance of Warwick Road Access
Movement Number
of Vehicles
Average Queue Length
(m)
Max Queue Length
(m)
Stopped Delay (secs)
Development Do Min Development Arm
Left Out 18 0 11 12
Left In 16
Development Mitigated Development Arm
Left Out 18 0 11 7
Left In 16 - - -
ACCESS 4 - LILLIE ROAD
10.10.4 Table 10.18 shows that little additional delay or queuing would occur to traffic travelling along Lillie Road. However, there are large recorded queues for vehicles leaving the development, particularly those turning right. This statistic is however, affected by a number of factors. The statistics for the right turn out of the development are high because of the small number of vehicles making the movement and that because of the link is a single carriageway the queue is a mix of left and right turning vehicles and the position of the right turning vehicles in the queue is what is recorded, as such they value is higher because often they are subsumed within left turning vehicles. The cause of the queue for left turning traffic is the volume of eastbound traffic along Old Brompton Road. The queue from the Finborough Road/ Old Brompton Road junction towards the end of the peak reaches the development access junction meaning vehicles are unable to exit.
10.10.5 As can be seen in Table 10.19 the PM peak performs much better with insignificant queues and delays on all junctions arms.
Table 10.18 AM Peak Performance of Lillie Road Access
MovementNumber
of Vehicles
Average Queue Length
(m)
Max Queue Length
(m)
Stopped Delay (secs)
Development Do Min Lillie Road westbound
Right 88 24 151 57
Straight 260 12 60 63
Development Mitigated Lillie Road westbound
Right 96 10 72 35
Straight 259 0 15 30
Development Do Min Development Arm
Left 186 179 338 193
Right 5 179 338 264
Development Mitigated Development Arm
Left 186 221 354 308
Right 5 221 354 450
Development Do Min Lillie Road eastbound
Left 14 38 125 129
Straight 363 52 139 185
Development Mitigated Lillie Road eastbound
Left 16 6 68 67
Straight 444 12 80 69

Application 2 Transport Assessment 94
Table 10.19 PM Peak Performance of Lillie Road Access
MovementNumber
of Vehicles
Average Queue Length
(m)
Max Queue Length
(m)
Stopped Delay (secs)
Development Do Min Lillie Road westbound
Right 161 0 38 21
Straight 407 0 38 19
Development Mitigated Lillie Road westbound
Right 164 1 47 19
Straight 404 0 9 20
Development Do Min Development Arm
Left 131 4 53 4
Right 12 4 53 11
Development Mitigated Development Arm
Left 126 3 53 4
Right 12 3 53 7
Development Do Min Lillie Road eastbound
Left 11 0 20 49
Straight 260 0 23 48
Development Mitigated Lillie Road eastbound
Left 10 0 19 55
Straight 290 0 19 46
ACCESS 7 - NORTH END ROAD AT STAR ROAD
10.10.6 Tables 10.20 and 10.21 show a similar pattern to the Lillie Road Access in that the PM peak performs better than the AM peak. The largest queues recorded in both scenarios are for the northbound traffic along North End Road, particularly in the Development Do Minimum test. This is in fact not a queue directly related to this junction specifically but occurs because without the mitigation introduced at the North End Road/ A4 junction for the development mitigation model increased queuing occurs back from this junction.
Table 10.20 AM Peak Performance of North End Road Access at Star Road
MovementNumber
of Vehicles
Average Queue Length
(m)
Max Queue Length
(m)
Stopped Delay (secs)
Development Do Min North End Road NB
Right 38 188 487 152
Straight 286 188 487 141
Development Mitigated North End Road NB
Right 46 15 147 75
Straight 331 15 147 50
Development Do Min Development Arm
Left 90 68 193 162
Right 42 68 193 121
Development Mitigated Development Arm
Left 112 9 79 31
Right 49 9 79 30
Development Do Min North End Road SB
Left 98 7 141 77
Straight 473 5 139 54
Development Mitigated North End Road SB
Left 100 22 204 69
Straight 473 22 204 54

Application 2 Transport Assessment 95
Table 10.21 PM Peak Performance of North End Road Access at Star Road
MovementNumber
of Vehicles
Average Queue Length
(m)
Max Queue Length
(m)
Stopped Delay (secs)
Development Do Min North End Road NB
Right 37 1 47 51
Straight 303 1 47 42
Development Mitigated North End Road NB
Right 46 15 147 75
Straight 331 15 147 50
Development Do Min Development Arm
Left 151 5 59 9
Right 63 5 60 6
Development Mitigated Development Arm
Left 150 4 51 6
Right 62 4 52 5
Development Do Min North End Road SB
Left 208 2 122 113
Straight 606 1 96 89
Development Mitigated North End Road SB
Left 206 1 76 108
Straight 599 1 71 79
10.11 DEVELOPMENT ACCESSES 2031
10.11.1 This section considers the primary access junctions from the Development onto the wider highway network. The accesses are shown on Figure 10.1.
10.11.2 The principal accesses in terms of their use by Development traffic are :
Access 1 - New A4 Junction Access 2 - Warwick Road Access 4 - Lillie Road Access 7 - North End Road at Star Road Access 8 - North End Road at Beaumont Avenue
10.11.3 Each access performance is summarised against the criteria of number of vehicles, Average Queue Length, Maximum Queue Length and Stopped Vehicle Delay.
ACCESS 1 - NEW A4 JUNCTION
10.11.4 Tables 10.22 and 10.23 show that both queuing and delay are acceptable. The linking of this junction with junctions either side that would mean that the junction would operate on the same signal controller and therefore any additional delay would be compensated by improved network efficiencies and optimisation either side of the site access. Whilst the performance of the Development Do Minimum test and Development Mitigated test models is largely similar the Development Mitigated test brings reductions in the amount of queuing and delay for vehicles travelling eastbound along the A4.

Application 2 Transport Assessment 96
Table 10.22 AM Peak Performance of A4 Access
MovementNumber
of Vehicles
Average Queue Length
(m)
Max Queue Length
(m)
Stopped Delay (secs)
Development Do Min A4 Eastbound
Right 61 20 113 58
Straight 2319 20 113 21
Development Mitigated A4 Eastbound
Right 65 14 72 47
Straight 2355 14 72 13
Development Do Min Development Arm
Left 123 51 186 77
Right 252 51 186 75
Development Mitigated Development Arm
Left 128 75 192 94
Right 267 75 192 94
Development Do Min A4 Westbound
Left 103 41 170 31
Straight 1795 41 170 33
Development Mitigated A4 Westbound
Left 106 33 166 35
Straight 1853 33 166 31
Table 10.23 PM Peak Performance of A4 Access
Movement Number
of Vehicles
Average Queue Length
(m)
Max Queue Length
(m)
Stopped Delay (secs)
Development Do Min A4 Eastbound
Right 48 12 80 53
Straight 2043 12 80 15
Development Mitigated A4 Eastbound
Right 47 12 84 52
Straight 2047 12 84 14
Development Do Min Development Arm
Left 149 38 130 75
Right 150 38 130 57
Development Mitigated Development Arm
Left 153 38 113 74
Right 150 38 113 61
Development Do Min A4 Westbound
Left 171 38 233 17
Straight 2342 38 233 19
Development Mitigated A4 Westbound
Left 188 168 381 24
Straight 2543 168 381 26
ACCESS 2 - WARWICK ROAD
10.11.5 Tables 10.24 and 10.25 show that both queuing and delay is acceptable for the site access junction from Warwick Road. No additional delay or queuing would occur to traffic along Warwick Road because of the left-in and left-out arrangement of the junction. Queuing on the site arm is limited due to traffic being able to discharge onto Warwick Road in the shadow of the pedestrian crossing leading to Earls Court station. In the PM peak a similar pattern can be observed with limited delay and queuing on the site arm.
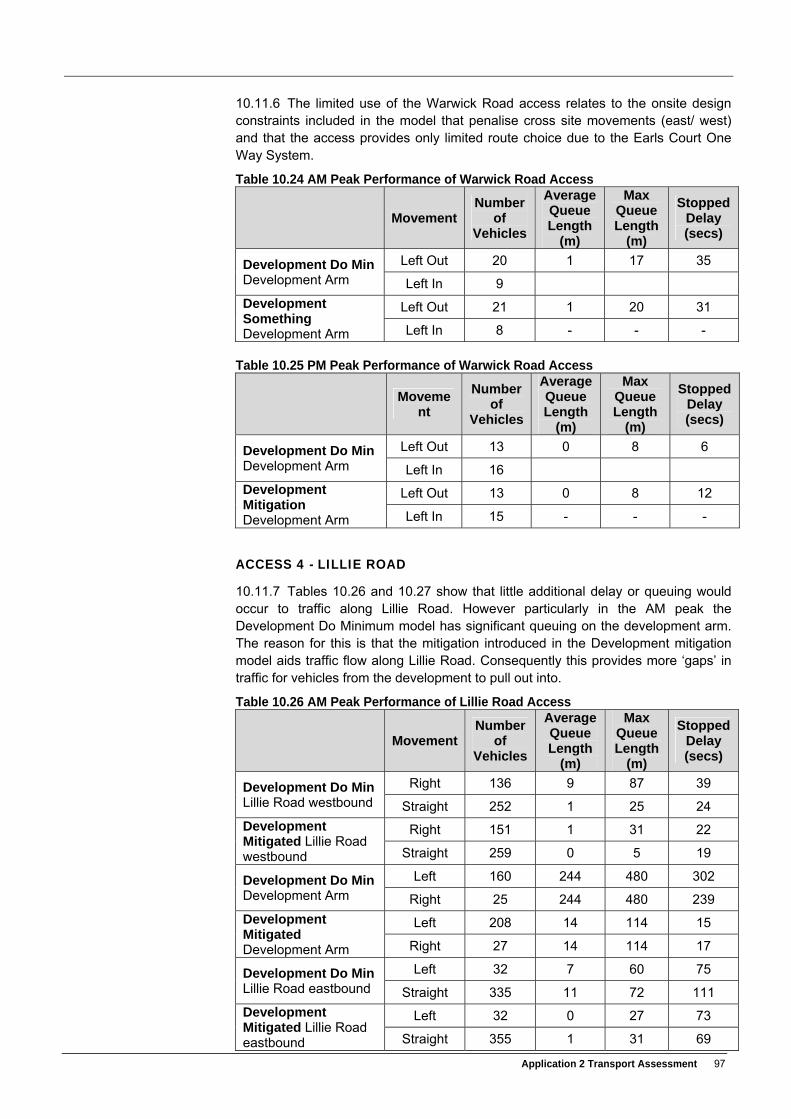
Application 2 Transport Assessment 97
10.11.6 The limited use of the Warwick Road access relates to the onsite design constraints included in the model that penalise cross site movements (east/ west) and that the access provides only limited route choice due to the Earls Court One Way System.
Table 10.24 AM Peak Performance of Warwick Road Access
MovementNumber
of Vehicles
Average Queue Length
(m)
Max Queue Length
(m)
Stopped Delay (secs)
Development Do Min Development Arm
Left Out 20 1 17 35
Left In 9
Development Something Development Arm
Left Out 21 1 20 31
Left In 8 - - -
Table 10.25 PM Peak Performance of Warwick Road Access
Movement
Number of
Vehicles
Average Queue Length
(m)
Max Queue Length
(m)
Stopped Delay (secs)
Development Do Min Development Arm
Left Out 13 0 8 6
Left In 16
Development Mitigation Development Arm
Left Out 13 0 8 12
Left In 15 - - -
ACCESS 4 - LILLIE ROAD
10.11.7 Tables 10.26 and 10.27 show that little additional delay or queuing would occur to traffic along Lillie Road. However particularly in the AM peak the Development Do Minimum model has significant queuing on the development arm. The reason for this is that the mitigation introduced in the Development mitigation model aids traffic flow along Lillie Road. Consequently this provides more ‘gaps’ in traffic for vehicles from the development to pull out into.
Table 10.26 AM Peak Performance of Lillie Road Access
MovementNumber
of Vehicles
Average Queue Length
(m)
Max Queue Length
(m)
Stopped Delay (secs)
Development Do Min Lillie Road westbound
Right 136 9 87 39
Straight 252 1 25 24
Development Mitigated Lillie Road westbound
Right 151 1 31 22
Straight 259 0 5 19
Development Do Min Development Arm
Left 160 244 480 302
Right 25 244 480 239
Development Mitigated Development Arm
Left 208 14 114 15
Right 27 14 114 17
Development Do Min Lillie Road eastbound
Left 32 7 60 75
Straight 335 11 72 111
Development Mitigated Lillie Road eastbound
Left 32 0 27 73
Straight 355 1 31 69

Application 2 Transport Assessment 98
Table 10.27 PM Peak Performance of Lillie Road Access
MovementNumber
of Vehicles
Average Queue Length
(m)
Max Queue Length
(m)
Stopped Delay (secs)
Development Do Min Lillie Road westbound
Right 154 0 26 26
Straight 372 0 7 28
Development Mitigated Lillie Road westbound
Right 178 20 120 29
Straight 429 5 41 31
Development Do Min Development Arm
Left 142 2 39 2
Right 27 2 39 8
Development Mitigated Development Arm
Left 115 60 235 73
Right 21 60 235 106
Development Do Min Lillie Road eastbound
Left 29 0 22 42
Straight 221 0 23 37
Development Mitigated Lillie Road eastbound
Left 26 0 19 50
Straight 219 0 21 61
ACCESS 7 - NORTH END ROAD AT STAR ROAD
10.11.8 Tables 10.28 and 10.29 show that both queuing and delay are minor with the exception of northbound on North End Road in the Development Do Minimum model where, as with the 2021 Do Minimum test this northbound queuing occurs as a result of queuing back from the junction with the A4. This queuing does not occur in the Mitigated test due to the extra time given to this movement in the traffic signal timings.
Table 10.28 AM Peak Performance of North End Road Access at Star Road
MovementNumber
of Vehicles
Average Queue Length
(m)
Max Queue Length
(m)
Stopped Delay (secs)
Development Do Min North End Road NB
Right 58 174 583 107
Straight 408 174 583 109
Development Mitigated North End Road NB
Right 64 11 131 76
Straight 455 11 131 62
Development Do Min Development Arm
Left 73 12 95 44
Right 67 12 95 59
Development Mitigated Development Arm
Left 75 2 37 7
Right 71 2 37 3
Development Do Min North End Road SB
Left 101 40 104 41
Straight 432 41 104 20
Development Mitigation North End Road SB
Left 117 4 85 2
Straight 489 4 82 1

Application 2 Transport Assessment 99
Table 10.29 PM Peak Performance of North End Road Access at Star Road
MovementNumber
of Vehicles
Average Queue Length
(m)
Max Queue Length
(m)
Stopped Delay (secs)
Development Do Min North End Road NB
Right 47 1 40 49
Straight 302 1 40 48
Development Mitigated North End Road NB
Right 64 11 131 76
Straight 455 11 131 62
Development Do Min Development Arm
Left 54 1 27 5
Right 106 1 27 3
Development Mitigated Development Arm
Left 62 1 30 5
Right 100 1 31 6
Development Do Min North End Road SB
Left 61 3 64 0
Straight 585 3 61 1
Development Mitigation North End Road SB
Left 58 2 81 0
Straight 599 2 77 1
ACCESS 8 - NORTH END ROAD AT BEAUMONT AVENUE
10.11.9 Table 10.30 and 10.31 show that no significant queuing and delay occur on the Beaumont Avenue arm in the AM or PM peak for either the Do Minimum or Mitigated Development tests. The only significant queue volumes recorded are for northbound along North End Road in the Development Do Minimum models. As previously stated the performance variance to the Development Mitigated model is caused by mitigation at the North End Road/ A4 Talgarth Road, affording northbound traffic additional green time.
Table 10.30 AM Peak Performance of North End Road / Beaumont Avenue Access
MovementNumber
of Vehicles
Average Queue Length
(m)
Max Queue Length
(m)
Stopped Delay (secs)
Development Do Min North End Road NB
Straight 514 34 151 6
Right 17 34 151 16
Development Mitigated North End Road NB
Straight 576 7 75 2
Right 19 8 80 6
Development Do Min Beaumont Avenue
Right 20 5 41 65
Left 13 4 41 46
Development Mitigated Beaumont Avenue
Right 20 5 33 78
Left 13 5 33 42
Development Do Min North End Road SB
Straight 524 3 53 62
Left 29 3 53 64
Development Mitigated North End Road SB
Straight 593 0 49 57
Left 34 0 49 59

Application 2 Transport Assessment 100
Table 10.31 AM Peak Performance of North End Road / Beaumont Avenue Access
MovementNumber
of Vehicles
Average Queue Length
(m)
Max Queue Length
(m)
Stopped Delay (secs)
Development Do Min North End Road NB
Straight 328 0 27 0
Right 18 0 27 3
Development Mitigated North End Road NB
Straight 335 0 25 0
Right 14 0 31 4
Development Do Min Beaumont Avenue
Right 21 0 12 5
Left 20 0 12 3
Development Mitigated Beaumont Avenue
Right 21 0 14 4
Left 20 0 14 2
Development Do Min North End Road SB
Straight 657 0 25 92
Left 43 0 22 75
Development Mitigated North End Road SB
Straight 665 0 28 83
Left 51 0 28 54
10.12 CUMULATIVE HIGHWAY IMPACT
10.12.1 The Seagrave Road proposals would result in a small decrease in traffic entering and leaving the Seagrave Road car park site. Therefore the simplifying assumption has been made that the Seagrave Road proposals result in zero net change in traffic flows and so no separate assessment of Scenario 2 (Site Wide Development Option plus Seagrave Road proposals) is presented.
10.13 CONCLUSION
10.13.1 The analyses show that the Development networks would accommodate the Site Wide Development Option traffic plus the additional Base traffic which is modelled as being attracted onto the VISSIM network from other parts of the wider road network. As such, the assessment is testing more than just the impact of Development traffic.
10.13.2 The Do Minimum Development Tests do not benefit from additional signal changes elsewhere within the network and as such some additional queuing and delay is experienced at some junctions.
10.13.3 However, as part of the Mitigated Development tests, the 2021 and 2031 traffic signal timings and staging have been adjusted at a number of junctions across the network in order to improve the coordination and performance of the local highway network. These changes largely mitigate the impacts of the development and provide much improved overall network performance statistics. This is consistent with the Mayor’s objective to smooth traffic flows (London Plan 2011 Policy 6.11). This optimisation of signals can be undertaken through TfL’s SCOOT system, subject to agreement with TfL.
10.13.4 The 2021 assessment reflects the situation shortly before the proposed A4 junction would be open to Development traffic, thereby opening the north-south route for through traffic and completing the physical mitigation works. It is therefore considered that there would be no significant additional scenarios to be tested for the purposes of assessing the acceptability of the outline planning application proposals.

Application 2 Transport Assessment 101
10.13.5 It is envisaged that further detailed traffic modelling will be required in due course as part of the standard TfL process for procuring new traffic signals and altering existing signals, after the acceptability in principle of the Development has been established.

Application 2 Transport Assessment Earls Court 102
11 Impacts – Parking
11.1 RESIDENTIAL PARKING RATIO
11.1.1 The surrounding area is within RBKC and LBHF Controlled Parking Zones (CPZs), and it is intended that ECWKOA residents would not be eligible for RBKC nor LBHF parking permits. The CPZ hours of operation are effective in safeguarding parking spaces for local residents against parking pressures from commuting and Earls Court events. However, they would not prevent future residents from parking on-street due to their hours of operation.
11.1.2 The CPZ controlled hours are:
RBKC: 0830 until 2200 Mondays to Fridays and to 1830 on Saturdays
LBHF CPZ D (North End Road area) : 0900 until 1700 Mondays to Fridays
LBHF CPZ F (Lillie Road area) : 0900 until 2000 Mondays to Saturdays
11.1.3 The on-site residential parking ratio has been selected as 0.6 space per unit so as to meet the anticipated residential car ownership within the ECWKOA.
11.2 RESIDENTIAL PARKING
On-Plot Car Parking
11.2.1 The residential parking allocation is based on an overall car parking ratio of 0.6 per unit, with most of these spaces being provided in basement car parks within development plots. The exception to this form of provision is the proposed townhouses (plots WV02 and WV05), where on-street parking is proposed on non-adopted roads within the development.
11.2.2 10% of spaces will be designed for, and dedicated to, use by Blue Badge holders in accordance with the BS8300:2009 standards summarised in Table 6.2 of the London Plan 2011.
11.2.3 In accordance with London Plan 2011 standards, 20% of parking spaces will be provided with active electric charging. A further 20% will have “passive” provision to allow for further expansion as electric vehicles become more prevalent.
On-Street Car Parking
11.2.4 On-street parking is proposed for the on-site streets which are proposed for adoption (The High Street and The Broadway), and on the other streets which would be managed privately by an on-site management company. The proposed layout is shown on Figure 1.3.
11.2.5 The private streets would include on-street parking areas for residential use, within the overall 0.6 per unit car parking ratio. These spaces would include Blue Badge parking and electric car charging points in accordance with the 20% active, 20% passive streets adopted for the on-plot residential parking.
11.2.6 The adopted roads would have a mixture of Resident Permit and Pay & Display parking bays including Blue Badge bays, electric charging points and Car Club parking bays.
Residential Motorcycle Parking
11.2.7 In the absence of a specific London Plan standard, it is proposed that one motorcycle space will be provided per 20 units.

Application 2 Transport Assessment 103
11.2.8 In accordance with paragraph 6A.6 of the London Plan 2011, “an appropriate proportion” of the non-residential parking spaces will be marked out for motorcycle use. The details will be assessed once the development is operational.
Residential Cycle Parking
11.2.9 Cycle parking will be provided in accordance with Table 6.3 of the London Plan 2011 (one space per 1 or 2 bed unit and two spaces for 3 bed and larger units). This equates to a total of 8,740 on-plot spaces. Visitor cycle parking is proposed at a level of 0.1 spaces per dwelling equating to 678 visitor spaces to be provided on-street across the site. Non-residential cycle parking would be provided in accordance with London Plan cycle parking standards in a mixture of on-plot and on-street locations.
Residential Parking Summary
11.2.10 Applying this proposed allocation to the number of units in each development proposal gives the following space numbers.
Table 10.3: Residential Parking Summary
On Plot On Street Overall
Overall Car Parking Spaces
3828 237 4,065
Blue Badge Spaces 383 40 780
Active Charging Spaces
766 47 813
Passive Charging Spaces
766 47 813
Cycle Spaces 8,740 678 (visitor) 9,418
Motorcycle Spaces 340 tbc 340
11.3 COMMERCIAL PARKING
Commercial On-Plot Car Parking
11.3.1 The commercial car parking provision is based on the following ratios:
Business: 1 car space per 1000 m², 1 cycle space per 250 m²
Hotel / Serviced Apartments: 1 space per 40 rooms
Leisure: Blue Badge car parking only
Culture: Blue Badge car parking only
Retail: Blue Badge car parking only
Education: Blue Badge car parking only
Healthcare: Blue Badge car parking only
11.3.2 The Blue Badge car parking ratios will accord with Table 6.2 and paragraph 6A.2 of the London Plan 2011. Active / passive electric vehicle charging will comply with Table 6.2 of the London Plan 2011 whereby the active / passive ratios are 10% / 10% for retail, and 20% / 10% for employment and all other uses.

Application 2 Transport Assessment Earls Court 104
Commercial On-Street Car Parking
11.3.3 The only on-street car parking available to commercial occupiers or visitors would be general pay and display parking on the adopted roads within the site.
11.3.4 140 pay and display bays are proposed.
Commercial Motorcycle Parking
11.3.5 On-plot motorcycle parking will be provided at a ratio of one space per 20 dwellings, totalling some 340 spaces. Some of the on-street parking areas shown on Figure 1.3 could be reserved for motorcycle use.
Commercial Cycle Parking
11.3.6 The commercial cycle parking provision is based on the following London Plan Cycle Parking ratios:
Business: 1 cycle space per 250 m² (proposed to be 1:150 m² in the Draft Early Alterations to the London Plan).
Hotel / Serviced Apartments: 1 cycle space per 10 Full Time Equivalent staff
Leisure: 1 cycle space per 10 Full Time Equivalent staff and per 20 peak visitor occupancy.
Culture: 1 cycle space per 10 Full Time Equivalent staff and per 20 peak visitor occupancy.
Retail: 1 cycle space per 125sqm for food retail and 1 per 300sqm for non-food retail.
Education: 1 cycle space per 10 staff or students
Healthcare: 1 cycle space per five Full Time Equivalent staff and per 10 peak visitor occupancy
Commercial Coach Parking
11.3.7 As part of the individual and subsequent reserved matters planning applications, coach parking and or drop details will be provided for all relevant land uses so as to comply with the London Plan and Borough coach parking standards.
11.3.8 An indicative plan showing possible coach parking and or drop off locations is shown as Figure 11.1.
Commercial Parking Summary
11.3.9 Applying these proposed allocations to each development proposal gives the following space numbers, and the layout of masterplan plots is shown on Figure 1.4.

Application 2 Transport Assessment 105
Table 11.4: Commercial Parking Summary
Business Hotel Leisure Culture Retail Education Medical
Overall Car Parking Spaces
121 10 1 per plot
tbc tbc
Blue Badge Spaces
12 1 1 per plot
1 per plot
1 per plot
tbc tbc
Active Charging Spaces
24 2 0 0 0 tbc tbc
Passive Charging Spaces
12 1 0 0 0 tbc tbc
Cycle Spaces
482 20 22 on-plot
+ 199 visitor
tbc 589 tbc tbc
Motorcycle Spaces
tbc tbc tbc tbc tbc tbc tbc
Coach To comply with GLA / Borough standards for the relevant land uses
11.4 ON-STREET CONTROLS
Adopted Streets
11.4.1 The RBKC / LBHF boundary follows the approximate route of the West London Line, meaning that the Earls Court Site straddles two Boroughs which currently have different approaches to the management of on-street parking. RBKC does not utilise a parking zoning system and therefore residents are permitted to park in resident bays anywhere within RBKC. Meanwhile, the LBHF controls and allow all users to use available parking bays as long as they are displaying the appropriate permits. LBHF does have a zoning system and therefore residents are only permitted to park in resident’s bays within the zone in which their car is registered.
11.4.2 The practicalities of cross-boundary on-street parking management have been considered. In this case, the locations of on-street spaces are such that only 16 spaces are located within the RBKC boundary. It is considered feasible to designate and manage these in accordance with the existing RBKC Controlled Parking Zone (CPZ) regulations, leaving the remainder of the on-street spaces to be managed as an extension of the existing LBHF CPZ. This may be simpler than the concept of promoting a single cross-Borough CPZ for the development. In any event, the detailed CPZ management proposals will be developed in liaison with TfL and both Boroughs, taking account of any future proposals which may involve variations to the current CPZ regulations in each Borough.
11.4.3 The detailed layout and designations of on-street bays will be agreed with TfL and both Boroughs, taking account of taxi drop-off requirements and the potential for a taxi rank if this is required.
11.4.4 The designation of Car Club bays will be agreed with TfL and both Boroughs, and made available for the sole use of the approved Car Club operator under contract to EC Properties Ltd or its appointed management company. The Car Club vehicles will thereby be accessible to all members of the public.
11.4.5 It is anticipated that planning controls will be sought to prohibit future residents of the development from obtaining on-street residential parking permits in either Borough.

Application 2 Transport Assessment Earls Court 106
Non-Adopted Streets
11.4.6 It is proposed that on-street bays will be privately-managed, with car parking spaces being designated for the use of on-site resident permit holders and authorised visitors only.
11.4.7 Residents will be able to purchase the ‘right to park’ on the private streets or on-plot parking areas, subject to availability. This will be paid through their leases. The ‘right to park’ would allow a resident’s vehicle to occupy one parking space as allocated by the management company.
11.4.8 On purchasing the ‘right to park’ the resident will be provided with a clearly identifiable parking permit to be displayed on the vehicle windscreen. This will provide a basis for the managed enforcement of on-street private parking areas.
11.4.9 Details of the “right to park” management proposals will be developed for agreement with TfL and the Boroughs. It is envisaged that a controlled number of temporary visitor permits will be available, and monitored to ensure that are usually only by authorised visitors to residents.
11.5 ON-PLOT ACCESS CONTROLS
11.5.1 All on-plot parking areas will be managed rigorously to ensure they are used only by the authorised vehicles.
11.5.2 There will be 24hr security staff for monitoring and enforcement purposes, to back-up the use of technology such as Automatic Number Plate Recognition (ANPR) for controlling the access to, and use of, all spaces.
11.5.3 In common with the private street spaces, residents will be able to purchase the ‘right to park’ in on-plot parking areas, subject to availability. This will be paid through their leases and would allow a resident’s vehicle to occupy one parking space as allocated by the management company.
11.5.4 The non-residential on-plot parking access will be secured in a similar way.
11.5.5 Further details of the car park access controls will be developed in consultation with TfL and the Boroughs.
11.6 CHARGING STRUCTURE AND LOW EMISSION STRATEGY
11.6.1 The details of a charging structure for all on-site parking will be developed from the following principles:
The “right to park” will be purchased on an annual basis with the charging level being set by the management company.
On-street pay & display charges will be set by the Boroughs as part of the relevant CPZ controls.
As part of a Low Emission Strategy, the introduction of a variable charging structure will be considered, with incentives being given for ownership of low emission vehicles. This may be achieved by linking the ANPR system to the Vehicle Excise Duty database or other recognised benchmarks for emissions data, so that higher-rated vehicles are charged greater amounts for their right to park.
An electric charging tariff will be set by the management company and benchmarked against other charging structures in London.

Application 2 Transport Assessment 107
11.7 MONITORING PROPOSALS
11.7.1 The efficient and secure use of all parking areas by authorised vehicles only is an important objective of the estate management strategy. Monitoring will therefore be carried out by the management company on a continuous basis.
11.7.2 In terms of reporting externally, details of surveyed parking use will be reported in line with the Framework Travel Plan submitted with the planning applications.
11.7.3 The Framework Travel Plan proposed monitoring and reporting in accordance with TfL’s ‘Travel Planning for new Development in London’. A programme of monitoring and review will be implemented to generate information and will be the responsibility of the Travel Plan Coordinator (TPC) for the duration of the Travel Plan. The detailed programme will be agreed as part of the detailed Travel Plans.
11.8 MONITORING SURVEYS
11.8.1 Travel surveys will be the main tool for monitoring travel patterns to the development. The surveys will establish the travel characteristics of people travelling to and from the site. In accordance with TfL’s guidance (Section 7), the travel surveys will follow the survey methodology approved by MVA for the TRAVL Database and iTRACE, including the following types:
Site audit questionnaire to confirm the current site conditions;
Core staff / resident survey and travel diary – for a sample of employees / residents;
Visitor questionnaire – this would be a personal interview targeting a sample; and
Multi-modal count (including pedestrians, cyclists, drop off activity etc) at each of the accesses for the site.
11.8.2 The detail of car park monitoring surveys will be agreed in advance with TfL and the Boroughs. Travel surveys will be carried out by an Independent Fieldwork Company (IFC) listed on www.travl.org.uk. The surveys will be commissioned by the TPC, and the IFC will carry them out and enter the results into the iTRACE and TRAVL databases.
11.8.3 The TPC will arrange for the future travel surveys to be carried out in order to determine to what extent the modal split of visitor and staff travel patterns has changed.
11.8.4 In accordance with section 7 of TfL’s ‘Travel Planning for new development in London’ independent formal monitoring of the development will occur in years to be agreed with TfL and the Boroughs.
11.9 CAR CLUB PROVISION
11.9.1 Discussions with Streetcar, a Car Club operator which is active in LBHF and RBKC indicate a demand for up to 20 on-street spaces to be provided within the site. Streetcar acknowledge that the number of spaces and demand could be greater and therefore this will be monitored and suitable provision made should demand be relaised and depending on the success of the scheme.
11.10 TAXI PROVISION
11.10.1 The travel demand assessment includes forecasts of taxi demand, and the requirement for on-site taxi facilities will be discussed with TfL. If required, some of the on-street parking areas could be converted to taxi ranks.

Application 2 Transport Assessment Earls Court 108
11.10.2 An indicative plan showing possible taxi pick up and drop off areas is shown in Figure 11.1.

Application 2 Transport Assessment 109
12 Impacts - Public Transport
12.1 METHOD
12.1.1 The background growth and distribution of public transport trips were assessed using LTS as summarised in sections 10.1 and 10.2.
12.1.2 The aggregate of all public transport trips was assigned to local public transport networks using TfL’s Central and North Regional Railplan Model (CNRRM) in accordance with the associated public transport distribution derived from LTS. The aggregate public transport trips used in this exercise are summarised below in Table 12.1 and 12.2. These assessment years are consistent with the assessments undertaken for the highway network, Additional interim assessments for 2017 and 2025 may be undertaken by TfL through the use of the LTS model on which testing would be need to be undertaken.
Table 12.1: Forecast, Existing and Net Public Transport Trips – 2021
In Out 2 way In Out 2 way
Forecast 549 768 1317 555 596 1151
Existing 239 172 411 120 229 349
Net 310 596 905 435 367 802
Table 12.2: Forecast and Net Public Transport Trips – 2031 In Out 2 way In Out 2 way
Forecast 2054 1729 3783 1268 2046 3314
Existing 269 175 443 123 256 379
Net 1785 1555 3339 1145 1790 2935
12.1.3 As part of this exercise, the model has previously been reviewed in the context of its use for the Earls Court Transport Study where it was deemed fit for purpose.
12.1.1 The Site Wide Development proposals are located in Railplan Zones 2670 and 2804. As part of the review of the model, two amendments were made to the model to assist in the assessment of demand within the ECWKOA.
Zone 2804 was disaggregated into 4 zones to allow more refined assignment of public transport trips to transport nodes;
The West London Line services were re-coded in line with strategic Railplan improving the base year validation.

Application 2 Transport Assessment Earls Court 110
12.1.2 In order to distribute development trips to the appropriate Railplan zones the proportion of residential and other uses was split by proposed quanta in each of the zones now developed as follows:
Table 12.3: Distribution of Site Wide Development to Railplan Zones
Zone Residential Other
2670 13% 15% 2808 11% 0% 2819 23% 22% 2820 21% 1% 2821 32% 62% Total 100% 100%
12.1.3 Using the distribution derived from LTS, the net aggregate trip generation of bus, underground and overground rail (all public transport trips) were run through the Railplan model to assign them onto the bus, underground and overground rail networks. This method has been discussed and agreed with TfL through the pre-application process.
12.1.4 All public transport demand forecasts have used the standard methodology as agreed with TfL (Policy Analysis) and audited by MVA as part of the ECTS. In summary, the LTS model is used to provide background demand growth and development trips are then added separately based on a bespoke trip generation approach using documented trip rates. Railplan model outputs are processed using a combination approach to pivot from 2007 base year data (with the exception of an incremental addition to WLL outputs to reflect 2009 line load data).
12.1.5 Therefore the forecasts produced for the Transport Assessment are robust and considered the most appropriate to assess the impact of the proposed development at Earls Court. The modelling methodology is in line with TfL best practice and has previously been independently audited.

Application 2 Transport Assessment 111
12.1.6 Since undertaking the modelling for the Transport Assessment new line count data has become available providing Autumn 2011 demand on the West London line. This data shows continued strong growth on the route (8-10% on peak links in the last year). This historic growth is reasonably well forecast by the model and does not generate significant need to re-adjust the model outputs.
12.1.7 However, there are now the following two reasons to revisit the forecast of future year background demand at West Brompton Station:
Platform lengthening and longer trains are planned on the WLL; and
New count data has been made available providing WLL boarders and alighters surveyed in November 2011.
12.1.8 Discussions have therefore been held between Halcrow, London Rail and London Underground in order to agree a revised forecast for boarders and alighters at West Brompton for testing the capacity of the station. An agreement on the additional station demand has now been reached whereby the peak hour demand is to be increased by 50% and subsequent station capacity work is on-going. This additional assessment which is being undertaken in LEGION does not impact upon the line loading demand exercises or other stations considered in this assessment.
12.1.9 This section of the TA considers public transport demand for the following Scenarios which are consistent with the assessments undertaken for the highway network, As previously stated additional interim assessments for 2017 and 2025 may be undertaken by TfL through the use of the LTS model on which testing would be need to be undertaken:
2021: Site Wide Development Option in 2021
Scenario 1: Site Wide Development Option in 2031
Scenario 2: Site Wide Development Option plus Seagrave Road in 2031
12.1.10 In terms of assessing trigger points for public transport improvements, it should be noted that :
The West London Line upgrade is committed to be in place prior to the commencement of Development and hence there is no trigger to be assessed
The bus impacts were provided to TfL Buses for discussion in August 2011, and the discussion of these will include consideration of the triggers and phasing of bus service improvements
The LTS and Railplan models include the District and Piccadilly Line upgrades from 2021. As an indication of the impact of development in 2021 if the upgrades were not delivered by that time, it should be noted from Table 9.8 that the net impact of development in 2021 would be 597 AM peak hour trips and 531 PM peak hour trips. This equates to around 1% of the 2021 Base flow on the District and Piccadilly Lines at Earls Court
12.2 BUS IMPACTS
12.2.1 It was agreed at the Scoping Study stage that the Transport Assessment would present the forecast changes in bus passenger numbers by direction and their implications would be assessed by TfL Buses.
12.2.2 It has subsequently been agreed that using TfL’s Railplan model for the forecasting of bus trips would not be acceptable to TfL and that the assessment approach should utilise the previously agreed Trip Generation model totals and Railplan for the assignment of these totals to routes. Therefore, WSP and Halcrow

Application 2 Transport Assessment Earls Court 112
have undertaken the following methodological approach to forecasting bus impact by route.
Net Forecast Bus Trip Generation derived from the Trip Generation Model
Assignment of additional bus boarders by route taken from Railplan and the proportion calculated
The proportion of new bus boarders by route applied to the Net Forecast Bus Trip numbers.
12.2.3 It is considered that this approach utilises a more robust approach to bus forecast demand and uses Railplan only for assignment to routes as this is considered the most effective tool for these purposes given its integration with LTS and the 20 year development build out being considered.
12.2.4 This assessment includes bus to bus interchange which is only in the region of 5% of all bus trips, and has been undertaken for the AM and PM peak hours. The results are set out in Tables 12.4 and 12.5 and the full analysis including Railplan proportions is contained in Appendix P.

Application 2 Transport Assessment 113
Table 12.4: Additional Bus Boarders by Route AM peak
Route 2021 Development
Scenario 1 Scenario 2
9 Hammersmith - Aldwych 2 5 6 10 Hammersmith - King's Cross 2 5 5 11 Fulham -Liverpool Street 2 7 8 14 Putney Heath - University College Hospital 5 13 15 18 Harrow Road Station - Euston Station 0 1 1 22 Putney Common - Piccadilly Circus 0 1 1 27 Turnham Green - Camden Town 1 4 4 28 W’worth to Kensal Rise via Nth End Rd 43 129 140 31 White City - Camden 0 1 1 33 Fulwell London garage - Hammersmith 0 1 1 35 Shoreditch - Clapham Junction 0 1 1 37 Putney - Peckham 1 2 2 39 Putney - Clapham Junction 1 4 4 44 Tooting Station - Victoria 3 9 10 49 Clapham Junction - White City 1 2 2 52 Willesden - Victoria 0 1 1 57 Balham - Kingston 0 1 1 72 Wormwood Scrubs - Roehampton 1 3 4 74 Baker St to putney bridge rd via EC Rd 23 69 74 77 Waterloo Station - Tooting Station 0 0 0 85 Kingston - Putney Bridge 3 10 10 87 Wandsworth - Aldwych 1 2 2 93 North Cheam - Putney 1 4 5 156 Merton - Vauxhall 1 4 4 190 Richmond to West Brompton 9 28 30 209 Mortlake - Hammersmith 1 3 3 211 Hammersmith - Waterloo Station 2 5 6 220 Harlesden - Wandsworth 3 8 8 237 Hounslow Heath -White City 1 2 2 265 Tolworth - Putney Bridge 1 2 2 266 Brent Cross - Hammersmith 3 8 9 267 Hampton Court - Hammersmith 1 3 3 270 Putney Bridge - Mitcham 3 9 10 281 Hounslow - Tolworth 0 1 1 283 Wormwood Scrubs - Barnes Pond 2 5 5 290 Staines Bus Station - Arragon Road 0 0 0 295 Ladbroke Grove - Clapham Junction 3 8 8 328 Golders Green - Worlds End 13 38 41 337 Richmond - Clapham Junction 0 1 1 345 Peckham - South Kensington 1 2 2 355 Brixton - Mitcham 0 1 1 391 Parsons Grn - Richmond via Nth End Rd 26 79 85 414 Putney Bridge Station - Maida Hill 2 6 6 419 Richmond - Hammersmith 0 1 1 424 Putney Heath - Fulham Craven Cottage 0 1 1 430 Sth Kensington - Roehampton via Lillie Rd 37 110 119 C1 White City - Victoria 1 3 3 C3 Clapham Junction - Earl's Court Tesco 3 8 9 H91 Hounslow - Hammersmith 1 2 2 R70 N Sheen - Hampton 0 1 1
Rounded Total 207 617 667

Application 2 Transport Assessment Earls Court 114
12.2.5 Table 12.4 indicates that the routes most impacted by the respective development proposals are the 28, 74, 190, 328, 391 and 430. All other routes see increases that can be considered as non-material.
Table 12.5: Additional Bus Boarders by Route PM peak
Route 2021 Development
Scenario 1 Scenario 2
9 Hammersmith - Aldwych 2 6 610 Hammersmith - King's Cross 2 6 611 Fulham -Liverpool Street 2 6 614 Putney Heath - University College Hospital 3 9 927 Turnham Green - Camden Town 1 2 328 Wandsworth- Kensal Rise 45 134 14337 Putney Heath -Peckham 1 2 339 Putney - Clapham Junction 1 4 444 Tooting Station - Victoria 2 6 649 Clapham Junction - White City 1 2 252 Willesden - Victoria 1 2 272 Alton Estate - East Acton 1 4 474 Putney - Baker Street 21 61 6585 Kingston - Putney 2 5 587 Wandsworth -Aldwych 1 3 393 North Cheam - Putney 2 4 5156 Wimbledon - Vauxhall 1 2 2190 Richmond - West Brompton 7 20 21209 Mortlake - Hammersmith 1 2 2211 Hammersmith - Waterloo Station 2 4 5220 Harlesden - Wandsworth 3 9 9265 Tolworth - Putney Bridge 1 2 2266 Brent Cross - Hammersmith 0 1 1266 Brent Cross - Hammersmith 2 4 5270 Mitcham - Tooting - Putney Bridge 2 5 5283 East Acton - Barnes Pond 2 6 6295 Ladbroke Grove - Clapham Junction 2 7 8328 Golders Green - Chelsea 5 14 15345 Peckham -South Kensington 0 1 1391 Richmond Sands End 26 76 81414 Putney Bridge Station - Maida Hill 2 6 6430 Danebury Avenue - South Kensington 30 88 93452 Kensal Rise - Wandsworth Road Station 0 1 1C1 White City - Victoria 1 4 4C3 Clapham Junction - Earl's Court Tesco 2 4 5 Rounded Total 175 519 551
12.2.6 From Table 12.5, the largest increase in boarders by route in the PM peak would be on the 28, 220, 430, 391, 74, 190, and 328. All other impacts are small and considered non-material.
12.2.7 In addition to the consideration of the total new boarders by route, TfL asked for additional detail on the impact of new boarders by route and direction. Therefore, additional analysis has been undertaken for each of the scenarios where additional boarders and loading points have been identified along the respective bus routes. This information has again been derived from Railplan but the trip numbers/ boarders relate to the trip generation model specified for use by TfL.
12.2.8 This information is best shown graphically and therefore a series of figures have been produced for each application and bus route impacted significantly. The

Application 2 Transport Assessment 115
figure numbers for each assessment by application are as follows and are included in Appendix P:
Figure 01 – Route 28
Figure 02 – Route 74
Figure 03 – Route 190
Figure 04 – Route 220
Figure 05 – Route 328
Figure 06 – Route 391
Figure 07 – Route 430
12.2.9 The results of the analysis indicate a logical pattern to additional bus boarding by direction in that buses inbound towards Earls Court show additional boarding along the length of the route whereas buses away from Earls Court show all additional boarding occurring only at journey stages close to the site.
12.2.10 Table 12.6 and 12.7 also show additional boarders by direction and Scenario. The total number of additional boarders does not match Tables 12.4 and 12.5 as these are the main routes impacted and therefore some are not considered by direction.
Table 12.6: Bus Boarders by Direction – AM Peak
Route Direction 2021 Development Scenario 1 Scenario 2
28 NB 26 76 83
SB 18 53 57
74 WB 4 19 21
EB 9 49 53
190 EB 0 24 26
WB 0 4 5
220 SB 0 2 2
NB 5 6 6
328 SB 12 9 10
NB 16 29 31
391 EB 2 56 60
WB 1 23 25
430 EB 10 74 80
WB 7 36 39
Rounded Total 109 461 498

Application 2 Transport Assessment Earls Court 116
Table 12.7: Bus Boarders by Direction – PM Peak
Route Direction 2021 Development Scenario 1 Scenario 2
28 NB 25 74 78
SB 21 61 65
74 WB 13 39 42
EB 7 22 23
190 EB 4 11 12
WB 3 9 9
220 SB 1 3 3
NB 2 6 6
328 SB 1 4 4
NB 3 10 11
391 EB 11 33 35
WB 15 43 46
430 EB 10 30 32
WB 19 57 61
Rounded Total 136 402 427
12.2.11 It is considered that changes outlined in Tables 12.5 and 12.6 represent a robust and reasonable forecast of additional bus demand by route. The implications of these changes in passenger numbers are to be assessed by TfL Buses.
Bus Journey Time Assessment
12.2.12 In terms of impacts to bus journey times, the VISSIM assessment work undertaken and presented in detail in Appendix O has been used to consider whether the impact of the development would result in changes to bus journey times. As with the highway assessment undertaken this has only been considered for the 2021 Development and Scenario 1 as Scenario 2 would result in reduced traffic volumes.
12.2.13 As a consequence of the relatively small sample size of individual buses on each route, the data was aggregated from 10 model runs, all on different random seeds. This will allow the data to be considered as much more stable than if a small sample size was used.
12.2.14 Table 12.8 indicates that overall there is an overarching improvement between AM 2021 and AM 2031 journey times with the Development in place. In the 2031 development scenario, there are only three routes which experience any sort of increase in average journey times over the reference case model; and none of these are above 5%. In the 2021 development scenario before the junction with the A4 has been formed, there are seven routes which experience increased journey times over the reference case model – the highest increase being 50%, with three of the routes having increases of more than 10%.

Application 2 Transport Assessment 117
Table 12.8 AM Average Service Journey Time Difference Comparison
12.2.15 With the PM data as shown in Table 12.9, there is less of a clear difference than in the AM peak. Overall, the 2031 development scenario performs slightly worse in regards to bus journey times than the 2021 development scenario; however both options largely out perform their relevant reference case models.
Table 12.9 PM Average Service Journey Time Difference Comparison
12.2.16 Graph 1 has been prepared to show a comparison between the overall bus performances for each scenario. This helps to clarify the difference between AM and PM performance.
12.2.17 Overall there is a reduction in journey times in the AM 2021 development scenario, but it is relatively small and only experienced on some routes as a significant benefit. The AM 2031 and both PM comparisons all show a much greater overall improvement in the development scenarios, which is reflected in the majority of individual routes seeing average improvements.
12.2.18 The key to bus journey time improvements is the achievement of much improved journey time consistency throughout the peak, across the network. Much of the journey time data shows that this is what the development models achieve, greater consistency with the addition of some significant route improvements.
12.2.19 It should be noted that the assessment takes no account of service benefits that can be achieved through routing buses through the development site where bus priority can be provided and is therefore a worst case assessment.

Application 2 Transport Assessment Earls Court 118
Graph 1 Total Bus Travel Time Difference Comparison
12.3 UNDERGROUND LINE IMPACTS
12.3.1 Baseline conditions on the underground network have been described in Section 5.7. The Appendix J Railplan results provide details of the forecast levels of background growth in the 2031 Base scenario, the Site Wide Development Option in 2021, the Site Wide Development Option (Scenario 1), and the Site Wide plus Seagrave Road cumulative development (Scenario 2).
12.3.2 The AM results illustrate that forecast growth without any development on the Earls Court Site between the Existing Base and the 2031 Base would not change the number of station-to-station links with more than four standing passengers / m². There would be minor increases of 0.2-0.3 passengers / m² on some links (which equates to an average of between five and seven additional passengers per carriage).
12.3.3 Table 12.10 summarises the percentages of the network within different passenger standing density ranges during the AM peak hour. The 1 hour peak periods have been established using a figure of 0.54 to derive loadings from the 3 hour peak period.
Table 12.10 Underground Network Assessment – AM Peak Hour (0800-0900)
Existing2021 Base
2021 Dev
2031 Base
Scenario 1
Scenario 2
Some seats available 48.3% 46.6% 46.4% 44.3% 44.1% 44.1%
Some standing (0-1/ m²)
13.9% 17.2% 17.2% 15.5% 15.4% 15.4%
Busy (1-2 / m²) 13.7% 14.4% 14.4% 13.7% 13.7% 13.7%
Crowded (2-3 / m²) 10.8% 10.0% 9.8% 11.6% 11.6% 11.8%
Very Crowded (3-4 / m²)
7.9% 7.8% 8.2% 8.3% 8.7% 8.5%
Maximal (4+ / m²) 5.3% 4.1% 4.1% 6.5% 6.5% 6.5%
12.3.4 Overall the balance of links at different crowding levels in 2021 would be less than the existing situation despite a background growth in passenger numbers of 21%. This is due to the increases in capacity provided by the District and Piccadilly Line upgrades. The most crowded part of the 2021 Base local network is the District Line between Fulham Broadway and Earls Court, where standing densities of 4.5

Application 2 Transport Assessment 119
passengers / m² are forecast during the peak hour. These densities are generally tolerable for short durations.
12.3.5 The addition of Development Demands associated with the Site Wide Development Option in 2021 see minimal changes to the wider strategic LUL network during the AM peak period and peak hour as a result of the development. However, there is a small increase in services operating within the ‘very crowded’ banding for the single peak hour.
12.3.6 In 2031 crowding densities would be similar to the existing base despite a background growth in passenger numbers of 26%. This is due to the increases in capacity provided by the District and Piccadilly Line upgrades. The most crowded part of the 2031 Base local network is the District Line between Fulham Broadway and Earls Court, where standing densities of 4.7 passengers / m² are forecast during the peak hour. These densities are generally tolerable for short durations.
12.3.7 The Scenario 1 results show overall crowding levels in 2031 similar to the 2031 Base with a small increase in the number of trains where very crowded conditions are experienced.
12.3.8 The Scenario 2 standing densities are identical due to the relatively small additional demand from the Seagrave Road development. They would result in a minor change compared to the 2031 Base, with the highest increases in standing densities being only 0.1 passenger / m². This is a negligible degree of Development impact.
12.3.9 The PM peak results are summarised in Table 12.11.
Table 12.11 Underground Network Assessment – PM Peak Hour (1700-1800)
Existing2021 Base
2021 Dev
2031 Base
Scenario 1
Scenario 2
Some seats available 45.6% 44.8% 44.7% 39.6% 39.4% 39.4%
Some standing (0-1 / m²)
16.7% 18.5% 18.5% 19.0% 19.1% 19.1%
Busy (1-2 / m²) 17.6% 18.0% 18.0% 16.9% 16.7% 16.7%
Crowded (2-3 / m²) 11.7% 11.1% 11.3% 13.1% 13.1% 13.1%
Very Crowded (3-4 / m²)
7.0% 7.0% 7.0% 9.7% 9.7% 9.7%
Maximal (4+ / m²) 1.5% 0.5% 0.5% 1.8% 2.0% 2.0%
12.3.10 The standing densities are all lower than for the AM peak, although the increases due to the Development scenarios are greater.
12.3.11 The largest changes occur between Earls Court and West Brompton where standing densities rise by 0.7 passengers / m², and on the Piccadilly Line where standing densities increase by 0.6 passengers / m² between Knightsbridge and Hyde Park Corner. The PM peak would have lower passenger densities than the AM peak.
12.4 WEST LONDON LINE IMPACTS
12.4.1 Baseline conditions on the West London Line have been described in Section 5.7. The Appendix J Railplan results provide details of the forecast levels of background growth in the 2021 and 2031 Base scenario, the 2031 Site Wide Development Option (Scenario 1), the 2021 Site Wide Development Option (Scenario 1a) and the Site Wide plus Seagrave Road cumulative development (Scenario 2). The 1 hour peak periods have been established using a figure of 0.54 to derive loadings from the 3 hour peak period.

Application 2 Transport Assessment Earls Court 120
12.4.2 Table 12.12 summarises the passenger standing densities during the AM peak hour.
Table 12.12 West London Line Assessment – AM Peak Hour (0800-0900)
Existing2021 Base
2021 Dev
2031 Base
Scenario 1
Scenario 2
Imperial Wharf to West Brompton
4.80 3.76 3.78 4.05 4.24 4.24
West Brompton to Kensington Olympia
4.12 3.22 3.22 3.49 3.50 3.50
Kensington Olympia to West Brompton
2.53 1.65 1.66 1.91 2.00 2.00
West Brompton to Imperial Wharf
1.82 1.51 1.52 1.82 1.87 1.87
12.4.3 The AM results illustrate that passenger standing densities without any development on the Earls Court Site would reduce by some 0.3-1.0 passengers / m² on some station-to-station links between the Existing Base and the 2021 Base scenarios. This is due to the capacity increases on the West London Line. The most crowded part of the line would be from Imperial Wharf to West Brompton, where standing densities of 3.76 passengers / m² are forecast during the peak hour.
12.4.4 The addition of Development demand in 2021 would see no material change in the crowding densities at this stage.
12.4.5 The AM results for the 2031 Base illustrate that passenger standing densities without any development on the Earls Court Site would reduce by some 0.6-0.7 passengers / m² on some station-to-station links when compared to the Existing Base. Again the most crowded part of the line would be from Imperial Wharf to West Brompton, where standing densities of 4.05 passengers / m² are forecast during the peak hour.
12.4.6 The addition of the Scenario 1 demand sees some small increases in standing densities with the greatest change being between Imperial Wharf and West Brompton where densities increase to 4.24 passengers/ m². This is an increase of 0.19 passenger / m² (4.6% increase). This equates to an average of around five additional passengers per carriage.
12.4.7 The Scenario 1 and 2 standing densities are virtually identical due to the relatively small additional demand from the Seagrave Road development.
12.4.8 The PM hour peak results are summarised in Table 12.13.
Table 12.13 West London Line Assessment – PM Peak Hour (1700-1800)
Existing2021 Base
2021 Dev
2031 Base
Scenario 1
Scenario 2
Imperial Wharf to West Brompton
3.30 1.64 1.65 2.08 2.13 2.14
West Brompton to Kensington Olympia
4.03 1.99 2.00 2.39 2.46 2.47
Kensington Olympia to West Brompton
5.34 3.81 3.83 4.15 4.16 4.15
West Brompton to Imperial Wharf
6.15 4.31 4.32 4.65 4.74 4.76
12.4.9 Comparing Tables 12.10 and 12.11, the PM standing densities are all higher than for the AM peak. The increases due to the Development are negligible. The largest changes occur between West Brompton and Imperial Wharf, where standing densities rise by only 0.09 passengers / m² (1.9% increase).

Application 2 Transport Assessment 121
12.4.10 The future standing densities with development are all significantly less than the Existing Base due to the increased line capacity.
12.5 IMPACTS - STATIONS
Station Flows
12.5.1 Background growth in passenger demand and the additional trips due to development scenarios will result in increased station entry and exit flows. These are presented below for each station in each peak 3 hour period which has been derived from the Railplan model. This comparison allows for the magnitude of change as a result of development Scenarios relative to the respective base to be viewed.
12.5.2 The station entry and exits differ from the trip generation forecasts set out in Section 7 due to the Railplan entry and exits being 3 hour forecast totals as opposed to 1 hour peak forecasts in Section 7. However and in addition, the methodology employed for this study involves an aggregate of all public transport trips being input into Railplan for assignment to the most appropriate public transport mode based upon its local calibration for Earls Court area. Therefore the flows into and out of stations will be a product of the Railplan assignment rather than the trip generation mode share forecasts set out in Section 7.
12.5.3 All forecast flows are based upon Railplan except for the existing base flows which are based on RODS surveys to accurately represent existing conditions.
12.5.4 It is acknowledged that the single peak hour flows will be proportionately higher and as such the 1 hour peak flows which have been agreed with London Underground have been used for station modelling. The one hour flows derived from Tables 11.10 and 11.12 to inform the modelling are included in Appendices Q.
Table 12.14 Station Flows – AM Peak Period (0700-1000)
Existing2021 Base
2021 Dev
2031 Base
Scenario 1
Scenario 2
Underground Passengers Earls Court Entries 8,880 10,535 11,480 11,065 12,215 12,409 Earls Court Exits 6,641 7,474 7,898 7,801 8,590 8,865 Earls Court Totals 15,521 18,009 19,379 18,866 20,805 21,274
West Ken Entries 2,586 2,906 2,906 3,054 3,521 3,590 West Ken Exits 1,578 1,657 1,661 1,719 2,183 2,333 West Ken Totals 4,164 4,563 4,566 4,773 5,704 5,923
West Brompton Entries 767 1001 1,000 1,045 1,571 1,649 West Brompton Exits 1,634 2,036 2,046 2,127 2,779 2,995 West Brompton Totals 2,401 3,037 3,046 3,172 4,351 4,644 West London Line Passengers West Brompton Entries 295 659 685 731 856 874 West Brompton Exits 723 1,090 1,109 1,131 1,396 1,488 West Brompton Totals 1,018 1,749 1,795 1,862 2,252 2,362

Application 2 Transport Assessment Earls Court 122
12.15 Station Flows – PM Peak Period (1600-1900)
Existing2021 Base
2021 Dev
2031 Base
Scenario 1
Scenario 2
Underground Passengers Earls Court Entries 8,032 9,394 9,941 10,409 11,185 11,422 Earls Court Exits 7,178 8,842 9,513 10,039 10,760 10,827 Earls Court Totals 15,210 18,236 19,454 20,448 21,945 22,249
West Ken Entries 1,986 2,101 2,095 2,227 2,687 2,843 West Ken Exits 1,935 2,090 2,086 2,182 2,617 2,686 West Ken Totals 3,921 4,191 4,181 4,409 5,304 5,529
West Brompton Entries 1,082 1,607 1,608 1,696 2,451 2,663 West Brompton Exits 1,037 1,379 1,367 1,480 1,888 2,020 West Brompton Totals 2,119 2,987 2,975 3,176 4,339 4,683 West London Line Passengers West Brompton Entries 686 1,551 1,590 1,605 1,938 2,043 West Brompton Exits 297 1,029 1,074 1,136 1,259 1,288 West Brompton Totals 983 2,580 2,664 2,741 3,197 3,331
12.5.5 At Earls Court, the AM peak growth between 2007 and 2021 is 16%. The 2021 Development changes two way flows by an additional 8%. During the PM peak period, growth between 2007 and 2021 is higher (20%) but the development change is less significant at an additional 7%. The growth between the existing AM peak period and 2031 is 22%. The Scenario 1 development changes two way flows by an additional 10% beyond this figure. During the PM peak period, growth between 2007 and 2031 is higher (34%) but the development change is less significant at an additional 7%. Scenario 2 which includes Seagrave Road sees an additional 469 passengers during the 3 hour AM peak period beyond the Scenario 1 test and 304 in the PM peak above the Scenario 1 assessment.
12.5.6 At West Kensington, the AM peak growth between 2007 and 2021 is 10%. The development changes flows by less than 1%. During the PM peak period, growth between 2007 and 2021 is 7% with the 2021 Development causing a slight reduction in 2 way flow which occurs as a result of better links to Earls Court through the development site from which the Piccadilly Line can be accessed. The AM peak growth between 2007 and 2031 is 15%. The Scenario 1 development changes in two way flows by an additional 20% beyond this figure. During the PM peak period, growth between 2007 and 2031 12% with the development change at an additional 20%. Scenario 2 which includes Seagrave Road sees an additional 12.4% during the 3 hour AM peak period beyond the 2031 Base and an increase of 28% in the PM peak compared to the 2031 Base.
12.5.7 London Underground demand at West Brompton Station sees AM peak growth between 2007 and 2021 of 27%. The 2021 Development does not change the forecast use of West Brompton significantly beyond this figure. During the PM peak period, growth between 2007 and 2021 is higher (41%) but again the 2021 development does not change the use of the station significantly in the PM peak. The AM peak growth between 2007 and 2031 is 32%. The Scenario 1 development changes in two way flows by an additional 37%. During the PM peak period, growth between 2007 and 2031 is higher at 50% with the Scenario 1 development seeing an additional 37% increase beyond this figure. Scenario 2 sees an AM peak 3 hour increase of 46% or 840 and 47% or 344 in the PM peak period.
12.5.8 For West London Line demand at West Brompton, the increase from the existing base to the 2021 Base is 72% in the AM peak and 162% in the PM peak. The change in station entry and exit flows from the 2021 Base (-) as a result of the 2021

Application 2 Transport Assessment 123
Development is a further 3% in both the AM and PM Peak periods. When these changes in flow are considered in conjunction with the flow changes resultant from changes in LUL passenger numbers, the total changes at West Brompton due to the development are forecast to be 1% in both AM and PM peaks.
12.5.9 The change in station entry and exit flows from the current base to the 2031 Base is 83% in the AM peak and 179% in the PM peak. The Scenario 1 development sees an additional 15% in the AM peak period and 12% in the PM peak. When these changes in flow are considered in conjunction with the flow changes resultant from changes in LUL passenger numbers, the total changes at West Brompton due to the development are forecast to be 31% in the AM peak and 27% in the PM peak. The Scenario 2 assessment which includes Seagrave Road sees 909 additional trips in the AM peak period and 134 in the PM peak.
Earls Court LEGION Analysis and Summary
12.5.10 These passenger flow changes for Scenario 2 the most onerous cumulative assessment have all been analysed using LEGION dynamic station capacity models approved by TfL. of the modelling outputs are provided in Appendix Q.
12.5.11 The existing AM peak model shows queue levels which are at their highest at the top of the stairs that lead down from the eastbound District Line platform to the mezzanine level. The 2031 Base and Scenario 2 show an increase from the existing pedestrian densities and queuing. These increases are focused on the western end of District Line platforms 1 and 2, and at the top of the Piccadilly Line escalator at the mezzanine level. Scenario 2 does not generate any new areas of passenger congestion and queuing above the 2031 Base.
12.5.12 Overall, the PM peak shows less congestion. The model shows minimal queuing in the 2031 Base and Scenario 2, with the exceptions of queuing for the lift up direction from the Piccadilly Line, which is considered acceptable.
12.5.13 In terms of mitigation proposals at Earls Court, the gatelines at both ticket halls would not be significantly impacted by the development proposals. The key constraint at this station is the interchange capacity between the Piccadilly Line and eastbound District Line platforms. The Applicant proposes the re-commissioning of the pedestrian tunnel entrance, accessed from the basement of the Earls Court Exhibition Centre. This proposal has been tested in LEGION (Appendix O) and shown to have a beneficial impact on passenger densities by reducing the number of passengers using the eastbound District Line platforms as a route to the Piccadilly Line Platforms. Around half of the future entry and exit flows could use the tunnel in preference to the Warwick Road gateline.
12.5.14 However, the mitigation proposals also include opening a currently unused set of stairs between the mezzanine level and platforms 1 and 2. As a result of the platforms clearing more quickly and passengers accessing the mezzanine level easier there is some increase in queuing LoS at the top of the Piccadilly Line escalator. Therefore LU should consider the option to open the additional stairs from platform level.
12.5.15 The overall effect of the Development on Earls Court station would therefore be beneficial.
West Kensington Legion Analysis and Summary
12.5.16 In both peak periods Scenario 2 would not generate any material change in passenger congestion and queuing.
12.5.17 In terms of mitigation requirements at West Kensington, an additional gate along the existing gateline would return passenger densities to below the 2009 levels. At its busiest the gateline would still clear within 2 minutes, in line with London

Application 2 Transport Assessment Earls Court 124
Underground’s Station Planning Standards and passenger journey times would be below the 2031 Base.
12.5.18 However, the Applicant proposes to deliver improvements beyond the mitigation identified and provide improvements that would include space for two additional gates at the existing North End Road entrance by relocating the GLAP to the store room adjacent to the gateline, This provides the required number of gates to more than accommodate the increase in demand resulting from the incremental impact of the development. The improvements in the ticket hall can be undertaken without carrying out major construction works to expand the station building.
12.5.19 In addition to the capacity increases at the existing station entrance, it is proposed to create a second entrance on a structural deck spanning over the eastern end of the platforms sufficient to accommodate the introduction of a standard LU passenger lifts, providing step free access to both platforms.
12.5.20 The LEGION modelling of the revised gateline and second entrance demonstrate that the combined proposals significantly reduce congestion forecast in the existing ticket hall from background growth and return it to a low Level of Service.
West Brompton Legion Analysis and Summary
12.5.21 In terms of passenger densities and queues within the station, the impact of Scenario 2 is less than the impact of background growth between 2009 and 2031.
12.5.22 In the AM peak the highest passenger densities within the station are at the gateline and on the West London Line platforms. In these areas there would be no material increase in densities under Scenario 2. However, queuing around the gateline would spread further and passenger densities on the West London Line northbound platform would increase slightly. Although densities at the base of the staircases would be high, each platform would be clear of alighting passengers prior to the next train arrival. Average journey times during the peak hour from platforms to the station exit would remain under two minutes in all scenarios. There would be no significant increase on the District Line platforms as a result of the increased demand.
12.5.23 During the PM peak the predominant flow would be entries as opposed to exiting passengers, and passenger densities on the unpaid side of the gateline would remain low. This is because the entries arrive in a less peaked profile. On the paid side of the gateline, passenger densities would increase due to increased number of passengers exiting in Scenario 2 but would still be less than those in the AM peak. During the PM peak the impact of Scenario 2 on these platforms is shown to be minimal. However, there would be high passenger densities on the West London Line platforms as passengers wait to board. These higher densities also reflect the large amount of conflicting movements from passengers interchanging with the District Line as well as those exiting the station.
12.5.24 In terms of mitigating the net cumulative development impact at West Brompton, an additional three ticket gates are proposed in conjunction with other improvements to the station which include delivering step free access throughout the station. The analysis with this mitigation shows relief in the AM peak with regards to queuing around the immediate gateline area. In the PM peak there is a consequent reduction in passenger densities at the gateline.
12.5.25 As stated in paragraph 12.1.9, work is continuing with TfL and London Rail on the modelling of West Brompton because of the following two reasons:
Platform lengthening and longer trains are planned on the WLL; and
New count data has been made available providing WLL boarders and alighters surveyed in November 2011.

Application 2 Transport Assessment 125
These changes will affect demand at the station, (although not the incremental demand associated with the development proposals), which may require alternative improvements strategies to be developed in conjunction with London Underground and London Rail.

Application 2 Transport Assessment Earls Court 126
13 Impacts – Walking and Cycling
13.1 INTRODUCTION
13.1.1 Section 7 and 9 of this report set out the travel demand associated with the development proposals in 2031 and 2021 respectively.
13.1.2 This section considers the impact of forecast pedestrian and cyclist demand on the pedestrian and cycle infrastructure in the area and the performance of the pedestrian and cycle networks in accommodating this demand.
13.1.3 In addition to the main mode pedestrian trips that have been forecast through the Trip Generation Model (Appendix L), it has been assumed that all public transport trips will also be walk trips are part of the first or final stage of their journey.
13.1.4 Impacts are considered for the following Scenarios which are consistent with all other modelling undertaken in this assessment. The interim years of 2017 and 2025 have not been considered at this stage for impact assessment:
2021: Site Wide Development Proposals in 2021
Scenario 1: Site Wide Development Option in 2031
Scenario 2: Site Wide Development Option plus Seagrave Road in 2031
13.2 FORECAST DEMAND - WALKING
13.2.1 The trip generation model forecasts the following changes in walking demand as a result of the 2021 Development, Scenario 1 and Scenario 2. These numbers relate to walking as a main mode and are set out in Table 13.1.
Table 13.1: Net Additional Main Mode Walk Trips
Development Scenario
2021 Scenario 1 Scenario 2
IN OUT IN OUT IN OUT
AM Peak Hour 212 291 848 738 868 822
PM Peak Hour 244 220 602 942 656 970
13.2.2 In addition to the demand generated by walking as a main mode, there will also be walking trips to and from stations and bus stops. The additional public transport trips generated are shown in Table 13.2.
Table 13.2: Net Additional Final Mode Walk Trips (include PT Demand)
Development Scenario
2021 Scenario 1 Scenario 2
IN OUT IN OUT IN OUT
AM Peak Hour 522 886 2633 2292 2696 2560
PM Peak Hour 679 587 1747 2733 1922 2823
13.2.3 These additional trips have been assessed for impacts on footway and crossing capacities.

Application 2 Transport Assessment 127
13.3 DISTRIBUTON OF INCREASED PEDESTRIAN DEMAND
13.3.1 For assessment purposes, it has been assumed that pedestrian flows are distributed between the adjacent corridors of North End Road, Lillie Road, Old Brompton Road, Warwick Road and the A4 West Cromwell Road in accordance with current base flows. This assessment has been undertaken for the AM peak which is a worst case for both background flows and the Site Wide Development Option demand.
13.3.2 The additional overground and underground trips are forecast to access West Brompton, West Kensington and Earls Court Stations respectively and this demand is additional to the footways on route to each of the stations. The station demand forecasts have been provided by Railplan before manual assignment to footways, using the Appendix R pedestrian model. The model has assigned trips to the most convenient routes to each station.
13.3.3 The additional bus demand has been assigned to the pedestrian footways to allow access to the bus stops closest to each of the separate sites. Again the bus assignment by direction has been undertaken using Railplan before manual assignment to bus stops and associated footways.
13.3.4 There is also a forecast increase in base flows due to background growth and this has been calculated through the use of TfL’s LTS model where existing flows have been factored using TfL’s LTS growth factor for pedestrian movements. This additional increase relates to other committed or approved schemes in the area and potential modal shift to walking and cycling.
13.3.5 Based on the method set out above, a summary of the distribution of all walk trips is shown in Figure 13.1 for the 2021 Base, 13.2 for the 2031 Base, 13.3 for the Interim 2021 development test, 13.4 for Scenario 1 plus the 2031 flows, and 13.5 for Scenario 2 plus 2031 Base flows respectively.
13.4 FOOTWAY CAPACITIES
13.4.1 TfL’s Pedestrian Comfort Guidance for London (2010) has been used to assess implications on footway capacity. The guide allows for development proposals to be assessed and any potential problems identified at an early stage and mitigation developed if required.
13.4.2 The guide states that ‘the aim of a pedestrian comfort assessment is to understand the pedestrian experience as people walk along the street’. Therefore a number of different locations along a street are considered to establish the level of comfort, and how this may be impacted by footway constraints.
13.4.3 The guide allows for a Pedestrian Comfort Level (PCL) to be calculated for each location, which ensures that a review of the whole site as well as individual problem areas can be undertaken. The PCLs are defined in Table 13.3:

Application 2 Transport Assessment Earls Court 128
Table 13.3: PCL Definitions (ppmm = Pedestrians Per Metre Per Minute)
Pedestrian Comfort Level A
A+ <3ppmm <3% Restricted Movement
A 3 to 5 ppmm 13% Restricted Movement
A- 6 to 8 ppmm 22% Restricted Movement
The pedestrian environment is very comfortable at PCL A+ to A- with plenty of space for people to walk at the speed and the route that they choose.
Pedestrian Comfort Level B
B+ 9 to 11ppmm 31% Restricted Movement
B 12 to 14ppmm 41%Restricted Movement
B- 15 to 17 ppmm 50% Restricted Movement
PCL B+ is the recommended level of comfort for all area types. This level provides enough space for normal walking speed and some choice in routes taken. At PCL B and B- normal walking speed is still possible but conflicts are becoming more frequent and, in retail areas, people start to consider avoiding that area.
Pedestrian Comfort Level C
C+ 18 to 20 ppmm 59% Restricted Movement
C 21 to 23 pmm 69% Restricted Movement
C- 24 to 26 ppmm 78% Restricted Movement
The pedestrian environment is becoming increasingly uncomfortable, with the majority of people experiencing conflict or closeness with other pedestrians and bi-directional movement becoming difficult.
Pedestrian Comfort Level D
27 to 35 ppmm 100% Restricted Movement
At PCL D walking speeds are restricted and reduced and there are difficulties in bypassing slower pedestrians or moving in reverse flows.
Pedestrian Comfort Level E
>35ppmm 100% Restricted Movement
At PCL E people have very little personal space and speed and movement is very restricted. Extreme difficulties are experienced if moving in reverse flows.
13.4.4 The guide requires a number of locations to be considered and these areas are classified as follows:
A location with the typical footway width for the site and no street furniture
Locations where full footway width changes, and there is no street furniture
Locations which include the typical street furniture
Locations where there are bus stops, cafes, market stalls or other locations where there are high levels of people waiting.
Locations where the street furniture is not aligned parallel to the building edge or kerb edge or there are more than two pieces within a length of three metres.
13.4.5 Applying this approach to the assessment has seen the following locations being identified for assessment:
Warwick Road North of crossing (western side); Bus Stop C
Warwick Road North of crossing (eastern side); Cycle Stands
Warwick Road South of crossing (western side); Signpost
Warwick Road South of crossing (eastern side); Cycle Stands
Old Brompton Road (southern side); Bus Stop O
Old Brompton Road (northern side); Bus Stop P
Old Brompton Road (southern side); Lamppost

Application 2 Transport Assessment 129
Lillie Road west of crossing (northern side)
Lillie Road west of crossing (southern side)
North End Road (eastern side) next to West Kensington Station
13.4.6 All of the above footway points are shown on Figure 13.6 and have been assessed, as summarised in Table 13.4. The full calculations are contained in Appendix R.
13.4.7 It should be noted that these assessments of future pedestrian flows outside the Earls Court Site boundary assume that existing pedestrian movement patterns in the area will continue into the future, despite opportunities people will have to re-route their trips through the Site Wide Development Option due to the increased permeability which the proposals will deliver. This permeability will widen the choice of pedestrian routes and should see the concentration of pedestrian flows reduce as people decide between the future routes. Therefore it can be considered that these assessments are robust but can help to identify where issues may be present in the future, the magnitude of the issues and the possible need for design solutions. The full calculations are contained in Appendix R.
Table 13.4 PCL Assessment
Location Existing Base
2021 Base
2021 Dev 2031 Base
Scenario 1
Scenario 2
Warwick Road North of crossing
(western side); Bus Stop C F F F F F F
Warwick Road North of crossing
(eastern side); Cycle Stands F F F F F F
Warwick Road South of crossing
(western side); Signpost A A A- A A- A-
Warwick Road South of crossing
(eastern side); Cycle Stands A A A A A A-
Old Brompton Road (southern
side); Bus Stop O) F F F F F F
Old Brompton Road (southern
side); Lamppost A+ A+ A+ A+ A A
Old Brompton Road (northern
side); Bus Stop P F F F F F F
Lillie Road west of crossing
(northern side) F F F F F F
Lillie Road west of crossing
(southern side) F F F F F F
North End Road (eastern side)
next to West Kensington Station F F F F F F
13.4.8 Table 13.4 indicates that only three of the pinch points surveyed provide sufficient footway dimensions to achieve the minimum B+ rating. The other locations require widening to achieve the widths shown in Table 13.5, either by moving street furniture to increase the clear widths or by widening the footways. The TfL PCL assessment criteria require a clear width of 1.5 metres in order to avoid an F PCL score.

Application 2 Transport Assessment Earls Court 130
Table 13.5 PCL Width Requirements
Location Existing Base
2021 Base
2021 Dev 2031 Base
Scenario 1
Scenario 2
Warwick Road North of crossing
(western side); Bus Stop C 1.50 1.50 1.50 1.50 1.50 1.50
Warwick Road North of crossing
(eastern side); Cycle Stands 1.50 1.50 1.50 1.50 1.50 1.50
Warwick Road South of crossing
(western side); Signpost 1.50 1.50 1.50 1.50 1.50 1.50
Warwick Road South of crossing
(eastern side); Cycle Stands 1.50 1.50 1.50 1.50 1.50 1.50
Old Brompton Road (southern
side); Bus Stop O) 1.50 1.50 1.50 1.50 1.50 1.50
Old Brompton Road (southern
side); Lamppost 1.50 1.50 1.50 1.50 1.50 1.50
Old Brompton Road (northern
side); Bus Stop P 1.50 1.50 1.50 1.50 1.50 1.50
Lillie Road west of crossing
(northern side) 1.50 1.50 1.50 1.50 1.50 1.50
Lillie Road west of crossing
(southern side) 1.50 1.50 1.50 1.50 1.50 1.50
North End Road (eastern side)
next to West Kensington Station 1.50 1.50 2.14 1.50 2.41 2.43
13.5 CROSSING CAPACITIES
13.5.1 The forecast pedestrian crossing demand from the Site Wide Development Option has been assessed for the Warwick Road pedestrian crossing to Earls Court station and the Old Brompton Road crossing to West Brompton station. Figure 13.1 shows these to be the most significant pedestrian desire lines
13.5.2 According to Local Transport Note 2/95 “The Design of Pedestrian Crossings”, the minimum width (between the two rows of studs) for a Zebra, Pelican or Puffin pedestrian crossing should be 2.4 metres. If the crossing is of the Toucan type, or is used by a substantial number of cyclists on foot, the minimum width should ideally be 4 metres.
13.5.3 Where pedestrian flows over 600 per hour are encountered wider crossings should be used, up to have a maximum width of 10 metres for Pelican crossings. The Traffic Signs Manual Chapter 5 recommends an additional width of 0.5m above the 2.4m minimum for each 125 pedestrians / hour above 600.
13.5.4 Tables 13.6 and 13.7 summarise the pedestrian crossing flows and the required crossing widths under each scenario.

Application 2 Transport Assessment 131
Table 13.6 Warwick Road Crossing – Traffic Signs Manual Assessment
Existing Base 2021 Base 2021
Development2031 Base Scenario 1 Scenario 2
Two-Way Flow (ped/hr)
542 582 2122 582 2305 2449
Width Required (m)
2.4 2.4 8.5 2.4 9.2 9.8
Table 13.7 West Brompton Crossing – Traffic Signs Manual Assessment
Existing Base 2021 Base 2021
Development2031 Base Scenario 1 Scenario 2
Two-Way Flow (ped/hr)
550 591 1210 591 1347 1503
Width Required (m)
2.4 2.4 4.8 2.4 5.4 8.2
13.5.1 The results suggest that the Old Brompton Road crossing would require widening from its current 3.0m width to 8.2m but that the Warwick Road crossing would not require widening above its existing 10m width (which is the limit of current standards for crossing widths).
13.5.2 As a further check, TfL’s Pedestrian Comfort Guidance for London (2010) has also been used. This guide can be used to calculate a Pedestrian Comfort Level (PCL) for each crossing, using a number of geometric and temporal inputs for pedestrian crossing widths.
Table 13.8 Warwick Road Crossing - PCL Assessment
Existing
Base 2021 Base
2021 Development
2031 Base Scenario 1 Scenario 2
Warwick Road Crossing
A A B+ A B+ B
13.5.3 The above assessment indicates that the crossing width would be satisfactory for the Site Wide Development Option and the Site Wide plus Seagrave Road Development Option
Table 13.9 West Brompton Crossing - PCL Assessment
Existing
Base 2021 Base
2021 Development
2031 Base Scenario 1 Scenario 2
West Brompton Crossing
A A- B A- B- B-
13.5.4 The above assessment indicates that the West Brompton crossing is more constrained and less able to accommodate increased demand than the Warwick Road crossing, due to its existing 3m width. PCL analysis indicates that this crossing provides a B- PCL rating with Scenario 2 and would need to be increased to 4.4m in order to achieve the target B+ PCL rating.
13.5.5 It is proposed to increase the crossing width to at least 5m.

Application 2 Transport Assessment Earls Court 132
13.6 FORECAST CYCLING DEMAND
13.6.1 The addition of Development demand will see cycle flows increase, as summarised by Table 13.10.
Table 13.10 Additional Cycle Trips
Development Scenario
2021 Development Scenario 1 Scenario 2
IN OUT IN OUT IN OUT
AM Peak Hour 37 62 107 155 111 174
PM Peak Hour 28 21 69 82 77 86
13.6.2 The London Plan 2011 Policy 6.9 sets out the intention to bring about a significant increase in cycling, so that it accounts for at least 5 per cent of modal share by 2026. The above forecasts equate to some 2-4% and a 5% modal share would involve some 300 additional cycling trips per hour.
13.6.3 There is no standard capacity assessment method for cycling and meanwhile a range of TfL and Borough initiatives are being progressed in order to encourage a significant increase. The Cycle Superhighways and other improvement to the cycle network will involve a change to the routing and distribution of future cycle trips, so a quantitative analysis of cycling impact is impractical.
13.6.4 The Development will incorporate extensive cycling facilities and it is proposed that financial contributions will be made towards cycling initiatives, as summarised in the “Mitigation” section.

Application 2 Transport Assessment 133
14 Mitigation
14.1 WALKING AND CYCLING
14.1.1 The Site Wide Development Option has been shown to generate increased pedestrian demand on the Warwick Road crossing to Earls Court station and on the Old Brompton Road crossing to West Brompton station. It would also result in increased footway flows on North End Road, along the Old Brompton Road / Lillie Road corridor and along the A4 footways.
14.1.2 The Warwick Road and West Brompton crossings are proposed for inclusion in the Application 1 S106. Application 2 includes mitigation in the form of a new Toucan crossing and associated pedestrian and cyclist improvements on North End Road near Star Road, and improved pedestrian crossing facilities at the North End Road / Lillie Road junction.
14.1.3 The proposals for the North End Road / Lillie Road junction involve its conversion from a double mini-roundabout with poor pedestrian crossing facilities into a four-arm signal controlled junction with direct pedestrian crossings along the relevant pedestrian desire lines.
14.1.4 The Application also proposes the widening of the eastern footway on North End Road south of the West Kensington station access, and the widening of footways on both sides of Lillie Road west of Lillie Bridge.
14.1.5 In terms of proposed mitigation the following elements have been identified:
off-site pedestrian improvements, as part of a comprehensive public realm strategy for the surrounding area including interchanges and movement corridors. This is envisaged to include improvements along Lillie Road, North End Road and the A4 (in addition to the Old Brompton Road, Earls Court Road and Warwick Road improvements associated with Application 1) by providing dropped kerbs and facilities to aid sensory and mobility impaired users, and the removal or rationalisation of unnecessary street furniture
off-site cyclist improvements, envisaged to include improvements to existing routes and the delivery of new routes at locations around the Application 2 site, such as Star Road (in addition to the routes associated with Application 1, such as Old Brompton Road, Trebovir Road and Penywern Road). In combination the these improvements would form part of a cycling link between Hammersmith and Earls Court town centres
a wayfinding strategy for the local area, in accordance with Legible London guidelines (subject to viability)
provision of Barclays Cycle Hire stations within the development (subject to viability)
14.2 PUBLIC TRANSPORT
14.2.1 The Site Wide Development Option has been shown to generate public transport demand on the bus network and on the underground and overground rail networks. It has been shown that the District, Circle, Piccadilly and West London Line services would all have sufficient capacity to carry the passenger demand. However, the stations will require additional passenger capacity, the nearby bus facilities require some improvement and there are opportunities to improve the interchange

Application 2 Transport Assessment Earls Court 134
and public realm quality at the rail stations including the provision of additional cycle parking.
14.2.2 The proposed mitigation measures are summarised as follows.
Buses
the improvement of bus stops on North End Road and Lillie Road (in addition to the bus stops on Old Brompton Road, Warwick Road and Earls Court Road which are associated with Application 1)
new bus stops within the Development
new bus layover and driver facilities within the Development, to be provided in accordance with a specification agreed with TfL
a financial contribution by way of a Net Deficit Funding Agreement for the improvement of existing bus routes or to establish new bus routes, to be agreed with TfL
Earls Court Station
14.2.3 The mitigation set out in Section 12 relates to the restricted interchange capacity between the Piccadilly Line and eastbound District Line platforms and therefore the re-commissioning of the pedestrian tunnel entrance, accessed from the basement of the Earls Court Exhibition Centre is proposed. This proposal has been tested in LEGION and shown to have a beneficial impact on passenger densities by reducing the number of passengers using the eastbound District Line platforms as a route to the Piccadilly Line Platforms. Around half of the future entry and exit flows could use the tunnel in preference to the Warwick Road gateline.
14.2.4 To progress this inclusion and mitigation further Farrells have undertaken a design exercise that has worked to create a new, efficient entrance to Earls Court station from within the scheme proposals and to ensure this entrance is highly visible and legible from key routes and desire lines, subject to:
The consideration of heritage elements
Structural constraints
Existing site conditions and infrastructure
Investigation for the potential of step free access to platforms
The integration with the existing layout and workings of the station
The proposal being viable and balanced against the overall package of planning application benefits and mitigation measures
14.2.5 The preferred option proposes to follow the path of the existing stairs (retained) and corridor from the ticket hall (these would need to be demolished and rebuilt). The new corridor leads to a new stair rising at the base of plot WV03 (currently proposed as hotel use). This new entrance is located on the High Street.
14.2.6 The scheme would not provide for step free access, as per current arrangement, due to complex existing constraints associated with structure, heritage and levels. Step�free access to Earls Court Station available from Warwick Road and Earls Court Road entrances
14.2.7 It is considered that the scheme would enhance the pedestrian experience through a new legible station located on the High Street whilst the location and provision of the additional access will improve congestion within Earls Court station.
14.2.8 The Farrell’s Design Report is included in Appendix U.

Application 2 Transport Assessment 135
West Brompton Station
14.2.9 EC Properties wish for West Brompton Station to be a gateway to the development and it is therefore been deemed necessary to deliver improvements beyond the mitigation identified in Section 12 of this report. The mitigation previously identified relates to increases in gate capacity to accommodate additional passenger demand at Levels of Service comparable to what would be experienced in 2031 without development. The following improvements deliver benefits beyond what would be required to mitigate the additional impacts of the development proposals.
14.2.10 EC Properties have instructed Aedas has undertaken a study of potential enhancement opportunities at West Brompton station to RIBA Stage C supported by additional LEGION modelling, carried out by Halcrow. The study has identified areas of the station that would benefit from capacity enhancement under current conditions, through increasing the number of gates at the ticket hall, and the widening of stairs and passageways.
14.2.11 The objectives of the study were to :
Understand the potential to increase station capacity relevant to passenger growth forecasts and assessment of the proposed Earls Court Development;
To understand the potential for the provision of full step free access between platforms and the ticket hall;
To understand the provision for improvements to the station’s appearance through general refurbishment of the entrance and ticket hall.
14.2.12 Each of the above objectives was considered whilst taking into account the constraints associated with the station's Listed Building status.
14.2.13 A preferred solution for the purpose of presentation to consultees has been reached. Arup has been consulted with regarding the structural feasibility of preferred option, and has offered recommendations that have been recorded in the report. The preferred option is summarised as follows:
A rationalised ticketing suite with increased ticket hall area
3 no. new gates that align with the arched openings in the back wall of the station.
Maximum increase in ticket hall capacity, given the physical constraints of Grade II listed building envelope.
The expansion of the public area of the ticket hall is dependent on the connecting of the Ticket Business and the Station Control Room.
The proposal will include relatively small scale builder’s work to rearrange the layout of the blockwork walls, doorways and ticket issuing windows. The works will also include relocation of a number of power and communications services in the two rooms.
It is envisaged that these works will require a weekend closure to migrate the ticket issuing windows and services.
14.2.14 In addition to gateline and concourse capacity increases, it is proposed to address the step free access deficiencies of Platform 1.
14.2.15 Through the removal of the existing ramp that connects the existing footbridges, and relocating it to the opposite side of the train shed, adjacent to the 1.4m stair linking the first footbridge with platform 2, a narrow through-lift can be inserted into the space created by removal of the ramp from its exiting location.

Application 2 Transport Assessment Earls Court 136
14.2.16 At platform level the lift accesses the space between the base of the 1.4m stair and the train shed wall. A barrier will prevent passengers from accessing the space under the stair and the non-public end of the platform.
14.2.17 Given the very limited width of the space for inserting the passenger lift, it is not possible to provide a standard London Underground Category 1 type passenger lift that has 1100mm clear width doors. Research has revealed that a maximum clear width opening of between 800mm and 900mm is available for lift installations up to an overall width of 2100mm. However, 800mm doors are acceptable for wheelchair access, as outlined in Part M of the Approved Building Regulations.
14.2.18 The London Underground Accessibility and Inclusion Manager has been consulted regarding this matter and has provided approval in principle to a lift with 800mm doors given the physical site constraints.
14.2.19 The Aedas Design report is included in Appendix U.
West Kensington Station
14.2.20 EC Properties wish for West Kensington Station to be a gateway to the development and it is therefore been deemed necessary to deliver improvements beyond the mitigation identified in Section 12 of this report. In terms of mitigation requirements at West Kensington, an additional gate along the existing gateline would return passenger densities to below the 2009 levels. At its busiest the gateline would still clear within 2 minutes, in line with London Underground’s Station Planning Standards and passenger journey times would be below the 2031 Base.
14.2.21 The proposed improvements to the station have been developed by Aedas and designed to RIBA Stage C and have been supported through dynamic passenger modelling assessment carried out by Halcrow. The objectives of the study have been:
Appropriate capacity expansion of the station to accommodate growth over time;
The provision of full step free access between all platforms and the ticket hall;
Improvements to the station’s appearance through general refurbishment of the entrance and ticket hall.
14.2.22 The preferred station enhancement option developed represents a robust outline design based upon the current information available and includes for the following gateline capacity increases:
Creates space for two additional gates by relocating the GLAP to the store room adjacent to the gateline, and relocating the existing retail tenancy to a recess in the station façade. Minor builders works will be required to carry out three main operations.
14.2.23 This preferred option provides the maximum additional number gates that can be accommodated in the ticket hall without carrying out major construction works to expand the station building.
14.2.24 It is considered that the works to carry out the ticket hall amendments can be carried out in a relatively short timescale, subsequent to detailed design and approval of proposals from all relevant parties.
14.2.25 In addition to the capacity increases at the existing station entrance, it is proposed to create a second entrance on a structural deck spanning over the eastbound and westbound platforms. The overall width of the deck is such that it allows 6m of width on each platform, accommodating the width of a standard LU passenger lift with 3m remaining between the external face of the lift and the platform edge.

Application 2 Transport Assessment 137
14.2.26 The proposed entrance is accessed from the West Cromwell Road (or has the flexibility to be accessed from within the masterplan) using a steel structure bridge.
14.2.27 A dynamic passenger model of the combined works to the existing ticket hall and second entrance proposals have been carried out by Halcrow.
14.2.28 The results (shown in the West Kensington Design Report – Appendix U) demonstrate that the combined proposals significantly reduce congestion in the existing ticket hall, returning it to a low Level Of Service.
14.2.29 Although there is no congestion shown at the gateline of the proposed second entrance, the width of the new concourse allows for the introduction of several additional gates in the future, should they be required to handle increased passenger flow from the West Kensington Village development.
14.2.30 The addition of two additional gates in the existing ticket hall, without the introduction of the second entrance, will also reduce congestion at the existing gateline, in accordance with the initial dynamic passenger modelling report by Halcrow
14.3 HIGHWAY NETWORK
14.3.1 The highway network analyses show that the highway network would accommodate the Site Wide Development Option traffic, subject to the implementation of appropriate mitigation measures as discussed in section 10.
14.3.2 As part of this modelling, the 2021 and 2031 traffic signal timings for the Base and the development options have been adjusted at the following junctions across the network in order to improve the coordination and performance of the local highway network :
A4 /North End Road
A4 / Warwick Road
A4 Earls Court Road
Earls Court Road / North End Road
Earls Court Road / Earls Court Square
Old Brompton Road / Finborough Road.
14.3.3 This is consistent with the Mayor’s objective to smooth traffic flows (London Plan Policy 6.11). This optimisation of signal timings can be undertaken through TfL’s SCOOT system, subject to agreement with TfL.
14.3.4 In addition to the proposed signalisation of the Lillie Road / North End Road junction and the provision of north-south and east-west through routes to improve route choice on the surrounding highway network, highway mitigation is proposed as follows:
a left turn filter from North End Road into the A4 westbound. This would run in conjunction with the right turn from the A4 into North End Road
improve signal staging at the A4 / Warwick Road junction so that the pedestrian crossings run each cycle, and more time can be given to main movements in the signal plan
accommodating the left turn from North End Road into Lillie Road and the right turn from Lillie Road into North End Road on the new highway network within the Development, with these movements being banned at the proposed signalised junction

Application 2 Transport Assessment Earls Court 138
14.3.5 The accident analysis has found clusters of pedestrian, cyclist and motorcyclist accidents along Lillie Road and North End Road during hours of darkness, so it is proposed to improve street lighting as part of the access designs and to make financial contributions for lighting improvements as part of the public realm strategy.
14.3.6 As part of subsequent and more detailed work streams and as part of S106 Public Realm contributions, consideration will be given to any A4 streetscape improvements.
14.4 FRAMEWORK TRAVEL PLAN
14.4.1 It was agreed with TfL during scoping discussions that a single Framework Travel Plan should be submitted with Applications 1 and 2. This has been prepared in draft using TfL’s guidance document “Travel Planning for New Development in London”, February 2011 and is in Appendix S.
14.4.2 The proposals are listed below, and divided into “Hard” and “Soft” measures. The Hard measures are those which have been designed into the proposals and involve the provision of built facilities, whereas the Soft measures are management proposals to support a Smarter Choices programme.
‘HARD’ MEASURES - SUSTAINABILITY THROUGH DESIGN
14.4.3 In order to encourage sustainable travel patterns from the outset, a number of design principles have been incorporated into the development and these are set out below, avoiding duplication with the items specified earlier in this section.
Direct connections to existing cycle routes at the site perimeter
Provide space for Barclays Cycle Hire stations
Create two-way streets to encourage cycling
Provide a range of complementary land uses and facilities on the site
Facilitate on-site changing, storage and showering for all employment land uses to encourage cycling
Minimise commercial parking supply
Incorporate good quality public realm design for all areas
‘SOFT’ MEASURES
Provide financial incentives for cycling through bike loans and cycle vouchers
Consider car parking charges as part of a car park management strategy
Provide on-site management to operate concierge facilities and delivery management strategy
Extend / adapt the existing Controlled Parking Zone
Establish a Streetcar car club
Develop a Low Emission Vehicle Strategy
Produce of a Travel Pack to ensure all prospective occupiers are fully aware of their sustainable transport choices
Appoint a Travel Plan Coordinator (TPC)
Provide a personalised journey planning service to promote sustainable transport choices to all occupiers.

Application 2 Transport Assessment 139
14.4.4 The Framework Travel Plan was assessed by TfL using the ATTrBuTe assessment method, scoring 36 points out of 38 and passing the assessment.
14.5 FRAMEWORK DELIVERY AND SERVICING PLAN
14.5.1 It was agreed with TfL during scoping discussions that a single Framework Delivery and Servicing Plan should be submitted with the planning applications. This has been prepared in draft and is in Appendix T.
14.5.2 The Plan sets out a management strategy to encourage the efficient and sustainable movement of goods and deliveries and to reduce transport impacts associated with servicing. It has the following objectives:
Demonstrate that goods and services can be delivered, and waste removed, in a safe, efficient and environmentally-friendly way;
Identify deliveries that could be reduced, re-timed or even consolidated, particularly during busy periods;
Improve the reliability of deliveries to the site;
Reduce the operating costs of building occupants and freight companies; and
Reduce the impact of freight activity on local residents and the environment.
14.5.3 The proposals include the following draft measures and the subsequent detailed proposals will be developed once the end users and onsite strategy elements and contracts are agreed :
Servicing Restrictions
Security Measures
Secure Delivery Drop-off Facilities
Accommodating Special Deliveries
Freight Operator Recognition Scheme
Consolidation of Suppliers
Delivery Restrictions and Enforcement
Promotion of Freight Information Portal
Communication of Delivery Procedures
Workplace Servicing Booking / Management Strategy
Out of Hours Deliveries
Staff Training Requirements and Responsibilities
Waste Reduction, Storage and Removal Measures
Refuse Collection Procedures
Delivery and Collection Frequencies
Encouraging Deliveries by Sustainable Modes
14.6 FRAMEWORK CONSTRUCTION LOGISTICS PLAN
14.6.1 It was agreed with TfL during scoping discussions that a single Framework Construction Logistics Plan should be submitted with the planning applications. This is in Appendix N.

Application 2 Transport Assessment Earls Court 140
14.6.2 The Plan sets out a management strategy to better manage all types of freight vehicle movement to and from the Earls Court construction sites. It has the following objectives:
Demonstrate that construction materials can be delivered, and waste removed, in as safe, efficient and environmentally-friendly way as practicable;
Identify deliveries that could be reduced, re-timed or even consolidated, particularly during peak periods;
Help cut congestion on local roads;
Improve the reliability of deliveries to the site; and
Reduce freight operators’ fuel consumption.
14.6.3 The CLP objectives will be achieved through a set of proposed delivery and servicing management measures and initiatives to ensure that construction and servicing of the Earls Court Site can be carried out efficiently, minimising negative impacts upon the local highway network, residents and commercial occupiers within and surrounding the site, and the environment.
14.6.4 The proposed measures include:
Parking – on-site parking for construction workers will be restricted as there will be a general policy of not providing any car parking on the site.
Deliveries – all on-site construction deliveries will be pre-arranged and pre-booked as part of the efficient operation of construction work.
Design - providing secure drop off facilities to reduce the number of failed trips and encourage out-of-hours deliveries;
Procurement Strategy – contracting operators registered with a best practice scheme such as FORS;
Operational Efficiency – agreeing core hours of construction;
Waste Management - reducing the amount of waste generated and exported from the site and all principal and trade contractors will be required to produce a construction Site Waste Management Plan (SWMP) on a phase by phase basis;
Traffic Management - the proposed construction vehicle access routes will be agreed with TfL, RBKC and LBHF; the routing will avoid using minor roads as far as possible and will specifically avoid residential roads adjoining the sites to ensure that delivery vehicles have minimal impact on surrounding roads;
Pedestrian Routing – pedestrians will be kept separate from the deconstruction, demolition and construction activities at all times through rerouting pedestrian thoroughfares or providing temporary footpaths where required to be agreed with TfL, RBKC and LBHF;
Construction Sustainability - phase specific CEMPs will be developed for the construction phases and will include a strategy for minimising carbon emissions; and
Monitoring and Review – a programme of monitoring and review of construction activity to the site will be the responsibility of the principal contractor for each development of the full ECWKOA, and available to TfL, RBKC and LBHF upon request.

Application 2 Transport Assessment 141
15 Conclusions
15.1 THE ON-SITE PROPOSALS
15.1.1 The proposals for the Site Wide Development Option have been guided by a sustainable transport strategy, which is to be realised through a combination of design and management measures.
15.1.2 The Earls Court Site is currently impermeable due to the West London Line and other rail infrastructure being a barrier to east-west and north-south pedestrian and cyclist movements. The detailed access and outline layout proposals address this by creating a permeable network of pedestrian and cyclist routes throughout the site, including a new east-west route across the West London Line. This will improve connectivity and travel choices for the surrounding communities as well as for the new Development. By reducing walking distances for LBHF residents to Earls Court and West Brompton stations, this permeability will also increase Public Transport Accessibility Levels.
15.1.3 The access strategy is based on the need to provide for permeable movement by all modes and to allow for the development to be built out in phases. Access will be provided to the site from North End Road, Old Brompton Road, Warwick Road, Lillie Road and directly from the A4 with all street level vehicle accesses shared with pedestrians and cyclists and supplemented by some pedestrian/ cyclist only accesses. The Development would provide a highly walkable environment, to be integrated with existing and improved walking and cycling routes to provide attractive and easy connections to and from the area.
15.1.4 It would encourage cycling by creating a new east-west through route, to form part of a cycling link between Hammersmith and Earls Court town centres, and potentially beyond. The development would have a high standard of on-site cyclist facilities including convenient and secure cycle parking for all occupiers and visitors, plus showering, changing and storage areas for cycling gear in the workplaces. In addition, provision is being made for Barclays Cycle Hire stations to be established within the Earls Court Site. It is concluded that this development would be an exemplar project to establish a cycling culture.
15.1.5 The development would include residential car parking in accordance with London Plan standards to match the anticipated level of car ownership, so that off-site parking pressures would not be generated on the surrounding roads. Meanwhile, non-residential parking would be constrained as part of the strategy to reduce the amount of cars being attracted into the Development.
15.1.6 The on-site parking provision would meet the requirements of Blue Badge holders and provide for a Car Club to be established so that all occupiers had access to the shared use of pay-as-you-go vehicles. The viability of this Car Club has been confirmed by a Streetcar viability report.
15.1.7 Provision is also made for electric vehicle charging, with 20% of non-residential spaces and up to 40% of all residential parking spaces being able to facilitate electric vehicle charging. In addition, rapid charge points are proposed among the on-street parking spaces for the benefit of short stay visitors.
15.1.8 A management strategy has been developed to encourage the efficient and sustainable movement of goods and deliveries. This would reduce the transport impacts associated with servicing so that goods and services can be delivered, and waste removed, in as safe, efficient and environmentally-friendly way as practicable.

Application 2 Transport Assessment Earls Court 142
15.1.9 The access layouts and proposed highway alterations have been the subject of Stage 1 Road Safety Audits. The Safety Audit recommendations have been reviewed, and they can all be addressed as the access designs progress towards more detailed layouts.
15.1.10 The internal road layout has been designed in line with Manual for Streets principles, along with TfL’s Streetscape Guidance 2009 and Borough guidance. The Design Guidelines for the Development include details such that pedestrians and cyclists are prioritised with permeable movement throughout the site encouraged by shared surface spaces with at-grade pedestrian crossings and routes. It is expected that the predominant desire for movement would be to West Kensington, Earls Court and West Brompton stations and the street configuration responds to these desire lines.
15.1.11 Overall, it is concluded that the on-site proposals encourage sustainable travel patterns from the outset, and these would be reinforced through the Framework Travel Plan measures to encourage sustainable transport, and provide a basis for monitoring the actual movement patterns which result from the Site Wide Development Option.
15.2 ROAD NETWORK
15.2.1 The highway network analyses in section 10 show that the highway network would accommodate the Site Wide Development Option traffic.
15.2.2 As part of this assessment, the 2021 and 2031 traffic signal timings for the Base and the development options have been adjusted at a number of junctions across the network in order to improve the coordination and performance of the local highway network. This is consistent with the Mayor’s objective to smooth traffic flows (London Plan 2011 Policy 6.11). This optimisation of signal timings can be undertaken through TfL’s SCOOT system, subject to agreement with TfL.
15.2.3 In addition to the proposed signalisation of the Lillie Road / North End Road junction and the provision of north-south and east-west through routes to improve route choice on the surrounding highway network, highway mitigation is proposed as follows:
a left turn filter from North End Road into the A4 westbound. This would run in conjunction with the right turn from the A4 into North End Road
improve signal staging at the A4 / Warwick Road junction so that the pedestrian crossings run each cycle, and more time can be given to main movements in the signal plan
accommodating the left turn from North End Road into Lillie Road and the right turn from Lillie Road into North End Road on the new highway network within the Development, with these movements being banned at the proposed signalised junction
15.2.4 It should be noted the Development VISSIM models each accommodate more traffic movements than are generated by the Development. This is due to improvements in network performance resulting from the Development mitigation, which then attract some of the Base traffic from other parts of the wider road network. As such, the assessment is testing more than just the impact of Development traffic.
15.2.5 The analyses show some increases in journey times along the A4. It should be noted that the VISSIM models cannot fully simulate the journey time benefits arising from SCOOT signal optimisation and coordination and that the A4 journey times with the Development would therefore be faster than forecast by the VISSIM models.

Application 2 Transport Assessment 143
15.2.6 It is envisaged that further detailed traffic modelling will be required in due course as part of the standard TfL process for procuring new traffic signals and altering existing signals after the acceptability in principle of the Development has been established.
15.2.7 The accident analysis has found clusters of pedestrian, cyclist and motorcyclist accidents along Lillie Road and North End Road during hours of darkness, so it is proposed to improve street lighting as part of the access designs and to make financial contributions for lighting improvements as part of the public realm strategy.
15.3 LONDON UNDERGROUND
15.3.1 The Development has good access to West Kensington, Earls Court and West Brompton stations. West Kensington station provides a total of 27 services in the peak hour with onward connections to destinations across London via the District and Piccadilly Lines at Earls Court and Barons Court stations. Earls Court provides a total of 84 services per hour across the District and Piccadilly Lines which provide access across London including Richmond, Westminster Heathrow, Ealing Broadway and Uxbridge. West Brompton station provides a total of 28 services in the peak hour with onward connections to destinations across London via the District and Piccadilly Lines at Earls Court station, and overground rail services at Wimbledon.
15.3.2 The Piccadilly and District Lines are to be upgraded in line with the Mayor’s Transport Strategy and this will involve increased train frequencies and improvements to rolling stock to deliver passenger capacity increases of up to 19% on the District Line and 30% on the Piccadilly Line.
15.3.3 The implications of these improvements, future background growth in passenger numbers, and the implications of the Development plus the cumulative impact scenarios have all been studied using TfL’s Railplan model. The key performance indicator for assessing the capacity of underground trains is the density of standing passengers on each section of line between stations.
15.3.4 In the existing situation the AM peak is the busiest period, when the Fulham Broadway to Earls Court section of the District Line has a standing density above 4 passengers / sqm.
15.3.5 Overall crowding levels in the 2031 Base would be similar to the existing situation despite a background growth in passenger numbers of 26%. This is due to the increases in capacity provided by the District and Piccadilly Line upgrades. The most crowded part of the 2031 Base local network is the District Line between Fulham Broadway and Earls Court in the AM peak, where standing densities of 4.7 passengers / sqm are forecast during the peak hour. However, the development scenarios result in minor change, with the highest increases in standing densities being only 0.1 passenger / sqm. Greater changes would occur in the PM peak between Earls Court and West Brompton, and on the Piccadilly Line between Knightsbridge and Hyde Park Corner where standing densities increase by 0.6-0.7 passengers / sqm. However the PM peak would still have lower passenger densities than the AM peak.
15.3.6 In addition to analysing the underground line capacities using Railplan, the assessment has considered the impact of passenger growth on West Kensington, Earls Court and West Brompton stations.
15.3.7 At Earls Court station, the AM peak growth between 2007 and 2031 is 22%. The Site Wide Development Option would add an additional 10%. The PM peak growth between 2007 and 2031 is higher at 34%, and the Site Wide Development Option would add an additional 7%. In both peaks, the Seagrave Road proposals add only a small increase between Scenarios 1 and 2.

Application 2 Transport Assessment Earls Court 144
15.3.8 At West Kensington station, the AM peak growth between 2007 and 2031 is 15%. The Site Wide Development would add an additional 20%. The PM peak growth between 2007 and 2031 is less at 12%, and the Site Wide Development Option would add an additional 20%. In both peaks, the Seagrave Road development has negligible impact.
15.3.9 At West Brompton station, the underground AM peak growth between 2007 and 2031 is 32%. The Site Wide Development Option would add an additional 37%. The PM peak growth between 2007 and 2031 is higher at 50%, and the Site Wide Development Option would add 37%. In both peaks, the Seagrave Road development adds roughly 3% more demand.
15.3.10 The West London Line entry and exit flows at West Brompton station show AM peak growth between 2007 and 2031 which is 83% in the AM peak and 179% in the PM peak. The Site Wide Development Option would then add 15% to the AM peak and 12% to the PM peak. The Seagrave Road development would add roughly 2% more demand to each peak.
15.3.11 These passenger flow changes have all been analysed using LEGION dynamic station capacity models approved by TfL. The 2031 flows were all input to a LEGION pedestrian simulation model to assess their impact. This model has been audited by TfL and the modelling methodology agreed with Network Rail. Details of the modelling are provided in Appendix Q.
15.3.12 These passenger flow changes have all been analysed using station capacity models approved by TfL.
15.3.13 At West Kensington station, Scenarios 1 and 2 do not generate create any material change in passenger congestion and queuing. In both peak periods the increase in passenger densities at can be attributed to the forecast background growth between 2009 and 2031 without the development. In terms of mitigation proposals at West Kensington, an additional gate along the existing gateline would return passenger densities to below the 2009 levels, and the gateline would clear within 2 minutes, in line with London Underground’s Station Planning Standards. Passenger journey times would be below the 2031 Base.
15.3.14 At Earls Court station, Scenarios 1 and 2 do not generate create any new areas of passenger congestion and queuing. In terms of mitigation proposals at Earls Court, the gatelines at both ticket halls run with sufficient capacity and no ticket hall alterations are likely to be required. The key constraint at this station is the interchange capacity between the Piccadilly Line and eastbound District Line platforms. Application 1 proposes the re-commissioning of the pedestrian tunnel entrance, accessed from the basement of the Earls Court Exhibition Centre. This proposal would have a beneficial impact on passenger densities by reducing the number of passengers using the eastbound District Line platforms as a route to the Piccadilly Line platforms. The overall effect of the Development on Earls Court station would therefore be beneficial.
15.3.15 At West Brompton station, the impact of Scenarios 1 and 2 in terms of passenger densities and queues within the station in 2031 is less than the impact of background passenger growth to the 2031 Base.
15.3.16 In the AM peak the highest passenger densities are at the gateline and on the West London Line platforms. In these areas there would be no material increase in densities under Scenarios 1 and 2. However, queuing around the gateline would spread further and passenger densities on the West London Line northbound platform would increase slightly. There is no significant increase on the District Line platforms as a result of the increase in demand. During the PM peak, passenger densities on the paid side of the gateline increase due to passengers exiting in Scenario 1 and 2 but remain lower than those forecast in the AM peak. During the PM peak the impact

Application 2 Transport Assessment 145
of Scenario 1 and 2 on these platforms is minimal. However, there would be high passenger densities on the West London Line platforms as passengers wait to board. These higher densities also reflect the conflicting movements which arise from passengers interchanging with the District Line as well as those exiting the station.
15.3.17 In terms of mitigating the net cumulative development impact at West Brompton, an additional ticket gate is proposed. The analysis with this mitigation shows relief in the AM peak with regards to queuing around the immediate gateline area. In the PM peak there is a consequent reduction in passenger densities at the gateline. The journey time analysis suggests that the relief brings journey times for exiting passengers broadly back in line with the 2031 Base situation. The Applicant is helping TfL identify possible mitigation for background growth between 2009 and the 2031 possibly including increased staircase widths and ticket hall reconfigurations
15.4 OVERGROUND RAIL
15.4.1 The Site Wide Development Option has good access to West London Line services at West Brompton station, where London Overground and Southern Trains run approximately 10 two-way mainline trains per hour (six London Overground and four Southern) in the peak.
15.4.2 The West London Line upgrade is being implemented and results in peak capacity increases of 97% northbound and 65% southbound, delivered through changes to rolling stock and service frequency.
15.4.3 As for the underground network, the implications of these improvements plus future background growth in passenger numbers and the implications of the RBKC Only Development Option plus the cumulative impact scenarios have all been studied using TfL’s Railplan model.
15.4.4 The AM results illustrate that passenger standing densities without any development on the Earls Court Site between the Existing Base and the 2031 Base would reduce by some 0.6-0.7 passengers / sqm on some station-to-station links despite background growth.
15.4.5 For Scenarios 1 and 2 in 2031, the future standing densities with development would still be significantly less than the Existing Base and would involve a maximum change of only five passengers per carriage between Imperial Wharf and West Brompton.
15.4.6 As explained in section 14.3, the increased West London Line passenger entry and exit flows at West Brompton station have all been included in the station capacity analyses.
15.5 BUSES
15.5.1 As agreed with TfL at the Scoping Study stage, the Transport Assessment has presented forecast changes in bus passenger numbers for each direction on each bus corridor.
15.5.2 In every case, the Scenarios 1 and 2 peak period passenger numbers would be well within the overall seating capacities from Railplan. It is assessed that the Development impact would be minor. However, the detailed implications of these changes in passenger numbers are to be assessed by TfL Buses, taking account of peaks in demand above the average peak period conditions which can occur due to service disruption and other operational factors.
15.5.3 This Transport Assessment has included audits of bus stops on all bus routes within walking distance of the site, and this has found a range of existing deficiencies which require some improvement. A financial contribution is therefore proposed for the improvement of bus stops on Lillie Road, and North End Road, in

Application 2 Transport Assessment Earls Court 146
addition to the bus stop improvements on Old Brompton Road, Warwick Road and Earls Court Road which are associated with Application 1.
15.5.4 Further contributions are proposed for new bus stops within the development; new bus layover and driver facilities within the site; and for the improvement of existing bus routes or to establish new bus routes, as agreed with TfL.
15.6 WALKING
15.6.1 The Earls Court Site is currently impermeable due to the West London Line and other rail infrastructure being a barrier to east-west and north-south pedestrian and cyclist movements. The detailed access and outline layout proposals address this by creating a permeable network of pedestrian and cyclist routes throughout the site. This will improve connectivity and travel choices for the surrounding communities as well as for the new Development. By reducing walking distances for LBHF residents to Earls Court and West Brompton stations, this permeability will also increase Public Transport Accessibility Levels. The Development would provide a highly walkable environment, to be integrated with existing and improved walking and cycling routes to provide attractive and easy connections to and from the area.
15.6.2 Surveys of the existing situation confirm that the highest levels of pedestrian movement occur around the Earls Court station accesses on Earls Court Road and Warwick Road. The next busiest areas are along the A4, North End Road, and around West Brompton station.
15.6.3 An audit of the pedestrian environment quality using TfL software showed a lack of signage and information provision along all the links, together with some sub-standard surfacing and lack of dropped kerb and other facilities. The clear widths of existing footways were found to be compromised on Lillie Road by street furniture including guardrailing and signposts, and on the east side North End Road due to the existing footway being narrow along the frontage of retail premises south of the West Kensington station access.
15.6.4 The number of future pedestrian movements due to background growth and due to each development scenario were calculated and assigned to the pedestrian network. This included for all the pedestrians who would be walking to the surrounding stations and bus stops to access public transport services. TfL’s Pedestrian Comfort Guidance for London (2010) was then used to assess implications on footway capacity. The guide allows for development proposals to be assessed and any potential problems identified at an early stage and mitigation developed if required.
15.6.5 Footway capacities were assessed for each development scenario and improvements are proposed on North End Road and Lillie Road, in addition to the Warwick Road, Old Brompton Road and Lillie Road improvements associated with Aplication1.
15.6.6 The Site Wide Development Option includes mitigation in the form of a new Toucan crossing and associated pedestrian and cyclist improvements on North End Road near Star Road, and improved pedestrian crossing facilities at the North End Road / Lillie Road junction. These works are within the Application 2 boundary and it is proposed that they would be implemented as part of the consented proposals, alongside the Warwick Road and Old Brompton Road improvements within the Application 1 boundary.
15.6.7 In terms of proposed mitigation which would be the subject of potential financial contributions, these would be directed towards off-site pedestrian improvements, as part of a comprehensive public realm strategy for the surrounding

Application 2 Transport Assessment 147
area, and a wayfinding strategy for the local area in accordance with Legible London guidelines.
15.7 CYCLING
15.7.1 At present, the London Cycle Network has limited coverage in the surrounding area. The sign-posted route along Lillie Road and Old Brompton Road has advisory cycle lane carriageway markings and there is no further formal on-carriageway cycle provision in the area. The provision of the Mayor’s Cycle Superhighways will help to alleviate this lack of connectivity.
15.7.2 Cycle parking in the area is limited to areas along the northern part of North End Road with small pockets of spaces being located close to the junction with Barons Court Road and Beaumont Avenue, close to the junction with Charleville Road, and at Beaumont Crescent. Further south towards the Lillie Road junction, there is less cycle parking available.
15.7.3 The Development is forecast to contribute to the Mayor’s target for cycling to reach a 5% share of all journeys by 2026 and this would involve some 293 additional cycling trips per hour.
15.7.4 A range of TfL and Borough initiatives are being progressed in order to encourage a significant increase. The Cycle Superhighways and other improvements to the cycle network will involve a change to the routing and distribution of future cycle trips.
15.7.5 The Development would encourage cycling by having a high standard of on-site cyclist facilities including convenient and secure cycle parking for all occupiers and visitors, plus showering, changing and storage areas for cycling gear in the workplaces. In addition, provision is being made for three Barclays Cycle Hire stations to be established within the Application 2 site. Financial contributions are proposed towards off-site cyclist improvements to existing routes and the delivery of new routes at locations around the Application 2 site such as Star Road (in addition to the routes associated with Application 1, such as Old Brompton Road, Trebovir Road and Penywern Road). In combination these improvements would form part of a cycling link between Hammersmith and Earls Court town centres.
15.7.6 It is concluded that this Development would be an exemplar project to establish a cycling culture.
15.8 POLICY COMPLIANCE
15.8.1 The degree of policy compliance has been assessed relative to the transport and development policies summarised in section 2 at National, London and Borough levels.
15.8.2 In terms of strategic policies, the Development proposals have been shown to promote sustainable transport choices and this is reflected in the low car driver mode shares of only 7-10% as forecast by section 7.6 (PPG13 “Transport”; PPS3 “Housing”; PPS4 “Planning for Sustainable Economic Growth”; PPG12 “Local Spatial Planning; and London Plan 2011 Policy 6.1).
15.8.3 The land use mix and the Development’s location among a range of complementary land uses reduce the need to travel, especially by car (PPG13 “Transport”; PPS3 “Housing”; PPS4 “Planning for Sustainable Economic Growth”; PPG12 “Local Spatial Planning; and London Plan 2011 Policy 6.1).
15.8.4 The Development integrates transport and development by providing homes, employment and complementary land uses at a location which is well-served by buses, underground and overground rail services, and where further improvements are planned (PPG13 “Transport”; PPS3 “Housing”; PPS4 “Planning for Sustainable

Application 2 Transport Assessment Earls Court 148
Economic Growth”; PPG12 “Local Spatial Planning; and London Plan 2011 Policies 6.1 and 6.4).
15.8.5 The Development proposals have been developed with the Earls Court and West Kensington Opportunity Area draft Supplementary Planning Document in mind, as informed by the Earls Court Transport Study (ECTS). The ECTS approach has been to match development to transport capacity and this has been followed-through in this Transport Assessment whereby the capacity of all transport modes has been considered and proposed for enhancement where required. In this respect the proposals therefore comply with London Plan 2011 Policies 6.1, 6.3 and 6.4; with LBHF Core Strategy Strategic Policy T1; and with the LBHF Saved UDP Policy G4.
15.8.6 Turning to more detailed policy requirements, the Development proposals accord with London Plan 2011 Policy 6.7; LBHF Core Strategy Policy Strategic Policy T1; and with the LBHF Saved UDP Policy G4 by assessing the quality of the surrounding bus network, auditing the nearby bus stops and then making provisions for financial contributions to implement TfL’s Accessible Bus Stop Design Guidance.
15.8.7 The proposals improve the walking environment by creating attractive and permeable links throughout the Earls Court Site; by improving crossing points; widening footways; and proposing contributions for improving the wider public realm and introducing a wayfinding strategy. These proposals ensure compliance with the requirements of London Plan 2011 Policy 6.9; LBHF Core Strategy Policy Strategic Policy T1; and with the LBHF Saved UDP Policy G4.
15.8.8 The Development encourages cycling by the high standard of on-site cyclist facilities including convenient and secure cycle parking for all occupiers and visitors, plus showering, changing and storage areas. In addition, provision is being made for Barclays Cycle Hire stations to be established within the development and for financial contributions towards off-site cyclist improvements to existing routes and the delivery of new routes around the site. Together, these proposals ensure compliance with the requirements of London Plan 2011 Policy 6.10; LBHF Core Strategy Policy Strategic Policy T1; and with the LBHF Saved UDP Policy G4.
15.8.9 The parking proposals involve a balance between providing for the anticipated level of residential car ownership to avoid off-site parking impacts while still encouraging the use of sustainable transport. Non-residential parking is constrained as part of the strategy to reduce the amount of cars being attracted into the development. All of the parking proposals comply with published car parking standards and provide for Blue Badge holders, electric vehicle charging and a Car Club. The proposals therefore comply with the requirements of London Plan 2011 Policy 6.13; with LBHF Core Strategy Policy Strategic Policy T1; and with the LBHF Saved UDP Policy G4.
15.8.10 The proposals provide for all servicing, deliveries and refuse collection to take place away from the public highway, and to be controlled through a Delivery and Servicing Plan in line with TfL requirements. The Plan sets out a management strategy so that goods and services can be delivered, and waste removed, in a safe, efficient and environmentally-friendly way. These proposals accord with the requirements of London Plan 2011 Policy 6.14.

Appendices, Figures & Tables


A Development Schedule
B Access Plans and TRACK Plots
C Stage 1 Road Safety Audits
D Scoping Study and Correspondence
E Developments for Cumulative Impact Assessment
F Local Model Validation Report
G Baseline Traffic Surveys
H Accident Data
I Parking Survey
J Railplan Outputs
K PERS Audit
L Trip Generation Model
M Construction Reports
N Framework Construction Logistics Plan
O Earls Court Option Testing Report
P Bus Assessment
Q LEGION Modelling
R Pedestrian Model
S Framework Travel Plan
T Framework Delivery and Servicing Plan
U Station Design Reports