earhtdaj4 construction practice in tanzania - irc
TRANSCRIPT

hi1

EARHTDAJ4 CONSTRUCTIONPRACTICE IN TANZANIA
by
FELIX S.A. MOWO
LIE~RfkY,
-T~,I ~ J~
RN:LO: ~M~r S4EJ~
H fl~rr.~:H V~’AcER~JP~LY
) T~ F-Lguet.
LS~
A report submitted in partial
fulfilment of the requirements
for the degree of Master of
Science in Engineering to the
Tampere University of Technology,
Department of Civil Engineering,
May 1984
Dar es Salaam, Tanzania
1.
‘I :~

S

EARTHDAMCONSTRUCTIONPRACTICE IN TANZANIA
TABLE OF CONTENTS Page
ACKNOWLEDGEMENT
ABSTRACT
1. INTRODUCTION 1
2. CAUSES OF EARTHDAMFAILURES 4
2.1 General 4
2.2 Failure Due to Overtopping 4
2.3 Failure Due to ‘Piping 5
2.3.1 Mechanics of Piping 6
2.3.2 Leaks 8
2.3.3 Cracks 9
2.4 Failures by Sloughing 14
2.5 Failures by Sliding 14
2.5.1 Slides During Construction 15
2.5.2 Downstream Slope Slides During
Reservoir Operation 16
2.5.3 Upstream Slope Slides Following
Reservoir Operation 17
2.6 Earthquake Damages 19
2.7 Slope Protection Failures 21
2.7.1 Dumped and Hand-placed Rip—Rap 21
2.7.2 Articulated Concrete Pavement 22
2.7.3 Monolithic Reinforced Concrete
Slabs 23
2.8 Damage Due to Burrowing Animals 23
2.9 Damage Due to Water Soluble Materials 24
2.9.1 Soluble Materials in Embankment
Soils 24
Due to Surface Drying 252.10 Damage
3. HYDROLOGYOF DAMSITES 26
3.1 Introduction 26
3.1.1 Stream Flow Data 26
3.1.2 Precipitation Data 29
3.1.3 Use of Data 30
3.1.4 Watershed Data 30
3.2 Methods of Estimating the Inflow
Design Flood 31
3.2.1 USSCS Method 32
3.2.2 Kobalyenda Method 47
3.2.3 BRALUP Method 50
4. CONSTRUCTIONMATERIALS 51
4.1 Introduction 51
4.2 Definitions 51
4.2.1 Soil 51
4.2.2 Rocks 52
4.3 Major Soil Groups (Unconsolidated
Sediments) 52
4.3.1 Marine Clays 52
4.3.2 Marine and Beach Sands 53
4.3.3 Estuarine and Coastal Muds and
Silts 53
4.3.4 Alluvial Deposits 51
4.3.5 Lacustrine Sediments 55
4.3.6 Pyroclastic Deposits 55
4.4 Properties of Soil Components 56
4.4.1 Gravel and Sand 56
4.4.2 Silt and Clay 56
4.4.3 Soil Shear Strength 59
4.5 Soil Classification 62
4.5.1 Unified Soil Classification
System (Tics) 62
4.6 Tropical Soils 65
4.6.1 Laterite Soils 66
4.6.2 Black Cotton Soil 74

4.7 Procedure for Soil Investigation 80
4.8 Selection and Operation of Borrow Areas 81
5. CONSTRUCTIONOF EARTHDANS 83
5.1 Introduction 83
5.2 Preliminary Works 83
5.3 Foundation Preparation 85
5.3.1 Foundation Excavation 85
5.3.2 Foundation Treatment 86
5.3.3 Foundation Dewatering 89
5.4 Embankment Filling 92
5.4.1 Construction Methods 92
5.4.2 Mechanics of Compaction 96
5.4.3 Laboratory Compaction 99
5.4.4 Compaction Control Tests 100
5.4.5 Control of Water Content 102
5.4.6 Compaction Control of Pervious
Sections 103
5.4.7 Control of Embankment
Permeability 104
5.5 Slope Protection 104
5.6 Maintenance of Dams 105
5.6.1 Checklist of Conditions to be
Noted on Safety Inspection of
Small Earthdams 107
6. CONCLUSIONAND RECOMMENDATIONS 109
REFERENCES 111
APPENDIXES

V

ACNOWLEDGEMENT
The author wishes to express his deep sense of gratitude to
all those who assisted in this work in one way or another.
The Course Staff led by Course Director DI Pentti Rantala
provided all possible assistance and guidance. The initial
encouragement and support was provided by Mr. R.O. Lucas,
graduate student at the Tampere University of Technology.
Much assistance and advice was given generously by the
thesis supervisor DI Lauri Kattelus. Officers of the
Ministry of Water and Energy assisted to obtain information
in old files.
The Ministry of Water and Energy granted the author leave
of absense for the duration of the course. The course
was made possible by the assistance of the Ministry for
Foreign Affairs of Finland, Finnish International Development
Agency (FINNIDA).
To all these the author is grateful.


ABSTRACT
In this report the nature and types of failures of earth-
dams has been reviewed. Examples of such failures in Tanzania
are indicated. Construction methods as per current practice
are discussed. The properties of soils in general and
tropical soils in particular are presented. The hydrolo-
gical aspects’ of damsites are briefly discussed and some
methods of analysis discussed. Finally it is recommended
that the deficiencies which have been pointed out in the
various dam failures should be corrected so that these
structures can serve the purpose for which they are meant.

V

1
1. INTRODUCTION
The construction of earthdams has been in practice in many
parts of the world for a long time. Prior to the under-
standing of the mechanics of soils, these structures were
mainly constructed using the rule of thumb, and often
without compaction. With the introduction of soil mechanics
in the analysis of earth embankments a rational approach
to the design, and construction has evolved. This has
greatly reduced the number of earthdam failures. However,
failures continue to occur mainly due to poor design, poor
construction control or inadequate hydrometeorological data.
Almost all dam failures which have occured in Tanzani~. in
recent times have been caused by one or a combination of
the above. Unfortunately no proper records exist of the
investigations carried out after the failures. The common
measures have been to reconstruct the failed structure
without giving consideration to the cause of the failure.
For example, the Wiyenzele Dam in Dodoma region failed
after reconstruction, possibly because the recommendations
for reconstruction were not followed.
The failure of a dam is in most cases accompanied by
destruction of lives and property, besides the termination
of the service for which it was intended. The investment
is wasted and reconstruction may cost much more than the
original cost.
As the dams under consideration are mainly the small to
medium size type meant for water supply and irrigation,
there is a tendency to ignore the necessity for proper
investigations. The fact that failures of these structures
have led to some areas being cut off from other areas due
to washed—away bridges should make the need for proper
investigations necessary. The design should also follow
guidelines outlined in the design manual, which has just
been approved for publication.
2
The construction phase should also follow the assumptions
adopted in the design, and if possible the design engineer
should follow—up the construction as well. At present there
doesn’t seem to be enough contacts between the design
section and construction section. The soil technicians who
are seconded to the projects from the soil laboratory are
sometimes ignored and their opinion is not followed.
Most earthdam projects were initiated in Tanzania after the
Second World War. The main purpose then was to create
sources of water for villagers and their livestock, and to
reduce pastoralism. This was not very successful as it
created areas with very large concentrations of livestock.
After the villagization programme of 1973 an urgent need
was felt to provide a dependable source of water for people
and their livestock. This was necessary especially in
regions like Dodoma, Arusha, Tabora, Shinyanga, Mwanza and
Mara which have big numbers of livestock.
In 1975—1976, five national earthmoving teams were established
with capacity to construct small to medium size dams. In
addition to the national teams, eighteen small earthmoving
teams were established in eight regions to construct dams
and charcos on a self—help basis. Besides these teams donor
agencies established teams in Arusha and Dodoma regions for
the same purpose. The output from these teams leaves much
to be desired, but as it is outside the present discussion,
it shall not be touched. However, it is important to mention
that only dams constructed by the national teams get the
services of the soil mechanics laboratory. As such many of
the dams continue to be constructed, using the rule of
thumb. The establishment of zonal laboratories which has
started, together with the availability of staff and
laboratory and field equipment may help alleviate the
present situation.
1—

3
After constructing the dam, it should be used and maintained.
Many dams have been left unused due to the failure of a
proposed irrigation project to take—off. Cattle troughs
are not constructed, slow sand filters are not constructed
in time and this leads to watering of livestock in the
reservoir itself. The fact that domestic water has to also
be drawn from the reservoir, makes it, a potential health
risk. There is a need to carry out inspection and repair
to the dam and spillway when required. Unfortunately there
seems to be a problem of maintenance in most waterworks.
Frequent inspection should be carried out to assess the
status of the works. Financial allocations should be made
to enable repairs to be carried out promptly. Cracks should
be filled in and unwanted vegetation both on the embankment
and in the spillway should be cleared. As these problems
are cumulative, if left unattended, they may lead to the
eventual failure of the dam.

4
2. CAUSES OF EARTHDAM FAILURES
2.1 General
The main causes of earthdam failures and damages may be
summarized as due to poor quality of construction materials,
or poor workmanship of dam design and construction, or
inadequate hydrometeorological and/or geological data of
dam site, or a combination of the above. The material
selected for building the embankment has to confirm to
certain predetermined specifications, otherwise assumptions
used in the design may not be applicable. For example, the
material selected for use as core material must be of low
permeability, whereas that for the shell has to be of a
higher permeability.
The construction process must also meet the requirements,
otherwise a good design might not give the required quality.
Hydrometeorological data may be a problem as this is scarce,
but the designer should use all means at his disposal to
assess the necessary parameters. Geological data is rarely
collected in the case of small dams, and natural phenomena
such as earthquakes are difficult to predict.
Earthdam failure may be due to: overtopping, piping,
sloughing, sliding and so on. These are described in the
following sections.
2.2 Failure Due to Overtopping
The flow of water over the crest of a dam is termed as over-
topping. When this occurs over an earthfill dam failure is
imminent. This occurs during great floods when the spilling
capacity is inadequate or when it is not functioning
properly. Overtopping can also be caused by an unforeseen
intensity of wind or wave action.

5
When an earthfill dam is overtopped due to one of the above
causes a breach will form and grow gradually under the
erosive action of the waters. There is, however, very
little knowledge about the inception, shape and develop-
ment of the breach /20/. To properly describe the gradual
breaching, the geometry of the breach must be related to
the hydraulics of the flow and bed material properties.
Johnson and Illes state that the geometry is directly
related to the duration and shape of the overtopping flood
wave.
The typical breach is between 1 and 3 times as wide as it
is deep /20!. A mathematical model, the overall objective
of which is to achieve a physical realistic simulation of
the gradual failure of an earth embankment caused by an
overtopping flood event, has been formulated, developed and
tested with real life data by V.M. Ponce and A.J. Tsivoglon.
They have concluded that a significant feature of the model
is its ability to account for the growth of the breach and
the eventual draining of the reservoir behind the embank-
ment /20/.
Failures due to overtopping are not deficiencies in the
design of the earthdam itself but rather the result of
inadequate hydraulic design. This may be due to inadequate
hydrometeorological data.
2.3 FaIlure Due to Piping
Embankment and foundation piping has caused the next biggest
number of failures after overtopping /22/. Piping is caused
by improper design or poor construction or both. Strict
requirements for uniformly compacted embankments with
emphasis on control of construction water and density have
been developed tp provide dense and homogenous cores which
reduce the incidense of concentrated leaks and resist
6
piping when leaks do develop. Because of such requirements
and the introduction of graded filters in the downstream
portions of dams, there have been extremely few piping
failures in important modern dams /22/.
The damage by piping failure leaves no trace at the embark-
ment or foundation in which the piping developed. To
reconstruct the causes and mechanics of failure, construc-
tion and design records and eyewitness accounts are required.
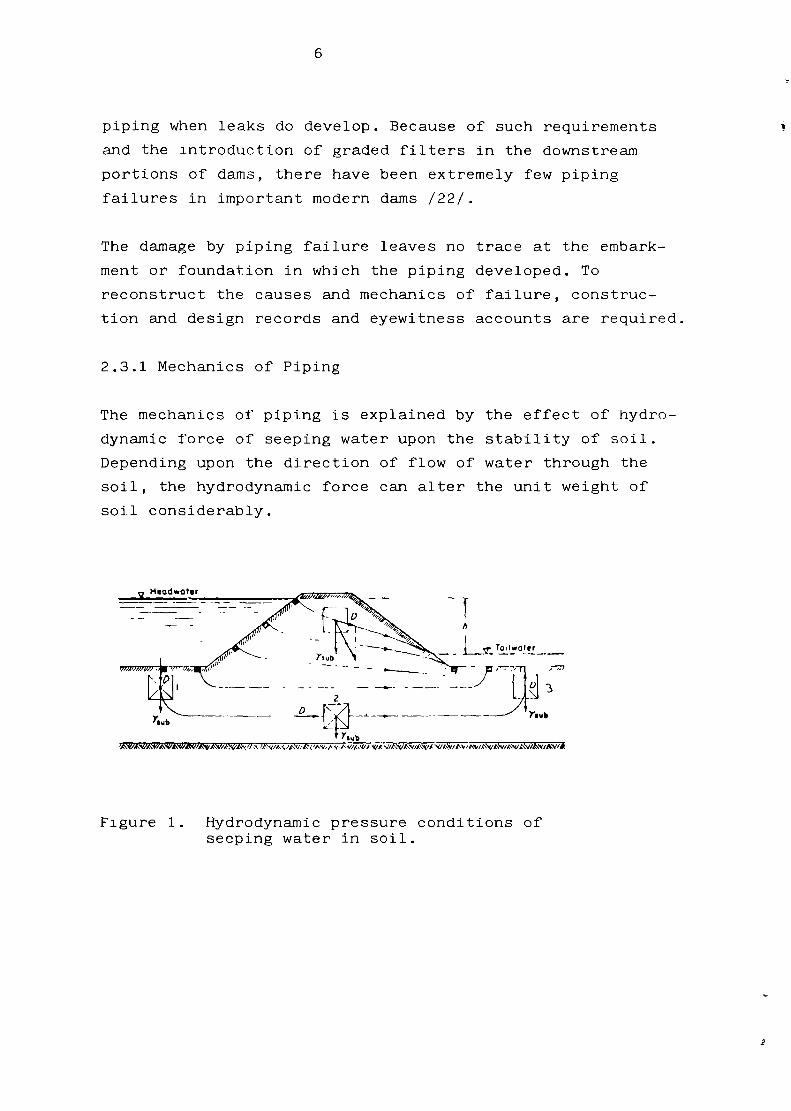
2.3.1 Mechanics of Piping
The mechanics of piping is explained by the effect of hydro-
dynamic force of seeping water upon the stability of soil.
Depending upon the direction of flow of water through the
soil, the hydrodynamic force can alter the unit weight of
soil considerably.
b
Figure 1. Hydrodynamic pressure conditions ofseeping water in soil.

7
The accompanying figure illustrates this:
D = hydrodynamic force (tangent to the flowline)
= ~wi (force/unit volume)i = hydraulic gradient
= unit weight of water
‘(sub = submerged unit weight of soil
~‘eff = effective unit weight of soil
At point No. 1, the effective unit weight of the
soil is
V = Yoeff usub
indicating densification of the soil.
At point No. 2, the two vectors D and 1sub act
perpendicularly to each other. The effective unit weight
is
“eff sub
At point No. 3, the hydrohynamic force acts vertically
upwards against the submerged unit weight of the soil.
Thus,
eff ‘ ‘~sub - D
Here when D = sub’ the soil appears to be weightless and
instability of the soil mass is impending. At this point
the soil is said to be in an incipient state of fluidiza—
tion. Such a case occurs when the critical hydraulic gra-
dient, ~c’ is attained and consequently, a critical velo-
city, v0 then
D =Y~i~
When the flow velocity, v, exceeds the critical velocity,
Vc~ then D>~’sub, and ~‘effh 0.
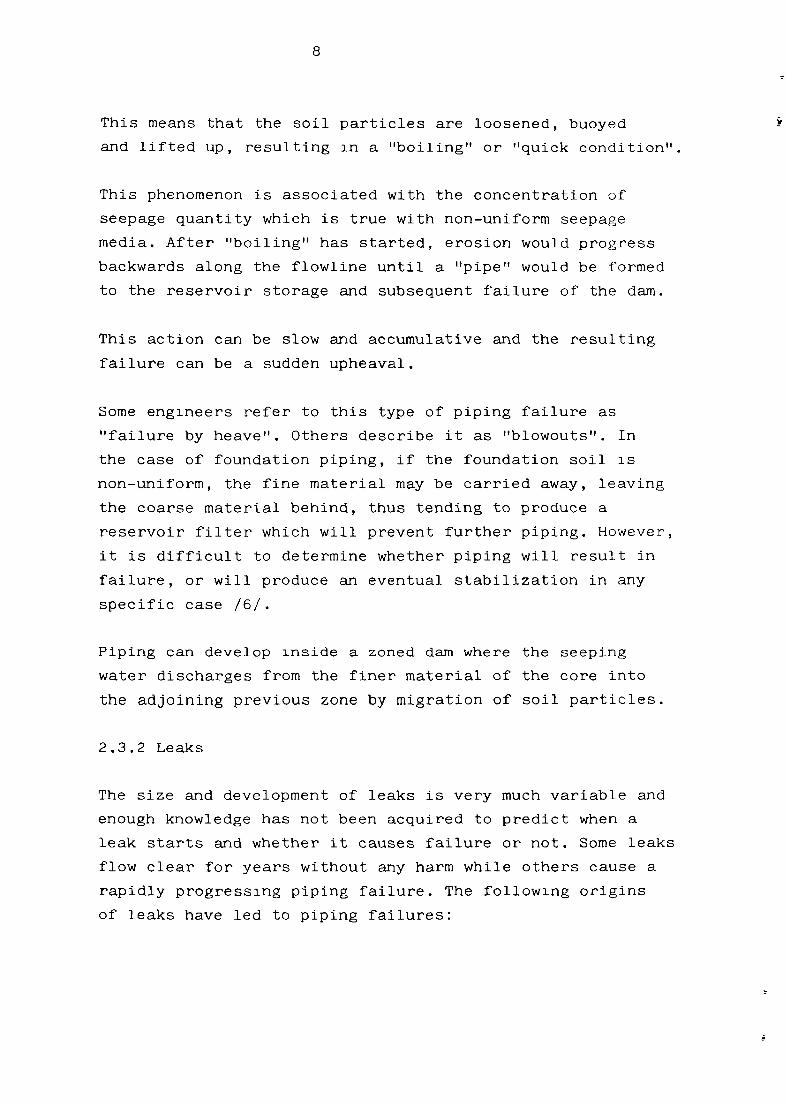
8
This means that the soil particles are loosened, buoyed
and lifted up, resulting in a “boiling” or “quick condition”.
This phenomenon is associated with the concentration of
seepage quantity which is true with non-uniform seepage
media. After “boiling” has started, erosion would progress
backwards along the flowline until a “pipe” would be formed
to the reservoir storage and subsequent failure of the dam.
This action can be slow and accumulative and the resulting
failure can be a sudden upheaval.
Some engineers refer to this type of piping failure as
“failure by heave”. Others describe it as “blowouts”. In
the case of foundation piping, if the foundation soil is
non—uniform, the fine material may be carried away, leaving
the coarse material behind, thus tending to produce a
reservoir filter which will prevent further piping. However,
it is difficult to determine whether piping will result in
failure, or will produce an eventual stabilization in any
specific case /6/.
Piping can develop inside a zoned dam where the seeping
water discharges from the finer material of the core into
the adjoining previous zone by migration of soil particles.
2.3.2 Leaks
The size and development of leaks is very much variable and
enough knowledge has not been acquired to predict when a
leak starts and whether it causes failure or not. Some leaks
flow clear for years without any harm while others cause a
rapidly progressing piping failure. The following origins
of leaks have led to piping failures:

9
- loose embankment soil
(Poor construction control results in inadequate compac-
tion in the embankment, adjacent to conrete outlet pipes
or other structures or adjacent to the foundation and
abutments.)
- differential settlement cracks
- cracking in outler pipes which can be due to
* foundation settlement, or
* spreading of base of dam, or
* deterioration of the pipe.
There are two modes of’ occurence of this type of leak. If
the water flowing in the pipe is under pressure, it may be
forced into the embankment and downstream, otherwise the
eroded soil may be lost into the pipe.
- natural foundation soils; natural soils are more erratic
and often less dense than embankment materials. Thus,
leakage is more common here.
- animal burrows and drying cracks can sometimes cause
leaks which may lead to piping failures.
2.3.3 Cracks
Cracks are formed when a portion of the embankment is
subjected to tensile strains during the deforming of the
dam by differential settlement. They may be localized or
continuous. They may open as much as 15 cm in width, but
widths of 2,5 cm or 5 cm have been more common /22/.
Cracking has developed most commonly in low dams of about
less than 30 m and in the upper portions of high dams. In
the lower portions of high dams the heavy weight of the dam
counteracts cracking.
10
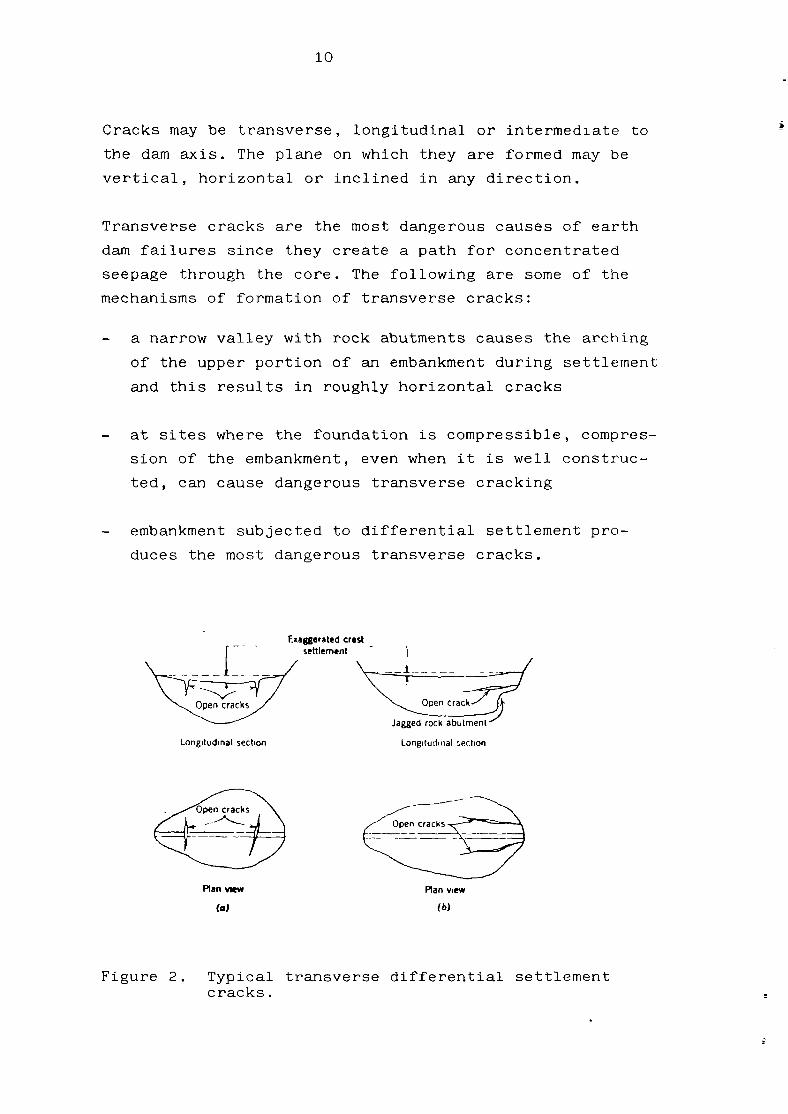
Cracks may be transverse, longitudinal or intermediate to
the dam axis. The plane on which they are formed may be
vertical, horizontal or inclined in any direction.
Transverse cracks are the most dangerous causes of earth
dam failures since they create a path for concentrated
seepage through the core. The following are some of the
mechanisms of formation of transverse cracks:
- a narrow valley with rock abutments causes the arching
of the upper portion of an embankment during settlement
and this results in roughly horizontal cracks
— at sites where the foundation is compressible, compres-
sion of the embankment, even when it is well construc-
ted, can cause dangerous transverse cracking
— embankment subjected to differential settlement pro-
duces the most dangerous transverse cracks.
Longitudinal section
Exaggerated crestsettlement
~ncrack~
Jagged rock abutment
Longitudinal section
Figure 2. Typical transverse differential settlementcracks.
Plan view
(a)
Plan View
(b)

11
When section of rolled—earth embankments have been placed
in trenches through compressible foundations for the pur-
pose of’ supporting outlet conduits, severe transverse
cracks are formed due to the differential settlement of’
the embankment. Figure 3 illustrates this.
Figure 3. Cracking due to differential settlementbetween natural foundation soil and rolled—earth support under outlet pipe (or otherdiscontinuity in the foundation).
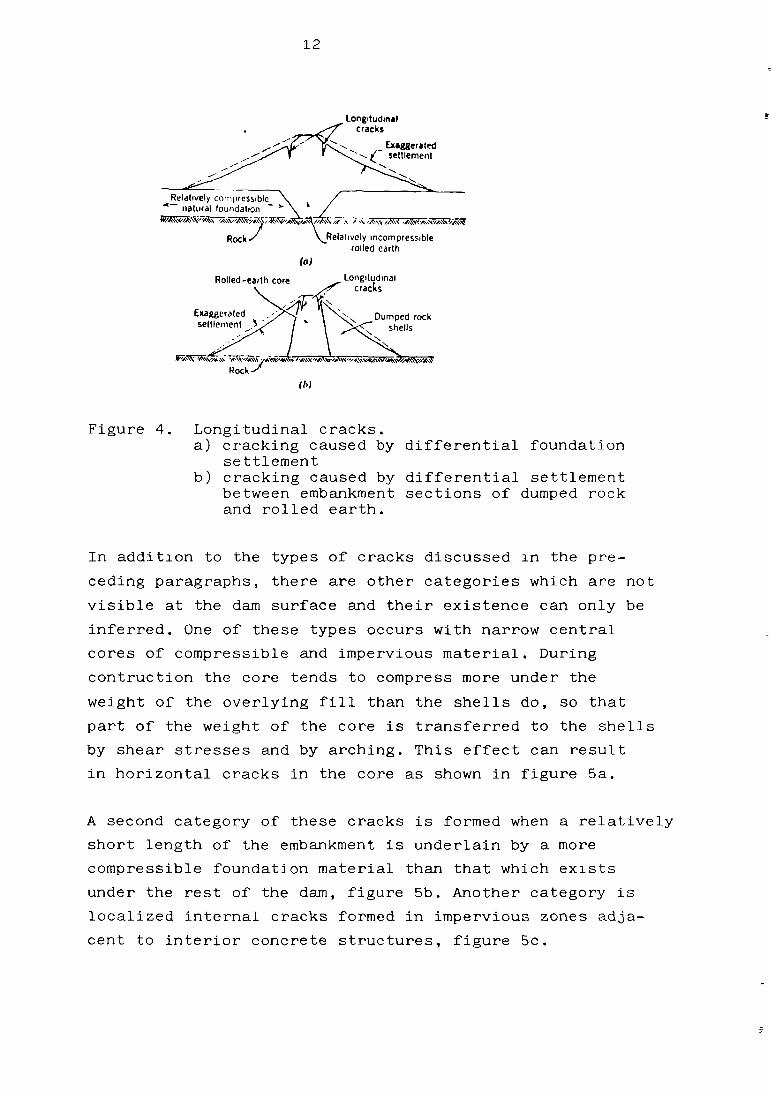
Longitudinal cracks are not as much dangerous as transverse
cracks. Usually the openings are not very deep, although
some have been found to have depths of about 6 m. Like in
transverse cracks, longitudinal cracks are formed due to
different types of differential movement. Two possible
cases are shown in figure 4. Longitudinal cracks may occur
in conjunction with other unseen cracks running transver-
sely through the core and this exposes the darn to a more
dangerous situation.
~ R~’ ~ C~ntr~~Lt2P~y
Rolled -earthsection under
outlet pipeLongitudinal section
Plan view
12
LongitudinalCracks
Rock’ Relatively incompressible
rolled earlh
(a)
Rolled-earth core Longitudinal
cracks
Exaggerated Dumped rock
~eniJ~\~~ells
Rock((ii
Figure 4. Longitudinal cracks.a) cracking caused by differential foundation
settlementb) cracking caused by differential settlement
between embankment sections of dumped rockand rolled earth.
In addition to the types of cracks discussed in the pre-
ceding paragraphs, there are other categories which are not
visible at the dam surface and their existence can only be
inferred. One of these types occurs with narrow central
cores of compressible and impervious material. During
contruction the core tends to compress more under the
weight of the overlying fill than the shells do, so that
part of the weight of the core is transferred to the shells
by shear stresses and by arching. This effect can result
in horizontal cracks in the core as shown in figure 5a.
A second category of these cracks is formed when a relatively
short length of the embankment is underlain by a more
compressible foundation material than that which exists
under the rest of the darn, figure 5b. Another category is
localized internal cracks formed in impervious zones adja-
cent to interior concrete structures, figure 5c.

13
- R&ativslyRelatively compv.ssibl. lncompr.,sib~
narrow central core shells
Open crackz Rock
(a)
High~~s~lve
Open cracks fJ~_Alluvium_..*..
Concrete wall
(c)
Figure 5. Internal embankment cracking.
From the foregoing discussion it is apparent that the magni-
tude of cracking depends on the tensile deformation occuring
in a dam as related to the stress—strain characteristics of
the fill materials. But the extent of damage depends on
the leakage and erosion properties of the soil. Therefore
cracking, leakage and erosion properties are in conjunc-
tion responsible for the stability of a dam.
These properties have been studied in physical models made
of well graded silty-gravely sand and silty-clayey fine
sand. The well graded silty—gravely sand has a self healing
effect.
Erosion starts at a certain deformation and diminishes
ultimately within an interval of’ time. The blow-off occurs
when the tensile deformation approaches the maximum particle
size. The silty—clayey fine sand has no self—healing effect.
Erosion starting at a certain deformation continues and
increases with time along with increase in leak discharge
and finally makes the blow—off /10/.
Open
• RockDense sand
(b)

14
As an example of a dam that failed due to piping, Wiyenzele
Dam in Dodoma region, Central Tanzania is cited. The dam
was completed in 1962. The total length is 720 m and maxi-
mum height above natural ground level is 12 m. At the
filling of the reservoir in December 1962 a section of the
dam, about 30 m in length, was washed away because of
piping immediately above the river bed. Layers of sand
material passing through the clay core were visible in the
breach in the dam and in inspection trenches excavated
afterwards. Also the embankment was to some extent damaged
by cracks /25/.
2.4 Failures by Sloughing
Sloughing is a type of damage which is closely related to
piping. It occurs in a few older homogenous dams. It starts
with a miniature slide resulting in a relatively steep face.
Saturation by seepage helps a continued sloughing. After
every sloughing a relatively higher and unstable face is
formed until a thin portion of the dam remains. Finally the
reservoir breaks through the thin portion causing a complete
catastrophic failure. Failure of this type has taken place
only when the whole downstream portion of the dam has been
saturated.
2.5 Failures by Sliding
Embankment and foundation slides cause frequent failures of
earthdams. Slides occur when the average stress along any
potential sliding surface becomes greater than the average
strength of the construction material. Slides in an earthdam
can be classified into three categories:
1. slides during construction
2. downstream slope slides during reservoir operation
3. upstream slope slides after reservoir operation.
15
2.5.1 Slides During Construction
These slides may involve the upstream or downstream slope
or both. No loss of life or property damage is encountered
other than the dam itself. According to Sherard et al, in
every case of construction slide the dam was underlain by
a foundation of either soft, brittle, or sensitive clay,
usually of high plasticity, and a large portion of the
sliding surface passed through the foundation /22/. Cons-
truction slides can be slow or rapid.
A slow slide starts gradually arid continues sliding for
1—2 weeks. The vertical and horizontal components of move-
ment are 5 - 15 % of the height of the dam which is regar-
ded as a small percentage.
While the sliding never completely stops, movement slows
down at the end of the initial period to an unimportant
rate in a creeplike action. Slew slides occur when the
foundation is composed homogenous deposit of soft clay
which is not sensitive /22/.
A rapid slide happens very suddenly with a larger magnitude
of movement which is usually equal to one-half of the
height of the dam. The major part is over in a few minutes
and the movement either stops or slows down to a creeplike
rate within several hours /22/. Rapid slides result when
the foundation clay contains horizontal bedding planes,
lenses, or layers of’ silt or fine sand through which the
high pore water pressures developing under the centre of
the darn can be transmitted outward towards the more lightly
loaded areas under the toe.

16
2.5.2 Downstream Slope Slides During Reservoir Operation
Downstream slope slides which occur during reservoir opera-
tion may be deep slides which generally pass through a
clay foundation or shallow surface slides.
Deep slides usually take place during full or nearly full
reservoir condition and reduce free board by extending
further upstream than the upstream edge of’ the crest of
the dam, figure 6.
Figure 6. Deep downstream slides frequentlyextend to the upstream slopebelow the reservoir water level.
Deep slides are caused by pore water pressure which is
developed from seeping water from the reservoir through or
under the dam.
There is no relief’ of the pore pressure after the slide has
taken place. The unstable scrap left standing slides again
until it breaches the dam and a great flood wave results.
Deep slides move at about the same rate or somewhat faster
that slow slides during construction. A typical movement
might be 8 to 10 cm per day in the first day or so and
then approximately 3 cm per day for several weeks /22/.
Fail,rr WllKe

17
Most shallow slides follow heavy rainstorms and do not
extend more than 5 to 8 cm into the embankment in a direc-
tion normal to the slope /22/. Shallow slides following
rainstorms have often occured where there are heavy layers
of downstream rock rip-rap which retains the rainwater in
many small puddles and produces greater saturation of the
downstream slope. Poorly drained downstream berms or poorly
drained roads on the downstream slope also lead to slides.
Shallow surface slopes involving only the upper few centi-
metres have sometimes occured when the embankment slope
have been poorly compacted. But this does not endanger the
safety of the dam. It can often be embarassing to the
engineers.
2.5.3 Upstream Slope Slides Following Reservoir Operation
Although occurrence of upstream slope slides during full
reservoir operation is not impossible, most of the known
cases have been following reservoir drawdown. Thus, the most
critical operation condition so far as the stability of
the upstream slope is concerned is a rapid drawdown,
following a long period of high reservoir level.
Figure 7 shows the effect of rapid drawdown on the pore
water pressures measured in Alcova and equal pressure lines
under full reservoir conditions, while figure 7b shows the
pressures under drawdown condition.
If special provision are not made for a dam subjected to
such a condition, it will most likely end up with an upstream
slope slide.

18
(A) STEADY STATE CONDITION
Figure 7. Effect of’ rapid drawdown on pore pressuresat Alcova Dam, an earthfill structure onthe North Platte River in Wyoming.
Upstream slides have not caused complete failure or loss of
water from the reservoir, although they have occasionally
blocked the entrances to outlet conduits and made these
useless for further lowering of the reservoir, sometimes
creating a very awkward and dangerous situation. Following
an upstream slope slide caused by reservoir drawdown, the
excess pore pressures within the embarkment soil adjacent
to the surface of’ sliding are dissipated to a large extent.
Thus, there is a lesser tendency for continued sloughing
WS El 5481AUG. I, I9~
Rock riprop--
—Phreotuc line
ImperviousipefYIOu S
8edrock
Note Pressures measuredin feet of eater
Equal pressure ~nes----.
WS El 5361
rest El 5510
5402 5
5325
19
and sliding than there is in the downstream slides, in which
the pore pressure are not likely to be diminished. Since
the slide comes to equilibrium at low reservoir stage,
there is small likelihood of catastrophic failure even
though a large earth movement has taken place.
Extremely rapid rates of drawdown are not necessarily
involved. A study has shown that the majority of the slides
have occurred between average rates of 9 and 15 cm/day. The
majority of upstream slides have been deepseated with the
sliding surface passing well into the clay foundation. The
upper edge of the sliding surface normally extends only to
the upstream edge of the crest /22!.
In some dams constructed for hydroelectric power, where the
reservoir essentially remains full all the time, the rip—
rap wave protection is placed only at the top of the darn in
the range of elevations over which the reservoir will
operate. If the upstream slope is relatively steep, trouble-
some surface slides may develop and become progressive as
the reservoir is being filled and the water level is still
below the bottom of the rip-rap. These slides are caused
by erosion from wave action on the unprotected lower slope
of the dam.
2.6 Earthquake Damages
There are no complete instrumental records of the response
of’ an earthdam to a strong earthquake; even limited records
for’ smaller shocks are scarce. By “complete” is implied
records capable of’ an adequate definition of input ground
motion and dam structural response; a better picture of
behaviour requires records of soil and pore water pressure
as well /1/.

20
One of the few dams known to have failed under seismic
forces was the Sheffield Dam in Santa Barbara, California,
earthquake of June 29, 1925 which had a Richter magnitude
of 6~3 and a epicentre about 11 km from the damsite.
This 7,6 m high earthfill was 220 m long and had slopes of
2,5 to 1. Founded on a silty sound layer about 2 metres
thick, the embankment consisted mostly of this same material,
except a clay blanket on the upstream slope. Seepage had
saturated the foundation alluvium and the lower part of fill.
In response to the earthquakes’ estimated maximum accelera-
tion of 15 % of gravity (i.e. 0,15 g), and 15 to 18 seconds
of significant vibration, the relatively loose saturated
silty sand near the base failed in liquefaction.
The consensus of the investigators who viewed the broken
dam was that the earthquake “had opened vertical fissures
from base to top” and had “formed a liquid layer of sand
under the dam, on which it floated out, swinging about as
if on a hinge”. A 91 metre length of the embankment at its
centre slid downstream about 30 metres. As a consequence,
approximately 113 000 m3 of water spilled into the city of
Santa Barbara /5/.
Earthquakes may effect dams in various ways. Seismic forces
may be transmitted directly from the foundation to the
structure. Overtopping water waves may be generated by
landslides or oscillation of the reservoir or sudden move-
ment of the dam. As demonstrated at the Sheffield Dam,
foundations and embankments under certain circumstances
may suddenly weaken when subject to prolonged vibration.
Liquefaction of f’ine—grained cohesionless soils under such
conditioncanplace a dam in jeopardy /5/.
1~

21
2.7 Slope Protection Failures
The upstream slopes of most earthdams are protected with
one of the following materials in decreasing order of
frequency:
- dumped rock rip-rap
- hand placed rock rip-rap
- articulated concrete pavement consisting of individual
si abs
- monolithic reinforced concrete pavement.
2.7.1 Dumped and Hand-placed Rip-Rap
During a heavy storm the waves on the surface of a reser-
voir beat repeatedly against the slope just above the
reservoir water level, and their energy is dissipated in
turbulent action on and within the rocks of a rip-rap layer.
As a wave strikes the slope, the water rushes upward into
the rip-rap and filter layer and then, in the lull before
the next wave strikes tumbles back downward. This action
may damage dumped rip-rap layers in two main ways:
— First, if the filter material is too fine, the wave
water moving in and out of the rip-rap may gradually
wash the filter out; in an extreme case where the filter
is completely removed, the individual rocks in the rip—
rap layer settle and expose the embankment to wave
erosion.
- Second, if the average size of’ rock comprising the rip—
rap is not heavy enough to resist the hydraulic forces
generated by the waves, rocks may be literally washed
out of the layer.

22
Failure of the filter layer is more common. The larger
rocks are more likely to be moved out of place because they
have been undermined when the filter layer was washed out.
Beaching of the type shown in figure 8 is the typical
result of failure of dumped rip-rap.
Figure 8. Typical failure of rock rip-rap.
Another kind of damage occurs when rip—rap layers are
constructed with very large rocks of uniform size and
without enough small rocks to make a well graded blanket.
The Itamuka Dam is Singida region which was completed in
1961 was seriously damaged by wave erosion in 1962. The dam
had to be emptied by cutting a trench through the embank-
ment. The trench revealed some construction defects as
well /25/.
2.7.2 Articulated Concrete Pavement
Slope protection of this type has been the least success-
ful of all the principal methods used. Almost invariably
the failures have occured because wave water has washed
large quantities of the filter or embankment material
through the cracks between the individual slabs. The loss
of material has caused serious settlements of the slab and
the development of more cracks through the wave can wash
off the soil. A few failures have occured from deteriora-
tion of the concrete.
— 01I waw he’gtd Re~er~ii
time ol ~o,m
RoM imiad ham

23
2.7.3 Monolithic Reinforced Concrete Slabs
This kind of slope protection has a life of’ at least 30
years and probably many more. One of the disadvantages of
concrete slab faces is that waves run up the smooth slope
further than they do on a rough rock surface and a conside-
rable amount of water can be thrown over the dam crest.
2.8 Damage Due to Burrowing Animals
Burrowing animals have been responsible for piping failure
in a number of small earth dams and dikes but have not
caused trouble in major dams because animal holes do not
penetrate to a great depth. In the US the worst pests are
muskrats and ground squirrels. Muskrats burrow into embank—
ments either to make homes or to dig passages from one
pond, figure 9. In Tanzania, termite holes have been noticed
in some earthfill dams /25/.
(0)
[dunceis often under spillway
(6)
Figure 9. Holes by burrowing animals in earth dams.a) Typical muskrat hole for nest.b) Typical muskrat hole used as passage
between the reservoir and the down-stream pond.

24
2.9 Damage Due to Water Soluble Materials
2.9.1 Soluble Materials in Foundation and Abutments
Leaching of natural deposits of’ water soluble materials
from abutments and foundations has caused difficulty at
some dams. Gypsum which is gradually dissolved by seepage
water from the reservoir has been particularly troublesome
in this respect.
The leaching of soluble salts creates cavities and solution
channels which may be dangerous for the safety of a dam.
The deposition of soluble material previously leached from
the natural soil may tend to plug specially designed fitters
and pervious drains.
2.9.2 Soluble Materials in Embankment Soils
Solutions of salts have been the suspected cause in the
failures of a few old dams constructed in arid regions
where the soil had a high percentage of soluble materials.
However, these failures occured many years ago when embank—
merits were built with what would now be considered rudimen-
tary construction control. Small quantities of soluble
salts are not as troublesome in embankment materials as
they are in foundations and abutments because:
— the water in a river running through a region where the
soil contains much soluble salt has a high salt content
itself, and consequently the reservoir water will show
no great tendency to leach salts out of an embankment
composed of such soils
— in the construction of modern rolled—earth dams the
water which is added to the borrow material to bring
the construction water content up to optimum probably
dissolves much of the soluble salt.

25
One the other hand, Cedergren /4/ reports that waters high
in sodium tend to flocculate soils high in alumina, thereby
reducing the permeability. Fresh water may deflocculate
clay soils, rendering them more permeable. The failure of
a number of small dams in Australia has been attributed
to post—construction deflocculation that led to piping
when fresh river water was suddenly turned into reservoirs
that had been kept filled with saline water. Compaction at
optimum or slightly wet of optimum is recommended as a
means of’ avoiding piping failures in clay soils.
In extremely arid climates where little or no water is
available for compaction, chemical aids are recommended.
Maintenance of a low sodium adsorption ratio in the perco—
lating water is essential to prevent undesired changes in
the soil sodium adsorption ratio following leaching /4/.
2.10 Damage Due to Surface Drying
Surface drying cracks have caused a constant maintenance
problem on a few low dams constructed with homogenous
sections of clayey soil. Usually the main cracks in extreme
cases have been several centimetres wide, develop near the
top of’ the dam parallel with the crest /22/. The worst
conditions develop when some combination of the following
factors occurs:
— hot, dry climates in which the reservoir remains empty
for long periods
- embankment construction materials of highly plastic or
extremely fine silty soil, and
- embankments not compacted to high densities.

26
3. HYDROLOGYOF DAMSITES
3.1 Introduction
When designing a dam one has to have an idea of’ the expec-
ted floods in order to ascertain whether the reservoir will
fill up and provide a dependable flow to satisfy the expec-
ted demand. Secondly the maximum probable flood has to be
estimated so that sufficient spillway capacity can be
provided to safely pass the flood. In addition the magnitude
and frequency of floods should also be found from statis-
tical analysis of stream flow records. These are primarily
for use in connection with estimating diversion require-
ments during construction, evaluating flood damage risks
and also for devising rule curves for operation of the
spillway after commissioning of the project.
3.1.1 Stream Flow Data
The hydrological data most directly useful in determining
flood flows are actual stream flow records of conside-
rable length at the location of the dam. Such records are
rarely available. Efforts should be made to obtain stream
flow records available in the vicinity of the damsite.
There should be such records although they are in most
cases of very short duration — in most cases less than ten
years duration. Where stream flow records are not available,
the inhabitants of the vicinity may have information about
high water-marks caused by specific historic floods.
If stream flow records are available at or near the damsite
for 20 years or more, they can be analysed to provide flood
frequency values and notable flood events can be used to
find the runoff factors for use in determining the maximum
probable flood. If such a record is available but covers
only a few years, it may not include any flood of’ great
magnitude within its limits and, if used alone it would give
false indication of flood potential.

27
However, analysis may give some or all of the runoff’ factors
needed to compute the maxium probable flood. Frequency
values obtained from a short record should not be used
without analysis of’ data from nearby watersheds of comparable
runoff characteristics.
When stream flow records are available on the stream itself’,
but a considerable distance from the damsite, they can be
used to obtain unit hydrograph characterictics and frequency
data which may be transferred to the damsite by using area
and basin—characteristics coefficients. This transfer can
also be made from one drainage area to another if the areas
have comparable characteristics /6/.
When there are no stream flow records on the stream and on
comparable drainage basins use of high water marks can be
used. These should be used with caution in estimating flood
magnitudes. They are much more dependable when they are
several near the damsite and especially if some local
authority e.g. roads department, has a record of’ these marks.
These records may be used to determine the water cross-
sectional area and the water surface slope for the flood
t~ which they refer, and from these data an estimate of
that particular flood peak may be obtained /6/.
In the design of the Mindu Dam, records were available for
a maximum of 15 years /18/. It was found that the duration
of the data is inadequate for a sensible prediction of
extreme flood flows on the Ngerengere River. The extreme
flood was therefore derived from an examination of all
notable flood events recorded in the hydrological year books
of Tanzania for the periods 1950-59 and 1960—65. Values of
maximum flows were plotted against catchment area, and a
limiting line drawn. On this basis a design flood intensity
of 1,82 m3/s per km2 was adopted for Mindu Dam, which for
its catchment area of 303 km2 gives a peak discharge of
approximately 552 m3/s. See figure 10.

—J- -I ~!P5 F1.OO~
FLOOD OP s6tb APRIL 1957 AEIBUNGO ON RUVU RIVER(REFERRED TO IN TEAR-BO~AS APP EARING TO BE OFEXCEPTIONAl. I.4AGNITUDE~)
I I
Figure 10. Notable flood events in Tanzania.
I so MILE) —~-
.
———-~-I ‘- FLOOD OF
30th MARCH 1964ON RUANA RIVER
AT—
~---c
E400
3C0
FLOOD OF i0~~NOVEMBER 963
- k I— - - I\_ ‘ - -
AT MVUHA ON UVUI4A RIVER
MINDU DAM CATCHIAENTAREA ISI S~ ~LE S -
- ---- \~---
ASSUMED LIMITING LINE
I I IEIIII_I_~I2
‘I’
iIiiIiTIiiIiII— —
NoTE:- DATA OBTAINED FROMHYDROLOGICAL YEAR-BOOKS1950—59 AND l~6O-65
—
NEMBER 1963 ATAlE ON SIGI RIVER
FLOODIPINDA
OF 0th MAY 1957ON LUFIRIO
ATRIVER 7
EE~r~ECATCUMENT AREA (so MILES)
— — — — .........L 1
N)
FLOOD O~jF ~ Si-
~—X
x
-~‘
x
FLOOD OFAT KISUNGO
—
~
3IIEOCTO,ER I9~lON RUVU RIVE*
— — — —
‘...
—
~.
—
L~
0 i 00 • 300 400 560 600

29
3.1.2 Precipitation Data
Precipitation data is required in all the preceding cases
for evaluating factors for use in computing the maximum
probable flood. Information on precipitation should be
assembled especially those which show great storms for
which runoff records are also available.
In Tanzania most small catchments lack sufficient rainfall
and runoff data and the designer has to sometimes adopt
characteristics developed elsewhere for choosing the design
flood discharge. This has led to some dams failing due to
overtopping on the one hand and quite uneconomical spill-
ways on the other. We shall cite here Kilimi Dam in Tabora
as an example:
Project: Kilimi Dam
Location: Nzega District, Tabora Region
Dam height: 15 m above original bed level
Spillway:
Discharge: 300 m3/s
Bed width: 150 m
The excavation of the spillway was almost completed when
somebody raised an alarm about the spillway size. After
some communication it was found that the maximum flood
could not be more than 100 m3/s and most likely around
50 m3/s, which agrees quite well with nearby drainage
basins. The spillway which is almost completed has yet to
have its size fixed todate. This may be due to lack of
enough studies during the design period which should have
enabled fixing of these dimensions before the project was
approved for construction.
The selection of the design flood for dams in Tanzania has
always been a m~itter of debate before a final figure is
fixed.

30
It is recommended that whenever it appears that there will
be one or more flood seasons between the selection of the
damsite and construct~cir. of the dam, facilities for securing
a stream flow record for the project ~.hould be set up as
promptly as possible. This is of particular importance in
order to obtain watershed data directly applicable to the
computation of the inflow design flood for the dam,
although a record usable for frequency computation cannot
be secured. Such measurements may produce basic data which
would justify “eleventh hour” revision of the plans, thus
improving the design of the dam.
3.1.3 Use of’ Data
The objective of analysing stream flow arid precipitation
records is the development of procedures whereby the hydro-
graph that will result from a given amount of rainfall may
be estimated. Another objective is the computation of a
flood magnitude-frequency relationship based on experienced
events. The primary use of recorded flows and precipita-
tion records in the computation of’ an inflow design flood
is the determination of’ a unit hydrograph and of retention
loss characteristics of the watershed.
3.1.4 Watershed Data
Besides the stream flow and precipitation data it is neces-
sary to assemble all other relevant data for the watershed.
A map of the area upstream of the damsite should be prepared
showing the drainage system, contours if available, drainage
boundaries, and locations of any precipitation stations
and stream flow gauging stations. Available data on soil
types, cover, and land use provide valuable guides to
judgement. An inspection trip should be made over the
watershed to verify drainage area boundaries and soil
and cover information, and to determine if any non-contri-
buting areas are included within the drainage boundaries.

31
Just to give an idea about the necessity of ascertaining
the catchment area: the Mindu Dam in Morogoro was designed
for a catchment area of 390 km2 . The design flood intensity
is 1,82 m3/s per km2, which gives a peak discharge of
710 m3/s. Subsequent measurements indicated that the actual
catchment area is 303 km2. Using the same design flood
intensity this gives a peak discharge of 552 m3/s. This
means that other factors remaining the same, the provided
spillway is overdesigned by 22 %. The implication of this
overdesign on the cost of spiliway excavation is obvious.
Therefore there is a need to actually correlate data from
maps with field reconnaisance.
3.2 Methods of Estimating the Inflow Design Flood
Most of’ the damsites in this discussion fall outside the
catchments characterized in Tanzania as of national impor-
tance, and this means that there is rarely a river gauging
satation for the particular basin. As such the estimation
of the design flood is mostly derived from rainfall data,
and the methods for arriving at this will be discussed.
Further it is worth mentioning that rainfall stations have
been operating for a long time compared to gauging stations
even on the important catchments and therefore it may be
more appropriate to use the rainfall data of a longer
duration than the 5 - 10 years gauging data for estimating
the design flood. However, the density of these stations is
rather low and therefore the obtained values may only give
order-of—magnitude estimates due to predominating oro-
graphic factors.

32
3.2.1 USSCS Method
The US Soil Conservation Service’s Manual on “Hydrology
Guide for Use in Watershed Planning” /11/ gives a method of
finding the inflow design flood for ungauged areas.
The resulting inflow design flood hydrograph represents
direct runoff from precipitation in the form of rain over
a watershed having no unusual characteristics. This method
shall be illustrated with data from Mindu Dam, Morogoro.
a) Catchment Characteristics
The following catchment information is always
needed:
1. Geographical location. This should provide infor-mation about the location of’ the dam togetherwith the variation of altitude within the catch-ment.
2. Map showing topography, streams and runoff contri-buting drainage area.
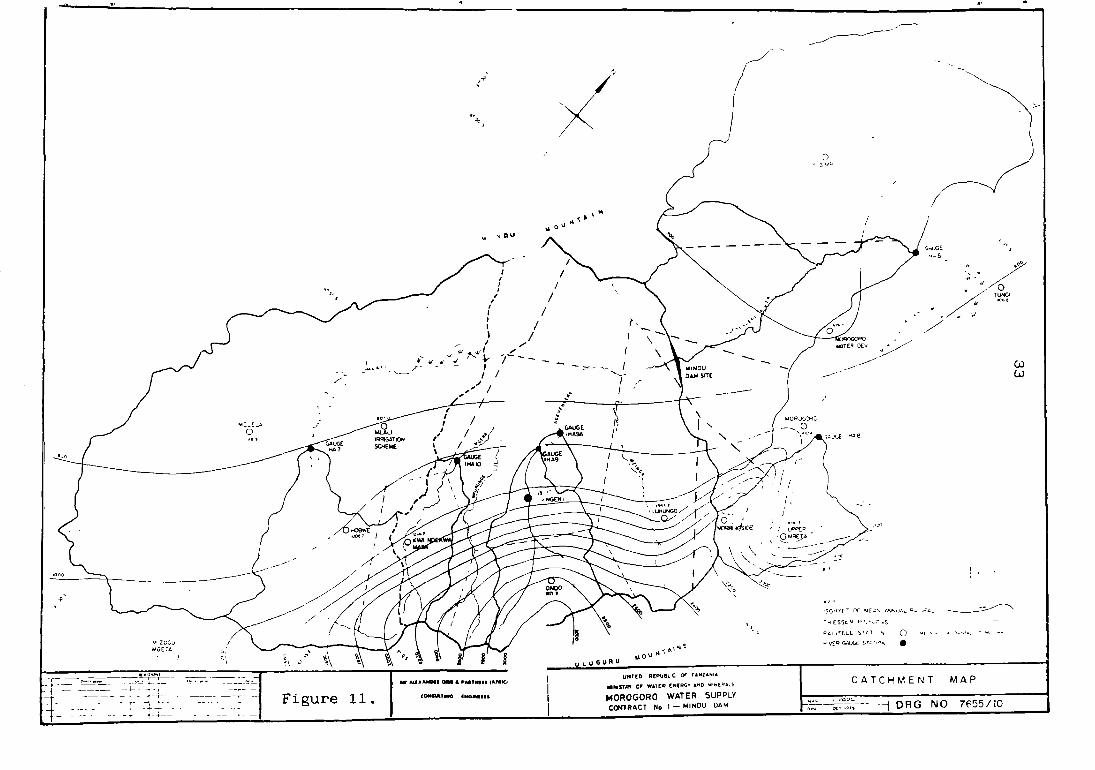
For Minclu Dam the total catchment area is 303 km2Out of this some 169 km2 is contributed by thecatchment of the Mlati River which drains thesouthern part of the catchment and which dischargesto an area of seasonal swamps in the upper part ofthe Ngerengere Valley. Due to evaporation lossesfrom the swamps and possible ground water recharge,the Miati River makes a disproportionately smallcontribution to the total surface flow in theNgerengere.
There is certainly an effect of attenuation in themarshes which will reduce the flood peak in theMlati River. Therefore for flood studies it isconsidered necessary to examine not only the floodcontribution from the total catchmen, but also themore flashy conditions that might be expected fromthe limited catchment drained by the other riversexiuding Miati, amounting to 134 km2 in area(figure ii).
H
U LU GURU
unTtO R(PURL1C o~I £N2AH!5
asTm OF WATOR CHORd AND RIHODAS
MOROGORO WATER SUPPLYC~4TRACTNo 1 — MINDU OAM
-p
Jo /M
$
~JHIA
/
//
0~
0)(A)
30:OE n ur~-~~ A_ ,o4__
‘O EDSL~d A~t’ —
AL~~°LLL S~I I ~ /1 - A~-~* - —-
JVPRG.ALCE 5IZ.A~ •
AJ~
Y~L1JGUSUE 70
TTTT1- — ——-— ~- ~-I -
- 4--I---- -
-~
--F-- f--A-- - -
Is RASOASI S £ PRomo.. Ionic,
Figure 11. CONflO ‘“00-A.’
CATCHMENT MAP
~-~--~~--- --~ DRG NO 7E55/IO

34
3. Rainfall distribution
As already mentioned Tanzania is in an area ofsummer rainfall, contributed principally by thesouthern zone of intertropical convergence. Twoseasons of rainfall are therefore experienced.
At Morogoro there occur in November—December andMarch—April. However, being a coastal region signi-ficant rainfall brought in by the prevailing southeast winds occurs throughout the year and theincidence of this rainfall in the Morogoro area isaccentuated by the presence of the Uluguru Mountains.The catchment lies in an area of rain shadow onthe lee side of the mountains, and thereforeexhibits an extreme rainfall gradient varying fromin excess fo 300 mm mean annual rainfall at the topof the mountains to a general level of about 700 mmin the valley bottom.
This rainfall gradient and the random nature ofrainstorms makes it particularly difficult toassess storm runoff by conventional unit-hydrographtechniques /Gibb/.
4. Catchment time of concentration
Various empirical methods are available for estima-ting the catchment time of concentration, which isdefined as the time taken for water to travel fromthe hydraulically most distant point of the water-shed to the point of exit from the catchment.
Most methods relate time of concentration to meanchannel gradient, obtained by dividing total fallin channel level by total channel length.
Applying such methods give times of concentrationof the order of three and one half hours for thewhole Mindu Catchment and one and one quarter hoursfor the reduced catchment excluding the Mlati River.Mean channel velocities obtained with these valuesare abnormally high (2,0 and 2,9 rn/s respectively).
This indicates that the above methods may not bestrictly applicable to catchments in which channelgradients vary substantially throughout their length.

35
Table 2. Seasonal distribution of 24 hourrainfall (mm).
Month 2
Return
5
Period
10
(Years)
20 50
January 28 43 53 63 76
February 31 53 67 80 98March 39 56 67 78 93April 36 50 59 67 78May 20 29 34 40 47June 8 18 25 31 39
July 4 10 13 17 21
August 5 11 16 20 25September 8 20 28 35 45October 11 23 31 38 48November 20 40 53 66 83December 27 45 57 68 83
An alternative method using a guide prepared bythe Texas Highway Department was therefore used /6/.The guide gives typical mean channel velocities andusing these the travel times in each stage of theriver can be obtained and sumed up to give an aggre-gate time of concentration. By this method the timeof concentration for the catchment with and withoutthe Mlati River are estimated as 16 hours and 6hours respectively.
5. Catchment area reduction ractor
In studies carried out by the UK Transport andRoad Research Laboratory (TRRL) /9/ factors forreducing storm rainfall intensity by areal extentof storm were computed based on data from fourcatchments in East Africa.
Due to limited data, firm estimates for catchmentarea reduction factors could not be obtained, buta formula based on the available data was used bythe TRRL.
ARF = 1 - 0,O44A°’275
where A = catchment area (km2
Factors based on this formula are then used foradjusting catchment rainfall for the areal extentof the catchment.

36
b) Design Storm Rainfall
1. Storm frequency analysis
In order to analyse the recurrence interval of rainstorms (and therefore of floods) of specific magni-tudes it is necessary to examine rainfall recordsof a length suitable for extrapolation.
The data is fitted to a probability distribution,usually the Gumbel probability distribution and theextrapolation for the required return periods isdone.
2. Seasonal distribution of’ rainfall
Analysis of the seasonal distribution of rainstormsis carried out by applying the Gumbel probabilitydistribution to the series of annual maximum ofdaily rainfall extracted separately for each month.Since this method may not be truly applicable topartial series abstracted in this way care shouldbe taken not to extrapolate the distribution beyondthe period of record /18/.
3. Short duration rainfall
The relationship between rainfall intensity and
duration is normally expressed in the general form:a
(T + bY’
where I = rainfall intensity in mm/hrT = rainfall duration in hoursa, b and n are constants.
The only recent analysis of rainfall intensity andduration for East Africa is that carried out by ateam from the British Transport and Road ResearchLaboratory /9/.
Using data derived from twenty three autographicrainfall stations, and using an average value forb of 0 ,33 hours, values of “a” and “n” were computedfor various return periods.
Values of “n” were found to fall into three generalgroupings for:
— inland stations— coastal stations- eastern slopes of the Kenya Aberdate Range.

37
As the primary interest in the analysis is forstorm intensities of low frequency in index of0,85 was used throughout for Mindu Dam. Using thisvalue of “n” the relationship can then be used torelate 24 hours rainfall with rainfall of’ anyshorter storm duration.
4. Design storm sequence
For unitgraph analysis the design storm is assembledas a hypothetical sequence of rainfall eventsdistributed symmetrically in unit time. Suitableincrements of time are taken, for example, for theMindu Catchment one hour was adopted for the wholecatchment and half an hour for the sub—catchmentexcluding the Mlati River. The design storm at anyintensity is limited in duration only by the relation-ship stated in (3.) above.
Table 3. Average values of index ‘n’.
Return
2
Period
5
(years)
10
All Coastal Stations 0.82 0.76 0.761
~
Dar es Salaam 0.91 0.86 0.84Dodoma 0.95 0.91 0.88
Table 4a. Peak flood estimate fromwhole catchment.
Catchment Peak PeakReturn mean 24 hr. Rainfall Excess Peak
Period
Years
Rainfall
mm
Intensity
mm/hr
Rainfall
mm/hr
9oodm /8
10 83.5 61.2 47.2 26650 103.4 75.8 63.8 363
100 112.3 81.4 71.2 408500 131.5 96.4 87.4 507
1 000 140.1 102.8 94.6 552
10 000 168.0 123.2 117.8 699

38
Table 4b. Peak flood estimate from sub—catchment excluding Mlati River.
Catchinent Peak Peak
Return mean 24 hr. Rainfall Excess Peak
Period
YearsRainfall
mm
Intensity
mm/hrRainfallmm/hr
9oodm /s
10 107.8 79.2 67.4 413
50 133.5 98.0 89.0 550100 i45.1) 106.4 98.8 612
500 16C.8 124.6 119.4 746
1 000 181.0 132.8 128.8 80610 000 21~.’) 159.2 156.2 992
c) Catchment Retention
1. Flood runoff in the catchment results from stormrainfall not retained by surface ponding or byinfiltration within the soil structure. The princi-pal factors affecting the relationship betweenrainfall arid runoff are the intensity and durationof the storm, the soil type and the antecedentmoisture conditions of the soil.
The United States Soil Conservation Service /11/developed a mass flow model of the form:
(P — Ia)2Q =
P—Ia÷s
where Q = direct runoff in mmP storm rainfall in mms = maximum potential difference between
P and Q at time of storms beginningIa = the initial abstraction which on the
evidence of data from watersheds invarious parts of the USA is taken as0,25.
The above relationship can be plotted as a familyof curves against a curve number having the form:
CN - 1000— 10+S
(S converted to inches)
One unique curve number therefore defines the cumu-lative relationship between rainfall and runofffor any particular storm.

39
2. Calibration of model
A mass flow form of’ model is adopted in order toallow calibration using the available 24 hour rain-fall and river flow records. For calibrationpurposes, river flow and rainfall data is used forcommon periods of record in order to relate therainfall and runoff.
From the records a series of extreme runoff eventsare extracted. These are defined as 24 hour periodswhen the runoff exceeds three times the runoff inthe preceeding period and the preceeding fiveperiods are resonably uniform. These single extremerunoff events are compared in each case with rain-fall for the preceeding five days.
For Mindu Dam, the model was expressed in theform:
Runoff = Excess rainfall + base—flow fromground water
i.e. = — + BP- I a+ S
and S and B are related directly to the Antece-dent Precipitation Index (API) where
API = K’P.7 1i=1
K being a constant and P1 the precipitation i dayspreviously.
Coefficients of correlation of the order of 0,4 to0,7 were obtained, the higher figures being obtai-ned only by adopting what were considered to beunrealistic values for the parameters. It wasconcluded that calibration on the basis of 24 hourrecords is not possible because:
— The catchment time ofconcentration is only some1 1/2 hours so that 24 hour records may includeseveral storm records having very differentcharacteristics.
— The time of reading of’ rainfall and river flowgauges is not known, so that the records maynot be coincident.
- The river flow gauges are of the cipolletti weirtype, intented primarily to measure low flows.It is therefore doubtful whether the recordstruly represent the peak of short duration floods.

40
3. Model parameters
In the absence of a direct calibration for thecatchment model, parameters were adopted in accor-dance with guidelines presented by the US SoilConvervation Service. It must be recognised thatthese guidelines, prepared for soil catchmentcharacteristics obtained in the US are not strictlyrelevant to conditions in Africa. However, in theabsence of more authorative data it was consideredreasonable to accept them.
The US Soil Conservation Service /6/ classifie3catchment runoff characteristics in accordance with:
1. Hydrologic soil groups
Four groupings classified A to D are listed.
Group A.
Group B.
Group C.
Group D.
(Low runoff’ potential)Soils having high infiltration rateseven when thoroughly wetted andconsisting chiefly of deep, welt-toexcessively—drained sands or gravels.These soils have a high rate of watertransmission.
Soils having moderate infiltrationrates when thoroughly wetted andconsisting chiefly of moderately deepto deep, moderately well to well—drained soils with moderately fineto moderately coarse textures. Thesesoils have a moderate rate of watertransmission.
Soils having slow infiltration rateswhen thoroughly wetted and consistingchiefly of soils with a layer thatimpedes downward movement of water’,or soils with moderately fine to finetexture. These soils have a slowrate of water transmission.
(High runoff potential)Soils having very slow infiltrationrates when thoroughly wetted andconsisting chiefly of clay soils witha high swelling potential, soils witha permanent high water table, soilswith a claypan or clay layer at ornear the surface, and shallow soilsover nearly imprivous material. Thesesoils have a very slow rate of watertransmission.

41
The Mindu Catchment would probablyfall within the ~,roup C classifica-tion having main]y fine grained siltyclays (mostly laterites).
2. Land use patterns
This again classifies the catchment accordingto the soil—cover complexes which are in turnused in estimating direct runoff. Types ofland use are classified on a flood runoff-producing basis.
The greater the ability of a given land use ortreatment to increase total retention, the lowerit is on a flood runoff-production scale /6/.
Three distinct zones within the Mindu Catchmentcan be defined. The forest reserve at the topof the catchment having, it is believed, asubstantial depth of humus, would be classi-fied as good woodland. The lower slope, whereintensive cultivation is carried out and wherealthough some contouring and terracing arepracticed, general overgrazing leads to hill—wash, would generally fall within the classifi-cation of poor pasture. The valley bottomwould be classified as good close seeded agri-cultural land.
3. Antecedent moisture conditions
Three groups of antecedent moisture conditions
are listed:
AMC-l A condition of watershed soils wherethe soils are dry but not to thewilting point, and when satisfactoryploughing or cultivation takes place.
ANC-Il The average case for annual floods,that is, an average of the conditionswhich have preceeded the occurrenceof the maximum annual flood on nume-rous watersheds.
ANC-Ill When heavy rainfall or light rain-fall and low temperatures have occuredduring the 5 days previous to thegiven storm, and the soil is nearlysaturated.
The curve numbers are computed and presentedfor the average conditions AMC-II. These canbe converted to the other antecedent moistureconditions using tables.

42
In the case of Mindu Catchment, in consideringextreme flood events AMC—III conditions wereadopted and this follows curve No. 90 whichwas used for the model. For rainstorms of ahigher frequency such as would be experiencedunder AMC-II conditions, curve No. 78 wasadopted.
d) Flood Estimates
1. Unit hydrograph
The unit hydrograph is defined as the hydrograph ofstorm runoff at a given point that will resultfrom an isolated event of rainfall excess occuringwithin a unit of time and spread in an averagepattern over the contributing drainage area.
For Mindu Dam, since autographic rainfall and run-off records are not available it is necessary toassume a unit hydrograph shape consistent withunit hydrographs for similar catchments elsewhere.
The systhetic unit triangular hydrograph adoptedby the US Soil Convervation Service is presentedhere. The dimensions of the triangular hydrographare defined by the following three equations:
Tp = ~+ 0,6 Tc
Tb = 2,67 Tp
- 0,208 AQq - Tp
where TpTb
= time to peak (hours)= time length of base of hydrograph
(hours)q = discnarge at peak of hydrograph
(m~/ s)D = unit increment of time of hydrograph
(hours)Q = unit increment of excess rainfall
for hydrograph (mm)A = catchment area (km2 )Tc = catchment time of concentration
(hours)
The relevant values are shown in the figure 12 /18/.

43
WHOLECSATCHMENT
SUB CATCHMENTEXCLUDING
MLATI RIVER
D (hrs)
Tp (hrs)
Tb (hrs)
q, (M3/s)
I
IO’I
27.0
6.24
½
385
1028
724
Figure 12. Unit hydrograph dimensions forMindu Dam Catchment.
I--C
EE
0
Tb

44
2. Method of analysis
The method of analysis follows closely that presen-ted in the LJSBR Design of Small Dams /6/.
The design storm sequence derived in B (4.) isconverted to a sequence of excess rainfall by useof the catchment model. Adoption of the mass flowmodel presupposes that after a prolonged rain stormthe unit increment of runoff’ approaches in valuethe unit increment of rainfall, giving unrealis-tically small values for catchment retention losses.To reso]ve this anomaly a minimum retention lossrate of 3 mm/h is adopted, this being the recommendedmimimum rate for soils in hydrologic soil group C.
Each increment of excess rainfall is then convertedto a unit triangular hydrograph of runoff. The totalflood hydrograph is defined by the arithmetic sumof the coordinates of all of the triangular hydro-graphs.
The effect of base flows in the river on the floodpeak is ignored as these flows are too small tobe significant.
3. Peak flood estimates
Estimates of the peak flood that may occur atvarious return periods are shown in the followingtables both for the whole catchment and for thesub—catcriment excluding the Mlati River. As theflood peak is measured at inflow to reservoir, theeffects of reservoir attenuation are not consideredhere. Since the flood from the sub-catchment isgreater than that from the whole catchment, furtherdiscussion will be on the sub-catchment only.
Table 5. Seasonal variation in peak flood (m3/s).
Month2
Return
5
Period
10
(Years)
20 50
January 7 38 67 102 153
February 11 67 117 170 251March 20 60 93 131 189
AprIl 41 96 139 180 242
May 3 21 36 56 135
June 0 0 2 8 39
July 0 0 0 2 8August 0 3 18 38 71
September 0 12 40 74 132
October 2 48 103 160 252November 22 140 244 359 519
December 14 71 123 178 ~60

45
Table 6. Gauges 1HA9 + lHAlO* (1954—1959)Flood discharge fitted to Gumbelprobability distribution (m3/s).
Month2
Return
5
Period
10
(Years)
20 50
January 5 7 9 11 13February 14 24 31 38 46March 55 91 115 138 168April 60 115 152 187 233May 32 63 82 102 126June 5 8 11 13 16July 2 3 4 5 6August 3 6 8 10 12September 14 46 68 89 116October 3 5 7 8 10Nov~ither 6 10 13 15 18December 8 18 24 30 38
* Adjusted pro rata to the respective effective catchment areas
to represent flood discharge at Mindu damsite.
4. Seasonal variation in flood risk
Based on the seasonal distribution of rain storms(table 4, page 37, 38) the risks of flood in anymonth of the year are estimated. As these estimatesare for floods of a frequency closer to that of theannual flood, soil moisture conditions are assumedas being equivalent to ANC-Il. The following tablegives the seasonal flood estimates for the sub-catchment excluding the Mlati River.
It should be noted that base flow, which is notincluded in the figures shown in the table, islikely to provide the only significant river dis-charge during the dry months of the year.
To corroborate values obtained by the unit hydro-graph method, river gauge readings were plotted onGumbel probability distribution.

0
lii
0
U
In
C
N 0 r~J R S
Figure 13. Discharge hydrographs for Ngerengere River at Mindu Dam.

47
It can be noted from the above table that the values
predicted by the unit hydrograph method are at least of
the same order of overall magnitude, though with substan-
tial and significant differences apparent in individual
months. For future flood prediction, direct river gauging
at the damsite will provide the required data base. However,
until such data is available, the figures in table 6
above are adopted for planning purposes during construc-
tion of Mindu Dam.
3.2.2 Kobalyenda Method
Kobalyenda /16/ used a computer aided method to simulate
stream flow from precipitation data and other hydrological
parameters on a case study of Little Ruaha River, Southern
Tan z an i a.
A mathematical model was developed which correlates the
land phase of the hydrological cycle as a component of
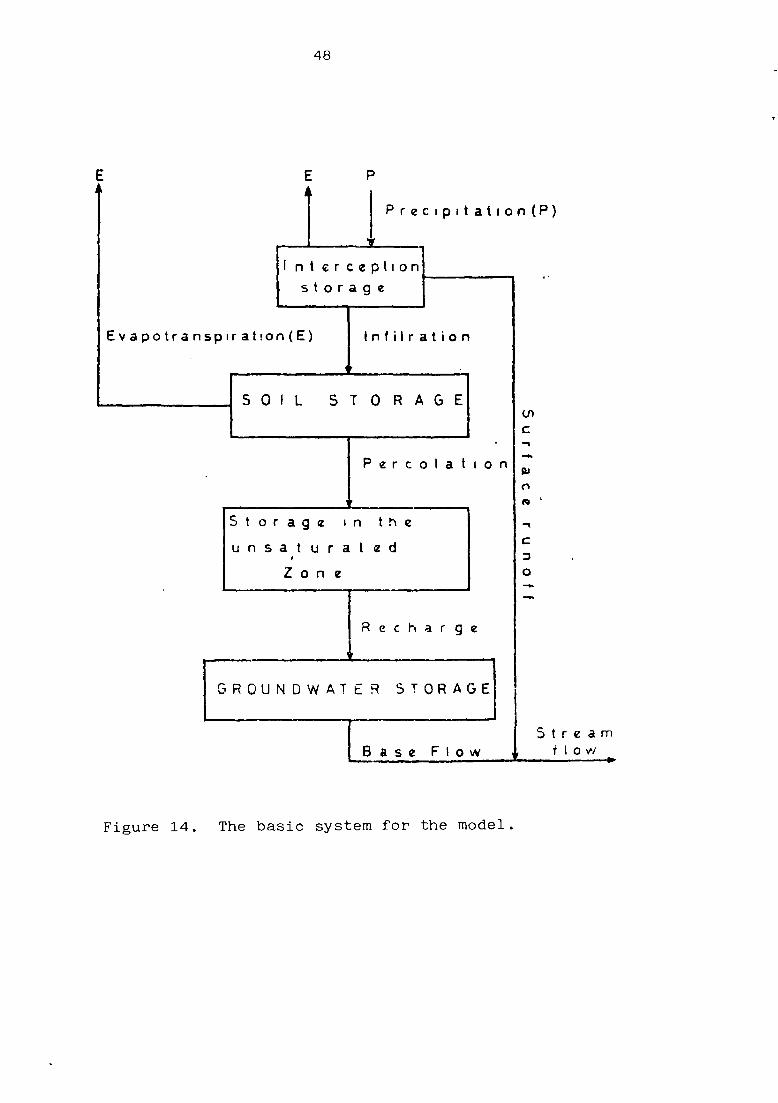
the cycle to the total cycle. The basic system for the
hydrological model is shown in figures 14 and 15.
The main hydrological processes are: precipitation, evapo—
transpiration, surface runoff, infiltration, percolation,
recharge, base flow and stream flow. These processes in
the model form a system.
The model needs a set of hydrological parameters to be used
in the computation. Besides the stream flow coefficients,
the variables used in the model include: interception
storage, interception storage capacity, soil field capacity,
soil wilting point and soil storage.
Essentially what is done is selection and use of these
parameters to see if, with minor adjustments, they fit
the model.
H -
~ Supply
48
E E P
P rec up~tation(P)
Recharge
GROUNDWATER STORAGE
Base FlowStream
0 W
[I nt erceptionstorage
Ev apotra nspirahon(E) Infilration
SOIL 510 R AGE
IonPer cola
Storage In the
u n s at u r a t e d
Zone
(1)
-I
C-’
C
0
Figure 14. The basic system for the model.

49
AD Parameter and inittal DataREA[) weights(WR I)
initial Data WR(I
Figure 15. The flow chart.

50
When the observed and simulated hydrographs are compared,
it Is found that the latter reacts after a few pentades.
The obtained results are rather poor mainly due to:
- the data from the rain gauge network may to a certain
damage be non-representative
— the catchment is too big (2 920 km2 ) and the estimated
set of parameters may not be truely representative
values for the whole area.
3.2.3 BRALUP Method
Wingard and Ruse /3/ used partial regression analysis for
synthesising hydrographs from rainfall data. This was used
as a case study of Kilombero River Basin which is a part
of the Rufiji River Basin, potentially one of the most
important water resources in Tanzania. The area of the
catchment to the gauging site is 33 400 km2 . The results
were not satisfactory due to
— too large a catchment area
- at the time of their study only four rainfall stations
covered the whole of this area
— due to the pattern of scattered tropical rain storms
this is obviously not an adequate network.

51
4. CONSTRUCTIONMATERIALS
‘~.1 Introduction
Theoretically earthdam embankments can be designed in such
a way that soils of any type can be used. Practically,
highly organic fibrous soils (e.g. peat) are not chosen
because of low shear strength and high compressibility.
Because of the construction difficulties, inorganic clays
of very high plasticity are not desirable except where no
other materials are available, or in regions where water
content control is not excessively difficult /22/.
4.2 Definitions
4.2.1 Soil
In the engineering sense, soil is any naturally occuring
loose or soft deposits forming part of the earth’s crust,
particularly where they occur close enough to the surface
of the ground to be encountered in engineering works, but
excluding topsoil. The term covers such deposits as gravel,
sands, silts, clays arid peats. It should not be confused
with the agricultural or pedological soil which embrace
only the topsoil and subsoil. Pedological soil may come
within meaning of the word in the engineering sense when
it is excessively deep as in some tropical soils such as
mbuga.
Subsoil is the weathered portion of the earth’s crust
thst lies between the topsoil and the unweathered material
below.

52
Topsoil is the superficial skin of the deposits forming the
earth’s crust that has, by processes of weathering and the
action of organic and other agencies, been transformed into
material capable of supporting plant growth. The term thus
embraces the upper or humus bearing horizons of the soil
of’ pedology./2/
4.2.2 Rocks
In engineering rock is hard and rigid deposits forming
part of the earth’s crust. Example are sandstones, lime—
stones, metamorphic formations and igneous masses. Geolo-
gists define rock as any naturally occuring deposits be
they hard of soft, but excluding topsoil /2/.
4.3 Major Soil Groups (Unconsolidated Sediments)
The major soil groups which may be encountered in the
region under study are: Marine clay, marine and beach
sands, estuarine muds and silts, alluvium, lacustrine
sediments and pyroclastic deposits.
4.3.1 Marine Clays
a) Deposition: Slow settling in relatively deep slow—moving
saline water, usually very flocculant, with high moisture
content when first deposited.
b) Mineralogical and mechanical composition: Mostly clay
minerals with fine detrital quartz, sometimes calcite
and/or sulphides. Usually clay content is more than
silt, whereas silt content is much more than sand (i.e.
clay) silt> sand). Shaley bands may be present and
bituminous organic matter can be an important constituent.
Tecture clay or silty clay, class CH.

53
c) Characteristics:
Swelling, plasticity and cohesion, strength dependent on
whether or not pre-consolidated. Hydraulic conductivity
very low, no clear water table but surface water in
humid climate in absence of artificial drainage. Topo-
graphy generally low with low amplitude.
4.3.2 Marine and Beach Sands
a) Deposition from rapidly moving water or on beaches by
wave action where often transitional, to coastal dunes.
An example is modern beach sands.
b) Mineralogical and Mechanical Composition:
Mostly detrital quartz, sometimes with iron oxides,
calcite etc. The sand content is much more than silt
and clay. There are virtually no stones but iron oxide
concentrations may occur. Texture sand, class SF but
beach sand may pass into shingle, marine sands are
usually better graded than beach sands.
c) Characteristics:
No plasticity or cohension. Hydraulic conductivity
generally very high although cemented layers may occur;
water table well defined if’ present.
4.3.3 Estuarine and Coastal Muds and Silts
a) Deposition: in water moving at low velocity, saline or
brackish.
Example: estuarine and deltaic marshes and tidal flats,
e.g. mangrove swamps.
b) Mineralogical and mechanical composition:
Sand and silt fractions mainly detrital quartz with
variable accessories such as muscovite, iron oxides.
calcite; often black iron sulphides below surface.
54
Clay minerals variable according to source area. Particle
size very variable; silt and very fine sand usually
dominant, coarse sand virtually absent. Textures typi-
cally silt loam, silty clay loam, fine sandy loam etc,
classification ML, possibly CL, with variable grading.
c) Characteristics:
Plasticity, cohesion and swelling variable according
to clay content and state of dispersion. Hydraulic
conductivity intermediate, may fall if clay disperse
after reclamation.
4.3.4 Alluvial Deposits
a) Deposition: from water no longer moving fast enough to
keep the load in suspension. The main circumstances
are: -
- from the overflow of modern perennial streams in their
flood plains (fine or coarse according to rate of
flow)
- from formely existing streams, evidenced by valley-
side terraces or buried channels (coarse or fine)
— from seasonal torrents as alluvial fans or wadi-fall
(coarse or very coarse)
- from seasonal sheet wash across broad gently sloping
sediments into playas or mbugas (fine).
Examples: fine grained alluvium of major rivers such as
the Nile, alluvial fans and wadi-fills of North Africa
etc, mbugas of East and Central Africa.
b) Mineralogical and mechanical composition:
detrial quartz, feldspars, micas, iron oxides, calcite,
clay minerals ete, very variable according to terrain
drained. Particle size depends on both source area and
speed of water flow, texture ranging from silty clay
to sand or gravel, classification and grading likewise
variable.

55
c) Characteristics:
plasticity, cohesion and hydraulic conductivity depend
mainly on local particle size and cannot be generalized.
4.3.5 Lacustrine Sediments
a) Deposition: in fresh or variably saline water but often
with seasonal change in rate of sedimentation giving -
rise to varves. An example in the alluvial and pyroclas—
tice sediments in lakes of the African Rift Valley.
b) Mineralogical and mechanical composition:
Sand grades mostly quartz and other detritals, sometimes
organic or inorganic clacite present; gypsum in saline
lakes and volcanic glass in active areas. Clay minerals
also are very variable according to source area; unusual
clays such as palygorskite may form in very saline
water. Particles mostly fine; textures silty clay,
silty clay loam etc, often with large organic component;
classification Ml, CL, OL, MH, OH.
c) Characteristics:
plasticity, cohesion and swelling variable but not
usually very low; poor bearing capacity in locally
moist areas.
4.3.6 Pyroclastic Deposits
a) Deposition: volcanic ash and cinders setting on land or
in water bodies. Examples: in vicinity of most volca-
noes e.g. African Rift Valley, pozzolanas.
b) Mineralogical and mechanical composition:
Volvanic glass, sometimes with recognisable minerals e.g.
augite. Large fragments (cinders) or fine dust (ash)
gives textures initially gravel or sand to silt respec-
tively, but volcanic material weathers quickly in humid
to loam or clay. Classification: ML to MH weathering to CH.

56
c) Characteristics:
Plasticity, cohesion and swelling negligible until
material weathered when all may greatly increase.
Hydraulic conductivity likewise high or very high
initially, tending to fall with weathering.
4.4 Properties of Soil Components
4.4.1 Gravel and Sand
These are the coarse grained components of soil, which have
the same engineering properties, differing mainly in
degree. Well graded, compacted gravels or sands are stable
materials. When they are not mixed with fines, they are
pervious, easy to compact and little affected by moisture.
Although grain shape and gradation, as well as size, affect
these properties, gravels are generally more pervious,
more stable and less affected by water than are sand, for
the same amount of fines.
As sand becomes finer and more uniform, it approaches the
characteristics of silt with corresponding decrease in
permeability and reduction in stability in the presence of
water. Very fine, uniform sands are difficult to distinguish
visually from silt. However, dried sand exhibits no cohesion
(i.e. does not hold together) and feels gritty in contrast
to the very slight cohesion and smooth feel of dried silt.
Dry silt feels like flour.
4.4.2 Silt and Clay
Even small amounts of fines may have important effects on
engineering properties of the soils in which they are found.
As little as 10 percent of particles smaller than 75 ~m
(BS No. 200 sieve) size in sand and gravel may make the
soil virtually impervious, especially when the coarse grains
are well graded.

57
Soils containing large quantities of silt and clay are the
most troublesome to the engineer. These materials exhibit
marked changes in physical properties with change of water
content.
A hard, dry clay , for example, may be suitable as a foun-
dation for heavy loads so long as it remains dry, but may
turn into a quagmire when wet. Many of the fine soils
shrink on drying and expand on wetting, which may adversely
affect structures founded upon them or constructed of them.
Even when the water content does not change, the properties
of fine soils may vary considerably between their natural
condition in the ground and their state after being dis-
turbed. When the soil is excavated for use, as a construc-
tion material or when the natural deposit is disturbed,
for example by driving piles, the soil structure is destroyed
and the properties of the soil are changed radically.
Silts are different from clays in many important respects
but because of similarity in appearance, they often have
been mistaken one for the other, sometimes with unfortunate
results. Dry, powdered silt and clay are indistinguishable,
but they are easily indentif’ied by their behaviour in the
presence of water.
Silts are the non-plastic fines. They are inherently
unstable in the presence of water and have a tendency to
become “quick” when saturated. Silts are fairly impervious
and difficult to compact. Silt masses undergo change of
volume with change of shape (i.e. the property of dilatancy),
in contrast with clay which retain their volume with change
of shape (i.e. the proerty of plasticity). The dilatancy
property, together with the “quick” reaction to vibration
affords a means of identifying typical silt in the loose,
wet state. When dry silt can be pulverized easily under
finger pressure (indicative of very slight dry strength),
and will have a smooth feel between the fingers in contrast
to the grittiness of fine sand.

58
Silts differ among themselves in size and shape of grains,
which are reflected mainly in the property of compressi-
bility. The liquid limit of a typical bulky grained,
inorganic silt is about 30 percent, while highly miceceous
or diatomaceous silts, consisting mainly of flaky grains,
may have liquid limits as high as 100 percent. The diffe-
rence in quicking and dilatancy properties afford a means
of distinguishing in the field between silts of low liquid
limits (L) and those of’ high liquid limits (H).
Clays are the plastic fines. They have low resistance to
deformation when wet, but they dry to hard, cohesive masses.
Clays are virtually impervious, difficult to compact when
wet, and impossible to drain by ordinary means. Large
expansion and contraction with changes in water content
are characteristics of clays. The small size, flat shape
and type of mineral composition of clay particles combine
to produce a material that is both compressible and plastic.
The higher the liquid limit of a clay, the more compressible
it will be when compared at equal conditions of pervious
geological loading. Hence in the Unified Soil Classifica-
tion System, the liquid limit is used to distinguish between
clays of high compressibility (H) and those of low compres-
sibility (L). Differences in plasticity of’ clay are reflec-
ted by their plasticity Indexes. At the same liquid limit,
the higher the plasticity index, the more cohesive is the
ci ay.
Field differentation among clays is accomplished by the
toughness test in which the moist soil is molded and rolled
into threads until crumbling occurs, and by the dry strength
test which measures the resistance of the clay to breaking
and pulverizing.

59
Plasticity the most characteristic property of clay, is the
ability of a material to change Shape continuously under a
stress and to retain the new shape when that stress is
removed. It depends on the nature and particle size of
the clay micelles and on the thickness of the water films
between them. At low water contents only rigidly fixed
water is present, surface attractive forces predominate
and the clay is strongly cohesive and non—plastic. With
increasing moisture, layers develop and at the plastic
limit cohesion is sufficiently reduced for the plate shaped
micelles to slide past each other, lubricated by the water
films; at the liquid limit films are so thick that the clay
becomes slurry with virtually no shear strength. The
difference in moisture contents between the plastic and
liquid limits (PL and LL) is the plasticity index (Pr).
The presence of’ organic matter can markedly raise the
liquid limit.
4.4.3 Soil Shear Strength
Shear strength is a complex function, not yet fully under-
stood, of friction between soil particles of all sizes
which is dependent on the overburden, and cohesion between
clay particles which is independent of loading. Shear
failure may occur by rupture along a shear plane, or by
flow, which in cohesive soils is plastic over the range of
the plasticity index (figure l~) and which approximates
to viscous above the liquid limit.
.‘Ju —
V-
a-.0lC
fL
MoIsture pcrcento9e
Figure 16. Shear strength of clay soil in relation tomoisture content (after BAVER et al 1972).

60
The apparent viscosity of’ a slurry is the ratio of the
applied shear stress to the rate of shear. Shear strength
is related to clay mineral type and to exchangeable cations
and is strongly influenced by the degree of compaction or
bulk density as well as moisture content.
Soil shear properties can be markedly altered by remoulding.
In wert granular soils and some flocculated clays working
may increase the voids ratio, moisture films are reduced in
thickness and strength rises. Such soils are termed dila—
tant, e.g. raoist beach sands. More usually shear strength
is reduced by working or shock although it may subsequently
recover.
Sensitivity is the ratio of the shear strength of the soil
in its original condition to that after remoulding at the
same moisture content. Values range from less than 1 in
“insensitive” soils to over 16 in “quick” clays, such as
in some recent marine clays. Very sensitive soils may be
subject to failure due to earth tremor or excessive vibra-
tion during construction.
Shear strength can be measured in the laboratory by shear
box and other tests, but practical measurements can be
made on site by empirical methods using shear vanes or
con penetrometres.
Soil compressibility
Compressibility is the relationship between reduction of
voids ratio (or increase in bulk density) and applied load.
Compression of granular soils depends on the compressibility
of the mineral grains, pore water pressures and the extent
to which rearrangement of particles is possible. Adjustment
to stress takes place relatively rapidly. In cohesive soils
compression is slow and is often termed consolidation. The
latter is importantly related to shear strength (fig 17).

61
Figure 17. Changes in shear strength with drying andoverburden of London clay soil (afterSkempton and Northey 1952).
In saturated soils the stress is initially carried by
pore water which builds up excess pressure. This is slowly
dissipated by migration into adjacent soil, the rate depen-
ding on the hydraulic conductivity. Compressibility is
also affected by the initial arrangement of the clay minerals.
With increasing stress preferred orientation tends to
increase and in the last stages of compression (secondary
compression) the load is probably mainly carried by the
swelling pressure of the clay micelles. Compressive beha-
viour is strongly dependent on clay mineralogy and
exchangeable cations.
Shear strength
ill
Ii.
Ia.
V
T
62
4.5 Soil Classification
There are various methods of soil classification. The method
in use is the Unified Soil Classification System.
4.5.1 Unified Soil Classification System (UCS)
In this system soils are divided into two main categories,
coarse grained and fine grained soils. These are defined
as follows:
a) coarse grained soils are soils in which more than 50
percent by weight of a representative sample of the
soil is retained on the 75 ~m (BS No. 200) sieve
b) fine grained soils and soils in which 50 percent or
more by weight of a representative sample of the soil
passes the 75 ~m sieve.
The results of a sieve analysis are needed to place the
soil in one or other of these categories. The procedure for
classification is then carried out under the appropriate
category as described below.
Classification of coarse grained soils
The procedure for classifying coarse grained soils is
outlined in diagramatic form in figure 18.
By definition the coarse grained soil particles stopped
by the 5 mm sieve are gravels, and those passed are sand.
The results obtained from a sieve analysis show whether
the sample contains more gravel or sand, and this determines
the first letter G (for gravel) or S (for sand) for the
sample.

63
Figure 18. Unified classification system — coarsegrained soils.
The sample is then placed in one of three cases depending
on the percentage of the sample passing the 75 p.m (BS No.
200) sieve as follows:
a) Case 1. Less than 5 percent of the sample passes the
sieve.
b) Case 2. Between 5 and 12 percent passes the sieve.
c) Case 3. Between 13 and 49 percent passes the sieve.
The results of the sieve analysis enable the grading coef-
ficients for the soil sample to be calculated. These are
the coefficient of uniformity (Cu) and the coefficient of
gradation (Gg) and are obtained from the formulae:
D~0Cu = and Gg =
10 D60D10
G —grovel. ~ particles stopped by 5mm skyeS —sand. Ic particles passing 5mm sieveCu—coefficient of uniformityCg—coefflcient of 9rodatIo~
M—siitC—clayW—weIl gradedP—poorly graded

64
where D60, D30 and D10 are the particle size diameters
at which 60, 30 and 10 percent of the soil passes.
The second letter of the classification is obtained as
follows:
a) Case 1.
b) Case 2.
c) Case 3.
Determine the values of Cu and Gg for the
sample as described above and using figure 18
determine the second letter.
Soils in this category are given dual classi-
fication as for case 1, and then as for case 3.
The soil sample is then classified using both
pairs of letter e.g. GW/GM.
Classify the soil passing the 75 p.m sieve
by means of a fines test which will determine
whether the fines are clay or silt and this
will decide whether M (silt) or C (clay) is
to be used.
Soils can also be placed into high (H) or low (L) liquid
limit groups depending on whether they have a liquid limit
of more or less than 50, and this can be shown by the
addition of H or L to the classification group (see fig. 19).
The UCS allows the addition of a third letter to soils of
types GM and SM to indicate the construction quality of the
soil, as desirable or undesirable. If the liquid limit is
28 or less and the plastic limit 6 or less the letter d is
added, i.e. GMd, whereas if the liquid limite exceeds 28
or the plastic limit exceeds 6, the sample is undesirable
and the letter u is added, i.e. GMu.

65
Classification of fine grained soils (fines test)
The classification of fine soils is determined by comparison
of the plasticity index and the liquid limit of the sample.
The liquid limit, the plastic limit, and the plasticity
index are determined by tests. The plasticity index is
plotted against the liquid limit on the plasticity chart
(fig 19) and the classification of the fine grained soil
read off.
If the fine grained soil contains appreciable organic
material, the soil is given the first letter 0. The percen-
tage of organic material should be quoted and the other
constituents identified /2/.
~n
— — — —
CL
CH
~
~~—
4~-—
~i~
—
—
— - — — — ~-& — — --
— -~ —-~-———OL710
4—0 10 20 30 40 50 60 70 80 90 tOO
Liquid limit O/o
C—cloy H—HIihLLM—slit L—Low LL0 — organic
Figure 19. Plasticity chart (UCS).
4.6 Tropical Soils
In this section the discussion will be on the soils which
are frequently encountered in the tropical regions, and
which present special problems.
50C
o0.

66
4.6.1 Laterite Soils
Laterite soils are tropically weathered materials rich in
secondary oxides of iron, aluminium or both. They are
diverse in their properties and exist as:
- red friable soils
- red clay
— hard or soft coarse angular red granula concretions
— laterite rock.
Thus laterite soils are more of a soil group rather than
a well defined material. This is not the case with other
soil types. They are among the major soil types of the
tropics. They can be found in large areas of Malaysia,
India, Africa and Central and South America.
Figure 20. Generalized world map showing thedistribution of laterite soils.
67
Laterite soils are formed from parent material rich in
ferro—alumino silicates by a weathering process known as
laterization. This is a process of alternate leaching and
drying, whereby ferro-alumino silicate minerals are decom-
posed and sesquioxides are deposited in an acidic media.
Silica is then leached away by alkaline soil solutions
part of which may form complexes with the sesquioxides to
accentuate the formation of concretionaries. Under non-
tropical climates leaching of’ silica does not take place.
Laterization is encouraged by:
- amount and kind of vegetation cover and organic matter
and humic residues formed
- permeable profiles
- hot climates with coolish nights
- heavy rainfall and high humidity
- a combination of alternating leaching by acidic solutions
and alkaline solutions
- fluctuating water table
— parent material containing ferro—alumino silicates.
During the process of laterization silica (Si02) is leached
away and sesquioxides of iron and aluminium (Fe203 , Al20~)
are deposited. This implies that the more advanced the
laterization is, the greater the amount of sesquioxides
which will be deposited. Thus the degree of laterization
may be assessed by the silica—sesquioxide ratio. The lower
the ratio the more advanced is the laterization.
Identification of laterite soils
A typical laterite soil profile will consist of the
following horizons:
Horizon Description
A zone of’ leaching
B zone of accumulation — laterite horizon
C zone of weathering and removal of soluble
constituents
sound parent materialID

68
A great variety of soils may overlie the laterite horizon
or underlie it.
The laterite horizon may be found on the surface due to
erosion of’ the overlying soil. In dry areas or regions of
good aeration the underlying soil is bright red in colour.
In low altitudes the underlying soil is mottled or bright
coloured.
Characteristics of laterite soils
Laterite soils have quite unique characteristics which
distinguish them from other soils. This is due to their
genesis. The dominant effects are:
- leaching which develops high void ratios
- cementing and coating effect of sesquioxides
— high specific gravity of the iron oxide minerals
— red colour of the iron oxide.
Colour
Due to the presence of iron oxides, laterite soils are red
in colour ranging from light, through bright to brown
shades.
Hardening
Laterite soils may be soft at the time of excavation but
harden upon exposure. This is because the sesquioxide
minerals which coat and cement together soil grains harden
by dehydration and recrystallization.
Low insitu density
Laterite soils are characterized by high void ratios because
of the genetical leaching effect. This situation gives rise
to low insitu densities. However, at high degrees of
laterization the accumulated sesquioxides fill up the voids
to raise the insitu densities again (e.g. laterite rock).

69
High insitu permeability
Because insitu laterite soils are characterized by high
porosity they are of relatively high per’meabtlities. This
also is due to leaching.
Insitu high strength
Due to cementing effect of sesquioxides laterite soils
have relatively high shear strengths.
High specific gravity
The specific gravity of iron oxides is higher than those of
common soil grain minerals. Thus their presence in the
soil matrices raises the specific gravity of’ the latter.
The more advanced the laterization, the higher will be the
specific gravity of the soil grains above the parent mate-
rial. Specific gravity for laterite soils varies between
2,5 and 4,6.
Classification of laterite soils
To facilitate engineering analyses in practice, soils are
classified. There exists several classification systems,
but the most widely used is the Unified Soil Classification
System (UCS). The soil classification is based on the grain
size distribution and the plasticity of the fines of a soil
sample. In order to determine these quantities the insitu
structure of the soil has to be disturbed.
Some of the unique characteristics of laterite soils mentio-
ned above like low insitu density, high insitu permeability
and high insitu shear strength are for undisturbed state
of soil. For this reason they would not be reflected by
the normal classification tests. In fact the plasticity
and grain size gradation suggest that the insitu laterite
soils would be more impermeable, more compressibe and of
lower strength than is actually the case. Thus to charac—

70
terize the engineering potential of insitu laterite soils
emphasis is put on tests on undisturbed samples and field
tests.
For use of laterite soils in a disturbed form, e.g. compac-
tion, classification tests stil need to be supplemented
by tests on durability of coarse particles (gravel and sand)
and plasticity characteristics of the fine grained frac-
tions of gravels and sands.
Variability of the properties of laterite soils
Properties of laterite soils are highly variable and often
can be erratic. Texturally they may contain: boulders,
cobbles, gravels, sands, silts or clays. This situation
results from the differences in:
- nature of parent material
- mode of formation (genesis)
— degree of weathering:
-— decomposition
—— desiccation
-— leaching
— position of sample in topographic site
- sample depth in profile.
Problem laterite soils
Particle size analysis and plastic limit tests can be
carried out satisfactorily on most laterite soils by stan-
dard laboratory procedures. These soils are referred to as
normal laterite soils. With some laterite soils the stan-
dard tests do not yield reproducible results. These soils
are referred to as problem laterite soils. This situation
is due to large influences of pretest preparations and test
procedures.

71
Pretest preparation is affected by the following:
- removal of cementing free iron oxides (e.g. micro
clusters)
— sensitivity to:
-- degree of remoulding
—— degree and type of drying (e.g. dehydration of
iron oxides)
—— time of mixing
- dehydration of weak modular materials.
For normal stable laterite soils the natural moisture
content is generally less than the plastic limit. With the
problem laterite soils natural moisture content may be as
high as the liquid limit in high rainfall forests. Problem
laterite soils have been indentified as soils on:
- recent volcanic areas
- areas of continuous wet climate ~ 1500 mm/a.
They are characterized by:
- high natural water content
- high liquid limit
- low natural density 0.3 — 1.2 g/m3
- low compressibility.
They can be evaluated on the basis of
— inconsistent particle size distribution
— inconsistent plasticity characteristics
— potential smell
— self stabilization.

72
Engineering properties of laterite soils
Shear strength
This is the major property of soils as it provides suppor-
ting ability and stability of slopes. The higher the degree
of laterization the more favourable are shear strength
parameters.
Bearing and penetration characteristics
(The difference between the tow is a matter of scale.)
Because of erratic structure field penetrometer tests are
most useful.
Compression strengths for concretionary laterite rocks
and pisoliths:
— It may be satisfactory with hard concretionary particles.
- It may be very questionable with friable and weak
concretionary particles.
— More reliable tests are:
—— aggregate impact value test
—- aggregate abrassion test
—— aggregate crushing value test
— specific gravity is a reliable index for strength.
Compressibility and permeability
- with fine-grained residual laterite soils the rate of
consolidation is high
— permeability is generally higher for undisturbed porous,
residual soils and lower for compacted soils
Compaction characteristics
The object of soil compaction is to reduce the sensitivity
of strength and volume changes to environmental changes,
especially those affected by moisture. The compaction
.

73
process increases the strength and bearing capacity, and
reduces the compressibility and the permeability. Compac-
tion characteristics are influenced by processes of laterite
soil formation and pretest preparations.
Stabilization of laterite soils
Laterite soils may be stabilized if need be. This can be
effected by:
— cementing agents — cement, lime
- modifier agents — cement, lime, bitumen.
Due to high content of sesquioxides laterite soils use
only small amounts of cement and lime (4 — 7 %) due to
reaction of lime with iron and aluminium oxides. Certain
types of’ laterite clays are unsuitable for stabilization
with either lime or cement.
Field performance of’ laterite soils
Field performance depends on the content of’ sesquioxides.
The higher the iron oxide content the higher the strength.
Embankments and earthdarns
- Residual compacted soils are resistent to piping by
seepage.
- A major design problem is to avoid piping by cracking
of some compacted laterite soils.
- Laterite soils may be used for both homogenous as well
as zoned cross—sections.
- In spite of their low permeability after compaction,
their consolidation coefficients are usually fairly
high.
I

74
Stability of slopes
- The depth of wetting is a controlling factor for stabi-
lity of slopes in residual laterite soils.
- The most practical method of ensuring stability of
slopes is to limit the depth of wetting by preventive
infiltration.
— Landslides are normally confined to 3 — 6 m below the
surface.
- Analytical design of cuttings and natural slopes in
laterite soils are often impossible.
— Empirical design methods based on the systematic collec-
tion of slope performance data provide a logical alter-
native.
— Erosion resistance is influenced by soil properties and
may be improved by spraying resistance agents - cement,
lime, bitumen etc.
4.6.2 Black Cotton Soil
Black cotton soils are highly expansive clays found in the
tropics. Potentially expansive soils can be found in the
semi—arid regions of the tropic and temperate climate
zones. They are abundant where evaporation exceeds preci-
pitation and lack of leaching aides formation of montmoril-
lonite clay mineral.
Expansive soils have been found in North and South America,
Africa, Middle East, India, Australia etc. Expansive soils
can cause considerable damage to engineering structures.
For instance, in the USA (1973) the expansive soils damages
exceeded the combined average annual damages from floods,
hurricanes, earthquakes and tornadoes.

75
Formation
The expansive property of the black cottofl soils (and other
expansive soils) is attributed to the high content of’ mont—
morillonite clay mineral which causes large volume changes
on wetting and drying. Montmorillonite results from
decomposition of feldspar and pyroxene minerals of parent
materials under alkaline conditions due to poor drainage.
Expansive soils have been found over both Igneous and
sedimentary rocks.
- Igneous rock:
-- basalts Deccan plateau in India
-- dolerite sills and dykes in South Africa
—- gabbros and norities in South Africa
- Sedimentary rocks:
-- shale in North America
—- marls and limestones in Israel
-- shale in South Africa
Black cotton soils are black in colour because of the
presence of notronite, a montmorillonite mineral in which
ferric ions predominate. The soil is formed under “reducing”
condition whereas under “oxidation” conditions ferrous
oxide predominates and makes the soil red.
Characteristics of expansive soils
Swelling
Montmorillonite clay mineral expands as it absorbs moisture.
It can expand upto 400 %. Thus clays with a high proportion
of montmorillonite clay mineral’ will swell when moistened.
Moisture content
The degree of expansion or volume change will depend on
the range between the initial moisture content and final
moisture content. Thus no volume change for no moisture
variation. Maximum change takes place between dry state and
saturated state.

76
6
5
I
2
0
Dsgrsi of Saturation C%)
Figure 21. Effect of varying degree of saturation onvolume change for constant density andmoisture content sample.
Shrinkage
Shrinkage is a mirror image of swelling.
Thickness of stratum
The amount of’ swelling is also influenced by the thickness
of the stratum of the expansive soil. The greater the
thickness the bigger the volume change.
7’
60 70 eo I0

77
II
I
S
I
$
3
Figure 22. Effect of varying sample thickness onvolume change for constant density andmoisture content samples.
Dry density
Amount of swell varies with the dry density. Thus the higher
the dry density the greater will be the swell potential.
Clays with dry densities in excess of 1,75 g/cm3 are of
high swelling potential.
I
I
4
t
S~. TWcknss. (msh.s)
0

78
I
7
S
J4
3
C
0
Figure 23. Effect of varying density on volume changefor constant moisture content samples.
Swell fatigue
When an expansive clay is subjected to several cycles of
wetting and drying from an initial moisture content, the
amount of expansion will get less with each cycle asymto.-
tically. This phenomenon is known as swell fatigue.
9
~, OSMIIY (pci)
79
Swell pressure
When an expansive clay swells it exerts a pressure known
as swell pressure. This is defined as the pressure required
to keep the volume of a soil at its dry density constant
i.e. at zero volume change.
Swell pressure is built in property constant for a given
dry density. It increases with the increase of dry density.
It is not affected by placing condition such as:
- surcharge pressure
— initial moisture content
- degree of saturation
— thickness of’ stratum.
Identification of black cotton soils
Black cotton soils may be identified by their characte-
ristic black colour and by the following means:
- mineralogical identification
- soil index properties
-- potential volume change (PVC)
—— activity
-— Alterberg limits
—— free swell
—— colloid content
— direct measurement — most useful
Generally these methods should be used in combination. A
guide for estimating swell potential is presented in table 7.

80
Table 7.
S~ll potential Probableexpansion
%
Liquilimit
%
d Plasticityindex
< 2rnfines
~
Standardpenetrationtest (SPT)blcMs/ft
Very high > 10 > 60 35 — > 95 > 30
High 5 — 10 40 — 60 20 — 55 60—95 20—30
Medium 1 — 5 30 — 40 10 — 35 30—60 10—20
Low < 1 < 30 0 — 15 < 30 < 10
Engineering properties of black cotton soils
In general, black cotton soils possess poor engineering
properties. They are difficult soils to deal with. They
should be avoided if possible.
The major engineering properties are that they are:
— impervious
— of low shear strength
— of high compressibility when compacted and saturated
- poor workability
— expansive property accompanied by swell pressure cause
damages to engineering structures.
4.7 Procedure for Soil Investigation
The usual practice is that the team from the soils labora-
tory goes to the site right after the selection of the site.
In the current practice, preliminary designs are carried
out without any soil investigation, and often the final
designs also. Then the soil investigation is done after
the plans have been approved. This is quite contrary to
standard practice, as this leads to many assumptions in
the designs. Further, construction material might not be

81
available at an economical distance, but since at this
stage the plans are already approved, the construction
must he carried out. Also some regions dig test pii~s at
the site and send samples to the soils laboratory for
testing. This is also contrary to standard practice, as
only the soils engineer knows where to dig these pits.
It is recommended that the field identification and labo-
ratory testing be carried out by staff from the soil mecha-
nics laboratory /15/. This will greatly assist the designer
and save costs.
4.8 Selection and Operation of Borrow Areas
The borderline between borrowing and quarrying is not well
defined, and quarries may also be opened for local usage.
The term “borrow pit” is normally restricted to local exca-
vations where blasting is not required.
Borrow pits are local sources of supply for soils and
naturally occuring aggregates required for construction
works. They may range in size from the small pits a few
metres square, dug by hand along dirt roads to supply
materials for repairing potholes, upto the very large pits
worked by bulldozers and scrapers used to obtain the vast
supply of materials needed for earth fill dams. For example
at Kainji Dam, Nigeria, about 20 million tons of potential
suitable borrow material was proved during the site investi-
gations /2/. The design of these large structures depends
upon adequacy of local supplies of suitable, easily won,
borrow material. On the other hand, transport routes are
usually designed to ensure a balance between cut and fill
sections in order to minimise needs for handling imported
fill and surplus excavation of suitable material. The
maximum economic depth of excavation in borrow pits is
related to the scale of the operation and to surface slopes.
Generally the depth below access should not exceed about
6 metres.

82
Borrow pits should be selected on the basis of’ their content
of suitable material, distance from the worksite, drainage
problems and interference with other usage. They may be
located in the reservoir area, and this is good for environ-
mental reasons. This may also increase the reservoir volume.
Suitable deposits are often covered with surface soil
which must first be stripped. The site investigations should
include an estimate of the stripping quantities and the
availability of a stocking area for the overburden which
may be used later to restore the ground level so far as
practicable, to landscape the area as to assist stability.

83
5. CONSTRUCTIONOF EARTHDAMS
5.1 Introduction
In the preceding chapters poor construction control has been
cited as one of the major causes of earthdam failures in
Tanzania. The majority of dam failures which occured in
Arusha region during 1977—1978 have been attributed to
poor construction control, although hydrometeorological
factors are also to blame.
VBB /25/ also report that the investigations on the failure
of Wiyenzele Darn in Dodoma region and Itamuka Dam in
Singida region revealed some construction deficiencies
although these were not the main cause for the said failure.
The construction process usually starts with preliminary
works. These are the construction of access roads, labour
camp with all necessary accessories, diversion works etc.
After the preliminary works then follows processing of’
construction materials, foundation preparation, embankment
filling and finally slope protection. The spillway excava-
tion is scheduled so that material usable on the embank-
ment can be used directly without too much stockpiling.
Incase the material is not usable then it has to be dumped
away according to the specifications of the works.
5.2 Preliminary Works
The site has to be accessible from the main road and as
such the preparation of the access road is the first opera-
tion. Care should be exercised in selecting the route so
that excessive slopes and excavation or filling are avoided.
Other than clearing and levelling there is usually no need
of extra material on these temporary roads. However, some
temporary culverts capable of’ carrying heavy equipment may

84
be necessary and this has to be designed accordingly. In
Tanzania, most access roads to damsites use drift culverts
on which the floods pass as well as trucks. These provide
a cheap alternative to any other type of culvert.
Then the labour camp has to be constructed. These are usually
temporary structures which can be pulled down after the
construction period. In Tanzania, the labour camp usually
consists of single units of prefabricated huts or uniports.
These are easy to erect and also to pull down.
Corrugated iron sheets are also used in a timber frame to
make site camps, although these can be reused very few
times after which they have too many holes. Relatively
comfortable accomodation should be provided to the workers
as a incentive to work in surroundings which they are little
used to. The camp site has to be well selected so that
water can be obtained either by pumping from the river or
a shallow well or from a water bowzer. Sanitation of the
site is of paramount importance, hence some type of communal
pit latrines have to be constructed as well as workshops
for servicing equipment.
For the small to medium size dams under discussion, economy
dictates that expensive diversion works be avoided. In the
case of seasonal rivers, usually the construction of a
cofferdam is sufficient to keep the construction site dry.
However, in case of a large flood, it may be necessary to
make a temporary channel through the embankment to pass the
same. In the case os perennial rivers it may be necessary
to start construction on the abutments and complete the
middle portion during one dry season.
As this may not be feasible and there may be other users
downstream with water rights, some way of maintaining a
certain flow has to be adopted. In such circumstances,

85
the outlet works may be designed to pass the dry weather
flows or that sufficient to cover the abstraction rights
downstream whichever is greater. This implies that the out-
let cum diversion works have to be completed before any
impoundment is envisaged.
5.3 Foundation Preparation
The purpose of’ this is to ensure that the foundation will
bond properly with the embankment material, and to reduce
or eliminate subsurface seepage.
5.3.1 Foundation Excavation
Based on preliminary investigations a planned programme of
foundation excavation is initiated after setting out the
embankment spread. It is necessary to see to it that the
volume of excavated material and the configuration of the
excavation will reasonably approximate estimates in the
plans. It is necessary precaution to establish slopes for
excavations that will be permanently stable or that will
not fail during construction.
In foundations in unconsolidated natural deposits, excava-
tion may reveal inadequate localized or widespread founda-
tion materials that require special treatment or total
removal. Such material may be unconsolidated materials
rich in organic substances such as topsoil. Swamp muck or
peat, loose deposits of sand or silt and plastic, active,
sensitive or swelling clays. Poor foundation conditions
in rocks are associated with fracturing, weathering or
hydrothermal alteration, or poorly indurated sedimentary
rocks /27/.
Excavations in bedrock should to the extent possible extend
into firm, fresh rock. The main idea is to prepare a clean
surface that will provide an optimum contact with the dam
materials that will be placed on it.

86
5.3.2 Foundation Treatment
Ideally, excavations in unconsolidated deposits for a dam
should extend to solid bedrock for the full width of the
dam. However, there are many locations where the depth of
the valley fill is so great that dams must be constructed
in part or entirely on unconsolidated deposits, and as
required appropriate steps are taken to reduce subsurface
seepage to premissible levels.
Figure 24 shows cross—sections of several earth and/or
rockfill dams constructed at least in part on unconsolidated
subsurface deposits. The sections show various measures
that are taken to eliminate or greatly reduce potential
seepage beneath the dam under a variety of circumstances
/27/.
In a fractured foundation rock, the general method employed
for sealing the channels is grouting. The usual technique
utilizes drilling and pressure grouting with water—cement
mixtures or with other types of sealants. In dam foundations
three kinds of grouting programmes are identified /9/27/:
1. Comparatively shallow systematic “blanket” or “consoli-
dation” grouting over critical portions of the foun-
dation.
2. “Curtain” grouting from a gallery or concrete “grout
cap” along a specified location to provide a deep
impermeable barrier to subsurface ground water seepage.
3. “Off—pattern” special purpose grouting to improve
strength and/or to overcome problems created by ground
water circulation in zones Identified by geotechnical
studies.
Figures 25 and 26 illustrate the use of grouting in earth
dam construction.

Figure 24. Foundation treatment methods.
— - ~
tk’PERVtC~JS~LL E~L~ ~
F
—— ~vious -
—— MEM8R~NE ,‘-~- - - :- .9 ~
I:;;-?--.-
- -- -: : .“ -~~. c~AIN
— __L_’~~ - - .. .—; ...t. ~ ~
_____ • d
____ • ~
— .• - -- • .‘ • •~_=~=.-.: .. - . . . -
-
~~ROUT CURTAIPI
. I
A
________ - RIPRAP
B
- ~ ~~1~SI1EET PILING~ - :-~- -
- — - - :-- -•___________
C
a b

B
88
Figure 25.
Some cross—section of’ damswith rock foundationsshowing locations of drilledholes for foundation treat-ment.
a) rock-fill damwith impermeableconcrete face
b) zoned earth and rock-fill da~c) zoned earth and rock-fill dam.
~fl - - - — ~TR(AM-I
: ~:0:0:0:0
S : ~ : , ;: : .;;~CL,RTAN ~Q~)T p—~~5
FRc,~’~R~T C~~P
A
— ~./ CREST
~S~DEXCAVA~D ‘
- ~rT--y--~.-~- .- - - —- ‘S.-5: 1 I I
I,,————I r I I I
- - - I I~_ c~QfTCAPALE~TIYJ~IL HC~_ES I -£5 1T0J4fl) - - ‘
51JMtC u-,~-P:.~I — - j :_ - ~ ~ I’~LScw CROUT CI’- -.~N- - II~~IlIi~ ;o r
Figure 26.
Schematic locationsof pattern blanketand curtain groutholes in bedrock ofan earthdam of mode-rate size.
a) planb) section showing
formula depths forcurtain grout holes.
—— ___

89
The above mentioned methods are rather complicated and
require special equipment which the circumstances in a
developing economy may not permit. The use of a upstream
clay blanket should be investigated as this presents a
cheap way of’ reducing the seepage without the need for
extra equipment and expertise. The main constraint might
be the construction material, but since this is almost
always used as core material, it should present less
problems and costs compared to grouting./13/ However,
the feasibility of these methods should be worked out
during the design stage so that comparable costs are known
before selection of one of the methods.
5.3.3 Foundation Dewatering
When excavating at the riverbed for removal of silt and
other undesirable material, presence of water may present
a problem. The waterwill have to be removed so that the
work can progress without hindrance. There are various
dewatering techniques:
a) Gravity drainage. This involves the excavation of an
open sump where the water collects and is pumped out.
This is the simplest and most widely used method.
b) Wells and wellpoint systems. The drawdown caused by the
pumping of’ a well creates conditions which are favou-
rable for excavation. Figure 27 illustrates well layout
for dewatering /28/. When the required ground water
lowering at a site is not large, a wellpoint dewatering
system is generally used. A wellpoint dewatering system
consists of a series of’ closely—spaced small diameter
wells driven to shallow depths. These wells are connected
to a pipe or header that surrounds the excavation and
which is attached to a vacuum pump. Figure 28 illustrates
this /28/.
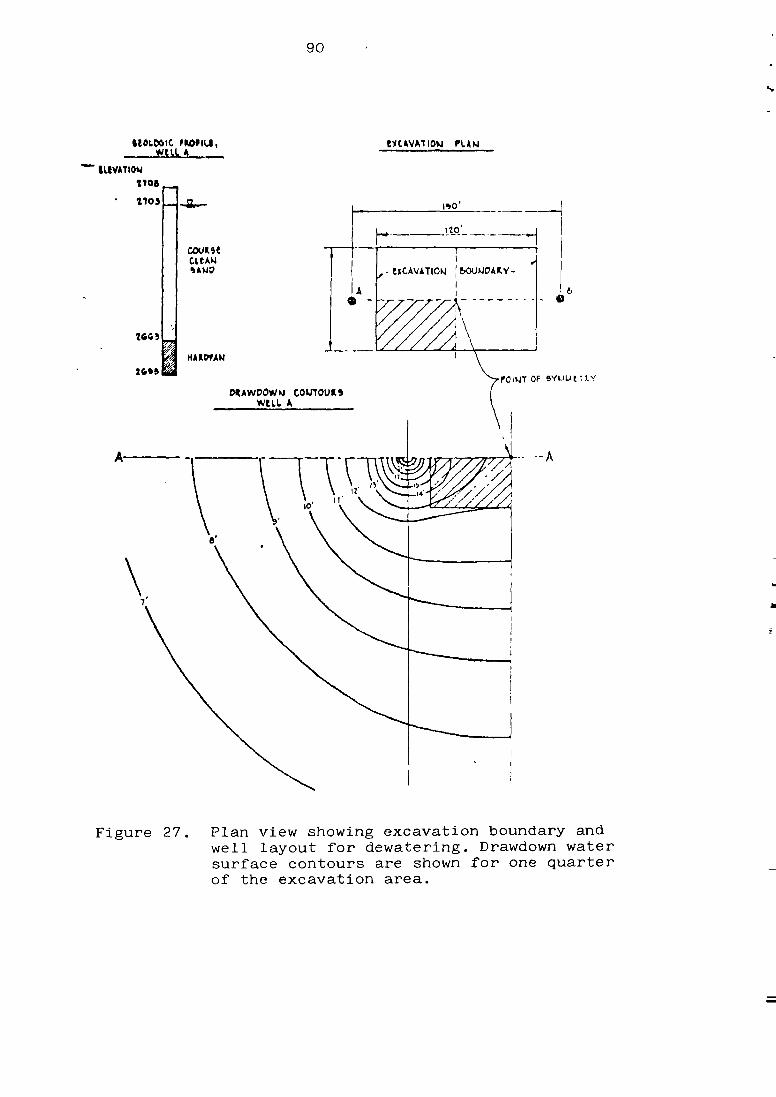
90
2103
C0U~3tCLtA~4
Ii~ HAI~VAW
I
D*AWPOW~J COUTOU~3W~LI. A
A
~CAVATI0~-J ?I.AW
Figure 27. Plan view showing excavation boundary andwell layout for dewatering. Drawdown watersurface contours are shown for one quarterof the excavation area.
~OLO0IC ~I.OPII.I,WRLA —
— ILeVAT~Ow1~08
OF ~VILAt~~-.
--A

91
Figure 28. A single stage wellpointsystem, showing the headerand riser pipes.
c) Special methods. These are expensive modern methods
which are employed when all the other methods have
failed or have otherwise proved unfeasible. Some of the
special methods are: electro—osmosis, freezing and
grouting. Figure 29 gives a schematic arrangement of
and electro—osmosis dewatering system /28/.
CATKO~ -(v~eu.rOI’-~T)
Figure 29. Electro-osmotic dewatering system(schematic).
~A~I1.
W!LL POIIJT
I.,

92
During the foundation preparation of’ Mindu Dam in Morogoro,
a welipoint dewatering system was used without success.
According to the contractor, dewatering was achieved as a
matter of luck due to a prolonged dry season which lowered
the water table.
The dewatering system depends much on the properties of
the soil and in particular the permeability. In view of
this it is important to study these properties before
designing a dewatering system. Figure 30 shows the range
of applicability of dewatering methods /28/.
5.4 Embankment Filling
5.4.1 Construction Methods
There are basically two methods of constructing the embank-
ment. These are the hydraulic fill method and the rolled
fill method. In the hydraulic fill the material is trans-
ported to the embankment construction surface in the form
of a slurry through a pipeline, and deposited. This is done
when the material is of medium to coarse sand, containing
silty fines from below water table. The water deposited
sand becomes adequately dense without any further compac-
tion /22/.
When pervious material is contaminated with silt and clay,
it becomes rather difficult for hauling equipment to travel
on top. To proceed with construction, either the material
is left to drain on the construction site for several days
before compaction or the hydraulic fill method is used.
Nowadays this method is used mainly in the construction
of ports and rarely in dam construction. In Tanzania, the
rolled fill method is used on all dam projects. Hence, this
discussion shall be limited to this method.

ii.,
p.
w
w2‘I.
p.2UU’S.
U.S. STANDARD SIEVEOPENINGS IN INCHES
3 2 I)S %KVD~OMETER
I-I
U’
U’U)
40UI-
UIU
U’S.
(0
_____ GRAVEL j SAND~E~~~iiiiE F,n. 1cp~smJ ~!~L±~!’! —
SILT or CLAY
Figure 30. Applicability of dewatering methods. (MoretrenchAmerica Corporation)
U.S STANDARD SIEVE NUMBERS3 4 6 10 1416 20 30 40 5070 100140200
1 I~ 01GRAIN SIZE IN MILLIMETERS

94
The construction procedure in the case of rolled fill
consists of’ excavating the material, hauling it to the
construction site, mixing it (this can be done either in
the borrow pit or on the embankment surface) to predeter-
mined water contents and uniformity of properties, sprea-
ding it in layers and compacting it to the desired density.
Usually a layer thickness of 15 — 20 cm is specified. The
rate of embankment construction depends on the size of the
project and the amount and types of equipment used, but is
limited to a maximum practicable value by the area of the
construction surface.
During the construction of’ Monduli Juu Dam which is 15 m
high with a crest length of 165 m, an average fill of
1 200 m3/d was achieved, using bulldozers, scrapers and
sheepsf’oot roller /19/. Larger quantities have been reported
on larger dams /6/22/.
Depending on the size of the dam, the equipment employed
ranges from manual or animal hauling to scrapers, trucks
or belt conveyers. Due to compaction specifications and
time scheduling, the compaction equipment is almost invari—
ably the same. The same pieces used on earthdams are:
— excavating equipment, e.g. power shovels, draglines,
bulldozers, scrapers etc.
— hauling equipment, e.g. carts, trucks, scrapers etc.
— spreading equipment, e.g. bulldozers, graders etc.
— compacting equipment, e.g. sheepsf’oot rollers etc.
— rock separation equipment, e.g. screens etc.
— discs, harrows and plows
— watering equipment, e.g. pumps, water bowzers,
compressors etc.
In addition to these, special equipment is frequently
devised for individual construction problems.

95
The selection of’ the equipment for compaction depends on
the nature of’ the soil to be compacted, the degree of
compaction required, and the space available to do it.
Sands are most efficiently compacted by vibration while
cohesive soils are better compacted by pressure that is
maintained for sometime /28/.
Among the various types of compactors available there are
many variations of size and shape of the compacting element,
ranging from the smooth drum of’ the vibrating roller to
the small protrusions of the sheepsfoot roller. Figure
31 gives a guidance on equipment selection /28/.
CO$AV*CTOI. ZOS~$or A??UCATIOII COUrACTIVE fIrOLT
Compaction equipment selection guide. Thischart contains a range of material mixturesfrom 100 percent clay to 100 percent sand,plus a rock zone. Each roller type has beenpositioned In what is considered to be itsmost effective and economical zone of appli-cation. However, it is not uncommon to findthem working out of their zones. Exact posi-tioning of the zones can vary with differingmaterial conditions.
CLAY ooL iAJ~’ LOCK3I4UP~O0L
“‘p
VI~P.&TO~V
— ~1~~-—3U001M ~TEI~.O~UM~
1~ —
UULTI-Ti~O_PWWIAATIC~~1~~~
- HfAVY rWIUM ~TIC.—
qTATIC WT1~weLvIUG
~TATIC.Wt ,KI~LW9~G
STATIC WI1 VI?’~ &TIOIJ
STATIC WT
~TATIC~/~API~G
STATIC WI, KNUt?IU~
~TATICWT,K~Juc’lIJG
~TAIIC WI, )&J~JtAOIWG, IUPACT I
TOWED_TAIAP1IJC POOl
HI~M3P1!D T*U?IIj~POOl
Figure 31.
Ioc~TAMPING JT~TICWT KN~APING,II~PACT VIATIOM~1~OT ~

96
5.4.2 Mechanics of Compaction
After the material has been dumped and spread into a layer
it is then compacted. For a given method and effort of
compaction, a soil is compacted to a unique density at
each water content. As can be seen in figure 32 the dry
density of the soil increases with increasing water content
until a “maximum dry density” is obtained at an optimum
water content. After this point the dry density begins to
decrease as the water content continues rising./22/28/
IIS
Figure 32. Typical relationship between dry density andwater content for one compactive effort.
For any soil, the optimum water content, the maximum density,
and the shape of the curve vary considerably with different
methods of compaction. If a soil is compacted by the same
method but with different compactive efforts, families of
compaction curves with similar shape are obtained, figure 33.
Waler content —e

97
-o
C)
Figure 33. Typical family of density water contentcurves for one soil obtained using thesame compaction method and equipmentbut different compactive efforts.
The higher the compactive effort the higher is the maximum
density and the lower is the optimum water content. The
locus of’ optimum points on the curves approximates a
straight line which is roughly parallel to the curves of
constant percent saturation. On the wet side of optimum
water content, the curves obtained for all compactive
efforts merge into a single line indicating that, at a
given water content, there is a maximum degree of saturation
which can be obtained with a given type of compaction
equipment regardless of compaction effort expended.
On the dry side of optimum water content, the curves are
approcimately parallel. It may be concluded from the curves,
therefore, than an increase in compactive effort is more
effective in increasing the density of the soil when its
water content is on the dry side of optimum than when on
the wet side.
Water content

98
The difference in the influence of the increased compactive
effort on the density is due to the fact that the wetter
material is soft and therefore weak in shear, so that the
compaction energy is dissipated in shearing the compacted
material without much additional densification. On the dry
side of optimum moisture content, the material is stiffer
and more of the energy of the compaction equipment goes
into compressing the soil to a denser state /22/.
From the aforegoing discussion it may appear that there is
no necessity of compacting a soil at its optimum water
content i.e. the maximum density can be achieved by just
increasing the compactive effort. However, the properties
of the compacted fill may not conform to requirements of
stability.
Placing of the material at optimum water content instead
of dry of optimum increases the plasticity of the material
and allows it to conform more readily to the shape of the
foundation and abutments during post-construction settle-
ment and helps to reduce the probability of tension cracks
in the embankment. For small confining loads, placing
material dry of optimum is undesirable because it increases
the possibility of:
a) low density for the same compactive effort
b) greater permeability in the embankment core
c) excessive softening and settlement after saturation
by the reservoir, resulting in possible cracking of
the fill.
On the other hand, the water content should not be appre-
ciably greater than optimum. Difficulties have been experL-
enced with unstable fills when very wet soils are used,
even in dams of low height /6/.

99
It is therefore the recommended practice to compact cohesive
soils in small dams close to the optimum water content at
Proctor maximum dry density.
In the laboratory compaction curves can be performed under
controlled conditions and the curves for a given soil
plotted. On the other hand, curves for compaction of embank-
rnents in the field for various types of rollers are more
difficult to obtain because of the difficulties in control-
ling the variables which influence the test results.
5.4.3 Laboratory Compaction
During the construction stage, laboratory compaction tests
are carried out on the proposed construction materials.
These tests are then used as a control standard of the
compaction during construction. On medium to large dams it
may be necessary to set up a field laboratory with the
requisite equipment to monitor the quality of the material
and also the compaction. The laboratory test most commonly
used for earthdarn studies is the standard Proctor test
/22/28/.
After establishing water contents and densities corres-
ponding to the engineering properties desired in the fill,
a compaction specification is prepared. The essence of the
specification is that a certain percentage of relative
density or relative compaction has to be attained for
specific soils. In Tanzania, it is usual practice to limit
t~he compaction to a minimum of 85 % of the Proctor maximum
dry density on small to medium size dams. Table 8 shows
USBR compaction requirements for dams less than 15 m high
/28/.

100
Table 8. Example earthwork compaction requirements
for earthdams.
Compaction Reqtdr.merts Water Co-’tro?
CoheV~’eSols: Optimum 2 percent
0—25 percent ret~nodon No. 4; flC~.95porcent26—50 percent retained on No. 4, flC—92.5 porceritMon. tt~an50 percent retainedon No 4; RC..90 percent
Cohe.,on~essSOIlS Very wetFirps sand
0—25 percent retained on No. 4 D~—75Md,urnsand
0—25 percent retained on No 4 0r~70Coats. sand and gravel
0-100 p.rc.nt rtakied on No 4. Cl, -65
5.4.4 Compaction Control Tests
During the construction of an earthdam continuous control
of compaction is necessary to ensure that the completed
structure will serve its purpose. Tests are carried out
periodically to ensure compliance with specifications. This
may be done after a certain number of cubic metres has
been placed, after a new lift has been placed, or sometimes
after a day or two. The construction can sometimes be
carried out more efficiently by careful interpretation of
these results.
During the construction of Monduli Juu Dam, Arusha Region,
tests were carried out on every layer for the first month
and thereafter only once a day. It had been established
that for the type of soil used, 8 passes of the sheepsfoot
roller in use were enough to give the desired density
within the required limits of water content. This eliminated
the need to stop the work every now and then and may have
influenced the time schedule /19/.

101
Compaction control tests involve in-place density and
water content of the fill. The most common field density
test is the simple sand cone method. In this method a
small hole of standard dimensions is excavated and the
material is weighed. The volume of the hole is then found
by filling it with sand of known density, a balloon full
of’ water or oil.
The weigth of’ the soil to volume ratio is the wet density
or bulk density. The water content of’ the soil removed is
also determined and the dry density is calculated as:
= ‘~“bulk(1 + w)
where bulk = wet or bulk density
w = water content
Id = dry density
For determining the water content, one method uses calcium
carbide. This is mixed with the soil sample in a closed
container and the pressure developed by the gas generated
is measured. The gas pressure (acetylene gas) is directly
related to the quantity of water mixed with the carbide and
hence is a direct measure of the water content.

102
5.4.5 Control of Water Content
When the material in the borrow area is too dry its water
content must be raised. In case the average water content
is only a few percent below the desired value for compac-
tion, the extra water can be applied by sprinkling the
soil after it is spread on the contruction surface before
rolling. The additional water is then blended into the
soil with harrows or ploughs, the degree depending on the
fineness and plasticity of the soil. Proper blending will
eliminate pockets of wet soil and therefore poor compaction
in the fill. The quantity of’ water which can practically be
added is also depended on the fineness and plasticity (or
permeability) of the soil. The coarser and less plastic the
soil, the greater the quantity of water which can be
worked uniformly into it.
Little or no water can be added to clays of medium and
high plasticity unless they contain a large amount of sand
or gravel. If the deficient water in the soil in the borrow
pit is too high (more than 10 %), burrow pit irrigation
is usually practiced /22/.
It is reported that this method is more economical than
adding water on the construction surface. When this is
done, earthfilling can proceed more rapidly because of
reduced activity on the construction surface. Borrow pits
are irrigated by ponding water on the surface with low
dykes or with a pressure sprinkler system. When the material
in the borrow pit is too wet, it should be drained before
filling. It is usually easier to add water to a dry soil
than to reduce the water content of a wet soil.
The fineness and plasticity of the soil greatly influences
the ease with which the water content can be lowered.
Furrows are usually made on the borrow area to act as
drainage channels.

103
Another method is to dry the material by ripping or ploug-
hing and aerating. This is relatively easy for silty and
sandy soils but difficult for clays /22/. During the
construction of Sasuma Dam, which supplies water to the
capital of Kenya, Nairobi, wet clays in the borrow area
were aerated in 10 cm layers with 6 passes of a rotary
cultivator. Figure 34 shows the cross—section of Sasuma
Dam /14/.
5.4.6 Compaction Control for Pervious Sections
In the case of pervious embankment sections consisting of
sand, gravel, or a mixture less laboratory work is usually
carried out to sUpplement the primary visual control than
for impervious sections /22/. Good compaction can generally
be obtained without the close water content control
necessary for imperVious soils. In addition to this, the
strength of’ compacted sands and gravel does not var~fr
greatly with small changes in the density.
WL ~I642~
-Roes ~
II, 0I__I I I I I I I I I
Rocktlfl
c~naet,eu~tt-
Figure 34. Cross-section of Sasuma Dam, Kenya.

104
5.4.7 Control of Embankment Permeability
The control of permeability in the pervious zone is as
important as the control of density. The problem of the
permeability of upstream embankment zones which are designed
to be free draining frequently arises during construction,
because the sand or gravel borrow materials intended for
these zones often are found to be dirtier and less pervious
than anticipated. The stability of the upstream slope then
comes into question and changes in design may be necessary.
The common practice of control is by visual inspection of
the fine content and the ability of the construction surface
to absorb the sluicing water added during compaction. At
darns where permeability is critical, laboratory gradation
tests are performed as a guide to visual control. In
addition it is necessary to carry out frequent permeability
test in the field laboratory.
In critical cases, large scale permeability tests have
been performed by ponding water in holes or between bunds
on the construction surface of the pervious section,
measuring the rate of downward seepage, and computing the
coefficient of permeability from flow nets /22/.
5.5 Slope Protection
It is general practice to protect the upstream slope against
wave erosion. Commonly one—man stones are used in the case
of manually placed rip-rap or a certain minimum thickness
is specified in the case of dumped rip—rap /22/.
The downstream slope must be protected from erosion due to
rain and wind. Except for very low dams, erosion has not
endangered the stability of’ the structure but has only
required maintenance, which can be difficult and expensive.
105
Grass planting is the most commonly practiced method of
protecting the downstream slope. Only in very dry areas
where there is not enough water to keep the grass cover
alive, it is necessary to use other types of protection.
In that case layers of rock rip-rap and coarse gravel also
provide good slope protection.
The Mindu Dam which will supply water to Morogoro town is
being protected on the downstream by crushed gneiss which
is a byproduct in the site quarry, and therefore cheaper
than vegetable soil.
Horizontal berms have been used on the downstream slope of
many dams to control the runoff water and erosion /22/.
The contact between the downstream slope and the abutments
is almost always an area of concentrated surface runoff.
The strip of embankment slope directly adjacent to the
abutment is normally protected by the construction of a
toe drain or placing rip-rap.
5.6 Maintenance of Dams
The maintenance of earthdams through regular inspection and
repair is as important as the construction itself. In
Tanzania, all the medium to large dams which are generally
used for hydropower production are frequently and expertly
inspected and often are equipped with monitoring devices.
On the other hand, small dams which are many, get very
little attention. The increased hazard potential due to
downstream development and increased risk due to possible
deterioration or inadequate spillway should arouse public
concern as regard safety. All water works structures
require constant inspection and maintenance but since dams
are situated almost always in remote areas, this is rarely
done. Even when this is done, there are no funds for repair
work, nor is there equipment. An equal challenge is posed

106
by the problem of effectively comminicating with the non-
technical people who provide funds for the inspection or
repair programmes, i.e., for demonstrating to them the
benefits of such programmes.
All the dams inspected under Water Master Plan in Tabora
region were found to require some maintenance /23/. This
situation epitomises the current state of our dams, some
of which are rather old.
However, with all the good intentions of’ regular inspections,
there are limitations. Since the purpose of an inspection
is to assist in preventing dam failures, it is interesting
to ask whether it is possible that a dam could be properly
inspected one day and found to have no visible discre-
pancies and then undergo a catastrophic failure a short
time thereafter.
The answer to this question is affirmative. This is due to
the fact that, unfortunately, there are some mechanisms
of dam failures whichdevelop suddenly~ with very little -
- -- advai~e visible w~arning. Oneof’ thése ~iOOTdbetO~ping
as the result of heavy rainfall or inflow into the reser—
voir, combined with sri inadequately designed spillway. In
limestone terrain the development of a large sinkhole could
cause a sudden and complete breach of the embankment with
little advance warning. Liquifaction or sudden loss of
strength can occur in saturated fine sands subjected to
vibration or shock, as would result during an earthquake.
In short, a safety inspection should be considered an
essential part of the safe operation of a dam, but by
itself, is not an absolute preventive of dam failure /21/.

107
5.6.1 ChecklIst of Conditions to be Noted on Safety
Inspection of Small Earthdams /21/
1. Vegetation on dike and within 15 m beyond toe of’ dike
a) Overgrowth
- requiring cutting for dike surveillance
- requiring weed control for dike surveillance
— indicating seepage or excessive capillarity
b) Wet terrain vegetation
— watch for boils
— watch for sand cones, deltas etc.
— changes with the season, pond level change
c) Incomplete: requiring repair
— poor growth
- destroyed by erosion
2. Drainage ditches
a) Clogged with vegetation
b) Damp
c) Flowing water: quantity
d) Boils
e) Silt accumulation, deltas, cones
3. Embankment
a) Freeboard — pond level
b) Crest:
- cracking
— subsidence
c) Upstream face
— cracking
— surface erosion, gullying
— wave erosion

108
d) Downstream face
— cracking
— subsidence
- bulding
— erosion, gullies: depth
moisture on dry days
— damp areas
— boils, seeps
e) Berm and within 15 m beyond toe of dike
— erosion, gullies
— damp areas
— boils, seeps
4. Spiliways
a) Intake level, boards
b) Intake structure
c) Discharge conduit condition
d) Seepage or damp areas around conduit
e) Erosion below conduit
f) Boils in vicinity of conduit
g) Spillway slab for uplift, subsidence, cracking
5. Areas of previous repair
a) Effectiveness of repair
b) Progression of trouble into new area.

109
6. CONCLUSIONAND RECOMMENDATIONS
In the semi—arid regions with large concentrations of
people and livestock, earthdam construction is a conti-
nuous process. The failure of these structures in Tanzania
is attributed to insufficient investigations, poor cons-
truction and lack of maintenance. The investigation report
on the failure of’ Monduli. Juu Darn remarks: “The particular
properties of volcanic soils in general and the experienced
failure in particular require a careful and proper design
of the reconstruction of’ the dam.” This implies that the
properties of some of the soils in the country are not
properly understood.
The hydrometeorological network has been greatly increased
by the Water Master Plans, but these will take sometime
before the data can be used. In the meantime, however,
existing hydrological methods must be used and these would
require proper judgement. In view of the f’oregoin, the
following is recommended:
1. The hydrological network should be expanded as much as
is possible. The readers should get appropriate trai-
ning, and if possible, regular refresher training so
that the data is reliable. Whatever the size of the
project, hydrological problems must be referred to
qualified and experienced hydrologists for guidance.
2. Studies be conducted to evaluate the properties of
various soils in the country. This would enable a
proper understanding of the various soils and their
use in engineering works.
3. All darns should be provided with upstreams and down-
stream protection of some type, irrespective of the
size. Provision of toe drains should also be considered
as necessary.

110
4. Proper records of dams should be kept so that infor-
mation can be easily obtained about the size, amount
of fill and costs. Also the type of material used as
well as structures and soils revealed during construc-
tion would be needed incase of failure of the struc-
ture.
5. Regular inspection and maintenance should be carried
out for the safety of the structure, public and property.
6. For the reservoir to be of service for a longer time
it is essential to experiment and adopt soil conser-
vation practice to reduce soil erosion.
7. All earthmoving teams should be provided with compac-
tion equipment as well as testing equipment. The
present practice is that only the national earthmoving
teams have these facilities.
8. Proper specifications should be provided for construc-
tion to be used by both contractors and direct labour
projects. Proper guidelines should be formulated to
replace old “Head Office Notes” which are out of date
and not easily obtainable.
9. As the construction of dams involves various subsections
in the ministry e.g. hydrometeorological, design,
construction, soils laboratory, proper coordination
should be formulated so that all of’ them are involved
in all phases of construction.
—
ill
REFERENCES
1. Abdel, Ghaf’far, A.M., and Scott, R.F.Analysis of Earth Darn Response to Earthquake,Journal of the Geotechnical Engineering DivisionASCE, Vol. 105, No. GT12, Proc. Paper 15003Dec. 1979
2. Applied Geology for EngineersMilitary Engineering Vol. XVHMSO (1976)
3. Bo Wingard and Ulf RuseAn Approach to the Problem of SynthesizingHydrographs From Rainfall Data,Case Study: Kilombero River, TanzaniaBRALUP Research Report No. 26University of Dar es Salaani, 1971
4. Cedergren, H.R.,Seepage, Drainage and FlownetsJohn Wiley & Sons Inc., 1967
5. Dams and Public SafetyU.S. Department of the Interior Water PowerResources Services, United States GovernmentPrinting Office, Denver 1980
6. Design of Small DamsU.S. Department of the InteriorBureau of Reclamation, U.S. GovernmentPrinting Office, Washington 1960
7. Dodoma Region Water Master PlanMaster Plan Team, Ministry of Water Developmentand Power, Final Report, Vol. 2Dar es Salaam 1974
8. Estimation of Maximum FloodsWMOTechnical Note No. 98Secretariat of the World Meteorological OrganizationGeneva, Switzerland

112
9. Fiddes, F. et al.The Prediction ot* Storm Rainfall in East AfricaTransport and Road Research Laboratory Report 623Crowthorne, Berks, England 1974
10. Hjeldnes, E.I. and Lavanian, B.V.K.,Cracking, Leakage and Erosion of’ Earth DamMaterialsJournal of the Geotechnical Engineering DivisionASCE, Vol. 106, No. GT2, Proc. paper 15220 (1980)
11. Hydrology Guide for Use in Watershed PlanningNational Engineering Handbook, See. 4, Hydrology,Supplement A., US Department of Agriculture,Soil Conservation Service 1956
12. H.P. Gauff, K.G. Consulting EngineersTanga Water SupplySigi River SchemeSite Investigations, Sept. 1974
13. International Commission on Large DamsTenth International Congress on Large DamsMontreal, Canada, 1-5 June 1970
14. Karl TerzaghiThe Design and Performance of the Sasuma DarnNo. 6252, Proc. Institution of Engineers,London, April 1960
15. Kilimi Dam. TaboraReport on Soil InvestigationsSoils Mechanics Laboratory,Ministry of Water Development and PowerDar es Salaam, May 1975
16. Kobalyenda, J.M.M.An Approach to the Problems of’ SimulatingStreamflows from Precipitation Data and OtherHydrological Parameters, Case Study: Little RuahaRiver, TanzaniaHydrological Division, Uppsala University,Sweden 1971

113
17. Lucas, R.O.Laterite Soils and Black Cotton SoilsTampere University of’ TechnologyTampere, Finland 1983(unpublished)
18. Morogoro Water SupplyThe Mindu DamSir Alexander Gibb & Partners, ConsultingEngineers,Reading & London, April 1980
19. Mtunzi, M.B.E. and Mowo, F.S.A.,Moduli Juu DamFinal Construction ReportMinistry of Water and EnergyDar es Salaam, March 1980(unpublished)
20. Ponce, V.M. and Tsivoglou, A.J.,Modelling Gradual Darn BreachesJournal of the Hydraulic Division, ASCEVol. 17, No. HY7, Proc. paper 16372July 1981
21. Safety of Small DamsProc. Engineering Foundation ConferenceASCE, August 4—9 1974
22. Sherrard et al.Earth and Earth-Rock DamsJohn Wiley and Sons Inc.New York 1963
23. Tabora Region Water Master PlanFinal report Vol. 3B1, Reservoir Survey,Brokonsult Ab, TABY, Sweden
24. University of Dar es Salaam, Dept of CivilEngineeringReport of’ Moduli Juu Dam, Laboratory InvestigationsProject No. 77.4, Soil Mechanics Laboratory,Dar es Salaam 17.11.1977

114
25. Vattenbyggnadsbyr~n (VEB)Tanzania Water Supply - Dams,Itamuka and Wiyenzele Darns, VBB,Member of SWECO, Stockholm, Sweden
26. Varshney, R.S.,Engineering HydrologyNemchand & Eros, Roorkee, India1977
27. Wahlstrdm, E.E.,Developments in Geotechnical Engineering 6,Dams, Dam Foundations and Reservoir Sites,Elsevier Scientific Publishing Company1974
28. W.L. ShroederSoils in ConstructionJohn Wiley and Sons Inc1975

I
Monduli Juu Dam.
25.5.1977
Downstream face after breach.
‘~0PtN
x

Upstream face from North End.I-ti
ttl
H
III 4
( -- ~.- .,i c1\
Monduli Juu Dam.
25 .5 .1977

1
Monduli Juu Dam. Profile through breach south face.
25.5.1977
/
tTl
zI—I

Monduli Juu Dam. Profile through breached North Face
Black cotton soil foundation right.
25 . 5 . 1 977
•ui i~i ii
I-ti
H