eag competitiveness summary report - ulster university · pdf file ·...
TRANSCRIPT

COMPETITIVENESS SUMMARY JULY 2016
Contents
Chair’s Foreword ............................................................................................................................................. i
Introduction ................................................................................................................................................... 1
Methodology.................................................................................................................................................. 6
1. Macro & Fiscal Sustainability ............................................................................................................ 8
2. Quality of Life .................................................................................................................................... 10
3. Environmental Sustainability........................................................................................................... 12
4. Business Performance .................................................................................................................... 14
5. Productivity ....................................................................................................................................... 16
6. Prices & Costs .................................................................................................................................. 18
7. Labour Supply & Employment ......................................................................................................... 20
8. Business Environment ..................................................................................................................... 22
9. Physical Infrastructure ..................................................................................................................... 24
10. Education and Skills ........................................................................................................................ 26
11. Innovation and R&D ......................................................................................................................... 28
Summary & Next Steps .............................................................................................................................. 30
Annex – NCC Competitiveness Methodology ............................................................................................ 32
Tables Table 1: Average of Independent Economic Forecasts ....................................................................... 4
Figures Figure 1: Labour Market Performance ................................................................................................... 3
Figure 2: UK and NI Quarterly Output Growth ........................................................................................ 4
Figure 3: UUEPC Competiveness Scorecard .......................................................................................... 6
Figure 4: The NCC Competitiveness Pyramid ...................................................................................... 32
i
Chair’s Foreword The Economic Advisory Group (EAG) publishes the first Northern Ireland (NI) Competitiveness Report at an important point in the region’s economic development. The Fresh Start Agreement has been launched, the delivery of a new Programme for Government and refocused Economic Strategy is imminent, and the countdown to the lowering of Corporation Tax has begun. Another countdown has also commenced and in due course NI will be competing across the world from an, as yet, undefined position outside of the European Union. A strategic review of NI’s competitive strengths and weaknesses has never been more relevant and timely.
Hitherto there has been no comprehensive assessment for NI across such a wide range of competitiveness indicators. Unsurprisingly, in the absence of real data, more often than not “King Anecdote ruled”. Now, through the development of the Competitiveness Scorecard, NI’s position has been benchmarked, relative to a range of European and OECD countries over the most recent five-year period across more than 150 indicators. This gives us a picture of how NI is doing over time relative to the economies with which it competes internationally.
In addition, where appropriate and relevant data are available, NI’s position relative to the other 11 UK regions is benchmarked. Adapting the methodology used in the Republic of Ireland (RoI) by the National Competitiveness Council and reflecting the input of a wide range of stakeholders, this Scorecard enables us to examine the scale of the competitiveness challenge for NI within an internationally recognised framework.
It is perhaps the first time that we have had such an holistic view of NI both as a society and an economy, and it is a powerful and compelling analysis.
The international evidence shows that more competitive economies enjoy higher levels of growth and it is only by focusing on the issues highlighted throughout this report that NI can begin to enjoy a more positive economic outlook in the future. What is clear is that action must be taken now in order to boost relative competitiveness in order for the NI economy to grow, delivering higher standards of living for the whole NI population.
The scale of the competitiveness challenge for NI should not be underestimated. In particular, compared to our reference countries in the OECD, levels of economic inactivity remain persistently high, as do levels of benefit dependency. This links directly to our much greater reliance on the public sector and public expenditure more generally, where new challenges arise as part of UK austerity policies. NI may not have to “balance the books” due to the subvention from Westminster, but tough decisions will be needed to manage a much tighter public expenditure environment.
There are positives for NI in the Scorecard. We have seen business performance improve in recent years, driven by a strong FDI proposition, with environmental sustainability and quality of life also moving in the right direction. But this is not enough. NI’s overall competitiveness ranking in many key areas is simply too low, reflecting its weak performance on productivity, employment & labour supply and macro & fiscal sustainability. Whilst our performance has improved somewhat over the five year period, other regions have improved more quickly, so that our comparative position has worsened.
If NI is to deliver upon the economic aspirations in the Programme for Government and the Economic Strategy, it must play to its relative strengths and improve performance in a number of areas. This requires confident, challenged policy development in those areas over which we can bring influence to bear.
NI now needs to start focussing once again on longer term issues around competitiveness, rather than maintain the shorter term focus on jobs which has been evident (and indeed necessary) in

ii
recent years as it emerged from the downturn. The Competitiveness Scorecard offers a way for government departments to look at the issues together, to see how they are interrelated and affect each other. Indeed it provides a valuable framework to support joined-up thinking in policy making.
In developing the Competitiveness Scorecard and in preparing this summary report, EAG has placed the issue of competitiveness at the centre of the Group’s research agenda. EAG recognises that the Scorecard will develop over the years and envisages that it should be updated every two years. I believe that the Competitiveness Scorecard presents a unique opportunity for us to approach NI’s economic issues in a clear sighted and pragmatic way and to more accurately measure the effects of future policies.
Undoubtedly, the Scorecard represents a significant first step in terms of the development of Competitiveness concepts and metrics for NI, but it is just that – a first step. We will review and develop the metrics further in line with best practice in the years ahead.
I look forward to continued engagement between the Minister for the Economy, the officials in the Department for the Economy (DfE) and the EAG and to providing ongoing challenge and support as we strive together to grow a more successful economy.
Ellvena Graham Economic Advisory Group Chair
July 2016

iii
NI performance at a glance
Innovation and R&D
Education and skills
Physical infrastructure
Business environment
Labour supply & employment
Prices and costs
Productivity
Business performance
Environmental sustainability
Quality of life
Macro and fiscal sustainability
The number shown is NI’s current decile position – the lower the number, the more competitive we are. Green shows NI’s relative improvement over the last five years - red indicates where we have become less competitive over the last five years.
POOR GOOD
5.3
7.2
6.5
5.8
8.0
6.3
7.3
4.8
5.9
5.9
6.4

1
Introduction Background The Economic Advisory Group (EAG) was established in 2010 to provide independent economic advice on the Northern Ireland (NI) economy to the Minister of the, then, Department of Enterprise, Trade and Investment (DETI). It is chaired by Ellvena Graham, former Head of Ulster Bank in NI and Managing Director of SME Banking across the Island of Ireland, and has a further ten members drawn from business and academia1.
Economic competitiveness is defined by the World Economic Forum (WEF) as ‘the set of institutions, policies and factors that determine the level of productivity of a country’, while the Institute of Management Development (IMD) Competitiveness Yearbook follows a similar approach in its endeavours to measure ‘how well countries manage all their resources and competencies to facilitate long-term value creation”. For the Republic of Ireland (RoI) National Competitiveness Council, the goal of competitiveness is to provide a country’s people ‘with the opportunity to improve their living standards and quality of life’.
Whatever the precise definition, in an increasingly globalised world, it is apparent that competitiveness is important for the growth trajectory of an economy and the wealth of its citizens. Countries, like companies, compete – whether that be competing for new investment, the sales of goods and services, tourism, skilled individuals, or technological and scientific break-through.
National competitiveness is potentially most important for small open economies which, without the benefit of large home markets, rely on trading internationally and attracting foreign direct investment, to help provide the scale necessary for productivity increases in order to drive increases in living standards. However, improvements in a country’s competitiveness will typically not emerge overnight and, for example, our current competitive position on such things as educational outcomes, skills and infrastructure have been shaped many years ago.
We recognise that the NI Economic Strategy has competitiveness at its core. The overarching goal of the Strategy is to improve the economic competitiveness of the NI economy and this scorecard allows the effective benchmarking of the local economy against our competitors and the highlighting of progress over time as the Executive’s strategy is put into action. To that end, in conjunction with the new Department for the Economy (DfE), the metrics on which the Scorecard is based will be developed further in the years ahead, to reflect best practice and further development of competitiveness concepts.
Wider Context for Examining Competitiveness As noted earlier, competitiveness is vitally important for small open economies, and it is crucial that our economic strengths and weaknesses are periodically assessed in a systematic fashion. The members of EAG have expressed the view that the issue of competitiveness should be the central focus of the Group’s work going forward and that further analysis and reporting should be undertaken to provide greater transparency around the competitiveness of the various factors that contribute to the NI Economy.
In addition NI is, arguably, at a particularly important juncture at the moment. Having just seen the launch of the Fresh Start Agreement, NI is about to take forward a new Programme for Government
1 See http://eagni.com/members/ for more information
2
and a refreshed Economic Strategy, while the countdown to the lowering of Corporation Tax has begun. This seems an entirely apt time to examine, at a strategic level, NI’s competitive strengths and weaknesses and so EAG have embarked on work to provide a framework for this to happen.
Previous Competitiveness Work In March 2012 the Economic Advisory Group commissioned Cambridge Econometrics, in collaboration with SQW Ltd, to develop a Competitiveness Index adopting the methodology used by the WEF in the Global Competitiveness Index (GCI) which looked across 113 variables, using a combination of both statistical data and a significant survey element. It facilitated the placement of NI in a global context compared with a wide number of competitor economies. In summary, the results of the development work which published in June 2013 ranked NI 42nd of the 145 countries ranked using the WEF index, scoring 4.42 out of 10. Ireland was ranked 27th and the UK 8th. Switzerland was ranked first, followed by Singapore, Finland and Sweden in that order.
The UUEPC Competitiveness Scorecard Whilst the WEF GCI offered the prospect of a comparison of economic competitiveness against a vast array of countries, there were compromises inherent in endeavouring to fully integrate NI in the WEF methodology and this encouraged EAG to look at alternative approaches which offer much more scope for tailoring to the needs and circumstances in NI.
As a result the Ulster University Economic Policy Centre (UUEPC) was commissioned by the EAG and DETI in 2014 to ‘investigate and deliver a range of economic competitiveness indicators relating to the NI Economy’. In tune with the aim of moving towards an approach which offers more scope for tailoring to the needs and circumstances in NI, the Terms of Reference envisaged that the work would take a similar approach to the RoI’s National Competitiveness Council, taking its Competitiveness Scorecard as a starting point from which NI’s economic competitiveness in an international context could be assessed. This approach aims to ensure that the Scorecard can identify strengths, weaknesses and changes in direction of travel across many policy areas, with the intention of signposting researchers and policymakers towards areas that require further investigation and attention.
3
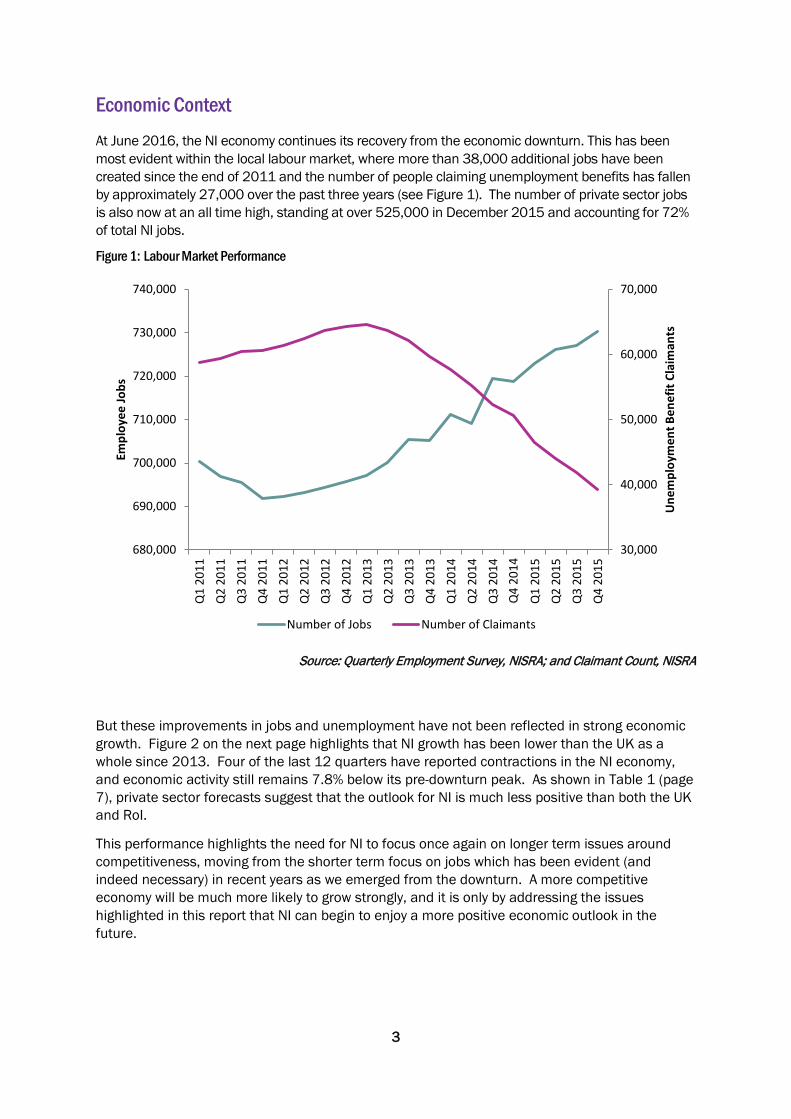
Economic Context At June 2016, the NI economy continues its recovery from the economic downturn. This has been most evident within the local labour market, where more than 38,000 additional jobs have been created since the end of 2011 and the number of people claiming unemployment benefits has fallen by approximately 27,000 over the past three years (see Figure 1). The number of private sector jobs is also now at an all time high, standing at over 525,000 in December 2015 and accounting for 72% of total NI jobs.
Figure 1: Labour Market Performance
Source: Quarterly Employment Survey, NISRA; and Claimant Count, NISRA
But these improvements in jobs and unemployment have not been reflected in strong economic growth. Figure 2 on the next page highlights that NI growth has been lower than the UK as a whole since 2013. Four of the last 12 quarters have reported contractions in the NI economy, and economic activity still remains 7.8% below its pre-downturn peak. As shown in Table 1 (page 7), private sector forecasts suggest that the outlook for NI is much less positive than both the UK and RoI.
This performance highlights the need for NI to focus once again on longer term issues around competitiveness, moving from the shorter term focus on jobs which has been evident (and indeed necessary) in recent years as we emerged from the downturn. A more competitive economy will be much more likely to grow strongly, and it is only by addressing the issues highlighted in this report that NI can begin to enjoy a more positive economic outlook in the future.
30,000
40,000
50,000
60,000
70,000
680,000
690,000
700,000
710,000
720,000
730,000
740,000
Q1
2011
Q2
2011
Q3
2011
Q4
2011
Q1
2012
Q2
2012
Q3
2012
Q4
2012
Q1
2013
Q2
2013
Q3
2013
Q4
2013
Q1
2014
Q2
2014
Q3
2014
Q4
2015
Q1
2015
Q2
2015
Q3
2015
Q4
2015
Une
mpl
oym
ent B
enef
it Cl
aim
ants
Empl
oyee
Jobs
Number of Jobs Number of Claimants
Q4
2014

4
Figure 2: UK and NI Quarterly output growth
Source: NI Composite Economic Index, NISRA - Gross Domestic Product, ONS
Table 1: Average of Independent Economic Forecasts
2016 2017 2018
NI 1.5% 1.6% 1.7%
United Kingdom 2.2% 2.3% 2.1%
Republic of Ireland 4.7% 4.3% 3.3%
Source: Economic Eye Winter 2015 (Ernst and Young); Quarterly Sectoral Forecast Q1 2016 (Danske Bank); NI Economic Outlook (PwC); Forecasts Subscription (Oxford Economics)
-0.8%
-0.6%
-0.4%
-0.2%
0.0%
0.2%
0.4%
0.6%
0.8%
1.0%
1.2%
1.4%
Q1 2013
Q2 2013
Q3 2013
Q4 2013
Q1 2014
Q2 2014
Q3 2014
Q4 2014
Q1 2015
Q2 2015
Q3 2015
Q4 2015
Qua
rter
ly G
row
th R
ate
NI CEI
UK GDP

5
Purpose of this Report The overall aim of this short report is to provide an update on the current work being undertaken under the auspices of the EAG around economic competitiveness. The EAG will use the Scorecard to inform its future work programme. Meanwhile the provisional outputs of the UUEPC Competitiveness Scorecard have been shared within government at a time when priorities for a new Programme for Government are being considered.
At the core of the report is a summary of the work carried out by UUEPC in developing a Competitiveness Scorecard for NI. The report also provides links to the detailed work carried out under each of 11 Pillars, as identified at page ii. The report then goes on to set out EAG’s views as to the key messages emerging from the Scorecard, along with an indication of the likely next steps.
This report is structured as follows:
• A short overview of the Methodology, which has its origins in the RoI’s NationalCompetitiveness Council’s (NCC) Scorecard.
• Scorecard results in summary form for each of 11 Pillars, grouped under three headings:Sustainable Growth, Essential Conditions and Policy Inputs.
• A summary of the key messages around competitiveness that emerge from the analysiscontained within the Scorecard and next steps.
6
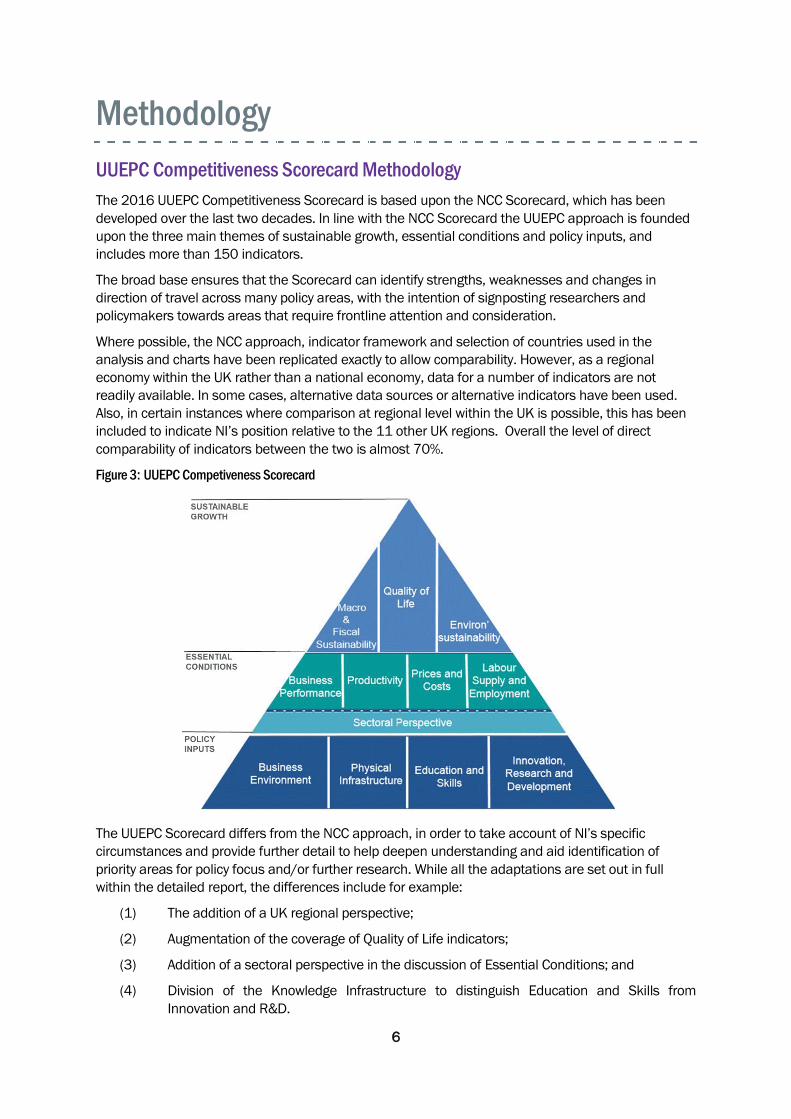
Methodology UUEPC Competitiveness Scorecard Methodology The 2016 UUEPC Competitiveness Scorecard is based upon the NCC Scorecard, which has been developed over the last two decades. In line with the NCC Scorecard the UUEPC approach is founded upon the three main themes of sustainable growth, essential conditions and policy inputs, and includes more than 150 indicators.
The broad base ensures that the Scorecard can identify strengths, weaknesses and changes in direction of travel across many policy areas, with the intention of signposting researchers and policymakers towards areas that require frontline attention and consideration.
Where possible, the NCC approach, indicator framework and selection of countries used in the analysis and charts have been replicated exactly to allow comparability. However, as a regional economy within the UK rather than a national economy, data for a number of indicators are not readily available. In some cases, alternative data sources or alternative indicators have been used. Also, in certain instances where comparison at regional level within the UK is possible, this has been included to indicate NI’s position relative to the 11 other UK regions. Overall the level of direct comparability of indicators between the two is almost 70%.
Figure 3: UUEPC Competiveness Scorecard
The UUEPC Scorecard differs from the NCC approach, in order to take account of NI’s specific circumstances and provide further detail to help deepen understanding and aid identification of priority areas for policy focus and/or further research. While all the adaptations are set out in full within the detailed report, the differences include for example:
(1) The addition of a UK regional perspective;
(2) Augmentation of the coverage of Quality of Life indicators;
(3) Addition of a sectoral perspective in the discussion of Essential Conditions; and
(4) Division of the Knowledge Infrastructure to distinguish Education and Skills from Innovation and R&D.

7
A key strength of this approach, compared to the previous WEF based work, in particular is the ability to tailor the analysis to NI needs and circumstances. This allows us to present a competitiveness assessment that takes into account the most relevant and important issues for NI, rather than being constrained by what is most relevant for other countries and regions.
This is the first NI Competitiveness Report, and with a number of specific adaptations and developments already put in place within the Scorecard, the broad aim has been to largely maintain the fundamentals inherent within the NCC Framework. However, it is likely that future iterations of the Scorecard will lead to additional tailoring of the approach to our specific needs and circumstances, and developments in metrics to measure competitiveness.
Dashboard Assessment Competitiveness is a broad concept and, as indicated in our framework, spans a wide range of areas. In developing the Scorecard, a decision was needed at the outset whether to try and maintain the same basket of comparators for each indicator – thus significantly compromising the range of metrics NI could be assessed on – or to try to provide as comprehensive an assessment as possible based on the comparators available for each data source.
The Scorecard has therefore been developed to be comprehensive, with a total of more than 150 indicators included. Data has been collected from a range of sources, including NISRA, ONS, Eurostat and the OECD, which are fully outlined in the detailed report. NI’s relative position against other UK regions, other EU member states or OECD members has then been established, depending on what the data allow for. In addition to availability, the relevance of data is also an important factor. In some areas our most relevant comparators may well be the UK regions and/or the RoI, whereas in others it may be necessary to look much wider. The basket of benchmarks we are considering are the most relevant to NI.
In the remainder of this report, a summary of selected key metrics under each theme are presented, with NI’s ranking against the total number of comparators shown for each. Where NI is compared in UK context, relative to the other 11 UK regions, the score will be 1-12. Where comparisons are made more broadly against other EU members this will generally rank NI in the range of 1-29, whilst OECD comparators will mean that the ranking is 1-35. Full information on the specific indicators and sources used for each measure can be found in the detailed report.
An overall dashboard assessment has been provided for each theme to provide a consistent and comparative approach throughout. This assessment presents an overall decile score based on NI’s average ranking across all indicators within the theme. NI is scored from 1 to 10, where 1 represents the best performance comparators and 10 represents the worst. A score of 5.0, for example, therefore means that 50% of benchmarks are above NI and 50% are below.

8
1. Macro & Fiscal Sustainability2014 performance compared to 2009 performance
Key Indicator Summary
Gross Domestic Product per capita
Average annual growth rate in Gross Domestic Product per capita
Private sector GDP as a proportion of total GDP
Government fiscal deficit/surplus
Central government corporate tax rate
1 2 3 4 5 6 7 8 9 10 11 12 13 14 15 16 17 18 19 20 21 22 23 24 25 26 27 28 29 30 31 32 33 34 35 36
1 2 3 4 5 6 7 8 9 10 11 12 13 14 15 16 17 18 19 20 21 22 23 24 25 26 27 28 29 30 31 32 33
1 2 3 4 5 6 7 8 9 10 11 12 13 14 15 16 17 18 19 20 21 22 23 24 25 26 27 28 29 30 31
1 2 3 4 5 6 7 8 9 10 11 12 13 14 15 16 17 18 19 20 21 22 23 24 25 26 27 28 29
1 2 3 4 5 6 7 8 9 10 11 12 13 14 15 16 17 18 19 20 21 22 23 24 25 26 27 28 29 30 31 32 33 34 35
GOOD POOR
Five Years ago: 7.6
Current: 7.2
10th 9th 8th 1st 2nd 3rd 4th 5th 6th 7th
Overall, performance has risen by 0.4 decile points
POOR 19 GOOD
22 GOOD
GOOD
GOOD
POOR
GOOD
POOR
31
POOR
POOR 9
29
For more detailed information, see the Macro & Fiscal Sustainability Scorecard

9
Dashboard Assessment NI’s current position in this element of the scorecard is determined to a large extent by its historical competitiveness performance and also the relative performance of the UK economy in an international context. Over the past five years NI’s relative position has improved, albeit from a low base (from 7.6 to 7.2). This demonstrates that, from a macroeconomic and fiscal perspective, it is beneficial for the NI economy to be part of a larger economic regime, which cushions NI from many of the challenges that would be faced by a smaller economy. For example, NI benefits from a relatively competitive credit rating, taxation system and the funding regime under the Barnett formula.
The gap between government revenue and expenditure is stark. Whilst NI might not need to “balance the books” due to the fiscal subvention from Westminster, the kind of deficits being seen in NI are far away from what a truly competitive economy should look like. This is closely linked to the fact that NI’s private sector is relatively small and its rate of growth remains subdued. The public sector is ultimately redistributing wealth rather than creating it, and a larger private sector would bring with it both increased tax receipts and less need for government spending.
As a result, both NI’s Programme for Government and Economic Strategy aim to grow and rebalance the economy towards a larger and more vibrant private sector. The current UK Corporation Tax rate is relatively low at 20% (and set to fall to 17% by 2020) and the Fresh Start Agreement announced plans to devolve the power to set the rate to the NI Executive. Under current plans, implementing a 12.5% rate in NI will significantly improve competitiveness for this particular indicator.
Comparative Assessment Switzerland, Netherlands, RoI, Sweden, Denmark and Germany generally perform well on this pillar, with high levels of GDP per capita alongside other strong economic fundamentals. In particular, Switzerland has the highest level of GDP per capita amongst the comparators reviewed, a strong national credit rating, and low taxation (across VAT, corporate tax and property tax). The RoI also has high GDP per capita, which has been growing strongly since 2013, the second largest private sector of all comparators and a low corporate tax rate. There is, however, a large discrepancy in the RoI between GDP (all output produced by the economy) and GNP (the income remaining with RoI residents) due to the influence of foreign-owned firms.
Outside of these highly developed economies, Hungary and Poland also perform well. Hungary has demonstrated strong growth in GDP per capita, low levels of government borrowing and competitive tax rates. Poland has the largest private sector of all comparators and a competitive corporate tax rate.
The UK generally has a mid-table ranking on this pillar. Whilst it benefits from a large private sector and strong credit rating, it also has high levels of government borrowing, relatively low GDP per capita growth and high property taxes.
10
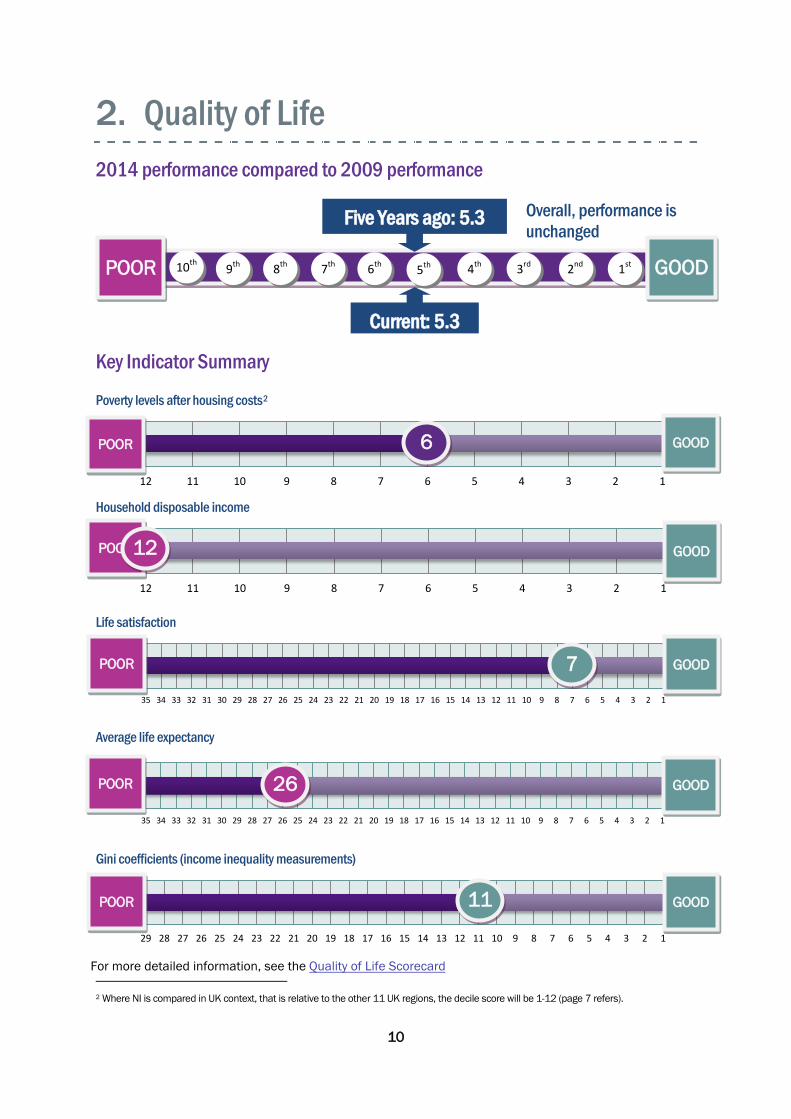
2. Quality of Life2014 performance compared to 2009 performance
Key Indicator Summary
Poverty levels after housing costs2
Household disposable income
Life satisfaction
Average life expectancy
Gini coefficients (income inequality measurements)
2 Where NI is compared in UK context, that is relative to the other 11 UK regions, the decile score will be 1-12 (page 7 refers).
1 2 3 4 5 6 7 8 9 10 11 12
1 2 3 4 5 6 7 8 9 10 11 12
1 2 3 4 5 6 7 8 9 10 11 12 13 14 15 16 17 18 19 20 21 22 23 24 25 26 27 28 29 30 31 32 33 34 35
1 2 3 4 5 6 7 8 9 10 11 12 13 14 15 16 17 18 19 20 21 22 23 24 25 26 27 28 29 30 31 32 33 34 35
1 2 3 4 5 6 7 8 9 10 11 12 13 14 15 16 17 18 19 20 21 22 23 24 25 26 27 28 29
GOOD POOR
Current: 5.3
10th 9th 8th 1st 2nd 3rd 4th 5th 6th 7th
Overall, performance is unchanged
Five Years ago: 5.3
POOR 6 GOOD
26
GOOD
GOOD
GOOD
POOR
GOOD
POOR
7
POOR
POOR 11
12
For more detailed information, see the Quality of Life Scorecard

11
Dashboard Assessment Businesses, investors and skilled labour typically consider the “soft” factors of a location before deciding to locate there. Areas where standards of living are high are generally more attractive to investors. Quality of life is one of the best performing pillars in the Competitiveness Scorecard for NI, with a respectable mid-table performance (5.3). NI has maintained its position in the majority of indicators contained within this pillar of the Scorecard over the past five years. Household incomes have increased, homicide rates have reduced, levels of anxiety have declined, people are generally happy, with a high level of self-worth and overall life satisfaction. These findings may be surprising to some, given relatively high levels of poverty, illness and NI’s past.
Poverty levels remain high, while lower housing costs in NI help to alleviate the impact relative to other regions of the UK. Disposable incomes remain the lowest of the UK regions. Whilst the homicide rate has reduced markedly, it remains relatively high in an international context. Life expectancy has increased, but continues to lag the UK and RoI. Civic engagement suffered from a large reduction over the five-year period with voter turnout reducing by 15%; NI is ahead of only Slovenia, Mexico, Switzerland and Poland out of the 35 countries included in this measure.
The quality of life element of the Scorecard demonstrates clearly that the wellbeing of a nation or region cannot be measured by national income alone. Despite low incomes, relative poverty and lower life expectancies, people in NI report that they are the most satisfied and happiest in the UK and therefore, it is clear that factors other than income play a large part in determining how happy or well people are.
Comparative Assessment Switzerland performs well across a number of indicators here, with the highest life satisfaction and household disposable income of all comparators, long life expectancy and low homicide and mortality rates. Germany shares some similar strengths, with high disposable incomes, low homicide rates and many rooms per person in households. Denmark, Sweden and Finland also tend to have a high quality of living, with high life satisfaction ratings alongside low levels of income inequality and high voter turnout.
The UK and RoI also tend to be mid-performing across these quality of life measures. Whilst household disposable income is relatively high, life satisfaction is average, homicide rates are relatively high, average life expectancy lags behind others and higher levels of income inequality are evident.
Within the UK, although London has the highest disposable household income it also reports the highest proportion of population living in poverty (due to high housing costs). Conversely the Greater South East, which also has high incomes, also has the lowest levels of poverty across the UK. Despite the wealth of these areas, life satisfaction and overall wellbeing are relatively low, with NI having the highest rankings despite its lower income and higher levels of poverty.

12
3. Environmental Sustainability2014 performance compared to 2009 performance
Key Indicator Summary
Electricity generated from renewable sources
Energy consumption dependent on oil
Waste generated per capita
Greenhouse gas emissions per capita
Exposure to air pollution
1 2 3 4 5 6 7 8 9 10 11 12 13 14 15 16 17 18 19 20 21 22 23 24 25 26 27 28 29 30 31 32 33 34 35
1 2 3 4 5 6 7 8 9 10 11 12 13 14 15 16 17 18 19 20 21 22 23 24 25 26 27 28 29
1 2 3 4 5 6 7 8 9 10 11 12 13 14 15 16 17 18 19 20 21 22 23 24 25 26 27 28 29
1 2 3 4 5 6 7 8 9 10 11 12 13 14 15 16 17 18 19 20 21 22 23 24 25 26 27 28 29 30 31
1 2 3 4 5 6 7 8 9 10 11 12 13 14 15 16 17 18 19 20 21 22 23 24 25 26 27 28 29 30 31 32 33 34 35
GOOD POOR
Five Years ago: 6.5
Current: 6.5
10th 9th 8th 1st 2nd 3rd 4th 5th 6th 7th
Overall, performance is unchanged
POOR 34 GOOD
6
GOOD
GOOD
GOOD
POOR
GOOD
POOR
20
POOR
POOR 7
29
For more detailed information, see the Environmental Sustainability Scorecard

13
Dashboard Assessment The environmental sustainability of an economy has a direct impact on its competitiveness. For example, if pollution levels in an economy are high this has potentially a negative effect on health, which in turn can impact negatively upon both the size and productivity of the available labour stock. In addition, if an economy is heavily reliant on imported energy, domestic energy policy will have limited ability to influence prices, which could impact upon competitiveness and attractiveness of the area to potential investors.
NI performs well in terms of environmental sustainability, making this one of the stronger pillars in the scorecard (5.3). Environmental sustainability is a story of two halves, performing very well in terms of low levels of greenhouse gas emissions and consequently low levels of air pollution; however, this may be due to lower levels of economic activity overall. In contrast, NI generates relatively high levels of waste per capita, is heavily dependent on imported oil and generates only a small proportion of energy from renewable sources despite large advances in recent times. As a result, dependency on imported fuels exposes NI to significant risks in terms of future price rises and security of supply.
Comparative Assessment Nordic countries perform very well on this index. Sweden ranks highly on a number of indicators in this pillar, with the highest proportion of energy generated from renewable sources, low oil dependency, low waste generation and relatively low levels of air pollution. Finland and Denmark also have relatively strong performance here, with the second and third highest reliance on renewable energy sources respectively. Denmark also has relatively low levels of waste generation, whilst Finland has very low levels of exposure to oil pollution.
UK performance is fairly strong in this pillar, and generally better than the RoI. The UK has relatively low oil dependency, waste generation, greenhouse gas emissions and exposure to air pollution. However, both the UK and RoI lag far behind other comparators on renewable energy. The RoI, unlike the UK but similar to NI, has a very high dependence on oil consumption, whilst also having relatively high waste generation.

14
4. Business Performance2014 performance compared to 2009 performance
Key Indicator Summary
FDI jobs created per capita
Business population growth
Exports of goods inside the EU (% of GDP)
Exports of goods outside the EU (% of GDP)
Exports to emerging markets (% of GDP)
1 2 3 4 5 6 7 8 9 10 11 12 13 14 15
1 2 3 4 5 6 7 8 9 10 11 12 13 14 15 16 17 18 19 20 21 22 23 24 25 26 27 28 29
1 2 3 4 5 6 7 8 9 10 11 12 13 14 15 16 17 18 19 20 21 22 23 24 25 26 27 28 29
1 2 3 4 5 6 7 8 9 10 11 12 13 14 15 16 17 18 19 20 21 22 23 24 25 26 27 28 29
1 2 3 4 5 6 7 8 9 10 11 12 13 14 15 16 17 18 19 20 21
GOOD POOR
Five Years ago: 7.2
Current: 5.8
10th 9th 8th 1st 2nd 3rd 4th 5th 6th 7th
Overall, performance has risen by 1.4 decile points
POOR 3 GOOD
15
19
GOOD
GOOD
GOOD
POOR
POOR
22
POOR
12 GOOD POOR
For more detailed information, see the Business Performance Scorecard

15
Dashboard Assessment The business performance of a location has a direct impact on the amount of profit a company can make. For this reason, all investors (both foreign and indigenous) will consider the business performance of a location before committing to set up a new entity or expanding its existing presence in the country. This, in turn, impacts income and employment levels throughout the economy and thus feeds through to government expenditure. The remainder of this sub-section considers two key business performance indicator areas; investment (including entrepreneurship) and trade.
This element of the Scorecard improved most over the previous five years (from 7.2 to 5.8). NI’s record on FDI job creation (per capita) performance is excellent, third placed behind RoI and Slovakia and is the strongest of the indicators within this element of the Scorecard. NI firms are becoming more outward looking, which is welcome, given the relatively small size of the NI economy. Manufacturers are the largest exporters, particularly the food and drink, transport equipment and machinery sectors. NISRA’s Broad Economy Sales and Exports Statistics3 was published too late to be included as an indicator in this first edition of the Scorecard, but it highlights encouraging levels of exports from services firms as well.
NI’s position as a region rather than a nation is important here. Exports are sales made to other countries, but sales going from NI to elsewhere in GB also represent added value to the region. This measure of exports and GB sales is referred to as “external sales”. The data sources used in this first edition of the Scorecard only capture the exports side of these external sales, but with the new NISRA measure which captures GB sales across most of the private sector now being made available, this is something that can be incorporated going forward.
An examination of NI’s sectoral performance reveals that GVA growth is slower in the majority of sectors in NI when compared to their UK counterparts. It is concerning that the only sector in which growth is more rapid, by a margin, is public administration. The majority of private sector services industries lagged their UK counterparts, which demonstrates the challenges in terms of rebalancing toward a larger and more vibrant private sector in NI.
Comparative Assessment The RoI performs strongly here with the best FDI performance of any comparator and one of the highest export intensities, albeit many of these export sales are not focused on faster growing, emerging markets. Netherlands also has a very high export intensity alongside the strongest growth in business population of any comparator.
The UK has reported positive business population growth and high levels of churn in recent years, although FDI performance has ranked behind many smaller economies and export-intensity is the lowest of all comparators considered. Whilst manufacturing is obviously very important for the UK’s export performance, so too are the service sectors which have shown growth of 2.1% from 2013 to 2014.
3 https://www.economy-ni.gov.uk/articles/broad-economy-exports

16
5. Productivity2014 performance compared to 2009 performance
Key Indicator Summary
Productivity levels (output per hour)
Productivity growth rates (output per hour) 1 2 3 4 5 6 7 8 9 10 11 12 13 14 15 16 17 18 19 20 21 22 23 24 25 26 27 28
1 2 3 4 5 6 7 8 9 10 11 12 13 14 15 16 17 18 19 20 21 22 23 24 25 26 27 28
GOOD POOR
Five Years ago: 8.0
Current: 8.0
10th 9th 8th 1st 2nd 3rd 4th 5th 6th 7th
Overall, performance is unchanged
POOR 14 GOOD
23 GOOD POOR
For more detailed information, see the Productivity Scorecard

17
Dashboard Assessment Competitiveness and productivity are often used interchangeably. Productivity is a measure of efficiency and is vital for economic growth. High productivity means that an economy is producing high levels of output for a given level of input. Exports (reviewed in the previous pillar) are an important consideration alongside productivity, as businesses will not be competitive in export markets if they are not productive. A range of factors including innovation, skills, investment, competition and enterprise can contribute to high productivity and therefore economic growth. Measurement of productivity is difficult and relies on accurate GDP or GVA data. There are some concerns in relation to the accuracy of regional data in an NI context, which means that care must be taken in the interpretation of the information presented.
In international terms, NI’s productivity performance is weak, but stable. It is the weakest of the elements of the Scorecard with an average decile placement of 8.0, which means that more than four fifths of NI’s competitor countries are ahead of NI on this aspect of competitiveness. If NI’s relative productivity continues to lag comparator nations, it will continue to impinge upon NI’s international competitiveness and longer term economic growth prospects.
In a UK context, NI ranks 12th of the 12 UK regions. This can be explained by a relatively high concentration of low productivity sectors in NI as well as lower productivity within sectors. This is partially due to the type of activity that is being undertaken in NI (such as hedge fund management within Finance in London and retail banking in NI, which are within the same sector, but are very different activities). It is encouraging that productivity growth in the majority of NI sectors exceed the UK rate, although in absolute terms, NI still lags the UK in all but five sectors, which are predominantly public services.
Comparative Assessment Some of the strongest performing countries in terms of productivity levels are the US, France, Germany and Netherlands. However, productivity growth has been relatively stagnant in these economies. The RoI represents a best practice exemplar here, with high levels of productivity and fast growth, alongside Singapore. Both of these economies have a high reliance on FDI companies and therefore GDP figures are likely to be inflated by goods and services traded but not produced in these economies.
Within the UK, London dominates productivity performance and is well above any other region. Indeed, only the South East and East of England have productivity above the UK average, with Scotland also near this benchmark. The remaining eight regions all have productivity below the UK average, which is clearly heavily skewed by the performance of London. This raises the question as to how appropriate a UK benchmark including London is for the majority of the UK regions.

18
6. Prices & Costs2014 performance compared to 2009 performance
Key Indicator Summary
Annual growth in labour costs
Manufacturing hourly labour costs
Cost to rent prime office space
Industrial electricity prices for very small electricity users
Industrial electricity prices for large electricity users
1 2 3 4 5 6 7 8 9 10 11 12 13 14 15 16 17 18 19 20 21 22 23 24 25 26 27 28 29
1 2 3 4 5 6 7 8 9 10 11 12 13 14 15 16 17 18 19 20 21 22 23 24 25 26 27 28 29 30 31 32 33 34 35
1 2 3 4 5 6 7 8 9 10 11 12 13 14 15 16 17 18 19 20 21 22 23 24 25 26 27 28 29 30
1 2 3 4 5 6 7 8 9 10 11 12 13 14 15 16
1 2 3 4 5 6 7 8 9 10 11 12 13 14 15 16
GOOD POOR
Five Years ago: 6.6
Current: 6.3
10th 9th 8th 1st 2nd 3rd 4th 5th 6th 7th
Overall, performance has risen by 0.3 decile points
POOR 26 GOOD
11
GOOD
GOOD
POOR
GOOD
1
POOR
POOR 14
POOR 11 GOOD
For more detailed information, see the Prices & Costs Scorecard

19
Dashboard Assessment Prices and costs are a critical element of competitiveness. Increasing costs that are not underpinned by increases in productivity will impact negatively upon competitiveness and NI’s product and service offering in international markets. In October 2015 DfE (then, DETI) published a dedicated Cost of Doing Business report4 which assessed NI's cost competitiveness in detail, and this pillar will cover some of these key cost areas.
Prices and costs are, from an overall perspective, relatively uncompetitive in NI. Despite some improvements, NI is almost two thirds of the way down the competitiveness table in this element of the Scorecard. However, a more detailed examination of the evidence reveals that NI is quite uncompetitive in certain areas (electricity prices, growth in labour costs and CPI inflation) and very competitive in other areas (cost of office space, water costs, house prices and manufacturing wages) which are among the lowest of the countries analysed. These very competitive cost areas underpin NI’s strong FDI performance in recent years.
This finding might seem at odds with the recent DfE costs report, which found that NI’s costs were competitive relative to the UK and RoI. The choice of comparators is important here, as NI does appear relatively competitive against its closest neighbours but becomes more uncompetitive when considered more widely internationally. Costs vary substantially by sector, and thus whilst the Scorecard has made one overall assessment on prices and costs, in reality the picture will be very different depending on whether a business’ cost base is made up mainly of labour and property, or is much more reliant on energy and transport.
It is a weakness for NI in the assessment of competitiveness that price level and inflation data are not available for NI, only the UK as a whole. There is merit in developing a CPI for NI, which would provide the capability to compare price levels and inflation.
Comparative Assessment Cost performance differs significantly across countries depending on the measure being reviewed. Hungary emerges as a very cost competitive location with low and falling labour costs, low property costs and very affordable housing. These are areas where NI also tends to do well. Exemplars on electricity prices are very different, with Sweden, Finland and Luxembourg offering low costs for both small and large users.
The UK and RoI have middle-ranking performance on manufacturing compensation costs and prime office costs, whilst water costs are amongst the lowest compared with other major international cities. Electricity is the one area where both the UK and RoI have high prices, with RoI being more uncompetitive for smaller users and UK being uncompetitive for large users. The largest component of these relatively high prices relate to wholesale & supply costs, something which is common across many EU countries. The EU has a long term strategy to create a large single market allowing a “free flow of energy across national borders”, something which should help to reduce prices,5 however this is an area where access and trading will depend on future arrangements post Brexit.
4 https://www.economy-ni.gov.uk/publications/cost-doing-business-northern-ireland 5 https://ec.europa.eu/energy/en/topics/energy-strategy

20
7. Labour Supply & Employment2014 performance compared to 2009 performance
Key Indicator Summary
Employment rate
Long term unemployment
Percentage of young people not in employment, education or training
Economic inactivity rate
Skills mismatches for highly skilled workers
1 2 3 4 5 6 7 8 9 10 11 12 13 14 15 16 17 18 19 20 21 22 23 24 25 26 27 28 29 30 31 32 33 34 35 36
1 2 3 4 5 6 7 8 9 10 11 12 13 14 15 16 17 18 19 20 21 22 23 24 25 26 27 28 29 30 31 32 33 34 35 36
1 2 3 4 5 6 7 8 9 10 11 12 13 14 15 16 17 18 19 20 21 22 23 24 25 26 27 28 29
1 2 3 4 5 6 7 8 9 10 11 12 13 14 15 16 17 18 19 20 21 22 23 24 25 26 27 28 29 30 31 32 33 34
1 2 3 4 5 6 7 8 9 10 11 12 13 14 15 16 17 18 19 20 21 22 23 24 25 26 27 28 29
GOOD POOR
Five Years ago: 6.8
Current: 7.3
10th 9th 8th 1st 2nd 3rd 4th 5th 6th 7th
Overall, performance has fallen by 0.5 decile points
POOR 15 GOOD
GOOD POOR 27
GOOD POOR 21
GOOD POOR 18
GOOD POOR 22
For more detailed information, see the Labour Supply & Employment Scorecard

21
Dashboard Assessment Understanding the resource endowments provided by the local labour market is an important element of assessing competitiveness. The size, skill profile and capacity of the labour pool will be of significant interest to potential investors. High levels of employment will in turn reduce the Government’s unemployment benefit bill, increase revenues and the tax base. NI’s performance within this pillar is weak, and has deteriorated over the past five years. Almost three quarters of the countries analysed are now more competitive than NI on this pillar.
Many of the indicators have recovered to an extent following the recession, such as employment and unemployment. However, youth unemployment and long term youth unemployment remain persistently high, whilst improvements are evident in competitor nations – making these issues a significant policy challenge. The proportion of the population who are Not in Education, Employment or Training (NEETs) is also relatively large and increasing. High levels of benefit dependency are a persistent feature of the NI economy. There is an undersupply of high skilled and an oversupply of low skilled workers in NI and migration is broadly in balance. Given the disequilibrium in skills it would be important to better understand the skills profiles of emigrants and immigrants against the population in general.
There is a significant risk that NEETs, youths and the long term unemployed will become increasingly detached from the labour market adding to the issue of benefit dependency and lost economic potential for both the individuals and society. For parents, especially those with relatively low skills or working in low paid sectors, high childcare costs represent a significant barrier to re-joining the workforce. NI’s dependency ratio is also set to increase markedly over the next few decades, which will generate employment in some areas, but will also restrict some family and carers in terms of their employment options.
NI’s sectoral employment profile reveals that a relatively high proportion of employees are in agriculture, the public sector & manufacturing with very low proportions in professional services, ICT and finance. These data demonstrate that most of the sectors that are successful in NI are domestically focussed (the exception being manufacturing) and that the underrepresented sectors are generally high productivity and externally focussed, highlighting the type of structural change that would be required in order to rebalance the NI economy.
Comparative Assessment The highest employment rates in Europe can be found in Sweden, Germany and Netherlands, and the corresponding inactivity rates in these countries are therefore also very low. These three economies have generally strong labour markets, with low rates of NEETs, few skills mismatches (Sweden and Germany) and low youth unemployment (Germany and Netherlands). Germany is therefore overall very strong, but has amongst the fewest persons of working age available for companies. The UK generally performs well here, in contrast with the RoI which has high inactivity rates combined with a tight labour market amongst the most highly skilled. This is partly offset with a large number of working age persons relative to those of pension age.

22
8. Business Environment2014 performance compared to 2009 performance
Key Indicator Summary
Total entrepreneurial activity rate
Venture capital investment as percentage of GDP
Private equity investment as percentage of GDP
Number of SME bank loans approved per 1,000 SMEs
Sources: BBA, BIS & IDBR
Value of bank loans approved as percentage of GVA
Sources: BBA, BIS & ONS Regional Accounts
1 2 3 4 5 6 7 8 9 10 11 12 13 14 15 16 17 18 19 20 21 22 23 24
1 2 3 4 5 6 7 8 9 10 11 12 13 14 15 16 17 18 19 20 21 22 23 24 25 26 27 28 29 30 31 32
1 2 3 4 5 6 7 8 9 10 11 12 13 14 15 16 17 18 19 20 21
1 2 3 4 5 6 7 8 9 10 11 12
1 2 3 4 5 6 7 8 9 10 11 12
GOOD POOR
Five Years ago: 4.8
Current: 4.8
10th 9th 8th 1st 2nd 3rd 4th 5th 6th 7th
Overall, performance is unchanged
POOR 28 GOOD
19
GOOD
GOOD
GOOD
POOR
POOR
POOR 1
GOOD POOR 10
1
For more detailed information, see the Business Environment Scorecard

23
Dashboard Assessment In order for firms to compete successfully in international markets, the business environment must be conducive, imbue confidence and expectations of good quality and high standards, and should not impose unnecessary restrictions or costs on firms.
NI benefits from a relatively competitive business environment across a range of indicators and has enjoyed significant improvements over the past five years. This is one of the best performing elements of the scorecard, at 4.8 in terms of decile placement. NI’s relative position has not changed over the previous five years.
It is however, a story of two halves, scoring very well on a range of indicators relating to regulation, low barriers to entry and ease of doing business which are set within a UK framework and result in a mid- table performance. NI also scores particularly well against the other UK regions in terms of the number of business loans and value of business loans approved, but scores poorly on a number of indicators relating to other sources of finance. Venture Capital (VC), Merger & Acquisition and private equity activity is extremely low in NI. It is not possible to determine whether this is an issue of limited supply or low demand but is an area that may merit further investigation as high tech start-ups often rely on these sources of finance.
Comparative Assessment The United States is a clear leader in both entrepreneurial activity and availability of venture capital finance. This role of entrepreneurs and VC funding is evident in the early stage development of key US technology companies such as Facebook, Google, Amazon and Apple. Within Europe, Denmark and Sweden rank highly on both VC and other private equity investment. Denmark also benefits from a lack of product market regulations and there are also few barriers to entrepreneurship. Netherlands emerges as a key entrepreneurial hub, with high levels of entrepreneurial activity and few barriers.
The UK offers a strong environment for entrepreneurs, with few barriers and significant levels of activity apparent, whilst also having the best availability of private equity funding across all comparators. Despite the relative lack of VC and private equity finance in NI, the availability of traditional bank loans and funding for SMEs ranks as the best within the UK. The UK and RoI each have their own respective strengths. Whilst the RoI has good availability of VC investment, it lacks funding for other types of private equity (generally later stage funding for scaling rather than start-up), entrepreneurial activity is very low and there are many barriers to entrepreneurship evident.

24
9. Physical Infrastructure2014 performance compared to 2009 performance
Key Indicator Summary
Energy import dependency (by % of fuel imported)
Superfast broadband availability (% of premises within coverage area)
Traffic congestion index (Tom-Tom traffic congestion index of capital cities)
Grade A office space availability (% of total available supply)
1 2 3 4 5 6 7 8 9 10 11 12 13 14 15 16 17 18 19 20 21 22 23 24 25 26 27 28 29
1 2 3 4 5 6 7 8 9 10 11 12
1 2 3 4 5 6 7 8 9 10 11 12 13 14 15 16 17 18 19 20
0% 20% 40% 60% 80% 100%
GOOD POOR
Five Years ago: 6.3
Current: 5.9
10th 9th 8th 1st 2nd 3rd 4th 5th 6th 7th
Overall, performance has risen by 0.4 decile points
POOR 28 GOOD
GOOD
GOOD
POOR
POOR 20
19 POOR GOOD
1
For more detailed information, see the Physical Infrastructure Scorecard

25
Dashboard Assessment The quality and extent of the physical infrastructures impact directly upon competitiveness through trade effects, the mobility of labour and quality of life. It also has the potential to impact upon the attractiveness of the country in the eyes of investors and highly skilled migrants. NI’s physical infrastructure has improved over the past five years from 6.3 to 5.9, resulting in a mid-table position in the Competitiveness Scorecard.
This pillar, like a number of others is a story of two halves. NI performs exceptionally well in terms of technological infrastructure - such as broadband connectivity, access and services and, starting from a strong base, has improved its relative position further in recent years. Information on the provision of technological infrastructure is good, however, it would be beneficial to have access to information on the usage costs. Physical infrastructure is also improving, posting a mid-table performance and maintaining NI’s relative position. Direct air connectivity is relatively poor, although people may travel via Dublin or London in order to get to a range of international destinations. This means that NI’s connectivity infrastructure is not as poor as it may seem at first, although the greater reliance on air travel to get to GB locations than elsewhere in the UK (where rail and road links are available) can put NI at a disadvantage here.
NI’s dependence on imported fuel sources remains a significant challenge, although one that will not be easily changed given NI’s resource endowments. Oil prices have declined to almost a quarter of their peak price, which will prove beneficial for businesses and consumers, both in NI and beyond, whilst these low prices prevail. The large increase in energy generation from renewable sources detailed in the environmental sustainability element of the Scorecard represents a significant improvement, although NI is working from a low base and it will take time to catch up and move ahead of other nations.
Comparative Assessment Unsurprisingly, larger countries tend to have greater connectivity, both in terms of shipping and air routes, than smaller economies. Italy and Spain rank amongst the top countries for shipping routes, whilst France, Germany and the US have access to many direct international air routes. Given its smaller size, Netherlands emerges as a strong exemplar for physical infrastructure due to strong performance across telecoms measures, air route availability, lack of traffic congestion and motorway infrastructure. Denmark, Sweden, and Finland also tend to perform strongly across telecoms measures.
The UK, as a large economy, performs well in terms of both shipping and air route availability and comes out relatively high on telecoms measures. Motorway size is an area where the UK lags behind on physical infrastructure. The RoI, as a smaller economy, cannot offer the same connectivity as many of its larger competitors, is relatively low down the ranking on many of the telecoms measures and lacks a large motorway infrastructure.

26
10. Education and Skills2014 performance compared to 2009 performance
Key Indicator Summary
Working age population with a minimum of upper secondary education
Working age population maths proficiency
Working age population reading proficiency
Working age population with tertiary education
Early school leavers aged 18-24
1 2 3 4 5 6 7 8 9 10 11 12 13 14 15 16 17 18 19 20 21 22 23 24 25 26 27 28 29
1 2 3 4 5 6 7 8 9 10 11 12 13 14 15 16 17 18 19 20 21
1 2 3 4 5 6 7 8 9 10 11 12 13 14 15 16 17 18 19 20 21
1 2 3 4 5 6 7 8 9 10 11 12 13 14 15 16 17 18 19 20 21 22 23 24 25 26 27 28 29
1 2 3 4 5 6 7 8 9 10 11 12 13 14 15 16 17 18 19 20 21 22 23 24 25 26 27 28 29
GOOD POOR
Five Years ago: 5.4
Current: 5.9
10th 9th 8th 1st 2nd 3rd 4th 5th 6th 7th
Overall, performance has fallen by 0.5 decile points
POOR 22 GOOD
16 GOOD POOR
GOOD POOR 16
POOR 13 GOOD
25 GOOD POOR
For more detailed information, see the Education & Skills Scorecard

27
Dashboard Assessment The stock and quality of education and skills in an economy is vital for economic growth. A highly skilled and dynamic labour force is more productive, innovative and attractive to foreign investors. Knowledge oriented sectors are more export intensive, helping to generate additional income and grow the economy.
NI’s performance in this element of the Scorecard has deteriorated from 5.4 to 5.9 over the previous five years – the largest reduction of the 11 pillars. In absolute terms, NI’s performance has improved in approximately half of the indicators and deteriorated in the remainder. In relative terms, other countries have improved more rapidly than NI, with the result that NI’s comparative position has been eroded.
Participation rates rank well against competitor countries which provides a strong base in terms of the reach of education throughout the future labour force. For those completing their education, outcomes are average, or slightly below average for the countries analysed. Literacy, as measured by PISA presents some challenges, as scientific, mathematical and reading literacy of 15 year olds declined between 2009 and 2012. If this trend continues, it will result in difficulties for employers and economic development policy makers in future years.
The proportion of the population that have completed tertiary education has improved and NI ranks mid-table, although still well below the UK average and RoI. However, issues persist with a relatively large proportion of the population with only primary level education and a relatively large proportion of early school leavers suggesting that there are challenges within the education system for the less able pupils.
Comparative Assessment Within Europe, Finland emerges as the top performer across a range of education measures. It has the highest proportion of population with tertiary education of all comparators, high proficiency of maths and reading in the working age population, strong literacy amongst 15 year olds particularly for science, and good levels of lifelong learning. Outside of Europe, Asian economies such as Singapore, Korea and Japan rank highly on science, maths and reading literacy.
The performance of Central and Eastern European economies here is interesting to note. Whilst these may be less well developed than Western European counterparts, the Czech Republic and Poland have the highest proportion of population with at least upper secondary education, whilst these two countries along with Czech Republic have the lowest rates of early school leavers. In addition, literacy performance amongst 15 year olds in Poland is comparable to Finland.
Education performance in the UK and RoI is mixed. Measures looking at third-level education are generally very positive, with the proportions of population with tertiary education higher than almost anywhere within Europe. However, maths, science and reading literacy of 15 year olds is mid-level at best and the maths and reading proficiency of the working age population is relatively poor in both. This suggests that the two education systems are working well at producing graduates but many people are being left behind lacking essential core fundamental skills.

28
11. Innovation and R&D2014 performance compared to 2009 performance
Key Indicator Summary
Percentage of firms engaged in innovation activities
Business expenditure on R&D (BERD) as percentage of GDP
Higher education expenditure on R&D (HERD) as percentage of GDP
Knowledge Economy Index
PhD graduates per capita
1 2 3 4 5 6 7 8 9 10 11 12 13 14 15 16 17 18 19 20 21 22 23 24 25 26 27 28
1 2 3 4 5 6 7 8 9 10 11 12 13 14 15 16 17 18 19 20 21 22 23 24 25 26 27 28 29 30 31
1 2 3 4 5 6 7 8 9 10 11 12 13 14 15 16 17 18 19 20 21 22 23 24 25 26 27 28 29 30 31
1 2 3 4 5 6 7 8 9 10 11 12
1 2 3 4 5 6 7 8 9 10 11 12 13 14 15 16 17 18 19 20 21 22 23 24 25 26 27 28 29
GOOD POOR
Five Years ago: 6.4
Current: 6.4
10th 9th 8th 1st 2nd 3rd 4th 5th 6th 7th
Overall, performance is unchanged
POOR 17 GOOD
13
10
GOOD
GOOD
GOOD
POOR
GOOD
POOR
13
POOR
POOR 14
For more detailed information, see the Innovation and R&D Scorecard

29
Dashboard Assessment The stock and quality of innovation, research and development in an economy is vital for economic growth. Companies that innovate, research and develop products and processes are leaders in their field, competing on uniqueness and value rather than cost. These companies employ highly skilled individuals, pay high wages and generate income to NI from export sales.
NI’s R&D and innovation performance is one of the relatively weaker areas of the scorecard, scoring 6.4 in the decile placements, but remaining stable over the past five years. This means that two thirds of the comparator nations are ahead of NI in this pillar of the scorecard.
The level of innovation activity is relatively low within NI firms, but has increased - especially in manufacturing firms. NI’s knowledge economy has grown quite rapidly over the past five years, and from a low base, is now 10th of the UK regions. Patent application rates remain relatively low and the number of PhD graduates has reduced and is set to reduce further in future years. Problem solving abilities of young people in technology rich environments are also relatively low when compared to other countries.
NI has observed remarkable Business Expenditure on R&D (BERD) growth since 2008, with the level of spending more than doubling. This figure has, however, reduced markedly over the last year, with Foreign owned firms reducing expenditure by almost £100m, or 29%. BERD is particularly sensitive to the timing of individual projects within companies and, if larger projects are coming to an end, this can lead to decreases until new projects are underway. However, domestic firms and Higher Education expenditure on R&D both increased, going some way towards replacing the reduced BERD. Perhaps even more important is a significant rise observed in the number of companies involved in R&D. NI’s R&D base has historically been concentrated on a relatively small number of firms, and the latest R&D data signals a move to a much more diverse base which will benefit in the long run.
Comparative Assessment Finland ranks amongst the most competitive economies on this pillar, along with Denmark and Sweden. These economies have very high levels of R&D expenditure and many researchers. Finland also underpins this with strong human capital for innovation, with the highest proportion of persons educated to tertiary level employed in science and technology and the strongest problem solving in technology rich environments of any EU benchmark. It also has the highest number of patent applications.
The UK and RoI are not top performers on scientific innovation measures, with R&D expenditure, researchers and patent applications low. In terms of more general innovation activity of businesses, the RoI is a leading exemplar here, whereas the UK lags significantly behind. These economies are strong in human capital measures for innovation, relating back to their strongest performance on tertiary skills. Both have a very high number of PhD graduates, a large proportion of people with tertiary education employed in science and technology, and good problem solving skills in technology rich environments.

30
Summary & Next Steps Summary of Results It is clear that the outputs of the UUEPC Competitiveness Scorecard present policy makers in NI with much to consider. Those same outputs, set out in summary form below, also provide EAG with an effective framework which can be used to identify future areas of work for the Group.
Pillar 5 years previous Current Change in decile
Macro and fiscal sustainability 7.6 7.2 0.4
Quality of life 5.3 5.3 0.0
Environmental sustainability 6.5 6.5 0.0
Business performance 7.2 5.8 1.4
Productivity 8.0 8.0 0.0
Prices and costs 6.6 6.3 0.3
Labour supply & employment 6.8 7.3 -0.5
Business environment 4.8 4.8 0.0
Physical infrastructure 6.3 5.9 0.4
Education and skills 5.4 5.9 -0.5
Innovation, research and development 6.4 6.4 0.0
Overall, looking across a period of around 5 years, the picture is one where NI’s relative position has moved little, but the information below the aggregate level is of most interest. The relatively unchanged overall basket position is made up of a small number of relatively positive changes balancing out a much larger number of pillars where our relative position has been deteriorating over a number of years.
The two pillars of relative deterioration are Labour supply and employment and Education and skills. This weakening is concerning, as is the actual level of productivity which, whilst not deteriorating, remains nonetheless a major challenge. Significantly, those policy inputs, under the NCC approach, represent the foundation stones of the economy and the primary drivers of competitiveness. These not only are priority areas for EAG to carry out further work, but more importantly where government needs to act. In addition some of the evidence would suggest challenges ahead for improving living standards for the people of NI in both the medium and longer term. A low and falling competitive ranking within the productivity pillar, coupled with relative deteriorations within both the Education & skills pillar, and the Employment and labour supply pillar, would clearly point to some significant long term issues that need to be, first, examined and then addressed.

31
Next Steps Having undertaken previous work on benchmarking NI’s Competitiveness, and reflected on the merits of the various possible approaches, EAG is of the opinion that this approach developed for the Group by UUEPC provides a sound starting framework for monitoring and assessing NI’s Competitiveness. Going forward that framework is also flexible enough to facilitate further development, adaptation and tailoring to our informational needs in NI. This would potentially include a further look at metrics and the number and selection of comparator countries at a future date.
The framework will be used by the Group to inform its work programme, using the information and analysis contained within it to identify future areas of research and investigation. Clearly some, much more detailed, work will need to be undertaken to examine the factors driving performance under a number of the pillars. At that stage, once causal factors are clearly articulated and understood, EAG might well be in a better position to looks towards recommended areas for action or policy solutions.
In the meantime, at what is currently a particularly important juncture for NI, the Group aims to use the information within the Competitiveness Scorecard to highlight the challenges faced locally. Understanding the economy’s relative strengths and weaknesses is important at any stage – but never more so than when a future Programme for Government and refocused Economic Strategy are being devised and developed, as is currently the case for NI.

32
Annex – NCC Competitiveness Methodology The RoI’s National Competitiveness Council6 (NCC) uses a framework model to understand national competitiveness. It distinguishes between the ‘inputs’ to national competitiveness – over which policymakers can have greatest control – and the essential conditions for national competitiveness. The Competitiveness Pyramid in Figure 4 illustrates the framework model used by the National Competitiveness Council.
Figure 4: The NCC Competitiveness Pyramid
According to the NCC, the Policy Inputs are the primary drivers of competitiveness and through which government can ultimately influence sustainable growth. The second level of the competitiveness pyramid is the Essential Conditions stage and, if policy inputs are in line with best practice, this should be reflected in the metrics assessing the essential conditions for Ireland’s continued sustainable growth. The final level is that of the NCC goal of Sustainable Growth to further improve the quality of life for people in Ireland. Competitive gains at the lower levels of the pyramid, over time, allow growth potential to be maximised at the apex, whilst providing suitable conditions for sustainable development.
The work of the NCC is brought together within Ireland's Competitiveness Scorecard to provide a comprehensive assessment of Ireland's competitiveness performance, using a range of statistical indicators drawn from national and international data sources.
6 http://www.competitiveness.ie/
Physical Infrastructure
Business Environment
Knowledge Infrastructure
Sustainable Growth
Business Performance
Productivity Prices & Costs
Labour Supply
Essential Conditions
Policy Inputs

Published in 2016 by the Economic Advisory Group
For more information visit www.eagni.com