e01020116 - devon health and wellbeing fileindices of deprivation domain descriptions key imd inc...
TRANSCRIPT

Contents
Page 1 Page 9
Page 2 Page 10
Page 3 Page 11
Page 4 Page 12
Page 5 Page 13
Page 6 Page 14
Page 7 Page 15
Page 8 Page 16
LSOA Profile Page 1 of 16
LOWER SUPER OUTPUT AREA (LSOA) BASED
COMMUNITY BASELINE PROFILE 2015
County Devon
CCG NEW Devon CCG
CCG Locality Northern Locality
E01020116
Description Ilfracombe - Furze Hill and Horne Park area
Deprivation Group Q2 - Above Average
District North Devon
Cover Elective Admissions
Index of Multiple Deprivation Accidental Falls Admissions
Population A&E Attendances
Indices of Deprivation Domains Alcohol-Related Admissions
Employment Deprivation Life Expectancy at Age 65
Income Deprivation Life Expectancy at Birth
Emergency Admissions Sources
JSA Claimant Rate Birth Rate
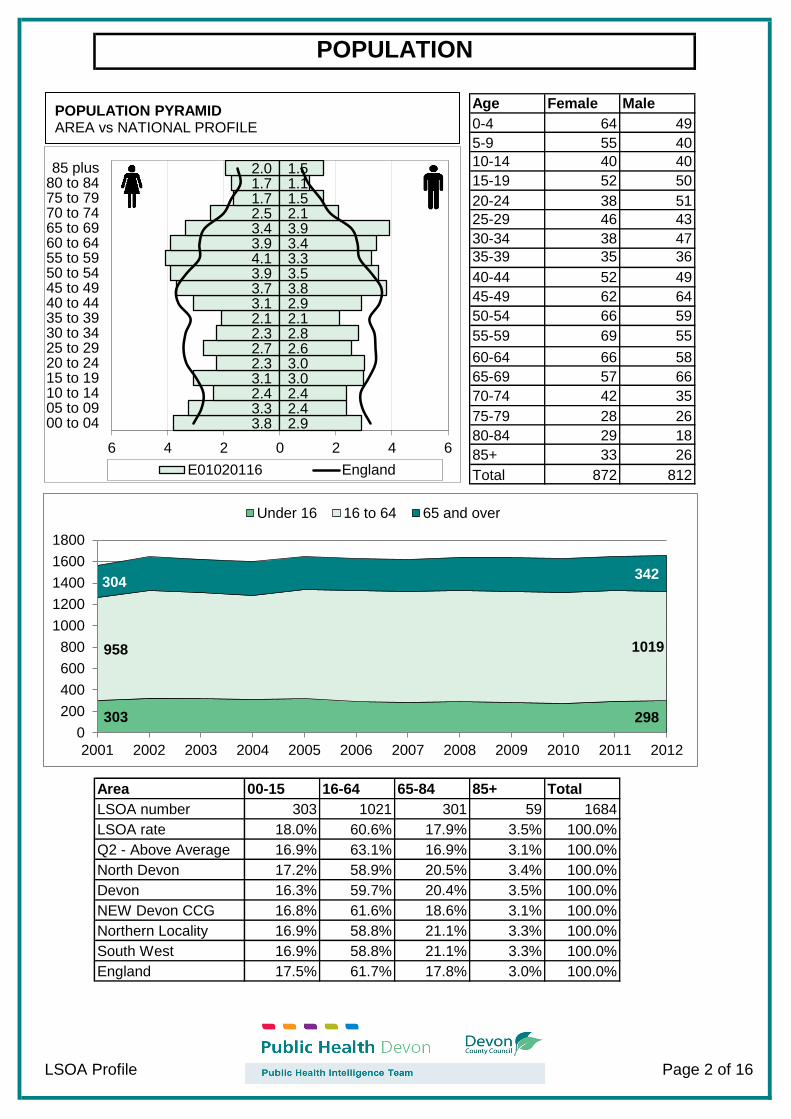
Age Female Male
0-4 64 49
5-9 55 40
10-14 40 40
15-19 52 50
20-24 38 51
25-29 46 43
30-34 38 47
35-39 35 36
40-44 52 49
45-49 62 64
50-54 66 59
55-59 69 55
60-64 66 58
65-69 57 66
70-74 42 35
75-79 28 26
80-84 29 18
85+ 33 26
Total 872 812
00-15 16-64 65-84 85+ Total
303 1021 301 59 1684
18.0% 60.6% 17.9% 3.5% 100.0%
16.9% 63.1% 16.9% 3.1% 100.0%
17.2% 58.9% 20.5% 3.4% 100.0%
16.3% 59.7% 20.4% 3.5% 100.0%
16.8% 61.6% 18.6% 3.1% 100.0%
16.9% 58.8% 21.1% 3.3% 100.0%
South West 16.9% 58.8% 21.1% 3.3% 100.0%
17.5% 61.7% 17.8% 3.0% 100.0%
LSOA Profile Page 2 of 16
POPULATION
Area
LSOA number
Q2 - Above Average
LSOA rate
Devon
North Devon
NEW Devon CCG
Northern Locality
England
3.8 3.3 2.4 3.1 2.3 2.7 2.3 2.1 3.1 3.7 3.9 4.1 3.9 3.4 2.5 1.7 1.7 2.0
2.9 2.4 2.4 3.0 3.0 2.6 2.8 2.1 2.9 3.8 3.5 3.3 3.4 3.9 2.1 1.5 1.1 1.5
6 4 2 0 2 4 6
00 to 0405 to 0910 to 1415 to 1920 to 2425 to 2930 to 3435 to 3940 to 4445 to 4950 to 5455 to 5960 to 6465 to 6970 to 7475 to 7980 to 8485 plus
E01020116 England
303 298
958 1019
304 342
0
200
400
600
800
1000
1200
1400
1600
1800
2001 2002 2003 2004 2005 2006 2007 2008 2009 2010 2011 2012
Under 16 16 to 64 65 and over
POPULATION PYRAMID AREA vs NATIONAL PROFILE

LSOA Profile Page 3 of 16
INDEX OF MULTIPLE DEPRIVATION
24.49
26.75
19.96
17.01
19.64
20.22
17.58
21.53
0.00 5.00 10.00 15.00 20.00 25.00 30.00
E01020116
Q2 - Above Average
North Devon
Devon
NEW Devon CCG
Northern Locality
South West
England
IMD Score Higher
Deprivation Lower Deprivation
2004 2007 2010
E01020116 10237 12475 10974
1
6497
12994
19490
25987Na
tio
na
l R
an
k a
nd
Qu
inti
le
Most Deprived
Above Average
Average
Below Average
Least Deprived
1
32482
The English Indices of Deprivation measures relative levels of deprivation in small areas of England called Lower Super Output Areas (LSOAs). The overall measure is called the Index of Multiple Deprivation. This produces an IMD score (bar chart below showing score in 2010) and a national rank out of 32482 LSOAs (trend in national rank shown in line chart below). Deprivation and health are closely connected, with areas with higher levels of deprivation tending to experience poorer health outcomes. Reducing social inequalities in health is a major focus of the work of Public Health teams.
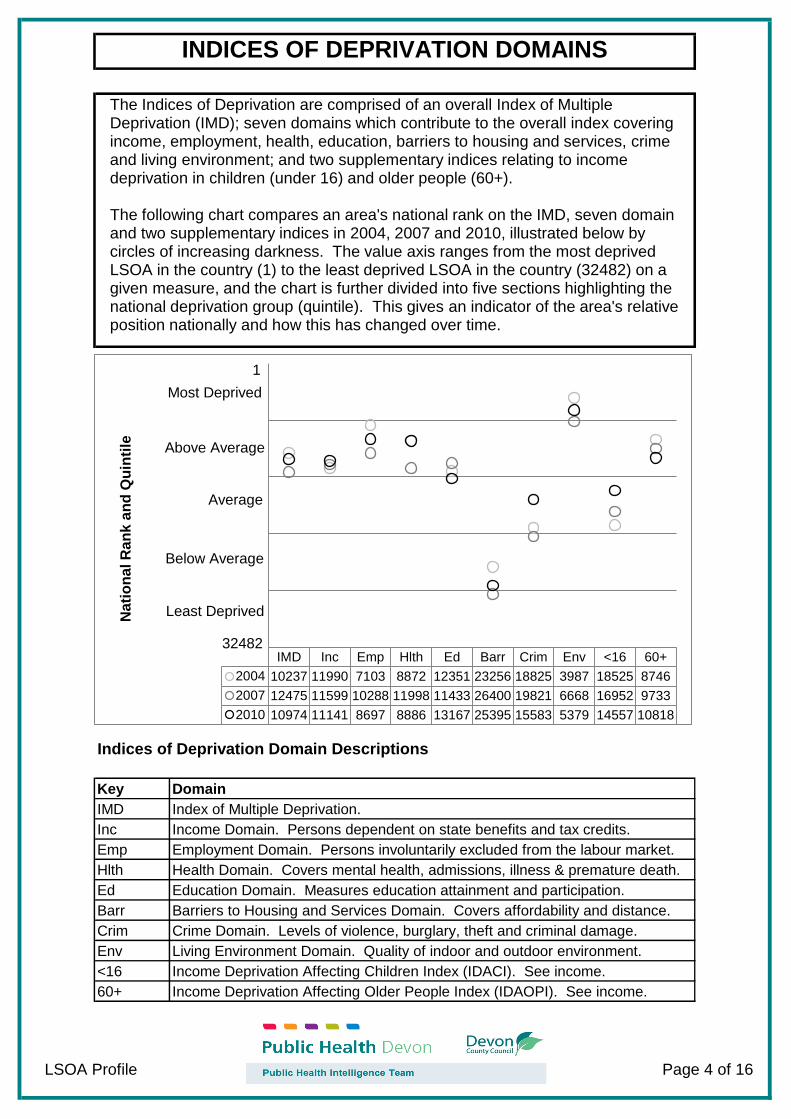
Indices of Deprivation Domain Descriptions
Key
IMD
Inc
Emp
Hlth
Ed
Barr
Crim
Env
<16
60+
LSOA Profile Page 4 of 16
INDICES OF DEPRIVATION DOMAINS
Domain
Index of Multiple Deprivation.
Employment Domain. Persons involuntarily excluded from the labour market.
Income Domain. Persons dependent on state benefits and tax credits.
Education Domain. Measures education attainment and participation.
Health Domain. Covers mental health, admissions, illness & premature death.
Living Environment Domain. Quality of indoor and outdoor environment.
Crime Domain. Levels of violence, burglary, theft and criminal damage.
Barriers to Housing and Services Domain. Covers affordability and distance.
Income Deprivation Affecting Older People Index (IDAOPI). See income.
Income Deprivation Affecting Children Index (IDACI). See income.
IMD Inc Emp Hlth Ed Barr Crim Env <16 60+
2004 10237 11990 7103 8872 12351 23256 18825 3987 18525 8746
2007 12475 11599 10288 11998 11433 26400 19821 6668 16952 9733
2010 10974 11141 8697 8886 13167 25395 15583 5379 14557 10818
1
6497.4
12993.8
19490.2
25986.6
Nati
on
al R
an
k a
nd
Qu
inti
le
Most Deprived
Above Average
Average
Below Average
Least Deprived
1
32482
The Indices of Deprivation are comprised of an overall Index of Multiple Deprivation (IMD); seven domains which contribute to the overall index covering income, employment, health, education, barriers to housing and services, crime and living environment; and two supplementary indices relating to income deprivation in children (under 16) and older people (60+). The following chart compares an area's national rank on the IMD, seven domain and two supplementary indices in 2004, 2007 and 2010, illustrated below by circles of increasing darkness. The value axis ranges from the most deprived LSOA in the country (1) to the least deprived LSOA in the country (32482) on a given measure, and the chart is further divided into five sections highlighting the national deprivation group (quintile). This gives an indicator of the area's relative position nationally and how this has changed over time.
2004 2007 2010
- - -
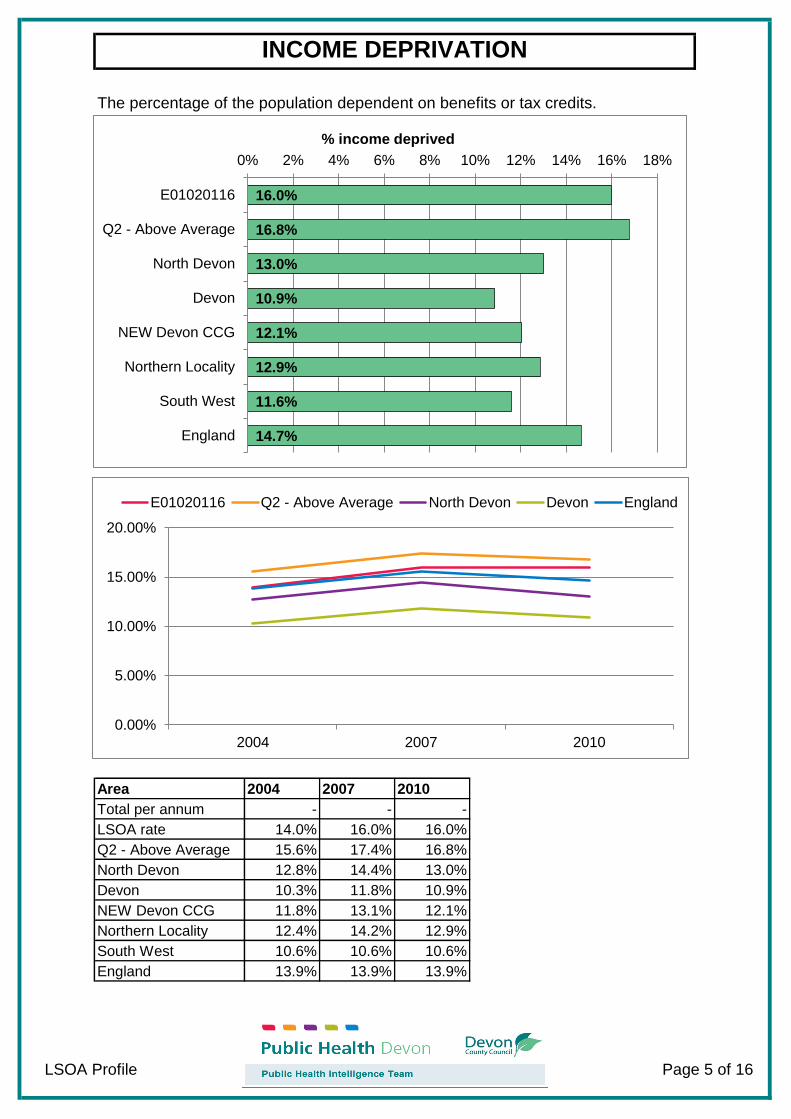
14.0% 16.0% 16.0%
15.6% 17.4% 16.8%
12.8% 14.4% 13.0%
10.3% 11.8% 10.9%
11.8% 13.1% 12.1%
12.4% 14.2% 12.9%
South West 10.6% 10.6% 10.6%
13.9% 13.9% 13.9%
LSOA Profile Page 5 of 16
The percentage of the population dependent on benefits or tax credits.
INCOME DEPRIVATION
Area
Total per annum
LSOA rate
Q2 - Above Average
Devon
North Devon
Northern Locality
NEW Devon CCG
England
16.0%
16.8%
13.0%
10.9%
12.1%
12.9%
11.6%
14.7%
0% 2% 4% 6% 8% 10% 12% 14% 16% 18%
E01020116
Q2 - Above Average
North Devon
Devon
NEW Devon CCG
Northern Locality
South West
England
% income deprived
0.00%
5.00%
10.00%
15.00%
20.00%
2004 2007 2010
E01020116 Q2 - Above Average North Devon Devon England
2004 2007 2010
- - -
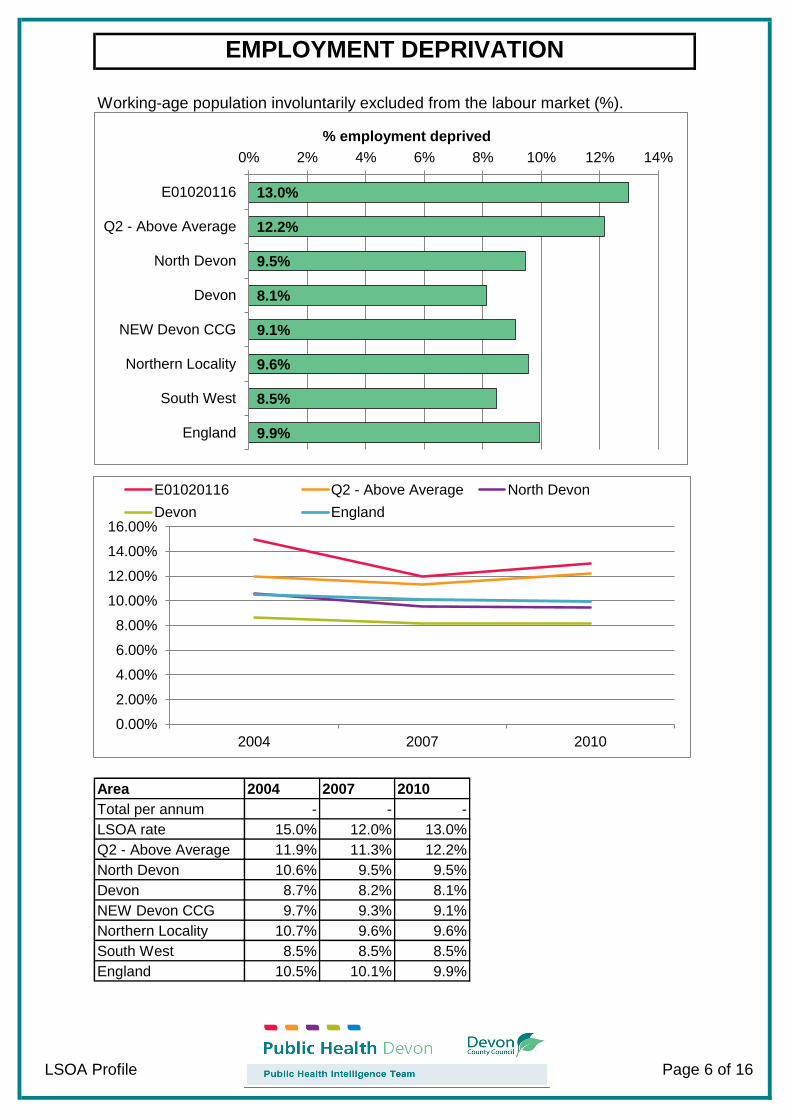
15.0% 12.0% 13.0%
11.9% 11.3% 12.2%
10.6% 9.5% 9.5%
8.7% 8.2% 8.1%
9.7% 9.3% 9.1%
10.7% 9.6% 9.6%
South West 8.5% 8.5% 8.5%
10.5% 10.1% 9.9%
LSOA Profile Page 6 of 16
Working-age population involuntarily excluded from the labour market (%).
EMPLOYMENT DEPRIVATION
Area
Total per annum
LSOA rate
Q2 - Above Average
Devon
North Devon
Northern Locality
NEW Devon CCG
England
13.0%
12.2%
9.5%
8.1%
9.1%
9.6%
8.5%
9.9%
0% 2% 4% 6% 8% 10% 12% 14%
E01020116
Q2 - Above Average
North Devon
Devon
NEW Devon CCG
Northern Locality
South West
England
% employment deprived
0.00%
2.00%
4.00%
6.00%
8.00%
10.00%
12.00%
14.00%
16.00%
2004 2007 2010
E01020116 Q2 - Above Average North Devon
Devon England
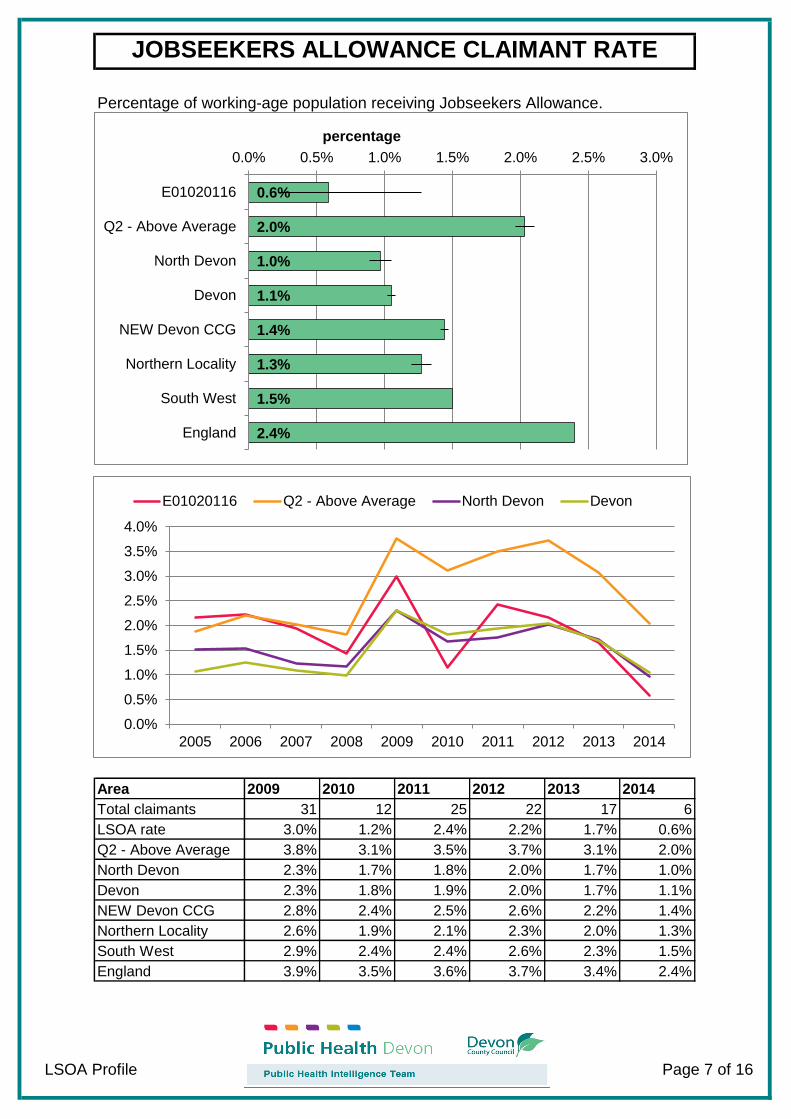
2009 2010 2011 2012 2013 2014
31 12 25 22 17 6
3.0% 1.2% 2.4% 2.2% 1.7% 0.6%
3.8% 3.1% 3.5% 3.7% 3.1% 2.0%
2.3% 1.7% 1.8% 2.0% 1.7% 1.0%
2.3% 1.8% 1.9% 2.0% 1.7% 1.1%
2.8% 2.4% 2.5% 2.6% 2.2% 1.4%
2.6% 1.9% 2.1% 2.3% 2.0% 1.3%
South West 2.9% 2.4% 2.4% 2.6% 2.3% 1.5%
3.9% 3.5% 3.6% 3.7% 3.4% 2.4%
LSOA Profile Page 7 of 16
Percentage of working-age population receiving Jobseekers Allowance.
JOBSEEKERS ALLOWANCE CLAIMANT RATE
Total claimants
Area
LSOA rate
Q2 - Above Average
Devon
North Devon
Northern Locality
NEW Devon CCG
England
0.6%
2.0%
1.0%
1.1%
1.4%
1.3%
1.5%
2.4%
0.0% 0.5% 1.0% 1.5% 2.0% 2.5% 3.0%
E01020116
Q2 - Above Average
North Devon
Devon
NEW Devon CCG
Northern Locality
South West
England
percentage
0.0%
0.5%
1.0%
1.5%
2.0%
2.5%
3.0%
3.5%
4.0%
2005 2006 2007 2008 2009 2010 2011 2012 2013 2014
E01020116 Q2 - Above Average North Devon Devon

2008-10 2009-11 2010-12 2011-13
153 159 175 172
8594.7 8576.9 8863.0 8723.8
8828.2 8735.6 8643.6 8614.5
7478.7 7803.7 7990.1 8358.0
7014.6 7049.0 7111.0 7176.3
8042.2 7963.9 7799.3 7763.1
7180.4 7503.6 7750.9 8053.2
South West N/A N/A N/A N/A
N/A N/A N/A N/A
LSOA Profile Page 8 of 16
Direct-age standardised rate of emergency admissions to hospital.
EMERGENCY ADMISSIONS
Average per annum
Area
LSOA rate
Q2 - Above Average
North Devon
Devon
Northern Locality
NEW Devon CCG
England
8,723.8
8,614.5
8,358.0
7,176.3
7,763.1
8,053.2
0 2,000 4,000 6,000 8,000 10,000
E01020116
Q2 - Above Average
North Devon
Devon
NEW Devon CCG
Northern Locality
South West
England
DASR per 100,000
0.0
2000.0
4000.0
6000.0
8000.0
10000.0
2008-10 2009-11 2010-12 2011-13
E01020116 Q2 - Above Average North Devon
Devon England

2008-10 2009-11 2010-12 2011-13
227 244 284 321
12097.8 12815.4 14498.8 16025.4
13771.6 14974.2 15108.0 15132.3
13292.7 14173.0 14024.6 14075.1
14483.7 15735.4 15757.9 15547.8
13489.7 14767.4 14873.6 14840.9
13067.5 14025.2 13934.2 14050.6
South West N/A N/A N/A N/A
N/A N/A N/A N/A
LSOA Profile Page 9 of 16
Direct-age standardised rate of elective admissions to hospital.
ELECTIVE ADMISSIONS
Average per annum
Area
Q2 - Above Average
LSOA rate
North Devon
Devon
Northern Locality
NEW Devon CCG
England
16,025.4
15,132.3
14,075.1
15,547.8
14,840.9
14,050.6
0 2,000 4,000 6,000 8,000 10,00012,00014,00016,00018,000
E01020116
Q2 - Above Average
North Devon
Devon
NEW Devon CCG
Northern Locality
South West
England
DASR per 100,000
0.0
2000.0
4000.0
6000.0
8000.0
10000.0
12000.0
14000.0
16000.0
18000.0
2008-10 2009-11 2010-12 2011-13
E01020116 Q2 - Above Average North Devon
Devon England

2011 2012 2013
950 839 817
60224.1 51939.6 50547.4
37049.2 36647.5 35386.0
32350.3 31960.8 31181.3
36138.6 35733.5 34579.3
30749.8 30508.1 29557.6
33304.8 33323.6 32388.2
South West N/A N/A N/A
N/A N/A N/A
LSOA Profile Page 10 of 16
A&E ATTENDANCES
Direct-age standardised rate of accident & emergency / MIU attendances.
Area
Average per annum
Q2 - Above Average
LSOA rate
North Devon
Devon
Northern Locality
NEW Devon CCG
England
50,547.4
35,386.0
31,181.3
34,579.3
29,557.6
32,388.2
0 10,000 20,000 30,000 40,000 50,000 60,000
E01020116
Q2 - Above Average
North Devon
Devon
NEW Devon CCG
Northern Locality
South West
England
DASR per 100,000
0.0
10000.0
20000.0
30000.0
40000.0
50000.0
60000.0
70000.0
2011 2012 2013
E01020116 Q2 - Above Average North Devon
Devon England
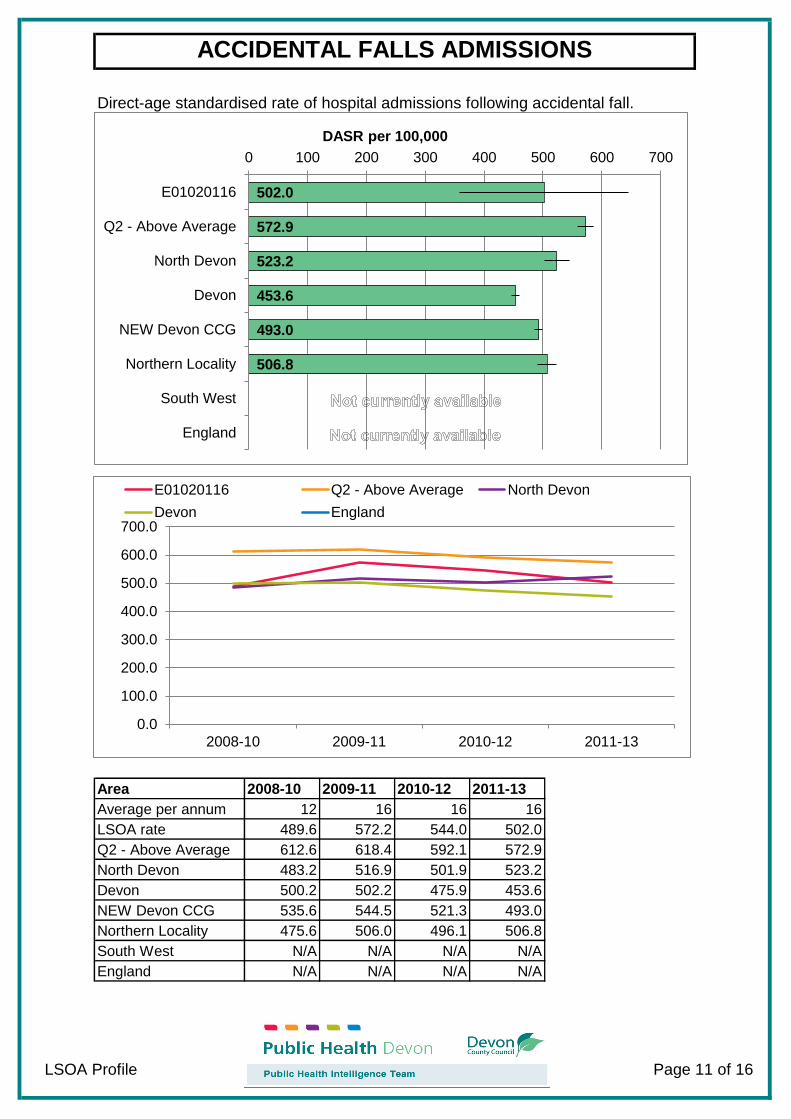
2008-10 2009-11 2010-12 2011-13
12 16 16 16
489.6 572.2 544.0 502.0
612.6 618.4 592.1 572.9
483.2 516.9 501.9 523.2
500.2 502.2 475.9 453.6
535.6 544.5 521.3 493.0
475.6 506.0 496.1 506.8
South West N/A N/A N/A N/A
N/A N/A N/A N/A
LSOA Profile Page 11 of 16
ACCIDENTAL FALLS ADMISSIONS
Direct-age standardised rate of hospital admissions following accidental fall.
Area
Average per annum
Q2 - Above Average
LSOA rate
North Devon
Devon
Northern Locality
NEW Devon CCG
England
502.0
572.9
523.2
453.6
493.0
506.8
0 100 200 300 400 500 600 700
E01020116
Q2 - Above Average
North Devon
Devon
NEW Devon CCG
Northern Locality
South West
England
DASR per 100,000
0.0
100.0
200.0
300.0
400.0
500.0
600.0
700.0
2008-10 2009-11 2010-12 2011-13
E01020116 Q2 - Above Average North Devon
Devon England
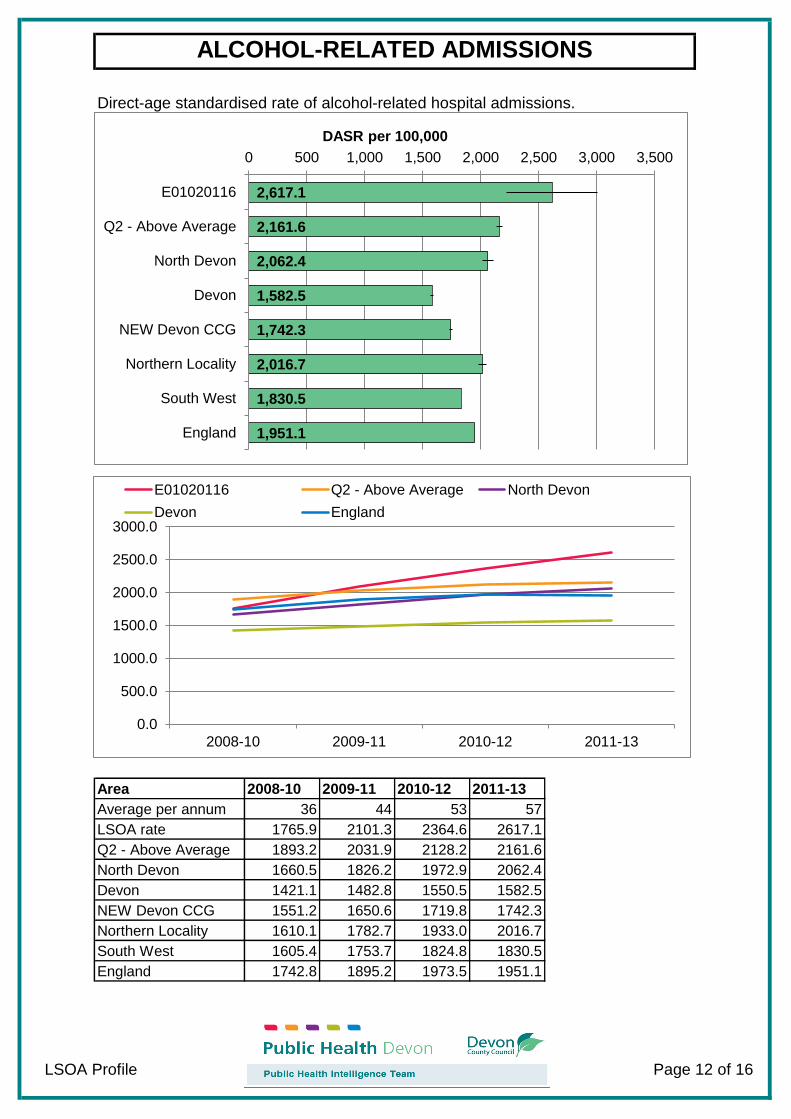
2008-10 2009-11 2010-12 2011-13
36 44 53 57
1765.9 2101.3 2364.6 2617.1
1893.2 2031.9 2128.2 2161.6
1660.5 1826.2 1972.9 2062.4
1421.1 1482.8 1550.5 1582.5
1551.2 1650.6 1719.8 1742.3
1610.1 1782.7 1933.0 2016.7
South West 1605.4 1753.7 1824.8 1830.5
1742.8 1895.2 1973.5 1951.1
LSOA Profile Page 12 of 16
ALCOHOL-RELATED ADMISSIONS
Direct-age standardised rate of alcohol-related hospital admissions.
Area
Average per annum
Q2 - Above Average
LSOA rate
North Devon
Devon
Northern Locality
NEW Devon CCG
England
2,617.1
2,161.6
2,062.4
1,582.5
1,742.3
2,016.7
1,830.5
1,951.1
0 500 1,000 1,500 2,000 2,500 3,000 3,500
E01020116
Q2 - Above Average
North Devon
Devon
NEW Devon CCG
Northern Locality
South West
England
DASR per 100,000
0.0
500.0
1000.0
1500.0
2000.0
2500.0
3000.0
2008-10 2009-11 2010-12 2011-13
E01020116 Q2 - Above Average North Devon
Devon England
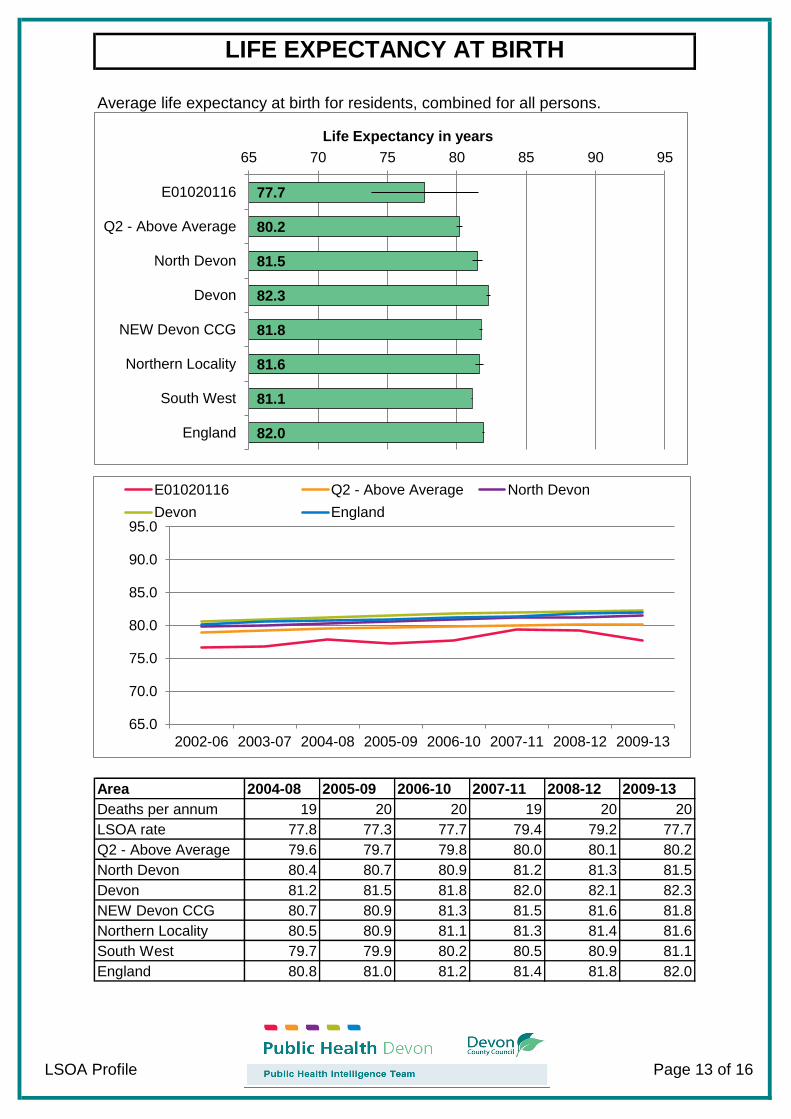
2004-08 2005-09 2006-10 2007-11 2008-12 2009-13
19 20 20 19 20 20
77.8 77.3 77.7 79.4 79.2 77.7
79.6 79.7 79.8 80.0 80.1 80.2
80.4 80.7 80.9 81.2 81.3 81.5
81.2 81.5 81.8 82.0 82.1 82.3
80.7 80.9 81.3 81.5 81.6 81.8
80.5 80.9 81.1 81.3 81.4 81.6
South West 79.7 79.9 80.2 80.5 80.9 81.1
80.8 81.0 81.2 81.4 81.8 82.0
LSOA Profile Page 13 of 16
Average life expectancy at birth for residents, combined for all persons.
LIFE EXPECTANCY AT BIRTH
Area
Deaths per annum
Q2 - Above Average
LSOA rate
North Devon
Devon
NEW Devon CCG
Northern Locality
England
77.7
80.2
81.5
82.3
81.8
81.6
81.1
82.0
65 70 75 80 85 90 95
E01020116
Q2 - Above Average
North Devon
Devon
NEW Devon CCG
Northern Locality
South West
England
Life Expectancy in years
65.0
70.0
75.0
80.0
85.0
90.0
95.0
2002-06 2003-07 2004-08 2005-09 2006-10 2007-11 2008-12 2009-13
E01020116 Q2 - Above Average North Devon
Devon England
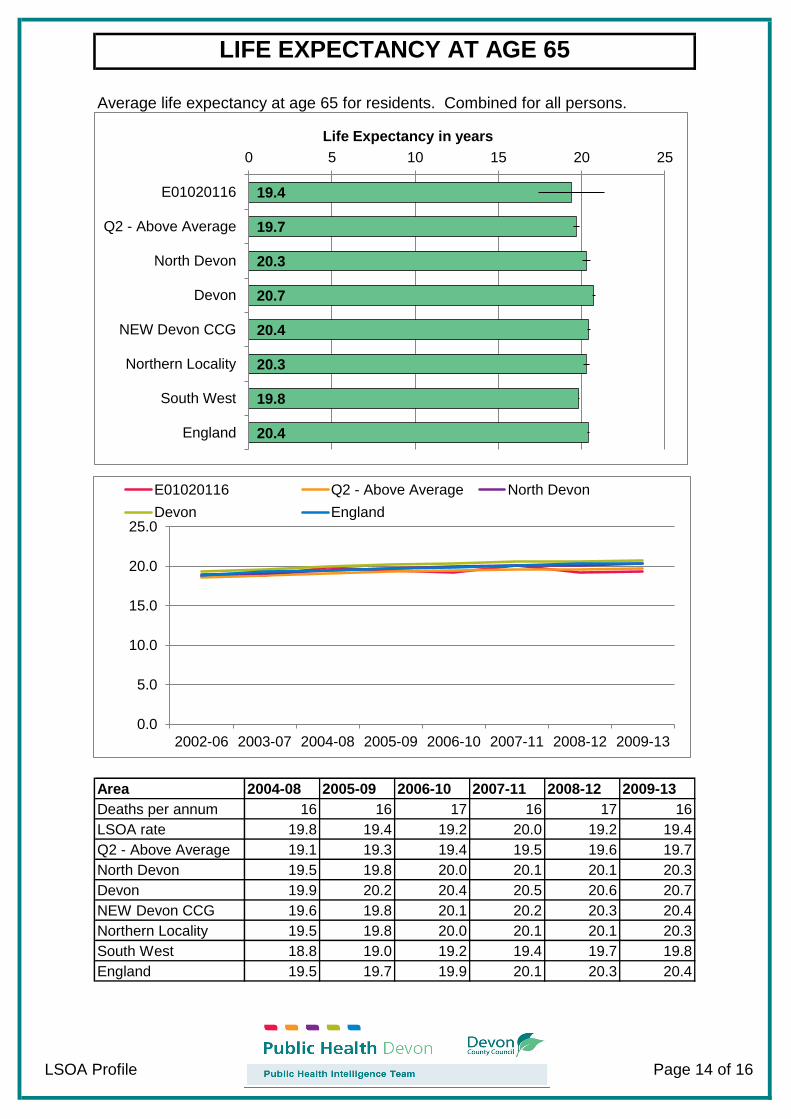
2004-08 2005-09 2006-10 2007-11 2008-12 2009-13
16 16 17 16 17 16
19.8 19.4 19.2 20.0 19.2 19.4
19.1 19.3 19.4 19.5 19.6 19.7
19.5 19.8 20.0 20.1 20.1 20.3
19.9 20.2 20.4 20.5 20.6 20.7
19.6 19.8 20.1 20.2 20.3 20.4
19.5 19.8 20.0 20.1 20.1 20.3
South West 18.8 19.0 19.2 19.4 19.7 19.8
19.5 19.7 19.9 20.1 20.3 20.4
LSOA Profile Page 14 of 16
Average life expectancy at age 65 for residents. Combined for all persons.
LIFE EXPECTANCY AT AGE 65
Area
Deaths per annum
Q2 - Above Average
LSOA rate
North Devon
Devon
NEW Devon CCG
Northern Locality
England
19.4
19.7
20.3
20.7
20.4
20.3
19.8
20.4
0 5 10 15 20 25
E01020116
Q2 - Above Average
North Devon
Devon
NEW Devon CCG
Northern Locality
South West
England
Life Expectancy in years
0.0
5.0
10.0
15.0
20.0
25.0
2002-06 2003-07 2004-08 2005-09 2006-10 2007-11 2008-12 2009-13
E01020116 Q2 - Above Average North Devon
Devon England

2004-08 2005-09 2006-10 2007-11 2008-12 2009-13
17 19 19 18 20 21
63.4 70.4 73.3 68.6 75.7 79.8
55.7 57.8 59.1 60.8 61.9 62.1
59.6 60.2 62.1 64.1 65.4 65.9
53.7 54.6 55.8 57.1 58.2 58.6
54.3 55.4 56.8 58.1 59.1 59.3
58.6 59.5 61.1 63.0 64.4 65.0
South West 58.0 59.6 61.0 60.8 62.3 62.3
61.0 62.7 64.2 64.0 65.5 65.5
LSOA Profile Page 15 of 16
Number of live births per 1,000 females aged 15 to 44.
BIRTH RATE
Births per annum
Area
Q2 - Above Average
LSOA rate
North Devon
Devon
NEW Devon CCG
England
Northern Locality
79.8
62.1
65.9
58.6
59.3
65.0
62.3
65.5
0 20 40 60 80 100 120
E01020116
Q2 - Above Average
North Devon
Devon
NEW Devon CCG
Northern Locality
South West
England
Birth rate per 1000
0.0
10.0
20.0
30.0
40.0
50.0
60.0
70.0
80.0
90.0
2004-08 2005-09 2006-10 2007-11 2008-12 2009-13
E01020116 Q2 - Above Average North Devon
Devon England
Population Annual, 2001 to 2012
Office for National Statistics Mid Year Population Estimates by LSOA.
Index of Multiple Deprivation 2004, 2007 and 2010
English Indices of Deprivation. Rank on overall Index of Multiple Deprivation.
Indices of Deprivation Domains 2004, 2007 and 2010
English Indices of Deprivation. Rank scores across all domains.
Income Deprivation 2004, 2007 and 2010
English Indices of Deprivation. Income Domain Score (% of population).
Employment Deprivation 2004, 2007 and 2010
English Indices of Deprivation. Employment Domain Score (% of population).
Jobseekers Allowance Claimant Rate Annual, 2005 to 2014
Claimant Count from nomisweb.com. Claimant Rate in June of calendar year.
Emergency Admissions Rolling Annual, 2008-10 to 2011-13
Secondary Uses Services. Direct-age standardised rate per 100,000.
Elective Admissions Rolling Annual, 2008-10 to 2011-13
Secondary Uses Services. Direct-age standardised rate per 100,000.
A&E Attendances Annual, 2011 to 2013
Secondary Uses Services. Direct-age standardised rate per 100,000.
Accidental Falls Admissions Rolling Annual, 2008-10 to 2011-13
Secondary Uses Services. Direct-age standardised rate per 100,000.
Alcohol-Related Admissions Rolling Annual, 2008-10 to 2011-13
Secondary Uses Services. Direct-age standardised rate per 100,000.
Life Expectancy at Birth Rolling Annual ,2002-06 to 2009-13
Primary Care Mortality Database and ONS Annual Mortality Extracts.
Life Expectancy at Age 65 Rolling Annual ,2002-06 to 2009-13
Primary Care Mortality Database and ONS Annual Mortality Extracts.
Birth Rate Rolling Annual, 2004-08 to 2009-13
Office for National Statistics Quarterly Births Extracts. Rate per 1,000.
Last updated: January 2015
Queries to: [email protected]
Next update due: June 2015 (2014 admissions and life expectancy)
Produced by the Devon Public Health Intelligence Team
LSOA Profile Page 16 of 16
SOURCES