e-journal usage and scholarly communication using transaction
TRANSCRIPT

- 550 -
E-Journal Usage and Scholarly Communication .. . 7th International CALIBER 2009
E-Journal Usage and Scholarly Communication using Transaction LogAnalysis: A Case Study of E- Journal (Full Text) Download Patterns of NAL
Scientists and Engineers
R Guruprasad Khaiser Nikam M Gopinath Rao Vidyadhar Mudkavi
Abstract
Most scientists today have access to full-text e-journals. In most cases, this facility is provided rightat the desktop. In this paper, we present a case study of full-text e-journal patterns amongst thescientists and engineers at the National Aerospace Laboratories (NAL), a constituent of the Councilof Scientific and Industrial Research (CSIR). The facility at NAL is provided right to the desktopthrough the NAL-CSIR-NISCAIR e-conglomerate. Today, National Institute of Science Communicationand Information Research (NISCAIR) provides e-access to more than 4042 world-class e-journals toall S&T personnel of the CSIR fraternity. This CSIR-NISCAIR initiative allows any scientist in anyCSIR Laboratory to access this electronic information to keep abreast of the latest technologicaldevelopments in his area of specialization.
The analysis of data on the full-text e-journal patterns is presented for the period 2005 to 2007. Themajor findings that we would like to highlight in this paper are: (a) the mean number (per-month) offull-text downloads for the above three years was found to be different through Kruskal Wallis test of‘One Way Analysis of Variance’ at 1% level of significance and (b) Chi-Square test was applied to testwhether there is independence between the years and the publishers. The calculated value of Chi-Square was found to be 510.6, which is highly significant. Hence we conclude that for the full-textdownloads data, the years and the publishers are not independent. This Chi-Square test was carriedout for only those publishers (4 in number) for which the data was available for all the three years(2005-2007).
Keywords: Scholarly Communication, Usage Patterns, Scientific Communication, ElectronicJournals, NAL, CSIR, NISCAIR
1. Science and Scientific Communication.
Science is undergoing some fundamental changes[1]. Much of science is experiencing greaterspecialization, while, on the other hand, some partsof big science is getting even bigger. Also, a greatdeal of research is becoming more multidisciplinary.This has led to collaboration among universities,
government, industry all of which extend acrossnational borders. Science education is becoming notonly multidisciplinary, but also collaboratory, asmore and more faculties teach across disciplines,departments and universities.
Learning is fundamental to science andcommunication is the heart of learning. Garvey [2],a psychologist at the Johns Hopkins University,summed up nearly two decades of scientificcommunication research by saying that
7th International CALIBER-2009,Pondicherry University, Puducherry, February 25-27, 2009
© INFLIBNET Centre, Ahmedabad

- 551 -
7th International CALIBER 2009 E-Journal Usage and Scholarly Communication .. .
“communication is the essence of science”. 14independent studies conducted from 1958 to 1998observed that scientists spend a large, and perhapsincreasing, proportion of their time communicating.Recent studies place this proportion in the range of50 to 60 percent of scientist’s time as spentcommunicating (on average).
Traditional scientific patterns have evolved into amultitude of channels, including data and imagetransmissions, informal discussions, e-mails/messages, laboratory notes and technical reports,conference presentations and proceedings, journalarticles, patents and books, to name a few. Eachchannel providing several distribution means andcan involve a variety of media. All these channels ofdistribution result in a complex pattern of informationflow.
Many studies conducted by the AmericanPsychological Association (APA) for the NationalScience Foundation (NSF), during 1963-1968 andlater in the 70’s led many to believe that electronictechnologies could minimize redundancies andproduce more efficient communication capabilities.
2. Scholarly Journals: Scientific
The first two scientific scholarly journals werebelieved to have started at about the same time, inthe mid 1600s [1]. One was the Le JournaldesScavans, founded by M. de Sallo and the other wasthe Philosophical Transactions, a monthly journalof articles by the Royal Society of London to itsmembers. In fact, Henry Oldenburg produced thefirst issue of a scientific journal, the PhilosophicalTransactions of the Royal Society of London, in1665 [3]. By the end of the 17th century there wereabout 30 to 90 scientific and medical journals
published worldwide and this number rose to about750 by the end of the 18th century. Currently, thereare about 80,000 to 100,000 scholarly journalspublished worldwide.
In an another study Okerson [4] reviewed the historyof electronic journals and discussed a few examplesfrom the early 1990s. She also counted the numberof electronic journals listed in two directories from1991 to 1999. The number of titles grew from 27 in1991, to 3,634 in 1997, and to 8,000 in 1999.
Finally, questions about a journal’s accessibility andreadership can also hinge on the extent to which itallows readers free access to electronic versions.
3. The Electronic Journals
A large proportion of scientific scholarly journalsare now available in electronic media. Most aredigital replicas of traditional journals, with themajority provided in both paper-based and electronicmedia and a few are exclusively electronic journals.Much of the debate on the future of electronicpublishing [3] concentrates on opportunities forreaders, writers, and publishers. The accessibilityof scholarly e-journals, their potentially lowerproduction costs, the possibility of multimediapublication, and reference linking are treated ascompelling features of the electronic medium thatwill enable them to thrive.
4. Information-Seeking and Reading Patterns:Their Trends
Evidence suggests that amount of reading and timespent reading have been relatively stable over thepast 20 years, there have been some changes in theways in which scientists identify the articles theyread and there are appreciable differences in thesources of these articles. Surveys [1] from 1993 to

- 552 -
E-Journal Usage and Scholarly Communication .. . 7th International CALIBER 2009
1998 show that scientists identify articles they readby browsing through journal issues or boundvolumes. 62% of readings are identified in this way,by automated searches accounts for 12 %, by havingother person tell them about the articles amounts to11%, by using citations found in other articles,books etc. adds up to 9%, or by other means suchas current awareness services, printed indexes, andso on fills the remaining 6%. The same studyindicates that during the period 1993 to 1998, thescientists surveyed averaged about 120 readingsof scholarly articles per year. In general, readinghas shifted from personal subscriptions to library-provided journals, due in large part to a decline inthe number of personal subscriptions and to betterlibrary services.
There are a number of factors that influenceinformation-seeking and reading patterns [1].Variation among Scientists’ communication patternsis partially attributable to personal characteristicssuch as one’s discipline, level of education andexperience, and general communication capabilities.There are also situational factors as well, such assize of the organization, level of research funding,amount of funds available for information services,and availability and access to library services.
The authors in an interesting study opine that,scientists read at least one article from an averageof 18 scholarly journals. However, they tend to readonly a few of these journals extensively and mostof them sparsely. For example, across all journalsread by scientists only five percent of them are readmore than 25 times by a scientist (on average) andabout 80 percent are read less than 10 times. Theamount of reading of a journal has a major bearingon whether it should be purchased, depending, of
course, on the price compared with the cost of usingalternative sources of the article. In the past, librarieshave been the principal alternative to purchasingjournals.
So, what do the various trends reflect? Since theirbirth in the 17th century, scientific scholarly journalshave become the most type of publication and, formost fields of science, ‘the most inevitable, and thesingle most important channel of communication’[1]. Over the last 40 years, numerous studies indicatethat journals are extensively read; the informationthey contain is extremely useful for research,teaching and lifelong learning; and the informationis valuable in terms of the favourable outcomes fromits use.
5. Use and Users of Scholarly E-Journals:Transaction Log Analysis (TLA) Approach
Jamali, et al, [5], highlight the advantages andlimitations of the log analysis approach. Eventhough there is a debate about the reliability of theresults of the log analysis, this methodology hasimmense potential for studying online journal’s useand their users’ information seeking behaviour. It isa well understood fact that finding about the usagepatterns of scholarly journals has been importantfor both the librarians and the publishers for a verylong time. Interest of libraries in the use of journalsis two-fold. First, research and academic librariesspend the biggest portion of their acquisitionbudget on serials. Secondly, virtually all academicand research libraries are moving towards electronicaccess to journals. In an environment like this, theusers who have the world of knowledge at theirfingertips are physically disappearing from thelibrarian’s view. Therefore, understanding of the

- 553 -
7th International CALIBER 2009 E-Journal Usage and Scholarly Communication .. .
usage of electronic journals, and the informationseeking behaviour of users is of great importanceboth for libraries and publishers.
Before the advent of online journals [5], most of thestudies on journal usage were based on (a) citationanalysis, (b) re-shelving data or (c) questionnaires.All the three have their own limitations. Citationanalysis does not represent all of journal usage asauthors do not cite all the articles they read, andmoreover, not every journal reader is an “author”.Re-shelving data are not accurate. In this case, it isnot possible to distinguish between the use ofindividual articles or the whole journal. It also doesnot use of personal subscriptions and the type ofuse. Questionnaire based studies rely heavily onwhat people think they do or might do – not whatthey actually do, and this could result inmisinterpretations.
With the widespread use of computer and networktechnologies for facilitating access to scholarlyjournals, a new methodology has emerged forstudying journal usage and scholarly informationseeking behaviour. Computers record or log all usertransactions in a plain text file known as a“transaction log”. Log files contain data about manyof the details of the users’ interaction with thesystem. Hence, some researchers have adopted loganalysis to find out about the use of electronicjournals in terms of both the volume and patternsof use.
5.1. Transaction-Log Analysis MethodologyLooked at in More Detail:
Let us first try to understand as to why the WebServer Transaction Log Analysis Methodologyplays an important role in understanding the E-
Journal full-text download patterns. Web servertransaction log file analysis is a network-basedassessment technique that is particularly usefulwhen performed in conjunction with other ongoingactivities [5]. Generally, the intent of the Web serverlog analysis is multi-purpose. Firstly, one candetermine the overall Web site traffic including thelocation of users, the portions of the site accessed,and the number of document downloads. Second,one can determine the Web site directory trafficincluding the location of users, portions of the siteaccessed, and the number of document downloads(both hits and accesses). Thirdly, one can experimentwith developing new log analysis techniques thatgo beyond domain, hit, and browser counts. Finally,one can assist government agencies to develop,implement, and maintain ongoing log file analysis.
5.2. Transaction Log Analysis Technique:
Web server log analysis technique generallyinvolves a three-fold process that includesdetermining the types of information serveradministrator and decision makers need; developinga program that can parse through, manipulate, andpresent value-added information from the log files;and analyzing the information generated from theprogram. Web servers automatically generate fourdifferent log files: access logs (e.g. hits), agent log(e.g., browser, operating system), error log (e.g.download aborts), and referrer logs (e.g. referringlinks). These files are text files that can range in sizefrom 1 KB to 100 MB, depending upon the traffic ata particular site. Distinction between a hit and anaccess is critical to understanding the type of datacontained in these files. A hit is any file from a website that a user downloads. Download of a Webpage with 6 images on it accounts for 7 hits (6images + 1 text page). An access (or a page hit) is anentire page download regardless of the number of
- 554 -
E-Journal Usage and Scholarly Communication .. . 7th International CALIBER 2009
images, sounds, or movies on the page. Downloadof a web page with 6 images accounts for only oneaccess.
6. Deep Log Analysis Method
Deep Log Analysis overcomes pitfalls of TLA.Nicholas [6, 7, 8] and his colleagues in CIBERconducted a series of studies on Emerald andBlackwell electronic journals in order to evaluatethe impact of the Big Deal on users’ behaviour andgenerally find out digital journal’s users’information seeking behaviour. Based on theexperience gained from investigating consumerhealth logs, they developed a more sophisticatedmethodology called Deep Log Analysis (DLA).Some of the salient features of DLA are:
More attention is paid to the users in theiranalysis and the authors highlighted theimportance of returnees and bouncers(calculating repeat visits of the users to thesame site).
The strength of DLA is due to the followingfeatures:
Use of SPSS (statistical analysis package) toanalyse raw logs instead of proprietary loganalysis software. SPSS provides moreflexibility and enables researchers to definetheir own variables and breakdowns.
Enriching log data with demographic data, suchas user data gathered from the subscription ofpublishers.
Classifying users based through acombination of their demographic attributesand their usage.
Paying special attention to returnees – userswho come back to the use the service.
Three Deep Log Micro Analysis Techniquesare [6]:
The construction of a subgroup of users forwhich researchers can feel confident in regardto their geographical origin;
The analysis of a subgroup of users for whichusers whose IP addresses were more likely toreflect the use of the same individuals; and
The tracking and reporting of the use made byindividuals rather than groups.
Deep Log Analysis methodology eventuallyprovides a bigger, more accurate, and fuller picturethan what is possible with standard surveytechniques and provides some very powerful typesof analyzes not obtainable from the standard loganalyzing software [8].
6.1 Some Findings of Log Based Studies:
Log analysis has been applied for differentpurposes [5] such as assessing system performance,studying user ’s searching and browsingbehaviours, investigating the effectiveness of BigDeal subscriptions, studying literature decay, etc.Digital journal platforms or libraries also have
different features. These factors make it difficult tocompare the results of the different studies andachieve and make generalizations. Nevertheless,there seems to be a considerable degree ofconcentration in the use of journals. According to[9], found that just 20 per cent of titles accountedfor nearly 60 per cent of usage. According to [10],revealed that a small number of heavy users canhave an extremely large effect on the number oftotal downloads. Another study [11], showed that4.9 per cent of a journal collection satisfied 44 percent of downloads and, on the other hand, 59 per

- 555 -
7th International CALIBER 2009 E-Journal Usage and Scholarly Communication .. .
cent of the collection represented only 10 per centof the use of the collection. The effect of log analysislimitations, particularly the problems with cachingand proxy servers, on this asymmetric pattern of useis yet to be investigated. Log studies also indicate arelative preference for PDF versions of articles toHTML versions among users [12, 10, 6].Questionnaire studies confirm this preference andhighlight the fact that most users do not like readingon the screen [13, 14, 15]. This indicates that usersof e-journals probably choose a PDF versionbecause it is more printer friendly and better forarchiving.
Log studies have been particularly helpful inunderstanding the searching and browsing thebehaviour of e-journal’s users. The findings of eJUSTproject showed that there were two major startingpoints for journal web visits, i.e. through journalhome pages and through PubMed. Entering journalweb sites through homepages usually led to eitherbrowsing contents or searching for an article. Moreusers read full text right away instead of readingabstracts first to see if articles were of interest;however, certain journals’ users requested abstractsbefore reading full text. Users tend to read full textafter browsing contents. Either abstracts or full textviews in HTML preceded requests for full text inPDF format. However, three very common seekingpatterns were found:
Journal homepage – TOC – HTML full text –PDF full text;
PubMed – HTML full text – PDF full text; and journal homepge – search – HTML full text –
PDF full text.
The findings showed that most requests were forfull text in HTML, which were then followed byrequesting the full text in PDF, as if the final goal of
most visits was to take away a PDF version of anarticle. Also, the study revealed that librarycatalogues and bibliographic databases, which areboth searching mechanisms, were the top twosources that led users to journals [16].
Although, there has been an ongoing debate on thepitfalls of web log analysis, some of the studiesindicate that there is every opportunity for improvingthe methodology. DLA methods developed byNicholas and his colleagues at CIBER have openeda new horizon in studying e-journal use and users.Several steps can be taken to enrich the log data andso obtain more robust data:
for instance, who is a user, what is a hit, whatrepresents success, etc.) re-align as necessary,and assess statistical significance.
The raw data should be re-engineered toprovide more powerful metrics and to ensurethat data gathering is better aligned toorganizational goals.
Enrich the usage data by adding userdemographic data (e.g. occupation, subject,specialism).
Categorizing the users into smaller groups ratherthan looking at a broad picture of the usage andtracing the usage by some individual users ascase studies help achieve a deeper knowledgeof usage patterns and user’s behaviour.
Finally, to strengthen the results of log analysisand test the findings, some questionnaire,interview or observational studies should beconducted to explain the information seekingbehaviour of the users discovered in the logs.
To sum up, log analysis is clearly useful for certainkinds of analyses, like shedding light on the formatof the articles scientists read (PDF or HTML), the

- 556 -
E-Journal Usage and Scholarly Communication .. . 7th International CALIBER 2009
age of the articles (obsolescence), and the wayscientists navigate to the required material (searchingand browsing behaviour). However, it is not at allhelpful at discovering the value and use of thearticles retrieved, or about what lies behindexpressed information seeking behaviour. So far loganalysis has not been a very efficient technique forfinding out about the differences of informationseeking behaviour among users from differentsubjects, or about the effects of the status of userson their information seeking behaviour. These arethe areas in which log analysis methods must beimproved. The results of log analysis should beenhanced by a triangulation of the findings of studieswith other methodologies (e.g. employing acombination of log analysis, questionnaire surveysand observation studies).
7. National Aerospace Laboratories, Bangaloreand its Scientists.
National Aerospace Laboratories (NAL) [17], aconstituent of the Council of Scientific and IndustrialResearch (CSIR), is India’s pre-eminent civil R&Destablishment in aeronautics and allied disciplines.NAL’s primary objective, as articulated in its newVision Statement, is the “development of aerospacetechnologies with a strong science content and witha view to their practical application to the designand construction of flight vehicles”. NAL is alsorequired “to use its aerospace technology base” forgeneral industrial applications. NAL has a staffstrength of about 1250 with about 400 full-fledgedR&D professionals (over 100 Ph.D.’s). It is thus in aunique position to offer R&D support, expertise andservices to both aerospace and non-aerospacesectors of industry. Scientists at NAL have beenprovided the unique facility of accessing almost 3316international journals from about 11 international
journal publishers by being part of the NAL-CSIR-NISCAIR E-Conglomerate right at their desktops.
8. CSIR, NISCAIR and the E-JournalsConglomerate.
The Council of Scientific & Industrial Research(CSIR) [18]—the premier industrial R&D organizationin India was constituted in 1942 by a resolution ofthe then Central Legislative Assembly. Its Missionis to provide scientific industrial R&D that maximizesthe economic, environmental and societal benefitsfor the people of India. Today it is one of the world’slargest publicly funded R&D Organizations havinglinkages to academia, R&D Organizations andindustry. CSIR’s R&D portfolio embraces areas asdiverse as Aerospace, Biotechnology,Chemicals…indeed, almost the ABC-Z of IndianScience.
The National Institute of Science Communicationand Information Resources (NISCAIR) is one of theconstituent units of CSIR in the area of informationscience [19]. Its mission is to become the primecustodian of all information resources on currentand traditional knowledge systems in science andtechnology in the country, and to promotecommunication in science to diverse constituents atall levels, using the most appropriate technologies.One of the main mandates of NISCAIR is to provideformal linkages of communication among thescientific community in the form of research journalsin different areas of Science and Technology.NISCAIR aims to provide access to more than 4042world-class e-journals to all S&T personnel of theCSIR fraternity from their desktops, through poolingand sharing of resources. Today, NISCAIR has tiedup with 13 popular international publishers. Theobjectives of E-journals Consortia are: (a) tostrengthen the pooling, sharing and electronically

- 557 -
7th International CALIBER 2009 E-Journal Usage and Scholarly Communication .. .
accessing the CSIR library resources, (b) to provideaccess to world S&T literature to CSIR labs, (c) tonucleate the culture of electronic access resultinginto evolution of digital libraries.
Till date CSIR has entered into agreement with 13publishers to access about 4042 internationaljournals across the labs. Details of the e-access isgiven below:
9. Some interesting findings of full-text e-journals download patterns of NAL Scientists fromdata available from NISCAIR Server:
Figure 1: Highlights the number of Scientific Journalsavailable for E-Access through the CSIR-NISCAIRE-Conglomerate.
The maximum number of e-journals for theconglomerate is from Elsevier, followed bySpringer and T & F.
Wiley and Blackwell e-journals are also availablein good number.
Journals from ASME and AIP are the lowest.
There are 12 publishers whose e-journals areavailable for e-access for the conglomerate.
Figure -2: List of CSIR Labs Having Access to thefollowing International Scientific Journal Publishersthrough the CSIR/NISCAIR E-Conglomerate.
There are 42 CSIR labs which have access to 7e-publishers from this conglomerate
41 CSIR labs have e-access to Elsevier and 40labs having access to Taylor and Francis
11 CSIR labs have e-access to ASCE Only 10 CSIR labs have e-access to ASME
Figure -3: NAL Scientists access to additional E-Journals through NAL-ICAST Gateway
NAL scientists have e-access to 1839 e-journalsfrom Elsevier and 1600 e-journals from DOAJand 1312 e-journals from Springer
A moderate number of e-journals for e-accessbelong to Blackwell, Taylor and Francis andWiley
NAL scientists have open access to 700 e-journals through ICAST Gateway
The minimum of e-journals for which e-accessis available is for publishers AIAA and WorldScience.
Number of E-Journals available for E-Access through NAL-NISCAIR-CSIR Conglomerate
Total Number of E-Journals: 40421500
800
600
374 355
12674 69 41 37 30 20 16
0
200
400
600
800
1000
1200
1400
1600
El sevie
rSpr i
nger
T& F
Wi le
yB lac
kwe ll
E mera ld
CUP
OX P
AC S
RSC
ASCE
A SME
AIP
Publisher Name
Num
bero
fJou
rnal
s
Publisher Name
Number of CSIR Labs having access to E-Publishers
through CSIR / NISCAIR Conglomerate
1310
42
12 11
32
22
41
20
42 42 42 42 42 4240
0
5
10
15
20
25
30
35
40
45
ACM
ASME
ACS AIPASCE
Blackw
ellCUP
Elsev
ier
Emerald
IEEEWiley
Nature
OUPRSC
Spring
erT& F
Names of Publisher
No.
ofC
SIR
Labs
Publisher Names
NAL Scientists Access to additional E-Journals through NAL-ICAST Gateway
1839
613530
74
1312
125
865
469 38 30 8 4 20 33 16
700
1600
0
200
400
600
800
1000
1200
1400
1600
1800
2000
Elsevie
rT& F
Wile
yCUP
Spring
er
Emerald
Blackw
ellAIA
AOUP
ACSASCE
SAGE
World
Sc.
ASMERSC AIP
ICAST OADOAJ
Publisher's Name
No.
ofE
-Jou
rnal
s
Names ofPublishers

- 558 -
E-Journal Usage and Scholarly Communication .. . 7th International CALIBER 2009
Table – 1, 2, 3: Highlights the full-text usage statistics of E-Journals by NAL Scientists for the Years 2005,2006, 2007.
Table-1: Year 2005
S.N. Publ. J an Feb Mar Apr May J u n J u l Aug Se p Oc t Nov Dec Total-
Publ. Wise
1 A C S 0 3 4 7 4 1 8 2 2 2 1 5 1 2 3 1 0 2 3 204
2 AIP 0 0 0 0 0 4 7 153 172 417 4 6 1 9 2 6 880
3 ASME 115 5 4 115 5 6 8 3 9 8 5 4 5 3 3 0 4 3 11 325 1037
4 CU P 1 2 1 5 3 1 4 7 1 6 1 2 2 2 2 8 0 6 1 3 184
5 Elsevier 1384 1026 2221 1056 1903 2000 1026 1914 1503 1120 1814 2100 19067
6 R S C 3 2 8 0 1 2 9 8 9 7 7 0 5 7 0
7 Springer 1 9 172 183 128 6 3 7 0 6 9 3 1 6 0 6 1 5 1 3 6 943
8 Wil e y 2 8 6 7 147 158 123 129 144 348 117 133 8 4 153 1631
Total: 1561 1339 2752 1449 2218 2387 1497 2580 2165 1420 1987 2661 24016
(Month Wise
All Publishers)
ACS=American Chemical Society, AIP=American Institute of Physics, ASME= American Society ofMechanical Engineers, CUP=Cambridge University Press, RSC=Royal Society of Chemistry
Year 2005: NAL Full-Text Download Usage Statistics: All Publishers
1% 4% 4%1%
79%
0%4%
7%ACS
AIP
ASME
CUP
Elsevier
RSC
Springer
Wiley
Figure – 4: Year 2005: NAL Full-Text Download Statistics: All Publishers

- 559 -
7th International CALIBER 2009 E-Journal Usage and Scholarly Communication .. .
79% of full-text downloads for the Year 2005 isfrom journals published by Elsevier
Only 7% of full-text downloads for the sameyear is from journals published by Wiley
4% each of full-text downloads are frompublishers Springer, AIP and ASME
Only 1% each of full-text downloads are frompublishers ACS and CUP
Table-2: Year 2006
S.N. Publ. J an Feb Mar Apr May J u n J u l Aug Se p Oc t Nov Dec Total-
Publ. Wise
1 AIP 1 5 2 0 3 6 8 9 104 6 9 246 268 241 136 181 215 1620
2 A C S 1 8 7 3 5 1 2 2 1 0 8 1 9 1 3 4 0 128
3 ASME 0 3 9 6 7 4 0 6 3 5 0 103 6 6 177 8 3 397 112 1197
4 CU P 4 7 6 5 2 8 6 1 2 6 3 7 2 1 1 9 3 6 214
5 Elsevier 3202 3482 1888 2249 2837 1856 1698 2192 1512 2198 1939 2738 27791
6 O U P 0 0 0 0 5 6 1 2 6 3 8 5 3 2 9 0 149
7 R S C 1 1 3 1 0 7 4 3 5 6 1 5 1 6 2 1 9 2
8 Springer 137 100 9 0 9 8 9 8 8 1 6 3 175 314 9 3 313 283 1845
8 T & F 6 194 2 8 1 9 3 4 2 5 1 3 3 4 4 4 2 4 114 5 6 591
9 Wil e y 216 9 1 124 120 210 201 119 161 172 131 237 174 1956
Total: 1561 1339 2752 1449 2218 2387 1497 2580 2165 1420 1987 2661 35583(Month Wise
All Publishers)
ACS=American Chemical Societ, AIP=American Institute of Physics, ASME= American Society of MechanicalEngineers, CUP=Cambridge University Press, RSC=Royal Society of Chemistry,
T & F= Taylor and Francis, OUP=Oxford University Press Year 2006: NAL Full-Text Download Usage Statistics: All Publishers
5%0%
3%
1%
0%
0% 5%2%
5%
79%
AIP ACS
ASME CUP
Elsevier OUP
RSC Springer
T & F Wiley
79% of full-text downloads for the Year 2006 isfrom journals published by Elsevier
5% each of full-text downloads are frompublishers Springer, Wiley and AIP
3% of full-text downloads are from publisherASME
Figure – 5: Year 2006: NAL Full-Text Download
Usage Statistics: All Publishers

- 560 -
E-Journal Usage and Scholarly Communication .. . 7th International CALIBER 2009
Table-3: Year 2007
S.N. Publ. J an Feb March Apr May J u n J uly Aug Se p Oc t Nov Dec Total-Publr.Wise
1 AIP - - - - - - - - - - - - —
2 A C S - - - - - - - - - - - - —
3 ASME - - - - - - - - - - - - —
4 CU P - - - - - - - - - - - - —
5 T & F - - - - - - - - - - - - —
6 Elsevier 4006 3453 5759 5105 4396 4302 4333 5653 4103 4645 3689 3335 52779
7 R S C 4 4 2 4 3 4 5 6 6 2 4 2 4 8 2 4 4 4 9 4 2 6 1 8 516
8 Springer 349 323 268 426 346 409 465 442 410 465 317 395 4615
9 Wil e y 322 322 452 406 786 444 456 418 322 362 406 232 4928
1 0 ASCE 8 6 1 6 2 0 1 8 5 2 2 0 6 1 6 2 0 0 0 182
Total: 4729 4128 6529 6013 5608 5249 5322 6543 4895 5586 4438 3980 63020(Month Wise
All Publishers)
Year 2007: NAL Usage Full-Text Download Statistics: All Publishers
84%
1%
7%
8% 0%
Elsevier RSC
Springer Wiley
ASCE
ACS=American Chemical Societ, AIP=AmericanInstitute of Physics, ASME= American Society ofMechanical Engineers, CUP=Cambridge UniversityPress, RSC=Royal Society of Chemistry, T & F=Taylor and Francis, ASCE=American Society of CivilEngineers. Download statistics of ACS, AIP, ASME,CUP have not been tabulated for 2007 because ofnon-availability of data.
Figure – 6: Year 2007: NAL Usage Full-Text Download
Statistics: All Publishers
84% of full-text downloads for the Year 2007 isfrom journals published by Elsevier
8% of full-text downloads are from the publisherWiley
7% of full-text downloads are from publisherSpringer
Minimum percentage of full-text downloads arefrom the publisher RSC
Download statistics for the followingpublishers, namely, ACS, AIP, ASME and CUPfor the Year 2007 is not available.
Table – 4: Highlights the consolidated monthly totaldownloads, Publisher Wise for the Years 2005,2006, 2007.
Consolidated statistics for ACS, AIP, ASME, CUPhave not been tabulated for 2007 as data is notavailable.
- 561 -
7th International CALIBER 2009 E-Journal Usage and Scholarly Communication .. .
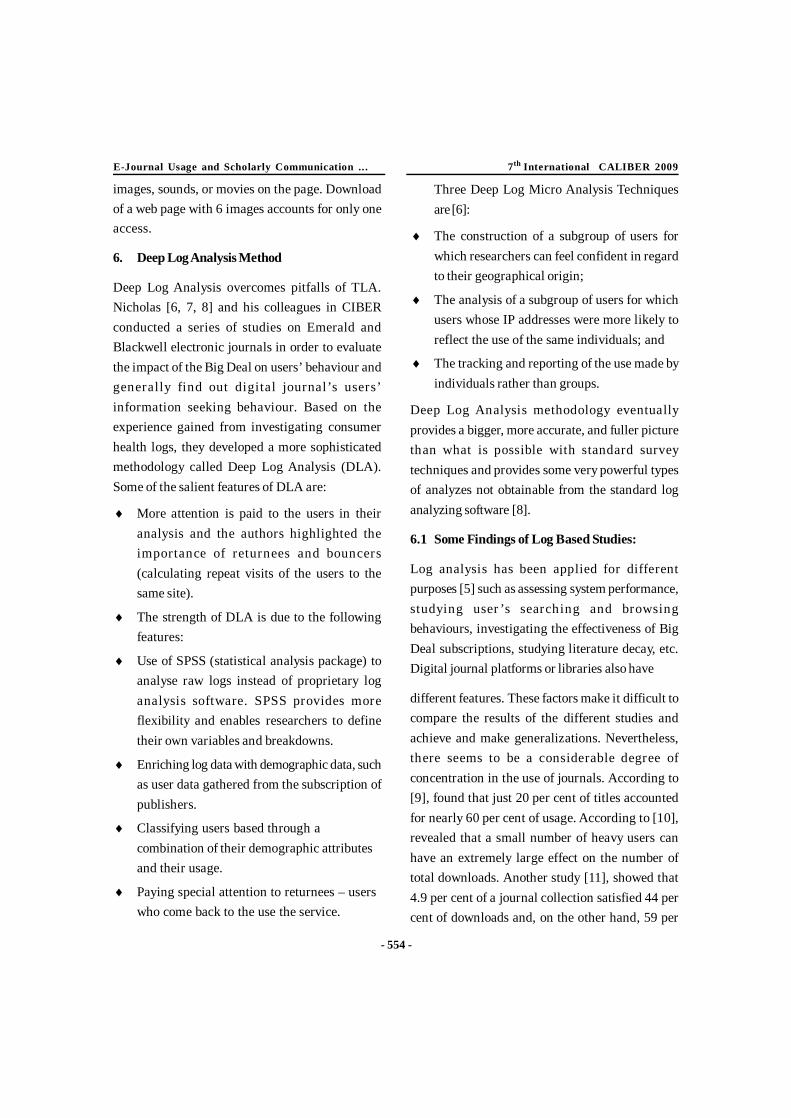
Sl.No. Name of 2005 2006 2007the Publisher
1. A C S 204 128 -
2. AIP 880 1620 -3. ASME 1037 1197 -4. CU P 184 214 -5. Elsevier 19067 27791 527796. R S C 7 0 9 2 5167. Springer 943 1845 4615
8. Wi l e y 1631 1956 49289. ASCE - - 182
10. O U P - 149 -
Chi-Square test was applied to test whetherthere is independence between the years andthe publishers
The calculated value of Chi-Square was foundto be 510.6, which is highly significant.
Hence we conclude that for the full-textdownloads data the years and the publishersare not independent
This Chi-Square test was carried out for onlythose publishers (4 in number) for which thedata was available for all the three years (2005-2007).
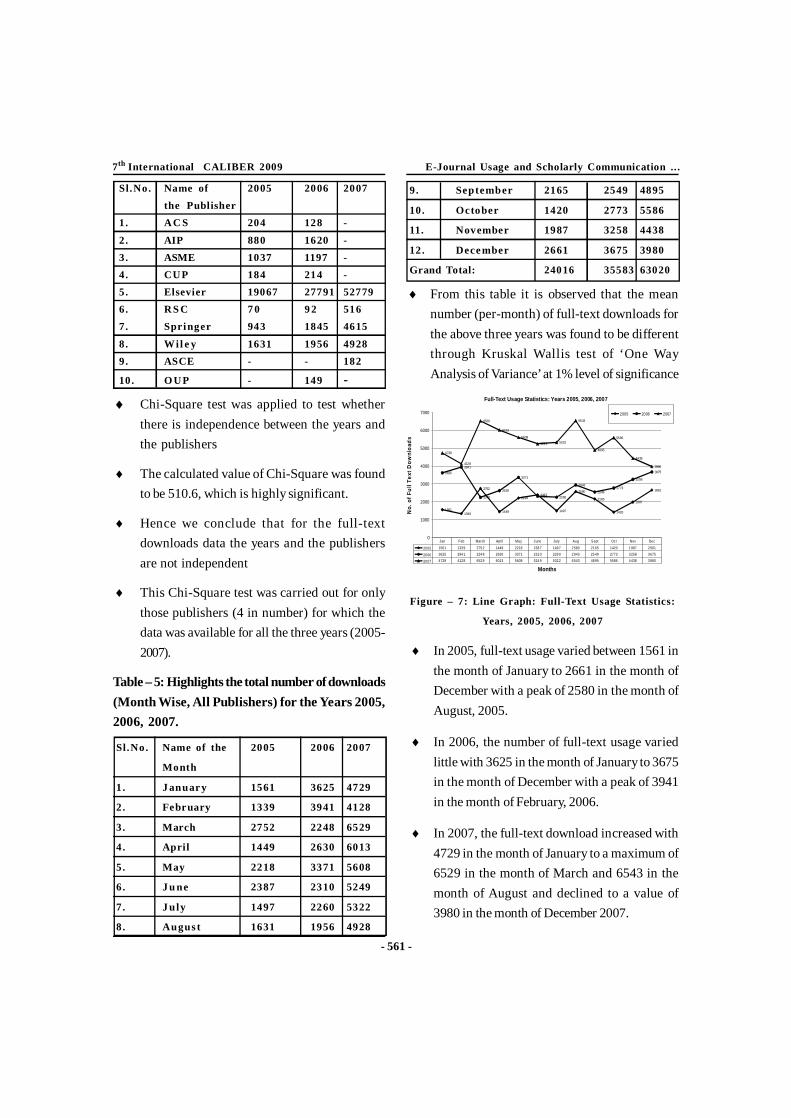
Table – 5: Highlights the total number of downloads(Month Wise, All Publishers) for the Years 2005,2006, 2007.
Sl.No. Name of the 2005 2006 2007
Month
1. J anuar y 1561 3625 4729
2. February 1339 3941 4128
3. March 2752 2248 6529
4. April 1449 2630 6013
5. May 2218 3371 5608
6. J u ne 2387 2310 5249
7. J uly 1497 2260 5322
8. Augus t 1631 1956 4928
9. September 2165 2549 4895
10. October 1420 2773 5586
11. November 1987 3258 4438
12. Dece mber 2661 3675 3980
Grand Total: 24016 35583 63020
From this table it is observed that the meannumber (per-month) of full-text downloads forthe above three years was found to be differentthrough Kruskal Wallis test of ‘One WayAnalysis of Variance’ at 1% level of significance
Figure – 7: Line Graph: Full-Text Usage Statistics:
Years, 2005, 2006, 2007
In 2005, full-text usage varied between 1561 inthe month of January to 2661 in the month ofDecember with a peak of 2580 in the month ofAugust, 2005.
In 2006, the number of full-text usage variedlittle with 3625 in the month of January to 3675in the month of December with a peak of 3941in the month of February, 2006.
In 2007, the full-text download increased with4729 in the month of January to a maximum of6529 in the month of March and 6543 in themonth of August and declined to a value of3980 in the month of December 2007.
Full-Text Usage Statistics: Years 2005, 2006, 2007
15611339
2752
1449
22182387
1497
2580
2165
1420
1987
2661
36253941
2248
2630
3371
2310 2260
2943
25492773
3258
3675
4729
4128
6529
6013
5608
5249 5322
6543
4895
5586
4438
3980
0
1000
2000
3000
4000
5000
6000
7000
Months
No.
ofFu
llTe
xtD
ownl
oads
2005 2006 2007
2005 1561 1339 2752 1449 2218 2387 1497 2580 2165 1420 1987 2661
2006 3625 3941 2248 2630 3371 2310 2260 2943 2549 2773 3258 3675
2007 4729 4128 6529 6013 5608 5249 5322 6543 4895 5586 4438 3980
Jan Feb March April May June July Aug Sept Oct Nov Dec

- 562 -
E-Journal Usage and Scholarly Communication .. . 7th International CALIBER 2009
10. Conclusion
The coming of age of the electronic journals hasaltered the way scholarly information is disseminatedthroughout the world [22]. They have not onlyaffected the way information is spread, but the wayinformation is acquired and how scientificresearchers seek that needed information.
We discuss a ‘new methodology’ [5] that hasemerged for studying journal usage and scholarlyinformation seeking behaviour, popularly called the“transaction log analysis”. Other methodologiesincluding ‘Deep Log Analysis Method’ [6,7,8] arealso discussed.
In this paper, the authors present the analysis ofdata on the full-text e-journal patterns for the period2005 to 2007. The major findings that we would liketo highlight in this paper are:
(a) The mean number (per-month) of full-textdownloads for the above three years was foundto be different through Kruskal Wallis test of‘One Way Analysis of Variance’ at 1% level ofsignificance and
(b) Chi-Square test was applied to test whetherthere is independence between the years andthe publishers. The calculated value of Chi-Square was found to be 510.6, which is highlysignificant. Hence we conclude that for thefull-text downloads data, the years and thepublishers are not independent. This Chi-Square test was carried out for only thosepublishers (4 in number) for which the data wasavailable for all the three years (2005-2007).
11. Acknowledgements
The authors sincerely thank Dr A R Upadhya,Director, NAL for all his overwhelming support, and
according his kind permission to publish this article.Thanks to Dr. Ranjan Moodithaya, Head, KTMDand Dr M N Satyanarayana, Jt. Head, KTMD for alltheir encouragement. We would also like to place onaccord our appreciation to Mr Prakash Chand,Scientist-in-charge NISCAIR/CSIR e-journalconglomerate and his colleagues in providing usrelevant full-text e-journal usage statistics of NALScientists.
References
1. Tenopir, C and King, D W (2000), “TowardsElectronic Journals: Realities for Scientists,Librarians, and Publishers, Psycoloquy: 11(084) electronic journals (1) [Special LibrariesAssociation 2000, xxii+488 pp.
2. Garvey, William D (1979), “Communication:The Essence of Science.” Oxford PergamonPress.
3. Rob Kling, Ewa Callahan (2005), “ElectronicJournals, the Internet, and ScholarlyCommunication”, Indiana University,Bloomington, ARIST, 37(1), pp.127-177.
4. Okerson, A. (2000). Are we there yet? Onlinee-resources ten years after. Library, Dends,48,671-694.
5. Hamid R. Jamali, David Nicholas and PaulHuntington (2005), “The use and users ofscholarly e-journals: a review of log analysisstudies”, CIBER, School of Library, Archiveand Information Studies, University College,London, London, UK, ASLIB Proceedings:New Information Perspectives, 57(6).
6. Nicholas, D., Huttington, P. and Watkinson,A. (2003), “Digital journals, Big Deals and Online

- 563 -
7th International CALIBER 2009 E-Journal Usage and Scholarly Communication .. .
searching behaviour: a pilot study”, ASLIBProceedings, 55(1/2), pp. 84-109.
7. Nicholas, D., Huntington, P. and Watkinson, A(2005). “Scholarly journal usage: the results ofdeep log analysis”, Journal of Documentation,61(2), pp.246-80.
8. Nicholas, D., Huttington, P., Watkinson, A. andJamali, H. R. (2005), “The use of digitalscholarly journals and their information seekingbehaviour: what deep log analysis and usagedata can disclose”, Journal of the AmericanSociety for Information Science andTechnology, 56(12).
9. Morse, D. H. and Clintworth, W. A. (2000),“Comparing patterns of print and electronicjournal use in an academic health sciencelibrary”, Issues in Science and TechnologyLibrariananship, Vol.28, availableat:www.istl.org/00-fall/refereed.html.
10. Davis, P. and Solla, L. (2003), “An IP-levelanalysis of usage statistics for electronicjournals in chemistry: making inferences aboutuser behaviour”, Journal of the AmericanSociety for Information Science andTechnology, 54(11), pp. 1062-8.
11. Davis, P.M. (2002), “Patterns in electronicjournal usage: challenging the composition ofgeographic consortia”, College and ResearchLibraries, 63(6), pp. 484-97.
12. Ke, H., Kwakkelaar, R., Tai, Y. and Chen, L.(2002), “Exploring behaviour of e-journal usersin science and technology: transaction loganalysis of Elsever’s ScienceDirect OnSite inTaiwan”, Library and Information ScienceResearch, 24(3), pp. 265-91.
13. Tenopir, C. (2003), “Use and users of electroniclibrary resources: an overview and analysis ofrecent research studies”, Report for the Councilon Library and Information Resources, August2003, available at:www.clir.org/pubs/reports/pub120/pub120.pdf (accessed 20 March 2005).
14. Tenner, E. and Zheng Ye, Y. (1999), “End-useracceptance of electronic journals: a case studyfrom a major academic research library”,Technical Services Quarterly, 17(2), pp. 1-14.
15. Worlock, K. (2002), “Electronic journals: userrealities – the truth about content usage amongthe STM community”, Learned Publishing,15(3), pp. 223-6.
16. Davis, P.M. (2004), “For electronic journals, totaldownload can predict number of users”, Portal:Libraries and the Academy, 4(3), pp. 379-92.
17. National Aerospace Laboratories ,www.nal.res.in
18. www.csir.res.in
19. www.niscair.res.in
20. Kling, R., & McKim, G. (1997). A typology forelectronic journals: Characterizing scholarlyjournals by their distribution forms, (WorkingPaper No.WP-97-07), Indiana University,Bloomington, Center for Social Informatics.Retrieved, November 16,2001, from http://www.slis.indiana.eddcsi/wp97-07.html
21. Kessler, M. M. (1967), “Some very generaldesign considerations”. In TP system report,Appendix H. Cambridge: MassachusettsInstitute of Technology.
22. Amy C Gleeson (2001), “Information seekingbehaviour of scientists and their adaptation to

- 564 -
E-Journal Usage and Scholarly Communication .. . 7th International CALIBER 2009
electronic journals”, Masters paper for the M.S.in Library Science degree, School ofInformation and Library Science, University ofNorth Carolina, Chapel Hill.
About Authors
Mr. R Guruprasad, Research Scholar, DOS, LIS,University, Mysore and Scientist, Knowledge andTechnology Management Division (KTMD),National Aerospace Laboratories, Bangalore – 560 017.Email: [email protected]
Dr. Khaiser Nikam, Research Guide andChairperson, DOS, LIS, University of Mysore – 570 006E-mail: [email protected]
Dr. M Gopinath Rao, Professor of Statistics,College of Agriculture, University of AgriculturalSciences, Bangalore.E-mail: [email protected]
Dr. Vidyadhar Y Mudkavi, Head, Computational andTheoretical Fluid Dynamics Division (CTFD),National Aerospace Laboratories, Bangalore.E-mail: [email protected]