dynamics of marriage and infertility in south africa-text
TRANSCRIPT
1
Paper prepared for the UAPS 2015 conference, Johannesburg
Session101: Fertility Transitions in Africa: Issues and Consequences
Dynamics of marriage and infertility in South Africa
An analysis of census data
Michel Garenne (1,2,3)
1) Institut de Recherche pour le Développement (IRD), UMI Résiliences, Bondy, France
2) MRC/Wits Rural Public Health and Health Transitions Research Unit, School of Public
Health, Faculty of Health Sciences, University of the Witwatersrand, Johannesburg
3) Institut Pasteur, Epidémiologie des Maladies Emergentes, Paris, France
Updated: October 27, 2015
Contact: [email protected]
Word count: Total = 6954 words
Paper: 5900; Abstract: 191
Keywords: 12; References: 41
Tables 4; Figures: 12

2
Abstract
The study presents an analysis of long-term trends in terminal celibacy and primary infertility in South Africa. Sources of data were four population censuses conducted in 1996, 2001, 2007 and 2011, which cover cohorts of women born between 1900 and 1971 (women age 40 years and above at time of census). Terminal celibacy was defined as not being married, widowed or divorced at time of census. Primary infertility was defined as not having had any live birth at time of census. Results show complex dynamics of both infertility and celibacy. Infertility first declined for cohorts born before 1940 then increased. Celibacy first declined for cohorts born before 1920, then increased. All dynamics varied by population group, by ethnic group, by area of residence, by province of residence, and by level of education. A multivariate analysis indicated that being never-married was the most important factor of infertility, explaining about half of cases. Dynamics of marriage and infertility are discussed in light of the complex population history of the country in the 20th century. Cultural factors appear critical for explaining levels and trends of celibacy and infertility, far above any socio-economic factor.
Key Words: Infertility; Childlessness; Marriage; Common-law union; Celibacy; Population group (race); Ethnicity; Cultural factors; Socio-economic factors; Longitudinal analysis; South Africa; IPUMS.

3
Introduction
Childlessness, the fact for a woman of not having had a live birth at the end of her reproductive period, has two components: a biological component (sterility despite exposure to sexual intercourse, called ‘involuntary infertility’), and a behavioral component (lack of exposure to the risk of pregnancy, called ‘voluntary infertility’). The biological factors of sterility are numerous and have been studied extensively for a long time. They include physiological factors (from women, men or couple), as well as environmental factors, in particular infectious and parasitic diseases. [McFalls & McFalls 1984; Retel-Laurentin 1978; Westrom 1994] Sub-Saharan Africa is a continent where pockets of high prevalence of sterility were documented in the first part of the 20th century. [Barlovatz 1955; Belsey 1977; Frank 1983, 1987; Guest 1978; Leke et al. 1993; Retel-Laurentin 1974; Roberts & Tanner 1959; Romaniuk 1967, 1968] These pockets seem to have largely receded in the recent years, due to prevention and treatment of infectious and parasitic diseases, in particular sexually transmitted infections. Recent demographic studies show now moderate levels of sterility in Africa, comparable to levels found in Europe or North America. [Boivin et al. 2007; Ericksen & Brunette 1996; Gerais & Rushwan 1992 ; Larsen & Menken 1991; Larsen 2000 ; Mascarenhas et al. 2012 ; Pantazis & Clark 2013; Rutstein & Shah 2004; Sciarra 1994]. However, emerging diseases such as HIV/AIDS, and possibly induced abortion among adolescents, could lead to an increase in sterility. [Basu et al. 2010, Van der Spuy 2009]
In contrast, voluntary infertility has been little studied in sub-Saharan Africa. Childlessness at age 50 for reasons other than biological sterility could be due to lack of sexual intercourse (in particular associated with lack of marriage or consensual union), or to efficient contraception (hormonal, barrier methods, sterilization, induced abortion, etc.) among women who do not want children. These aspects of voluntary infertility received little attention in Africa, because it was often taken for granted that all women were married or in union, that few were using efficient contraception, and that the leading public health and social problem was sterility [Dyer et al. 2002; Gerrits 1997]. This is however no longer the case in the most advanced African countries: marriage patterns have been changing rapidly, and modern contraceptive methods became widely available in the past 50 years, say since 1960. Changing marriage patterns were associated with urbanization, with rising level of education and increasing income, and have a cultural dimension, with different ethnic groups reacting differently to socio-economic change. [Garenne 2004; 2014] Modern contraceptive methods became widely available since the 1960’s, but at different times in the various countries, depending on local population policies. Note that similar changes in marriage and contraception occurred also at about the same time in Europe, North America and elsewhere in the world. [Sobotka & Toulemon 2008]
The aim of this study was to investigate trends in primary infertility (childlessness) in South Africa, a country where social change, political change, and economic development were dramatic in the past half century. In addition, modern contraception became available at about the same time as in Europe, the country embarked into an ambitious and successful

4
family planning in 1974, covering the whole country, and a recent legislation made induced abortion legal in 1997. [Chimere-Dan 1993; Choice on Termination of Pregnancy Act, 1996/92] Trends in infertility will be studied in relation with trends in nuptiality, as the country underwent dramatic changes in marriage patterns. The racial and ethnic composition of South Africa is also unique, which permits detailed analysis of different dynamics and cultural factors of both marriage and infertility. The focus of this study is on long term trends, aiming at covering a large chunk of the 20th century, thanks to the availability of population census microdata in the Stats-SA and the IPUMS databases. [See Stats-SA and IPUMS web sites]
Data and Method
For this study, classic definitions of infertility and celibacy were adapted to the case of South African censuses. All data presented in this study refer to fertility status and marital status of women age 40 and above at time of census. This was done in order to make full use of the census data, and considering that first birth and first marriage are rare events after age 40.
Concepts and Case definitions
“Primary infertility” (childlessness) was defined as being childless by age 40 and above. Prevalence of primary infertility was therefore calculated as the proportion of women with no live birth among women who responded to the question on children ever-born (range 0-29 children) in the census. This definition is equivalent to what is called “Total infertility” in the Multilingual Demographic Dictionary. [IUSSP, 1982] This definition differs therefore from infertility used by other authors, who either control for exposure within union, or who use a medical definition closer to what demographers consider “sterility” or “infecundity”.
“Terminal celibacy” was defined as being either never-married (single) or currently in common-law union at time of census. It is opposed to being currently married (civil law, religiously or traditionally), or being widowed, divorced or separated after a previous marriage. Merging “common-law” with “never-married” will be justified below for the case of South-Africa. In brief, in the recent years the prevalence of infertility among women in common-law union above age 40 was closer to that of women who were never-married than to that of women who were previously married (currently married, widowed, or divorced). This definition was chosen because there is no detailed information on age at first marriage in most censuses (ideally one would like to know whether the woman had ever been married, and if yes, the age at first marriage, and the type of marriage: civil, religious or traditional). Note that several authors working on marriage in South Africa have adopted a similar
5
definition. [Hosegood et al. 2009; Udjo 2001] The concept of “terminal celibacy” used in this study therefore covers several realities: never-married women living alone, never-married women living with someone after age 40, as well as some ever-married women who became divorced or widowed and who are living with someone at time of census. There was unfortunately no way to properly isolate never-married women in the census data. In any case, since the study focuses on trends, the case definition matters less, as long as it is consistent across censuses.
Census Data
Four censuses conducted in 1996, 2001, 2007 and 2011 in South Africa were considered for this study. Individual data for these censuses are available in open access on the IPUMS web site (harmonized and original) as well as on the Stat-SA web site. Note that the 2007 census, called the “2007 community survey”, is a sample census in the field and not a full scale census. In any case, only samples were available for the other three censuses as well. The 1996 census included data on children ever-born for all women above age 40, which allow one to study infertility for cohorts born since 1900, whereas the other three cover only the 40-50 age group, which is enough to monitor trends up to the 1971 cohorts. For both primary infertility and terminal celibacy, the four censuses were compatible in levels and trends, allowing to merge them for final analysis. This provided a large sample, close to one million women, and therefore permitted a detailed analysis by a variety of socio-demographic characteristics. (Table 1)
Table 1: Characteristics of the four South-African censuses
Census year 1996 2001 2007 2011 Age group 40-96 40-50 40-50 40-50 Cohorts 1900-1956 1951-1961 1957-1967 1961-1971 Nb of women 420,284 225,855 66,746 263,385 % celibate 16.6% 28.8% 34.0% 37.7% % infertile 6.8% 7.4% 9.8% 8.9%
Selection of variables
Cases selected for the final analysis were women age 40 and above, born from 1900 to 1971, with information on children ever-born (ranging from 0 to 29), with stated marital status at time of census, For multivariate analysis further selection was made on women with known area of residence (urban/rural), and with known level of education. The South African censuses distinguish four population groups (Black/African, Coloured, Indian/Asian, and White/European). For each group, the main language spoken at home allows to further

6
identify ethnicity. For all four groups, one could separate those speaking Afrikaans, English or other languages. For the Black/African group, nine languages are characteristic of nine main ethnic groups: Zulu, Xhosa, Pedi, Tswana, Sotho, Tsonga (Shangaan), Swazi, Venda, and Ndebele. For the Indian/Asian, the other languages were lumped together, and include primarily languages from India (Hindi, Urdu, Gujarati, Tamil, etc.). For the White/European, the other languages were also lumped together and include primarily languages from Europe (Dutch, French, German, Greek, Italian, etc.). Lastly, the nine provinces of residence were also considered as defined in the census, even though their borders varied somewhat over the years, especially the border between Limpopo and Mpumalanga.
Framework for analysis
The analysis of infertility focused on the role of marriage, which is the main indicator of exposure to the risk of pregnancy. In particular, women who had a record of previous marriage (whether currently married, widowed, divorced or separated) were opposed to those who did not (whether never-married, or currently living with someone). This is not a perfect comparison, but this was the only available in the census. Possible reverse causality (the fact that biological sterility could either induce divorce or prevent marriage) is dealt with in the discussion. Both infertility and celibacy were then contrasted by various socio-demographic characteristics: urban residence, province, level of education, population group, and ethnicity. Much attention was devoted to populations groups because of their different dynamics for both infertility and celibacy.
Methods
The four censuses were combined together for the final analysis, because they were found to be compatible in levels and trends or infertility and celibacy. Both univariate and multivariate analyses were conducted. Multivariate analysis of infertility and celibacy was conducted with a simple Linear-Logistic model, using the SPSS software. Most statistical tests were highly significant, with P values usually well below 5%, and often below 10−6 because of the large size of the combined dataset.
Results
This section presents the analysis of long-term trends in primary infertility and terminal celibacy among women age 40 and above, by main socio-demographic characteristics.

7
2.1 Long-term trends in infertility and celibacy
In the South African censuses, the prevalence of primary infertility among women age 40-49 was relatively high: 7.3% on the average. This level was just above the average (7.1%) of the 19 African countries for which data were available in the IPUMS database. Among these countries, 7 had a higher prevalence of infertility than South Africa (range= 7.3% to 21.4%), the record high being Southern-Sudan 2008, while 9 had lower levels (range 2.0% to 6.3%), the record low being Rwanda 1991. Even though some of the censuses had obvious problems (such as the outstanding level of infertility in the Zambia 1990 census), the case of South Africa does not appear as outstanding when compared with other African countries.
The prevalence of infertility underwent major changes over the years in South Africa, within a range from 6% to 10%. Infertility first declined for cohorts born between 1900 (10.5%) and 1940 (6.4%), then increased almost as fast for cohorts born between 1940 and 1971, reaching a high value of 9.7%, almost as high as that of women born at the beginning of the 20th century. Data points by 5-year cohorts were remarkably consistent, and could be fitted with a polynomial. (Figure 1a)
In contrast, the prevalence of terminal celibacy (defined as either never-married or in common-law union at age 40-49) was outstandingly high in South Africa, with an average of 27.7% and a record high of 34.2% in 2007. These levels are well above any of the 19 African countries available in the IPUMS database, which average 7.4% (range 1.2% to 19.4%). Other cases of high prevalence of terminal celibacy were Rwanda 2002 (19.4%), Liberia 2008 (18.9%) and Cameroon 2005 (16.5%). On the other side of the spectrum are countries with low values, such as Zambia 2000 (3.0%), Guinea 1996 (3.1%), and Kenya 1979 (3.7%). The range of variation of terminal celibacy in Africa, in a ratio of 11 to 1 is simply outstanding, and deserves more attention from demographers. Some of the censuses do not have information on consensual unions, and are therefore difficult to compare with others. Even when restricted to ‘never-married women’, South Africa appears as outstanding, with a high prevalence of 10.4% in 2007, compared with the average of 5.6% among the 50 African censuses available in the IPUMS data base. Some 60% of the censuses had a proportion of never-married women at age 40-49 below 5%. The only country with a proportion of never-married women exceeding 7% was Rwanda, a country deeply disturbed by civil war in recent years.
Trends in terminal celibacy were very marked in South Africa. For cohorts born between 1900 and 1930, the prevalence of celibacy oscillated around 10%, first declining from 12.5% (1900-04) to 8.2% (1920-24), then increasing. The increase became faster after the 1940-44 cohorts (16.1%), reaching a high level of 43.4% at the last point available (1970-71). This dramatic increase seems unique in sub-Saharan Africa, especially when compared with countries without civil wars. As was the case for primary infertility, cohort estimates were very consistent, and trends could be fitted with a polynomial. (Figure 1b)

8
Figure 1: Trends in primary infertility and terminal celibacy, South Africa
2.2 Trends in infertility by marital status
Prevalence of infertility varied considerably by marital status. For the never-married, the proportion of infertile women declined steadily over the years from a high 32.5% among women born in 1900-1914 to 14.3% among those born in 1960-1971. For women in common-law unions, it was lower and more stable, ranging from 13.7% to 10.5%. For divorced and separated women, it varied from 12.8 to 7.6%. For married and widowed women, the prevalence was much lower: it accounted for 6.5% and 7.0% respectively for women born in 1900-1914, and remained low over the years, with a prevalence of 5.9% and 4.9% respectively for women born in 1960-1971. These values for the last two categories (married and widowed) give an approximate measure of couple sterility around 5.5%, with some minor variations ±1% over the years. It appears therefore that marital status played a major role in primary infertility in South Africa, and with complex interactions with trends. (Figure 2)
Figure 2: Trends in primary infertility by marital status, South Africa
2.3 Trends in primary infertility and terminal celibacy, by population group
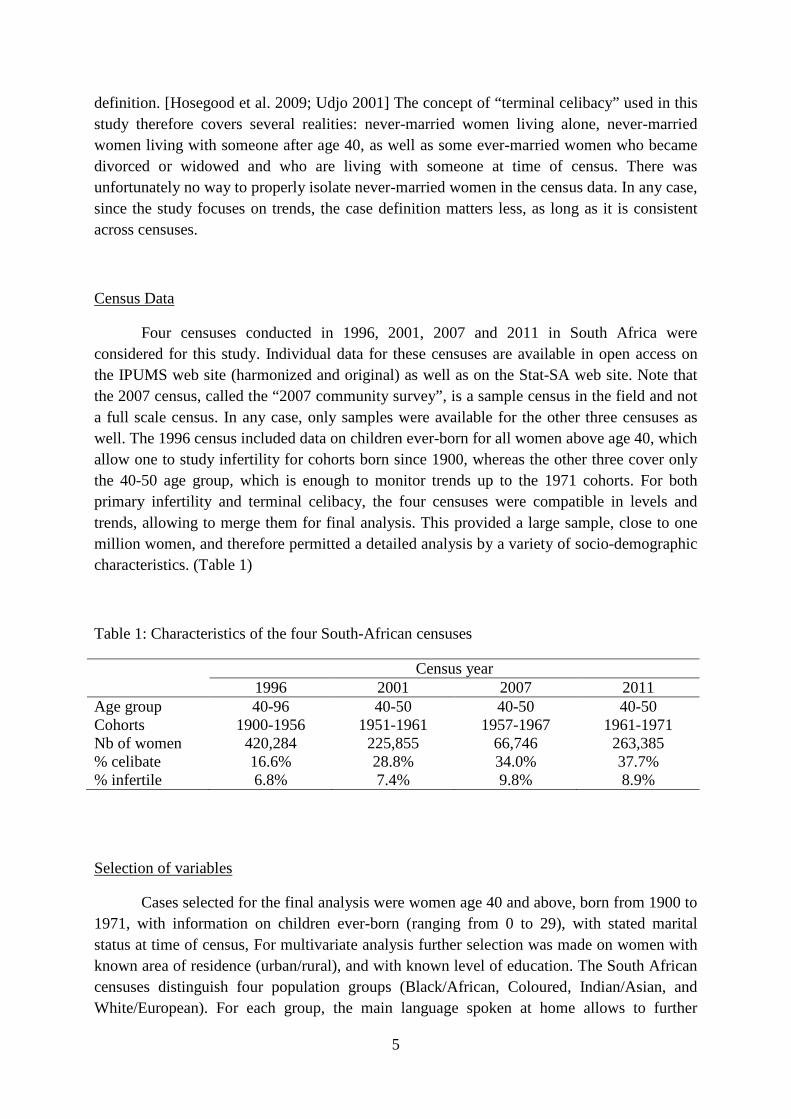
The dynamics of infertility and celibacy were remarkably different by population group, and differed notably among each other. For the Black/African group, infertility was
9
lower than for the other groups, and followed the same ups and downs: it declined from 8.5% for women born in 1900-1909 to 5.4% for women born in 1940-1949, and increased again to 8.6% for women born in 1970-1971. In contrast, celibacy was highest for Black/Africans, was somewhat declining for the earlier cohorts 1900-1929, then rose steeply to reach an outstanding high of 50.2% for women born in 1970-1971. For the Coloured group, infertility was high for the earlier cohorts (14.0% in 1900-1909), also declined first (7.0% in 1940-1949), to increase again to 8.6% in 1970-1971. As for the Black/African group, celibacy was high and first declined, then increased dramatically, but somewhat less than for the former group, reaching 34.7% in 1970-1971. The other two groups were more similar, and had somewhat different dynamics, more pronounced for infertility and less pronounced for celibacy. Both Indian/Asian and White/European groups had high levels of infertility at the turn of the 20th century (12.7% and 13.2% respectively), which declined over the years, reaching 8.6% and 8.8% respectively in 1940-1949, before rising again to high values of 14.5% and 16.2% in 1970-1971. In contrast, the dynamics of celibacy were much milder and at much lower values: starting from a moderate level of 6.1% and 5.8% in 1900-1909, reaching a low value in 1920-1929 (4.8% and 3.6% respectively), the prevalence of celibacy increased, but much less than for the other two groups, reaching 11.2% and 15.1% respectively in 1970-1971. These results indicate that the dynamics of celibacy and infertility have different rationales for each population group: the groups that had the largest increase in celibacy had the lowest increase in infertility, and reciprocally those who had the lowest increase in celibacy had the largest increase in infertility. This finding indicates strong behavioral factors, varying very much within the social structure. (Figure 3)
Figure 3: Trends in infertility and celibacy, by population group
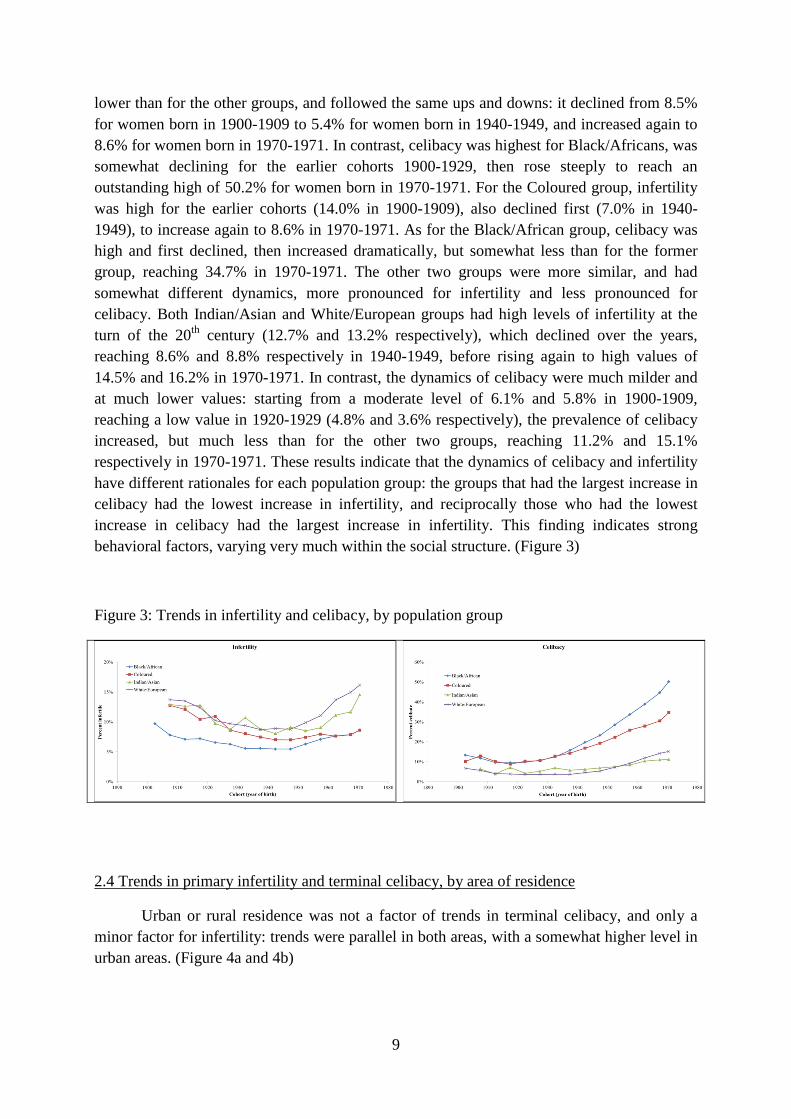
2.4 Trends in primary infertility and terminal celibacy, by area of residence
Urban or rural residence was not a factor of trends in terminal celibacy, and only a minor factor for infertility: trends were parallel in both areas, with a somewhat higher level in urban areas. (Figure 4a and 4b)
10
Figure 4: Trends in infertility and celibacy, by area of residence
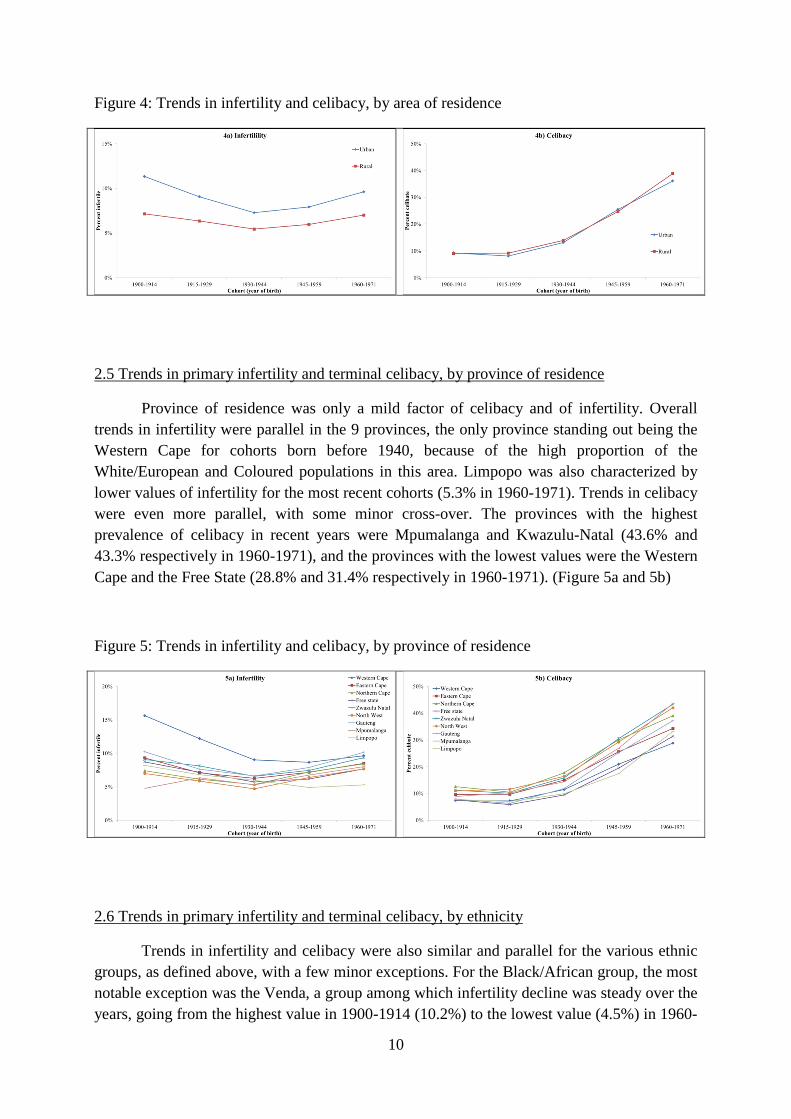
2.5 Trends in primary infertility and terminal celibacy, by province of residence
Province of residence was only a mild factor of celibacy and of infertility. Overall trends in infertility were parallel in the 9 provinces, the only province standing out being the Western Cape for cohorts born before 1940, because of the high proportion of the White/European and Coloured populations in this area. Limpopo was also characterized by lower values of infertility for the most recent cohorts (5.3% in 1960-1971). Trends in celibacy were even more parallel, with some minor cross-over. The provinces with the highest prevalence of celibacy in recent years were Mpumalanga and Kwazulu-Natal (43.6% and 43.3% respectively in 1960-1971), and the provinces with the lowest values were the Western Cape and the Free State (28.8% and 31.4% respectively in 1960-1971). (Figure 5a and 5b)
Figure 5: Trends in infertility and celibacy, by province of residence
2.6 Trends in primary infertility and terminal celibacy, by ethnicity
Trends in infertility and celibacy were also similar and parallel for the various ethnic groups, as defined above, with a few minor exceptions. For the Black/African group, the most notable exception was the Venda, a group among which infertility decline was steady over the years, going from the highest value in 1900-1914 (10.2%) to the lowest value (4.5%) in 1960-

11
1971 among the various groups. The fastest increase was noted among the Ndebele, from 4.8% to 9.3% during the same period, a path almost opposite to that of the Venda. For terminal celibacy, trends were overall parallel, the only exception being the group speaking European languages for the last cohort (1960-71), for whom the increase was less pronounced than for the other groups. The record high was for the Zulu and the Swazi, who reached outstanding values for cohorts born in 1960-1971 (50.0 and 53.1% respectively). (Figure 6a and 6b)
Figure 6: Trends in infertility and celibacy, by ethno-linguistic groups
For the White/European groups, trends were also roughly parallel. The group speaking English at home had higher levels of infertility and celibacy than the group speaking Afrikaans. The group speaking other languages (Dutch, French, German, Italian, Greek, etc.) was in between the two other groups for infertility, but tended to have a faster increase in celibacy for cohorts born after 1940. (Figure 6c and 6d)
2.7 Trends in primary infertility and terminal celibacy, by level of education
The effects of level of education were marked, but trends were overall parallel, both for infertility and for celibacy. There were hardly any difference in levels and trends between the three lowest levels: “none”, “some” and “primary” education. Women who had a secondary or higher level had higher levels of infertility and lower levels of celibacy. For the most recent cohorts, the highest levels of infertility (12.2 %) and the lowest levels of celibacy (22.1 %) were reached by women with higher education, showing one more time the different dynamics between the two variables. (Figure 7a and 7b)

12
Figure 7: Trends in infertility and celibacy, by level of education
3. Multivariate analysis
Since the dynamics of infertility and celibacy were complex, cohorts born before 1940 (declining infertility, stable celibacy) and born after 1940 (increasing infertility, increasing celibacy) were studied separately. Also, since the four ethnic groups had different behaviors, they were also studied separately.
3.1 Factors of infertility
Results of the multivariate analysis confirmed previous findings. For the 1900-1940 cohorts, the time trend was negative for all population groups, with a reduction in level of infertility ranging from 40% to 60% over a 30-year period. Celibacy appeared as a critical factor for Indian/Asian and White/European (RR= 59.9 and 26.3 respectively), and an important factor for Black/African and Coloured (RR= 3.9 and 6.6 respectively). In terms of attributable risks, the regression model indicates that about half of infertility was explained by celibacy for cohorts born after 1940 (47.1%, for Black/African, 53.9% for Coloured, 68.2% for Indian/Asian, and 50.3% for White/European). The reason why attributable risks were similar for the four population groups was that in groups with higher relative risks prevalence of celibacy was lower. Urban residence was a moderate factor for Coloured and White/European, very small for Black/African and not significant for Indian/Asian. Education had a moderate effect only for Indian/Asian, and the effect was even negative for the Black/African group. For the 1940-1971 cohorts, the largest change was the time trend, which became positive except for the Coloured group. The crossing of the two slopes was around cohort 1935, who married on average around 1960, for all four groups. The effect of celibacy was consistent with the previous period, although somewhat milder. The effect of urban residence for Indian/Asian became significant, as the effect of education for Coloured and White/European. (Table 2)
13
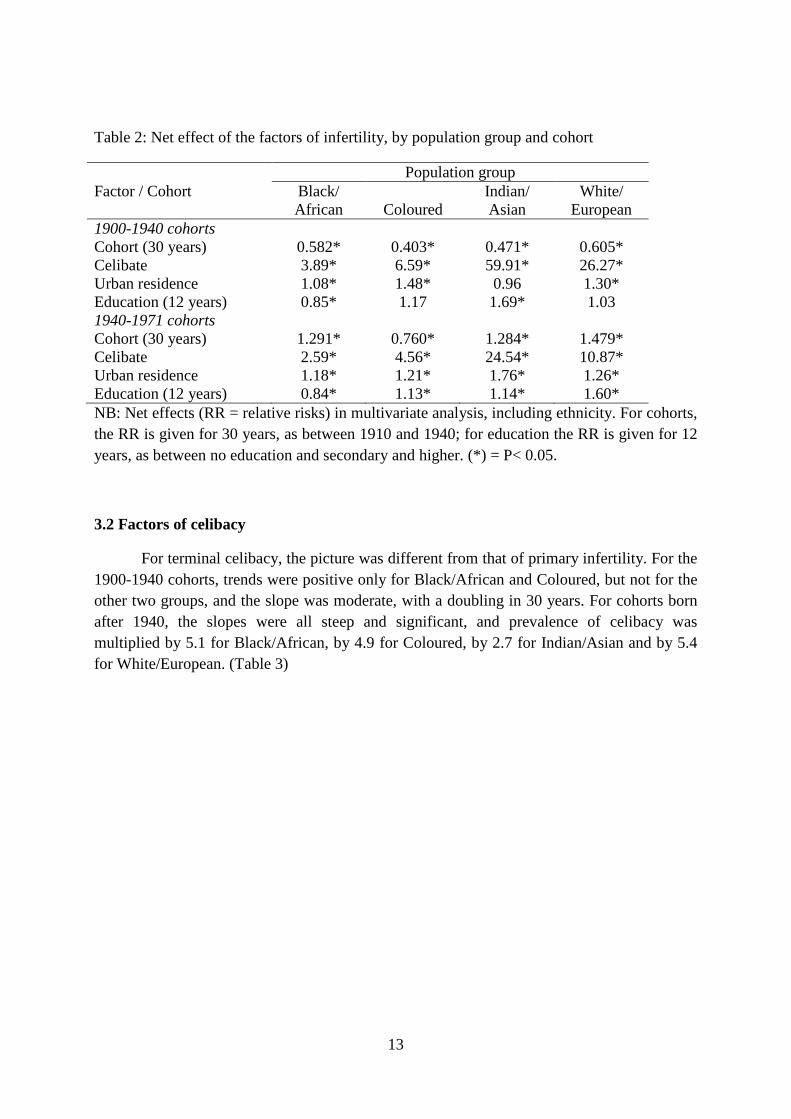
Table 2: Net effect of the factors of infertility, by population group and cohort
Population group Factor / Cohort Black/
African Coloured Indian/ Asian
White/ European
1900-1940 cohorts Cohort (30 years) 0.582* 0.403* 0.471* 0.605* Celibate 3.89* 6.59* 59.91* 26.27* Urban residence 1.08* 1.48* 0.96 1.30* Education (12 years) 0.85* 1.17 1.69* 1.03 1940-1971 cohorts Cohort (30 years) 1.291* 0.760* 1.284* 1.479* Celibate 2.59* 4.56* 24.54* 10.87* Urban residence 1.18* 1.21* 1.76* 1.26* Education (12 years) 0.84* 1.13* 1.14* 1.60* NB: Net effects (RR = relative risks) in multivariate analysis, including ethnicity. For cohorts, the RR is given for 30 years, as between 1910 and 1940; for education the RR is given for 12 years, as between no education and secondary and higher. (*) = P< 0.05.
3.2 Factors of celibacy
For terminal celibacy, the picture was different from that of primary infertility. For the 1900-1940 cohorts, trends were positive only for Black/African and Coloured, but not for the other two groups, and the slope was moderate, with a doubling in 30 years. For cohorts born after 1940, the slopes were all steep and significant, and prevalence of celibacy was multiplied by 5.1 for Black/African, by 4.9 for Coloured, by 2.7 for Indian/Asian and by 5.4 for White/European. (Table 3)

14
Table 3: Net effect of the factors of celibacy, by population group and cohort
Population group Factor / Cohort Black/
African Coloured Indian/ Asian
White/ European
1900-1940 cohorts Cohort (30 years) 2.095* 2.312* 1.025 1.015 Urban residence 1.37* 0.81* 0.79 1.24 Education (12 years) 1.16* 0.58* 1.08 0.86 1940-1971 cohorts Cohort (30 years) 5.062* 4.882* 2.730* 5.400* Urban residence 1.50* 0.90* 0.61* 1.40* Education (12 years) 0.68* 0.32* 0.50* 0.26* NB: Net effects (RR = relative risks) in multivariate analysis, including ethnicity. For cohorts, the RR is given for 30 years, as between 1910 and 1940; for education the RR is given for 12 years, as between no education and secondary and higher. (*) = P< 0.05.
So, all population groups were deeply affected by the decline in marriage in relative terms, although at different levels. Urban residence had a mild positive effect for Black/African and for White/European, but a negative effect for Coloured and Indian/Asian. Lastly, level of education had a negative or nil effect (less celibacy), except for the Black/African for the earliest cohorts (1900-1940). The effect was moderate for the recent cohorts (1940-1971). (Table 3)
3.3 Cultural factors: ethnicity
Lastly, the effect of ethnicity was investigated separately in the same regression models, after controlling for the above mentioned variables (time trend, urban residence, population group, plus celibacy for infertility). For infertility, results show remarkable consistency, with a few exceptions. Among the Black/Africans, the Shangaan (Tsonga speaking) which had average levels in 1900-1940 had lower values later; the Ndebele which had lower than average values in 1900-1940 had average values later. Among the Coloured groups, both the Afrikaans and the English speaking had lower than average increases, and the situation was the same for the Indian/Asian speaking Afrikaans. Among the White/Europeans, the increase was more pronounced for both the Afrikaans and the English speakers. (Table 4)
15
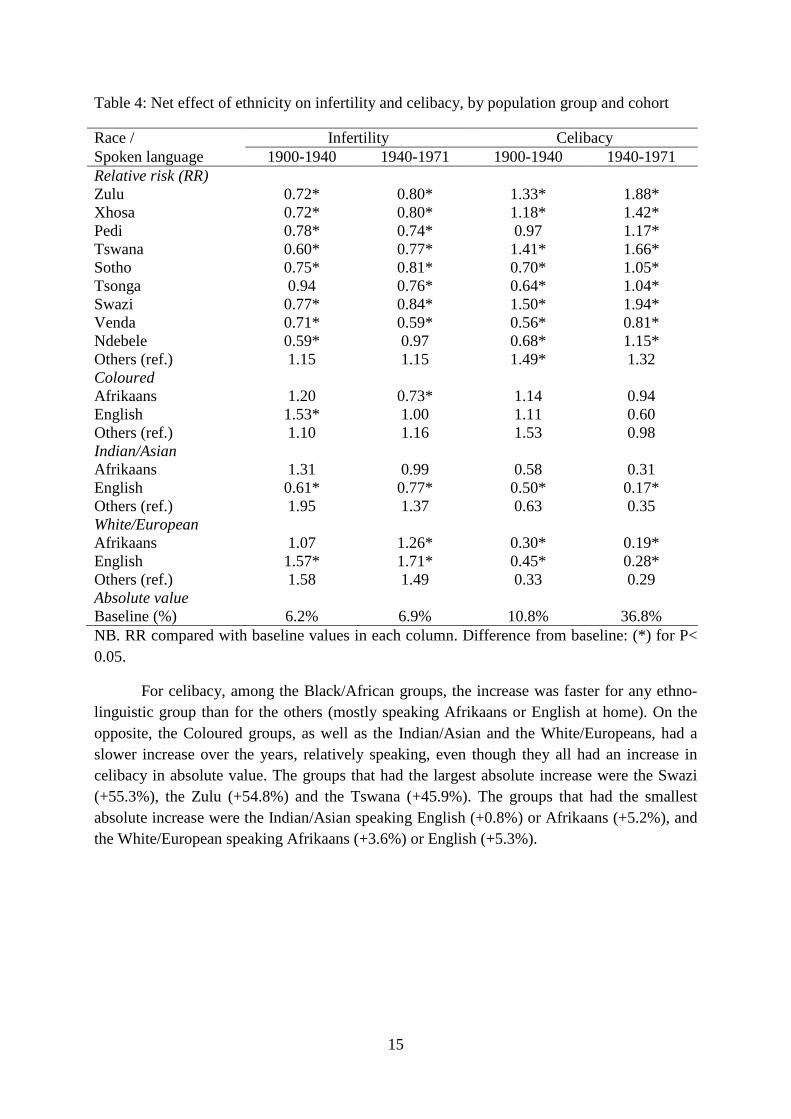
Table 4: Net effect of ethnicity on infertility and celibacy, by population group and cohort
Race / Infertility Celibacy Spoken language 1900-1940 1940-1971 1900-1940 1940-1971 Relative risk (RR) Zulu 0.72* 0.80* 1.33* 1.88* Xhosa 0.72* 0.80* 1.18* 1.42* Pedi 0.78* 0.74* 0.97 1.17* Tswana 0.60* 0.77* 1.41* 1.66* Sotho 0.75* 0.81* 0.70* 1.05* Tsonga 0.94 0.76* 0.64* 1.04* Swazi 0.77* 0.84* 1.50* 1.94* Venda 0.71* 0.59* 0.56* 0.81* Ndebele 0.59* 0.97 0.68* 1.15* Others (ref.) 1.15 1.15 1.49* 1.32 Coloured Afrikaans 1.20 0.73* 1.14 0.94 English 1.53* 1.00 1.11 0.60 Others (ref.) 1.10 1.16 1.53 0.98 Indian/Asian Afrikaans 1.31 0.99 0.58 0.31 English 0.61* 0.77* 0.50* 0.17* Others (ref.) 1.95 1.37 0.63 0.35 White/European Afrikaans 1.07 1.26* 0.30* 0.19* English 1.57* 1.71* 0.45* 0.28* Others (ref.) 1.58 1.49 0.33 0.29 Absolute value Baseline (%) 6.2% 6.9% 10.8% 36.8% NB. RR compared with baseline values in each column. Difference from baseline: (*) for P< 0.05.
For celibacy, among the Black/African groups, the increase was faster for any ethno-linguistic group than for the others (mostly speaking Afrikaans or English at home). On the opposite, the Coloured groups, as well as the Indian/Asian and the White/Europeans, had a slower increase over the years, relatively speaking, even though they all had an increase in celibacy in absolute value. The groups that had the largest absolute increase were the Swazi (+55.3%), the Zulu (+54.8%) and the Tswana (+45.9%). The groups that had the smallest absolute increase were the Indian/Asian speaking English (+0.8%) or Afrikaans (+5.2%), and the White/European speaking Afrikaans (+3.6%) or English (+5.3%).

16
Discussion
The prevalence of primary infertility appeared overall moderate in South Africa, compared with other African countries, however well above biological sterility. For women born between 1900 and 1935, the level of infertility tended to decline, probably because decreasing biological sterility due to antibiotics and other treatments of sterility widely available after 1945. Then, the level of infertility tended to increase significantly, by some 28% for cohorts born between 1935 and 1971. This recent increase seems primarily due to changing marriage patterns (during the 1960-1999 period), to new contraceptive methods (pill, IUD, etc.), and possibly to a lesser extent to emerging diseases such as HIV/AIDS, tuberculosis, and other sexually transmitted infections (STIs) in the more recent years. With respect to marriage, some 70% of infertile women were in the ever-married group before 1930, but only 44% after 1960: a majority of infertile women were simply never exposed (voluntary or not) in the recent cohorts, which seems to be a new phenomenon, due to rapid changes in marriage patterns and contraceptive use. Attitudes towards marriage and childbearing also changed in Europe and in North America in the 1960’s, with a large impact on primary infertility. [Hastings & Robinson 1975; Poston & Gotard 1977] What happened in South Africa appears dramatic, even though the level of childlessness remains lower than that in the USA (14.6% in 2002), except for the White/European group which reached similar levels.
There is no doubt that marriage changed dramatically in South Africa after 1960 (cohorts born after 1935), and this seems to be true for all population groups. [Budlender et al. 2004; Hosegood et al, 2009; Timaeus & Graham 1989; Udjo 2001] Most striking are the very high proportions of never-married women among the Black/African and the Coloured groups, among whom nearly half of the women did not contract a marriage before the end of their reproductive period. Among those, some live in common-law union, but this seems a living arrangement quite different from a formal marriage, and their fertility is definitely different, with a proportion of infertile women almost double that of married women. This seems also a new situation, which deserves further investigation.
In South Africa, the changing marriage regime, and the new forms of family life, seem to be the consequence of the rapid social dynamics associated with social change, economic development, urbanization, the circulatory migration system, and the apartheid regime. The two groups most affected by these dynamics were the Black/African and the Coloured groups, for whom the traditional family system was largely dismantled. But the other two groups were also affected, and probably for other reasons.
The situation of never-married women is also striking: about a third were infertile in the early years of the 20th century, but in the recent years some 86% have had a birth. This suggests that tolerance for births out-of-wedlock was probably limited in 1900, and that it seems to have increased markedly over the years. This is also a major change, indicating that fertility and marriage are less and less correlated, as found in many other places. [Sobotka and Toulemon 2008]

17
In this study biological infertility (sterility) was qualified as ‘involuntary’ and behavioral infertility as ‘voluntary’ from a population perspective. From an individual perspective however, these qualifications need to be nuanced. For instance, biological sterility resulting either from early exposure to sexually transmitted infections or from early induced abortion have a definite behavioral component. Likewise, terminal celibacy due to a lack of opportunity for marriage rather than from a strong will to remain single results from a demographic constraint and not from a personal choice, and is therefore rather involuntary.
Issues of reverse causality (sterility causing changes in marriage patterns) did not appear as a major issue in South Africa. However, it should be noted that for all population groups combined there were more divorced women among the infertile than among the fertile women. The relative risk of being divorced according to infertility status was significant only for the Indian/Asian group (RR= 1.63) and for the White/European group (RR= 1.50), but not for the other groups. In any case, divorced women were counted among the ever-married, so that this observation could not affect the previous analysis.
Celibacy, or lack of stable marriage, is a factor for a number of risky behavior, and in particular for multiple partnerships and STI’s such as HIV/AIDS. It is striking to note that the Black/African groups with the highest levels of celibacy (Swazi, Zulu) are also the most affected by HIV/AIDS. So, some of their infertility could be associated with STI’s, but this is more likely to apply for cohorts born after 1970, who started their sexual life at the onset of the HIV epidemic. A correlation between premarital fertility and HIV/AIDS was already noted earlier, going in the same direction. [Garenne & Zwang 2008]
The rising infertility among the Indian/Asian and White/European groups is amazing, reaching levels as high, or higher, than some European or North-American countries. This point has been little studied so far in South Africa, and seems to be due more to voluntary than to involuntary infertility. New patterns of choice by women for a ‘child-free’ and ‘marriage-free” life could be an explanation, like in North America. [Stobert & Kemeny 2003]
The social fabric is amazingly complex in South Africa, limiting seriously any geographical analysis. For instance, groups such as Swazi and Zulu are close geographically to Indians and Whites speaking English, but have radically different behavior. In contrast, Black/African groups who live in different provinces and belong to different ethnic groups, show rather homogenous behaviors, with only minor differences in infertility and in marriage patterns.
The relationship between socio-economic status and the two variables studied here is counter-intuitive at first glance. Despite the strong relationship between celibacy and infertility, the two groups with higher socioeconomic status (Indian/Asian and White/European) had higher levels of infertility and lower levels of celibacy than the two other groups (Black/African and Coloured). This shows the importance of cultural factors for studying infertility and celibacy, and justifies a posteriori the analysis by population groups and their dynamics. Focusing on socio-economic factors would have missed the most salient features of this population.

18
There is no reason to doubt about the quality of the data on childlessness in South Africa. Firstly, the question asked to persons in a census is straightforward, and in most cases any family member will know whether a woman has had a child or not, since being childless bears a stigma in most societies. Of course, there may be minor inconsistencies, in particular when women were not asked directly with full maternity histories. For instance there could be confusion between a woman who never had a pregnancy, and a woman who had only one delivery which ended either in a stillbirth or in a child who died right after birth. Such issues are inevitable in a census, but should not affect seriously the study of long term trends and differentials.
Levels of infertility measured by childlessness found in censuses are higher than those in DHS surveys, and this is true all over Africa. This can be due in data errors in the census, in problems with imputation of missing values, but also in biases in DHS surveys. These surveys tend to favor women in stable unions, and tend to exaggerate fertility levels by including still births.
The use of a proxy for being ever-married is more problematic. Of course this was imposed by the true nature of census data. However, this could only affect the magnitude of the differences studied. If some of the women classified among those living in common-law unions at time of census had in fact contracted a marriage before that failed, or if some of the women classified among the married were in fact celibate up to age 40 and married later, then the magnitude of the differences between the two groups would be diminished. In the empirical analysis, the magnitude of these differences was so great, that minor biases associated with imperfect data could only underscore the true effects in the population. Furthermore, other studies show similar findings with a more rigorous methodology. For instance, the Africa Center, a Demographic Surveillance System (DSS) located near Hlabisa in Kwazulu-Natal, where marriage and cohabitation patterns were studied extensively in the years 2000-2009, found similar patterns of very high and rising levels of terminal celibacy. [Hosegood et al. 2015]
The rise in terminal celibacy seems to continue unabated until the last point available. What will be the future of marriage among the Black/African groups remains to be seen. Will marriage simply disappear in the next century? Will there be a reversal in the trend? Will policies promoting marriage have an effect? These important questions call for a thorough monitoring in the years to come.
The history of population dynamics in the 20th century in South Africa is unique, with major migration flows, major redistribution of the population, major political and social change, and an impressive economic development. So, the findings of this study, showing the dramatic trends in marriage and infertility are special to South Africa. However, they may prefigure what could happen in other African countries as well, especially in the urban areas of the most dynamic countries. Monitoring these trends elsewhere might reveal surprising features of African nuptiality and fertility in the years to come.
19
References
Barlovatz A. (1955). Sterility in Central Africa. Fertility and Sterility; 6:363-
Basu D1, Basu JK, Ellison GT. (2010). The burden of infertility among HIV-positive couples in South Africa: the available evidence. South African Medical Journal; 100(6):354-356.
Belsey M. (1977). The epidemiology of infertility: a review with particular reference to sub-Saharan Africa. Bulletin of the World Health Organization; 54:319.
Boivin J, Bunting L, Collins JA, Nygren KG. (2007). International estimates of infertility prevalence and treatment-seeking: potential need and demand for infertility medical care. Human Reproduction; 22:1506–1512.
Budlender D, Chobokoane N, Simelane S. (2004). Marriage patterns in South Africa: Methodological and substantive issues. Southern African Journal of Demography; 9(1):1–26.
Chimere-Dan O. (1993). Population policy in South Africa. Studies in Family Planning; 24(1):31-9.
Dyer SJ, Abrahams N, Hoffman M, van der Spuy ZM. (2002). Infertility in South Africa: women's reproductive health knowledge and treatment-seeking behaviour for involuntary childlessness. Human Reproduction; 17(6):1657-62.
Ericksen K, Brunette T. (1996). Patterns and predictors of infertility among African women: A cross-national survey of twenty-seven nations. Social Science & Medicine; 42(2): 209–220.
Frank O. (1983). Infertility in in sub-Saharan Africa: estimates and implications. Population and Development Review; 9(1): 137-144.
Frank O. (1987). Sterility in women in sub-Saharan Africa. IPPF Medical Bulletin; 21(1):6-8.
Garenne M. (2004). Age at marriage and modernization in sub-Saharan Africa. Southern African Journal of Demography; 9(2): 57-77.
Garenne M, Zwang J. (2008). Premarital fertility and HIV/AIDS in Africa. African Journal of Reproductive Health; 12(1): 64-74.
Garenne M. (2014). Trends in Marriage and Contraception in sub-Saharan Africa: A longitudinal perspective on factors of fertility decline. DHS Analytical Studies No 42. Rockville, Maryland, USA: ICF International.
Gerais AS, Rushwan H. (1992). Infertility in Africa. Population Sciences; 12:25-46.

20
Guest I. (1978). Infertility in Africa. People (UK); 5:23-
Gerrits T. (1997). Social and cultural aspects of infertility in Mozambique. Patient Education and Counseling; 31: 39-48.
Hastings DW, Robinson JG. (1975). Incidence of Childlessness for United States Women, Cohorts Born 1891-1945. Social Biology; 21:178-84.
Hosegood V, McGrath N, Moultrie T. (2009). Dispensing with marriage: Marital and partnership trends in rural KwaZulu-Natal, South Africa 2000-2006. Demographic Research; 20: 279–312.
IUSSP. (1982). Multilingual Demographic Dictionary, English section. International Union for the Scientific Study of Population, Liège. (2nd edition)
Krige EJ, Cornaroff J (editors). (1900). African systems of marriage in Southern Africa. Cape Town: Juta & Company.
Larsen U, Menken, J (1991). Individual-level sterility: a new method of estimation with application to sub-Saharan Africa. Demography; 28(2): 229-247.
Larsen U. (2000). Primary and secondary infertility in sub-Saharan Africa. International Journal of Epidemiology; 29 (2): 285-291.
Leke RJ, Oduma JA, Bassol-Mayagoita S, Bacha AM, Grigor KM. (1993). Regional and geographical variations in infertility: effects of environmental, cultural and socioeconomic factors. Environmental Health Perspectives; 101(Suppl. 2): 73-80.
Mascarenhas MN, et al. (2012). National, regional, and global trends in infertility prevalence since 1990: A Systematic Analysis of 277 Health Surveys. PloS Medicine; 9(12).
McFalls JA, McFalls MA. (1984). Disease and Fertility. Orlando, FL: Academic Press.
Pantazis A, Clark SJ. (2013). Male and female sterility in Zambia. Demographic Research; 30(14).
Poston DL Jr., Gotard E. (1977). Trends in childlessness in the United States, 1910-1975. Social Biology; 24:212-24.
Preston-Whyte EM. (1978). Families without marriage. In: Social systems and tradition in Southern Africa. Edited by WJ Argyle and EM Preston-Whyte. Cape Town: Oxford University Press.
Retel-Laurentin A. (1974). Subfertility in black Africa - the case of the Nzakara in Central African republic. In B. Adadevoh (ed). Sub-fertility and Infertility in Africa. Ibadan, Nigeria: Caxton Press: 69-75.
Retel-Laurentin A. (1978). Appraising the role of certain diseases in sterility. Population; 33:101.
21
Roberts D, Tanner R. (1959). A demographic study in an area of low fertility in north-east Tanganyika. Population Studies; 13: 61.
Romaniuk A. (1967). La fécondité des populations Congolaises. Paris, Mouton.
Romaniuk A. (1968). The demography of the Democratic Republic of the Congo. In W. Brass et al. (eds), The demography of Tropical Africa. Princeton, Princeton University Press: 241-341.
Rutstein SO, Shah IH. Infecundity, Infertility, and Childlessness in Developing Countries. DHS Comparative Report No. 9: Calverton, Maryland, USA: ORC Macro and the World Health Organization, 2004
Sciarra, J. (1994). Infertility: An international health problem. International Journal of Gynecology & Obstetrics; 46:155-163.
Sobotka T, Toulemon L. (2008). Changing family and partnership behaviour: common trends and persistent diversity across Europe. Demographic Research; 19(6). (Special Collection 7: Childbearing trends and policies in Europe).
Stobert S, Kemeny A. (2003). Childfree by Choice. Canadian Social Trends; 69:7-10.
Timaeus I, Graham W. (1989). Labor circulation, marriage and fertility in Southern Africa. In:. Lesthaeghe RJ. Ed., Reproduction and social organization in sub-Saharan Africa. Berkeley, University of California Press: 365-400.
Udjo EO. (2001). Marital patterns and fertility in South Africa: the evidence from the 1996 population census. Paper presented at the XXIV IUSSP general conference, Salvador de Bahia, Brazil.
Van der Spuy ZM. (2009). HIV and reproductive health: a South African experience. Reproductive Biomedicine Online;18 (Suppl 2):3-10.
Westrom, L.V. (1994). Sexually transmitted diseases and infertility. Sexually Transmitted Diseases; 2(Suppl.):S32-S37.