dynamics of genome size evolution in birds and mammalszhanglab/clubpaper/03_22_2017.pdfdynamics of...
TRANSCRIPT

Dynamics of genome size evolution in birdsand mammalsAurélie Kapustaa, Alexander Suhb, and Cédric Feschottea,1
aDepartment of Human Genetics, University of Utah School of Medicine, Salt Lake City, UT 84112; and bDepartment of Evolutionary Biology, EvolutionaryBiology Centre, Uppsala University, SE-752 36 Uppsala, Sweden
Edited by J. Spencer Johnston, Texas A&M University, College Station, TX, and accepted by Editorial Board Member Daniel L. Hartl January 10, 2017 (receivedfor review October 15, 2016)
Genome size in mammals and birds shows remarkably little inter-specific variation compared with other taxa. However, genome se-quencing has revealed that many mammal and bird lineages haveexperienced differential rates of transposable element (TE) accumu-lation, which would be predicted to cause substantial variation ingenome size between species. Thus, we hypothesize that there hasbeen covariation between the amount of DNA gained by transposi-tion and lost by deletion during mammal and avian evolution, result-ing in genome size equilibrium. To test this model, we developcomputational methods to quantify the amount of DNA gained byTE expansion and lost by deletion over the last 100 My in the line-ages of 10 species of eutherian mammals and 24 species of birds. Theresults reveal extensive variation in the amount of DNA gained vialineage-specific transposition, but that DNA loss counteracted thisexpansion to various extents across lineages. Our analysis of the rateand size spectrum of deletion events implies that DNA removal inboth mammals and birds has proceeded mostly through large seg-mental deletions (>10 kb). These findings support a unified “accor-dion” model of genome size evolution in eukaryotes whereby DNAloss counteracting TE expansion is a major determinant of genomesize. Furthermore, we propose that extensive DNA loss, and notnecessarily a dearth of TE activity, has been the primary force main-taining the greater genomic compaction of flying birds and batsrelative to their flightless relatives.
genome size evolution | DNA loss | transposable elements | amniotes |flight
The nature and relative importance of the molecular mecha-nisms and evolutionary forces underlying genome size varia-
tion has been the subject of intense research and debate (1–7).Variation in genome sizes may not always occur at a level wherenatural selection is strong enough to prevent genetic drift to de-termine their fate (neutral or effectively neutral variation) (3).Additionally, the fixation probability of slightly deleterious dele-tions or insertions would be higher in species with smaller effectivepopulation sizes, where natural selection acts less efficiently (3, 8).On the other hand, a number of correlative associations betweengenome size and phenotypic traits, such as cell size (9, 10) andmetabolic rate associated with powered flight (11, 12), suggest thatnatural selection and adaptive processes also shape genome sizeevolution. Teasing apart the relative importance of these twoforces (drift and selection) requires a better understanding of themode and processes by which DNA is gained and lost over longevolutionary periods in different taxa. Thus, establishing an in-tegrated view of the contribution of gain and loss of DNA togenome size variation (or lack thereof) remains an important goalin genome biology (e.g., refs. 1, 2, 13, and 14).Most studies of genome size evolution have focused on taxa with
extensive variation in genome sizes, such as flowering plants (15–20), conifers (21), insects (22–25), teleost fishes (26), or specieswith extreme sizes [such as pufferfishes (27, 28) and salamanders(29, 30)]. Together, these investigations have documented that thedifferential expansion, accumulation, and removal of transposableelement (TE) sequences represent a major determinant of genome
size variation in plants and animals (for reviews, see refs. 2, 5,and 31). Generally, the studies cited above have revealed thatspecies with larger genomes tend to have larger TE contentcombined with low rates of TE DNA removal, and vice versa forsmaller genomes.In comparison with these taxa, birds and mammals show little
interspecific variation in genome size (from ∼1–2.1 Gb and 1.6–6.3 Gb,respectively) (Fig. 1), and little is known about the mechanisms un-derlying genome size equilibrium in these two classes of amniotes. Incontrast to plants (and to a lesser extent fishes), changes in ploidy donot appear to represent a major source of genome size variation inbirds or mammals, and there is no evidence of whole-genome du-plication events during amniote evolution (35). On the other hand, itis well established that a considerable amount of new nuclear DNAhas been generated throughout eutherian and avian evolution,mostly via TE expansion and, to a lesser extent, through segmentalduplications (36–47). These observations thus raise a conundrumwhereby TE activity has been pervasive in mammalian and avianevolution, yet has had apparently little impact on genome size.The simplest way to reconcile this conundrum is to postulate
that the amount of lineage-specific DNA gained by transpositionhas been systematically equalized by the removal of DNA alongthose lineages, thereby accounting for genome size equilibrium inmammals and birds (as hypothesized in refs. 14 and 48). However,this hypothesis remains largely untested and overall little is knownabout the mode and tempo of genomic DNA loss in amniotes. Anearlier comparative genomic study of insertion/deletion (indel)rates across 13 vertebrate genomes (49) implicated that variation inDNA gains through TE expansion acted in concert with variations
Significance
Deciphering the forces and mechanisms modulating genome sizeis central to our understanding of molecular evolution, but thesubject has been understudied in mammals and birds. We tookadvantage of the recent availability of genome sequences for awide range of species to investigate the mechanism underlyinggenome size equilibrium over the past 100 million years. Our dataprovide evidence for an “accordion” model of genome size evo-lution in birds andmammals, whereby the amount of DNA gainedby transposable element expansion, which greatly varies acrosslineages, was counteracted by DNA loss through large segmentaldeletions. Paradoxically, birds and bats have more compact ge-nomes relative to their flightless relatives but exhibit more dy-namic gain and loss of DNA.
Author contributions: A.K., A.S., and C.F. designed research, performed research, ana-lyzed data, and wrote the paper.
The authors declare no conflict of interest.
This article is a PNAS Direct Submission. J.S.J. is a Guest Editor invited by the EditorialBoard.
Freely available online through the PNAS open access option.1To whom correspondence should be addressed. Email: [email protected].
This article contains supporting information online at www.pnas.org/lookup/suppl/doi:10.1073/pnas.1616702114/-/DCSupplemental.
E1460–E1469 | PNAS | Published online February 8, 2017 www.pnas.org/cgi/doi/10.1073/pnas.1616702114

in deletion rates to modulate genome size during evolution, butthe region analyzed was limited to a 12-Mb alignment and in-cluded only a single bird species. A more comprehensive analysisof DNA gain and loss in the lineages of human, mouse, and dog(39) showed that the dog and human lineages experienced 2.5×less DNA loss than in the mouse lineage, but also 2.8× and 1.6×less DNA gain, a balance explaining the modest differences ingenome size across these species. In birds, little is known aboutgenome size dynamics. Statistical models of genome size evolu-tion in the avian lineage have inferred that a contraction of∼0.8-fold occurred before the divergence of birds in a theropodancestor (50). Consistent with this idea, a recent comparativeanalysis of 48 bird genomes revealed that introns and intergenicregions are, on average, ∼2× and ∼1.4× smaller in birds than inmammals and nonavian reptiles, respectively (46) (see also refs.51 and 52). Furthermore, the ostrich lineage was found to haveexperienced, on average, larger genomic deletions than alligatorand turtle lineages (46). Despite these recent insights, our un-derstanding of genome size dynamics across eutherian and avianevolution remains fragmentary. In particular, the mode andtempo of DNA loss throughout amniote evolution has not beenexamined systematically.Leveraging the recent sequencing of dozens of mammalian
(e.g., ref. 53) and avian (46) genomes, we characterize genomesize evolution in mammals and birds through an integrated anal-ysis of DNA gain and loss on a genome-wide scale. The results areconsistent with an “accordion” model of genome size equilibrium,whereby DNA gains are balanced by DNA loss, primarily throughlarge-size deletions.
ResultsGenome Size Evolution as the Integration of Gain and Loss of DNA.We used available genome assemblies for 10 eutherian (placental)mammals and 24 avian species, and their respective TE annotation(Methods). We first estimated the amount of DNA gained viatransposition events in each lineage since their last common an-cestor. For mammals, we compiled data from the literature as wellas our own analyses to divide TE families previously characterizedin each species into lineage-specific and ancestral families (Methodsand Dataset S1). Using this information, we applied the Repeat-Masker software (54) to infer the amount of DNA occupied (andtherefore gained) by lineage-specific TEs in each of the genomeassemblies examined. We added the amount of lineage-specificDNA gained by segmental duplications, when documented in theliterature (information limited to some mammals) (37, 40, 41, 43,44). Because the evolutionary history of bird TE families has notbeen characterized as extensively as in mammals, we inferred theage of each TE insertion based on its divergence to the cognatefamily consensus sequence using lineage-specific neutral sub-stitution rates (46) (Methods). For birds, gains were estimated fromthe DNA amounts corresponding to insertions younger than 70 My,which corresponds to the onset of the Neoaves radiation (55).We then computed the total amount of DNA lost in each
lineage by subtracting the amount of ancestral genomic DNA ofeach species (assembly size minus gains) from the “projected”assembly size of their common ancestor. It is important to notethat our analysis requires using assembly sizes, which is the ge-nomic space where TEs have been annotated, rather than actualgenome sizes (which are always slightly larger because of currentlimitation in assembling highly complex regions such as centro-meres). For eutherians, we used an ancestral genome assembly sizepreviously estimated at 2.8 Gb based on a multiple alignment of18-species genome assemblies, allowing ancestral reconstruction(56, 57). For birds, we used 1.3 Gb as the predicted assembly sizefor both the ancestor of Paleognathae and Neoaves based on an-cestral genome sizes previously inferred for these two clades (58),and a comparison of genome sizes and assembly sizes for each ofthe bird species sequenced (Methods). Using these inferences, weestimated the total amount of DNA lost along each of the 34lineages considered (Dataset S2).As an example of the approach, in the human lineage we esti-
mated that 899 Mb of the hg38 assembly consisted of DNA gainedvia lineage-specific TE insertions (815 Mb) and segmental dupli-cations (84 Mb), which leaves an “ancestral DNA” amount in thehuman genome assembly of 2,150 Mb. Thus, we can infer that650 Mb (2,800 minus 2,150) of ancestral DNA was lost in thehuman lineage over the past ∼100 My. The same procedure wasapplied to the other species lineages considered. Based on theseamounts, we computed lineage-specific DNA loss coefficients k(as in ref. 39) with E = A e-kt, where E is the amount of extantancestral sequence in the species considered, A the total ancestralassembly size, and t the time (100 My for mammals and 70 My forbirds) (Methods and Dataset S2). Applying our predicted DNAloss rate for human, we obtain a coefficient k of 0.0026 per millionyears, which is nearly identical to the previously calculated co-efficient of 0.0024 (39), despite being based on a different meth-odology to infer DNA gain and loss.When applied to all lineages (Figs. 2 and 3 and Fig. S1), the
results of these analyses show that the amount of DNA gained andlost has varied substantially across lineages. DNA gains vary bymore than sixfold across mammals (from 150Mb in the megabat to1,007 Mb in the mouse lineages) (Fig. 2) and by more than 30-foldacross birds (from 7 Mb in the ostrich to 255 Mb in the wood-pecker lineages) (Fig. 3). DNA loss amounts range by twofoldacross mammals (from 650 Mb in the human to 1,373 Mb in themicrobat lineages) and by more than threefold across birds (from119 Mb in the ostrich to 424 Mb in the woodpecker lineages).
Fig. 1. Genome size variation in amniotes. Cytological haploid genome sizeranges of different groups of species are shown as black bars (from smallestto largest genome sizes). Birds range from ∼0.96–2.2 Gb (∼2.25×), whereasall reptiles range from 1.1 to 5.44 Gb (∼5×, shown as a blue rectangle) andmammals from 1.6 to 6.3 Gb (∼3.9×, shown as a purple rectangle). For ro-dents, the red viscacha rat (tetraploid, 8.4 Gb) was not included. This is incontrast to the ranges among all vertebrates (∼0.35 to ∼133 Gb, ∼333×,3,731 species), or among the other classes of vertebrates that include morethan one family: amphibians (0.95–121 Gb, ∼127×, 504 species), cartilaginousfishes (Chondrichthyes; 1.5–17 Gb, ∼11×, 134 species) and bony fishes(Osteichthyes; 0.35–133 Gb, ∼379.5×, 1,407 species). We note that amongthe 25 orders of Osteichthyes with more than 4 species, 6 have a genomesize range >5× (total of 897 species), with a maximum of ∼8.7× (Cypri-niformes, 229 species). The average of the 25 within-Osteichthyes genomesize ranges is ∼3.7×, which is a similar range than the one of mammalswithout the red viscacha rat (32). Divergence times are represented on thephylogenetic tree in millions of years as in refs. 33 and 34. Red dot: median.N: numbers of species inside each group with genome size data included inthe figure (compiled from ref. 32, as of March 6, 2015). When severalmeasures exist for one single species, values are averaged. Gb: gigabases.
Kapusta et al. PNAS | Published online February 8, 2017 | E1461
EVOLU
TION
PNASPL
US

For mammals, these results confirm the trends previouslyreported for some of these lineages (36, 37, 39): we observe moregains in rodents than in human, and more gain in human than indog, together with more loss in rodents than in dog or human. Inaddition, we found that the coefficient at which DNA was lostalong the lineages examined is the lowest in the ostrich lineage andthe highest in the microbat lineage (Figs. 2 and 3). In fact, both themicrobat and megabat lineages stand out as having both thehighest amount and coefficient of DNA loss, followed closely bythe mouse and rat lineages (Figs. 2 and 3). Altogether, we foundthat neither DNA gain nor loss can solely explain variation in ge-nome (assembly) sizes among the mammals and birds examined(Dataset S2). These results imply that variations in DNA gain andloss have acted in concert to modulate genome size in eutherianand avian evolution. We note that loss exceeded gain in all but twolineages (human and elephant) (Figs. 2 and 3 and Fig. S1).To investigate the extent by which these two opposite forces each
contribute to genome size equilibrium, we next examine whetherDNA gains (percentage of the ancestor assembly size) and DNAloss coefficients correlate with assembly sizes (using Felsenstein’sindependent contrasts to account for phylogenetic dependence; seeMethods). In mammals, we observe significant correlations of thecontrasts in assembly sizes with the contrasts in DNA gains as wellas with the contrasts in DNA loss coefficients (Pearson coefficientr = 0.86 with P = 0.001 and r = −0.74 with P = 0.015, respectively)
(Dataset S2). However, these results have to be interpreted withcaution because our statistical power is limited by the relativelysmall sample of mammalian lineages examined (n = 10). For the24 bird lineages analyzed, we observe that the contrasts in DNAloss coefficients, but not the contrasts in DNA gains, significantlycorrelate with the contrasts in assembly sizes (Pearson coefficientr = −0.73 with P = 6.00e-05 and r = −0.13 with P = 0.54, re-spectively) (Dataset S2). This observation indicates that DNA lossis a predominant contributor to genome size equilibrium in birds.However, neither one of these two forces alone can fully accountfor the variation between extant assembly sizes (e.g., woodpecker)(Dataset S2). Thus, these two forces must have acted in concert tomodulate genome size throughout avian evolution. Consistent withthis idea, we found that the contrasts in DNA gains and the con-trasts in DNA loss coefficients are positively and significantly cor-related with each other across the bird lineages examined (Pearsoncoefficient r = 0.77 with P = 2.00e-05) (Fig. 4). These data support amodel where genome size equilibrium is maintained through DNAloss counteracting the gains of DNA acquired through TE expan-sion. This is most strikingly illustrated in the woodpecker lineage,which shows both the largest amounts of gains and the highestDNA loss coefficients (Fig. 3, Fig. S1, and Dataset S2).
Contribution of Microdeletions to DNA Loss. Having determined thatDNA loss makes an important contribution to eutherian and avian
Fig. 2. Gain and loss of DNA in 10 mammalian line-ages. For each species, phylogenetic relationship (Left)(34), TE content (light blue bars), assembly sizes (withN removed, gray bars), DNA loss coefficients (greenbars), as well as gain (red and orange) and loss (darkblue) of DNA are shown. DNA gains correspondmostly to lineage-specific TEs in red (not shared withother mammals). When available, measures of seg-mental duplications were added (orange). Becausesegmental duplications also contain TEs, we correctedthe segmental duplication amounts with the TE con-tent of each genomes. DNA loss amounts and coeffi-cients are calculated as in ref. 39 using a commonancestor “assembly” size for all mammals of 2,800 Mb(Methods). The phylogenetic tree is color-coded basedon genome sizes in gigabases (data in picograms fromref. 32) based on parsimony. See Dataset S2 for num-bers, calculation steps and assemblies details. Allnumbers are in megabases.
E1462 | www.pnas.org/cgi/doi/10.1073/pnas.1616702114 Kapusta et al.

genome size equilibrium, we next sought to investigate the types ofdeletion events involved in the process. We first assessed the im-pact of small deletions (<30 bp; hereafter “microdeletions”)through multispecies alignment available from the University ofCalifornia, Santa Cruz (UCSC) genome browser (MultiZ outputof 100-species alignments). We separately extracted and analyzedgenomic alignments for 11 eutherian species (plus the marsupialMonodelphis domestica as outgroup) and for all seven avian spe-cies included in both this alignment and in ref. 46 (plus the lizardAnolis carolinensis as outgroup). We used the principle of parsi-mony to infer and place microdeletion events (estimated as sequencegaps of less than 30 bp) on the phylogenetic tree of the species(Methods). The total amount of concatenated alignment analyzed inthis way corresponded to 237Mb and 52Mb for mammals and birds,respectively. Microdeletion rates were obtained for each lineage bynormalizing the amount of gaps in the alignment by its total lengthand dividing the amount of alignment gaps per lineage by the cor-responding branch length in million years (Fig. 5).The results show that rodents have the highest microdeletion
rates among the lineages examined (Fig. 5A), about 3.5× higher asthose for the human lineage, in agreement with previous analysesof a smaller number of mammals (29, 36, 37, 62, 63). All othermammalian lineages we analyzed exhibit microdeletion rates thatare intermediate between those of human and rodents, except for
the common ancestor of bats (Chiroptera), which displays thelowest microdeletion rate in our analysis. Overall, microdeletionrates do not appear to vary substantially within a given mammalian(super)order (Primates, Rodentia, Chiroptera, Carnivora). Oneexception is Afrotheria, where the elephant lineage is char-acterized by a much lower (0.4×) microdeletion rate than thatof the tenrec (Echinops telfairi) or that of their common ancestor.This exception could be linked with peculiar characteristics evolved inthe elephant lineage, such as large body size, long gestation, slowdevelopment to maturity, long generation time (for review, see ref.64). When the number of microdeletion events (normalized foralignment length) is considered, rather than the total amount ofDNA removed by microdeletions (Fig. 5A), we observe similar trendswhereby bat, primate, and rodent lineages display the lowest,second lowest, and highest microdeletion rates, respectively.Among the seven bird species considered in the alignment, we
found that the two finches display the highest microdeletion rates(both in amount of DNA removed and number of events), whichare 5.4× higher as those in the falcon lineage. All other bird line-ages show rates and number of events that are intermediate be-tween those of finches and falcon. We find that the average lengthof microdeletions in birds (5.8 bp) is slightly larger than inferred inmammals (5.2 bp) (Dataset S3). Average lengths per specieslineages range from 4.8 bp (bats) to 5.7 bp (tenrec) in mammals
Fig. 3. Gain and loss of DNA in 12 avian lineages.Twelve avian lineages mentioned in the text andwith the extreme values of DNA gain and lossamounts are shown (see Fig. S1 for 12 additionalspecies with intermediate values). For each species,phylogenetic relationship (Left) (55), TE content(light blue bars), assembly sizes (with N removed,gray bars), DNA loss coefficients (green bars), as wellas gain (red) and loss (dark blue) of DNA are shown.Species names in bold correspond to high coveragegenomes, and the others to low coverage genomes(46). DNA gain corresponds to insertions youngerthan 70 My. DNA loss amounts and coefficients arecalculated as in ref. 39 using a common ancestor sizeof 1,300 Mb (see text and Methods). Phylogenetictree is color coded based on genome sizes in giga-bases (data in picograms from ref. 32 and extrapo-lations from assembly sizes and coverage), based onparsimony as in ref. 58. See Dataset S2 for numbers,calculation steps, and assemblies details. All numbersare in megabases.
Kapusta et al. PNAS | Published online February 8, 2017 | E1463
EVOLU
TION
PNASPL
US
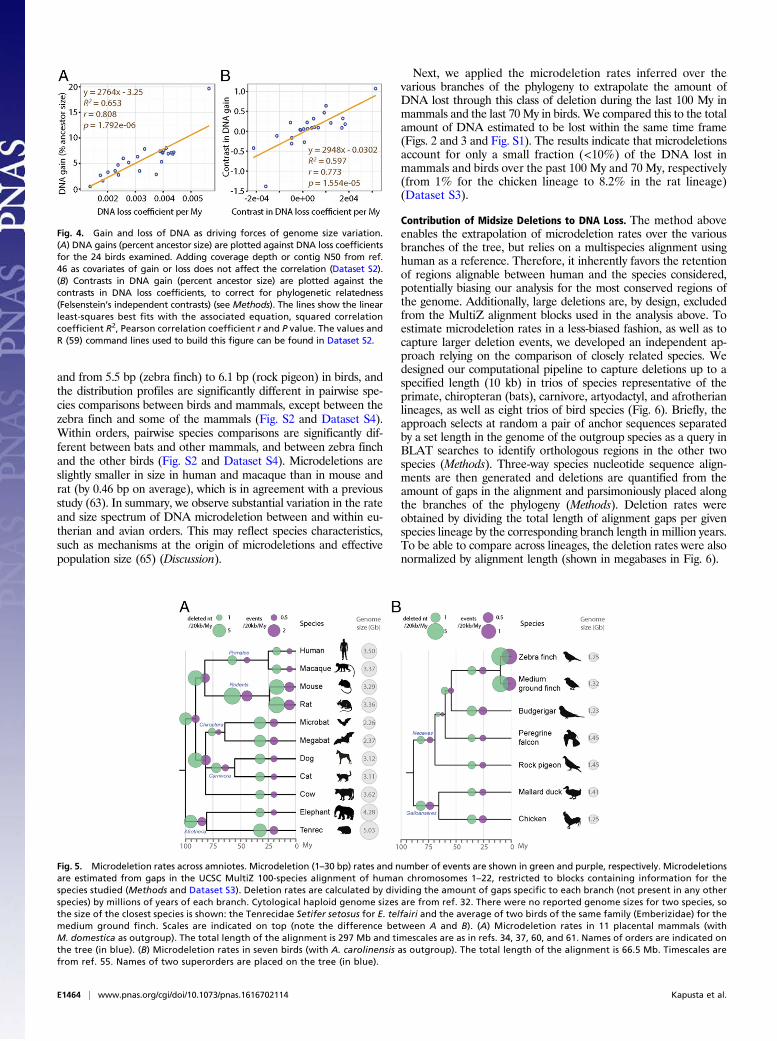
and from 5.5 bp (zebra finch) to 6.1 bp (rock pigeon) in birds, andthe distribution profiles are significantly different in pairwise spe-cies comparisons between birds and mammals, except between thezebra finch and some of the mammals (Fig. S2 and Dataset S4).Within orders, pairwise species comparisons are significantly dif-ferent between bats and other mammals, and between zebra finchand the other birds (Fig. S2 and Dataset S4). Microdeletions areslightly smaller in size in human and macaque than in mouse andrat (by 0.46 bp on average), which is in agreement with a previousstudy (63). In summary, we observe substantial variation in the rateand size spectrum of DNA microdeletion between and within eu-therian and avian orders. This may reflect species characteristics,such as mechanisms at the origin of microdeletions and effectivepopulation size (65) (Discussion).
Next, we applied the microdeletion rates inferred over thevarious branches of the phylogeny to extrapolate the amount ofDNA lost through this class of deletion during the last 100 My inmammals and the last 70 My in birds. We compared this to the totalamount of DNA estimated to be lost within the same time frame(Figs. 2 and 3 and Fig. S1). The results indicate that microdeletionsaccount for only a small fraction (<10%) of the DNA lost inmammals and birds over the past 100 My and 70 My, respectively(from 1% for the chicken lineage to 8.2% in the rat lineage)(Dataset S3).
Contribution of Midsize Deletions to DNA Loss. The method aboveenables the extrapolation of microdeletion rates over the variousbranches of the tree, but relies on a multispecies alignment usinghuman as a reference. Therefore, it inherently favors the retentionof regions alignable between human and the species considered,potentially biasing our analysis for the most conserved regions ofthe genome. Additionally, large deletions are, by design, excludedfrom the MultiZ alignment blocks used in the analysis above. Toestimate microdeletion rates in a less-biased fashion, as well as tocapture larger deletion events, we developed an independent ap-proach relying on the comparison of closely related species. Wedesigned our computational pipeline to capture deletions up to aspecified length (10 kb) in trios of species representative of theprimate, chiropteran (bats), carnivore, artyodactyl, and afrotherianlineages, as well as eight trios of bird species (Fig. 6). Briefly, theapproach selects at random a pair of anchor sequences separatedby a set length in the genome of the outgroup species as a query inBLAT searches to identify orthologous regions in the other twospecies (Methods). Three-way species nucleotide sequence align-ments are then generated and deletions are quantified from theamount of gaps in the alignment and parsimoniously placed alongthe branches of the phylogeny (Methods). Deletion rates wereobtained by dividing the total length of alignment gaps per givenspecies lineage by the corresponding branch length in million years.To be able to compare across lineages, the deletion rates were alsonormalized by alignment length (shown in megabases in Fig. 6).
Fig. 4. Gain and loss of DNA as driving forces of genome size variation.(A) DNA gains (percent ancestor size) are plotted against DNA loss coefficientsfor the 24 birds examined. Adding coverage depth or contig N50 from ref.46 as covariates of gain or loss does not affect the correlation (Dataset S2).(B) Contrasts in DNA gain (percent ancestor size) are plotted against thecontrasts in DNA loss coefficients, to correct for phylogenetic relatedness(Felsenstein’s independent contrasts) (see Methods). The lines show the linearleast-squares best fits with the associated equation, squared correlationcoefficient R2, Pearson correlation coefficient r and P value. The values andR (59) command lines used to build this figure can be found in Dataset S2.
Fig. 5. Microdeletion rates across amniotes. Microdeletion (1–30 bp) rates and number of events are shown in green and purple, respectively. Microdeletionsare estimated from gaps in the UCSC MultiZ 100-species alignment of human chromosomes 1–22, restricted to blocks containing information for thespecies studied (Methods and Dataset S3). Deletion rates are calculated by dividing the amount of gaps specific to each branch (not present in any otherspecies) by millions of years of each branch. Cytological haploid genome sizes are from ref. 32. There were no reported genome sizes for two species, sothe size of the closest species is shown: the Tenrecidae Setifer setosus for E. telfairi and the average of two birds of the same family (Emberizidae) for themedium ground finch. Scales are indicated on top (note the difference between A and B). (A) Microdeletion rates in 11 placental mammals (withM. domestica as outgroup). The total length of the alignment is 297 Mb and timescales are as in refs. 34, 37, 60, and 61. Names of orders are indicated onthe tree (in blue). (B) Microdeletion rates in seven birds (with A. carolinensis as outgroup). The total length of the alignment is 66.5 Mb. Timescales arefrom ref. 55. Names of two superorders are placed on the tree (in blue).
E1464 | www.pnas.org/cgi/doi/10.1073/pnas.1616702114 Kapusta et al.

We first used these datasets as an independent method to infermicrodeletion (<30 bp) rates in nucleotides per million years alongthe lineages represented and compared the results with thoseobtained with the MultiZ approach outlined above. We observethat the trends observed using the MultiZ approach for this subsetof species are largely recapitulated (Fig. 6, light green circles). Forexample, the elephant displays the lowest microdeletion rates innucleotides per million years among the species compared, whereasbats and medium ground finch display the highest. However,microdeletion rates inferred by this method are consistently higherthan those estimated based on the MultiZ alignment, on average1.6× higher for mammals and 4.3× higher for birds (Dataset S5).Presumably this difference reflects the greater evolutionary con-straint of the genomic regions aligned by MultiZ, which generallyleads to an underestimation of the “neutral” microdeletion rates ofthe species. Nevertheless, the fraction of total DNA loss accountedfor by microdeletions when applying the new rate estimates remainmodest, ranging from 5.1% in the cow lineage to 15.4% in themedium ground finch lineage (Dataset S3). Thus, the vast majorityof DNA loss during eutherian and avian evolution must have oc-curred through deletions larger than 30 bp.We then sought to capture deletions larger than 30 bp, and an
analysis of the size spectrum of alignment gaps recovered showsthat our computational pipeline succeeded in capturing relativelylarge deletion events (Fig. S3). For example, in the human lineage,5.8% of the gaps were longer than 1 kb and the largest deletionevent identified was 9,022 bp relative to the macaque genome(breakpoint in hg38 at chr10:81816824). Overall, between 10%and 23% of the deletion events recovered in each species werelarger than 200 bp (Fig. S3). We manually verified the longestevents recovered in each species: in mammals, the largest was a∼10-kb deletion in the chimpanzee relative to the macaque ge-nome (breakpoint in panTro4 at chr14:92050068). In birds, thelargest event corresponded to an ∼6-kb deletion in the mediumground finch relative to the golden-collared manakin (see thelegend of Fig. S3 for the breakpoint coordinates of all longest
events). Because longer deletion events tend to be fragmented intoseveral gaps when the sequences of the three species are aligned,counting the number of gaps in the alignment would likely over-estimate the actual number of deletion events in each specieslineage. Thus, we focused our analysis of midsize (>30 bp) deletionevents on the amount of DNA lost through this class of deletion,rather than the actual number of events.The results across the five eutherian orders examined (Fig. 6)
reveal trends similar to our analysis of microdeletion rates, with theelephant and the microbat showing the lowest and highest rates ofmidsize deletions in nucleotides per million years, respectively(Fig. 6, dark gray circles). By applying the rates of midsize deletioninferred for each mammalian lineage to the entire distance sepa-rating these species from their common ancestor (∼100 My ago),we were able to estimate that the amounts of DNA lost via this classof deletion ranged from 62Mb in the elephant lineage to 134Mb inthe human lineage. These extrapolated figures (Dataset S5) suggestthat midsize deletions have accounted for 7.3% (elephant) to20.7% (human) of the total amount of DNA lost during eutherianevolution (11% on average). Together, micro- and midsize dele-tions account for 30.9% of DNA loss in the human lineage, andonly 14.1% in the microbat lineage (13% in the elephant lineage,18% on average) (Dataset S5). These data suggest that the vastmajority of eutherian DNA loss has occurred through deletionevents larger than those we are able to capture here (∼10 kb).For birds, the results of our midsize deletion analysis reveal
trends similar to those for microdeletions as well: the mediumground finch, Anna’s hummingbird, and woodpecker lineages showthe highest rates in nucleotide per million years, whereas thesmallest rates are observed in the ostrich and penguin lineages(Fig. 6 and Dataset S5). Next, we sought to assess the relativecontribution of micro- and midsize deletions in birds to genomesize equilibrium. We took advantage of the statistical power en-abled by the analysis of 16 species to test the relationship betweenthe rates of these two classes of deletions and the DNA loss co-efficients calculated over 70 My of evolution (Dataset S5). We
Fig. 6. Midsize deletion rates across amniotes.Microdeletions (1–30 bp) and midsize deletion (from30 bp to 10 kb for mammals and birds, respectively)rates, measured after a recent split between twospecies, are shown in light green and dark blue, re-spectively. Deletion rates were calculated based ongaps in alignments of orthologous regions specific tothe species (Methods) and are normalized by align-ment length (in megabases in the figure). We placedthe deletion events on the phylogenetic tree basedon parsimonious polarization via the respectiveoutgroup species. Gaps were considered shared bymultiple species when they overlapped for at least85% of their respective lengths (Methods). For bats,two sets of three species were considered: group Iwith Myotis lucifugus, Myotis brandtii, and Eptesicusfuscus (113.1 Mb of alignment), group II withM. lucifugus, E. fuscus, and Pteropus vampyrus (97.9 Mbof alignment). Rates placed on theMyotis branch (afterthe split with E. fuscus but before the split betweenM. lucifugus and M. brandtii) were inferred fromM. lucifugus rates. See Dataset S5 for the numbers,and Fig. S3 for the midsize deletion spectrums. Cyto-logical haploid genome sizes are from ref. 32. Therewere no reported genome sizes for 2 mammals and11 bird species (genome size in italic), so the size ofthe closest species is shown (Dataset S5).
Kapusta et al. PNAS | Published online February 8, 2017 | E1465
EVOLU
TION
PNASPL
US

observe that the contrasts in the two variables are positively cor-related, either if each class of deletion is considered separately(r = 0.78 with P = 3.5e-04 and r = 0.73 with P = 0.001 for micro-and midsize deletions, respectively) (Dataset S5) or together(r = 0.76 with P = 6.2e-04) (Dataset S5). These results suggest thatboth classes of deletions are significant drivers of genome sizeequilibrium during avian evolution.The extrapolation of the amount of DNA lost in birds through
the combined action of micro- and midsize deletions vary by up toone order of magnitude across lineages, from 14 Mb (ostrich andAdelie’s penguin) to 136 Mb (woodpecker) (Dataset S5). Theseamounts account from 9.5% (Adelie’s penguin) to 39.2% (Anna’shummingbird) of the total DNA loss along the bird lineages ex-amined (21.7% on average). Thus, on average, the contribution oftwo classes of deletions is similar in birds and mammals, but weobserve a greater variation in micro- and midsize deletion ratesamong birds than among mammals.
DiscussionDNA Gain and Loss Analysis Reveals the Elasticity of Avian and MammalianGenomes. Our study represents, to our knowledge, the mostsystematic analysis of the amount of genomic DNA gainedand lost during eutherian and avian evolution, two taxa showingrelatively little interspecific variation in genome sizes comparedwith others (such as plants or insects; see also legend of Fig. 1). Oneinterpretation for this apparent stasis in genome size could be thatthese lineages simply experienced relatively small amounts of DNAgain and loss during evolution (66–68). Our analysis shows that thisis clearly not the case: there has been extensive gain and loss ofDNA throughout eutherian and avian evolution. For example, theamount of DNA gained via lineage-specific transposition in themouse lineage contributed to a net gain of DNA equivalent to 33%of the current genome content, whereas the equivalent of 44% ofgenome content was lost over the same time frame (Fig. 2 andDataset S2). The woodpecker lineage provides another strikingexample. Among birds, this species lineage has experienced thelargest amount of DNA gain [255 Mb, predominantly through CR1LINE transposition (46)] but also the largest amount of DNA loss(424 Mb, equivalent to about one-third of the genome) over thepast ∼70 My, resulting in a current genome size comparable to thatof other modern bird species (Fig. 3, Fig. S4, and Dataset S2).Thus, our data reveal a previously underappreciated level of elas-ticity in eutherian and avian genomes.These findings allow us to uncover a general pattern of genome
evolution along the major avian and eutherian lineages, whereby the(often large) amount of DNA gained via lineage-specific trans-position is essentially balanced by the amount of DNA lost over thesame time frame. This accordion process helps explaining the rel-ative maintenance of genome size across the eutherian and avianphylogeny. This is particularly evident in birds (Fig. 1), which displaya positive correlation between DNA gain and DNA loss (Fig. 4).Thus, our results indicate that the relatively small genome size ofbirds is not merely because of a dearth of transposition in thoselineages, as previously hypothesized, (e.g., refs. 66–68), but ratherthe result of a dynamic interplay between TE-mediated DNA ac-quisition and subsequent DNA loss (as suggested in refs. 14 and 48).
DNA Loss Through Large Deletions as a Determinant of Genome Size.Previous studies assessing DNA loss have mainly focused on dele-tions within TE sequences, which impose a relatively small upperlimit for the size of observable events (because TE copies rarelyexceed 10 kb). The rate of deletions estimated through this ap-proach have been shown to be a major predictor of genome sizeevolution in insects (e.g., refs. 22–25 and 69), plants (e.g., ref. 16),and a few vertebrates (14, 27–30). However, whether the variation inthe rate of small deletions can actually account for genome sizevariation observed between taxa has been questioned (discussed inrefs. 70 and 71). Indeed, quantifications from limited comparative
datasets have suggested that microdeletions alone cannot accountfor the extent of genome contraction observed in some vertebratelineages (e.g., refs. 2, 26, 62, 63, and 72). Here, we assessed abroader size spectrum of deletion through whole-genome and localalignments of diverse birds and mammals. Our estimates of micro-deletion (1–30 bp) rates show that this type of event can only explaina minute fraction of the DNA content lost during avian and eu-therian evolution (Figs. 5 and 6 and Datasets S3 and S5) and as suchdo not appear to be a major contributor to genome size evolution inthese taxa.Our results show that midsize deletions (31 bp to 10 kb) play a
larger role than microdeletions in explaining the observed in-terspecific variation in DNA loss. Collectively, however, micro- andmidsize deletions detected in our analyses still account for a limitedfraction (9.5–40% and 20% in average) (Dataset S5) of total DNAloss in eutherian and avian evolution. These data suggest that thevast majority of DNA loss in amniotes has been driven by relativelylarge deletions (>10 kb). Such large deletions are challenging todetect systematically with currently available genome assemblies,precluding us to measure the rate of these events along the lineagesconsidered in this study. We note, however, that instances of largechromosomal deletions have been documented previously inmammals [e.g., 1,511 and 845 kb (73), and 31 kb (74); see also ref.75], and we were able to identify individual events (Fig. S5). Sim-ilarly, large segmental deletions were inferred to have had occurredin the common ancestor of birds (118 events for a total of 58 Mband up to 2.1 Mb per event) (46).Such large deletions, combined with the sheer amount of DNA
loss in some of the mammal and bird lineages examined (up to37.9% and 22.6% of nuclear DNA content, respectively), under-scores the dispensability of a large fraction of genomic DNA inthese animals (75–77), yet it does not preclude that the process ofsegmental DNA loss has played an important role in driving phe-notypic evolution (78–80). In fact, there are strong hints that largedeletions caused a substantial level of gene loss in birds (274 pro-tein-coding genes) with potentially profound phenotypic conse-quences (46, 81, 82). The foreseeable improvement of genomeassembly via third-generation sequencing (e.g., long-read sequenc-ing and gap filling; see ref. 83) will provide a way to more directlytest the hypothesis that large deletion events play a prominent rolein amniote genome evolution. Additionally, the resolution of tan-dem repeats that are generally missing from current assemblies willimprove, thus enabling the quantification of their contribution togenome dynamics.
Genome Contraction Covaries with TE Expansion.What could be themechanisms facilitating the covariation between the amounts ofDNA gained via TE insertions and the DNA that is lost, which isespecially striking in bird evolution (Fig. 4)? One simple expla-nation would be that TE insertions and deletions occur and fix atcomparable rates in a given species lineage because they aregoverned by the same population genetics parameters, which alsogovern variation in other, largely neutral mutational processes,such as nucleotide substitutions (1, 65). Consistent with this idea,we find that microdeletion rates (and, to a lesser extent, midsizedeletion rates) correlate strongly and significantly with neutralsubstitution rates in birds (Dataset S5). This finding may suggestthat variation in microdeletion rates largely reflects populationgenetic parameters, with large effective population sizes leading toan uncoupling of neutral genetic variation from nearby deleteriousalleles (i.e., a less-pronounced effect of linked selection) (8).Conversely, natural selection acts less efficiently in species withsmaller effective population sizes (8), which has been suggested tocontribute indirectly to the reduced purging of slightly deleteriousTE insertions (3, 84; contra ref. 85). Mammals have generallysmaller effective population sizes than birds (86), which is pre-dicted to increase the probability of fixation of nearly neutral TEinsertion and deletion events through genetic drift (8, 87). This
E1466 | www.pnas.org/cgi/doi/10.1073/pnas.1616702114 Kapusta et al.

prediction is congruent with our observation that the overallamounts of DNA gained and lost have been more substantial inmammals than in birds (Figs. 2 and 3 and Fig. S1).Mechanistically, the circumstances of frequent fixation of TE
insertions would also provide a plausible fodder for large chro-mosomal deletions. Indeed, interspersed repeats with high level ofsequence similarity, such as recently expanded TE families, rep-resent a prime substrate for nonallelic homologous recombination(NAHR) events that may result in the deletion of the interveningDNA (reviewed in ref. 88). Although the impact of TE-mediatedNAHR on the process of DNA loss has been well-documented inplants (e.g., refs. 15, 18, 19, 89–92; or for review see ref. 31), it hasnot been systematically examined in vertebrates. Nonetheless,comparative studies in primates have suggested that an increaseddensity of TEs from the same family augments the probability ofinterelement NAHR deletion events to occur between TE copies.For example, the highly abundant Alu elements have mediatedconsiderably more NAHR deletion events (e.g., refs. 74, 93, and94) than L1 (95) or SVA (SINE/VNTR/Alu) (96) elements, whichoccur at much lower density in primate genomes. Thus, it istempting to speculate that the explosive amplification of one or afew TE families, such as CR1 elements in woodpeckers (46) andVes SINEs in bats (97, 98), led to an increase opportunity forNAHR, thereby facilitating the extreme degree of DNA loss thatwe observed in these two lineages (Figs. 2 and 3 and Fig. S1). Theidea that genome expansion via transposition subsequently pro-motes genome contraction via large-scale TE-mediated deletionwould provide a mechanistic underpinning for the proposed ac-cordion model of genome size evolution.
Implications for the Origin of Flight in Amniotes. Overall, our find-ings provide support for a general trend of strong genome con-traction throughout the evolution of bats and birds (Figs. 2 and 3and Figs. S1 and S4), the only vertebrates capable of poweredflight. Our study also extends the previous notion that the evolutionof the small genomes of bats and birds predates the emergence offlight (50, 99). The continuous genome contraction we see alongmultiple bird lineages (Fig. 3 and Figs. S1 and S4) is consistent withprevious inference that their common ancestor had a larger ge-nome than that of extant avian species (58). Importantly, we foundno significant elevation in microdeletion rates in the respectivecommon ancestor of bats, Paleognathae (ratites and tinamous),Galloanserae (chickens and ducks), or Neoaves (all remainingbirds) (Fig. 5). Paradoxically, bats display the lowest microdeletionrate in our analysis (Fig. 5A). In birds, our results are in agreementwith previous estimates of rates of deletions <100 bp in the an-cestors of Aves, Neognathae, and Neoaves (∼0.3, 0.4, and 0.2 Mbper million years) (see figure S12 of ref. 46). Together, these ob-servations suggest that genome contraction before the evolution offlight in the common ancestor of birds and bats must have occurredthrough relatively large chromosomal deletion events, but notthrough an increased rate of microdeletions.Genome size variation between bird species has been linked to
variation in metabolic cost of powered flight, with hummingbirdsexhibiting the highest metabolism and smallest genomes (12, 100,101), whereas flightless ratite birds display the largest genomes(2, 51, 102). Our results lend further support to this connectionbetween metabolic rate and genome size reduction. We found thatbird lineages that have lost flight (penguins and ostrich) arecharacterized by midsize deletion rates significantly lower thanthose of flying birds (2.3-fold on average; ks test, P = 0.0036) (Fig.6 and Dataset S5). This trend is also consistent with the results of arecent study indicating that TE removal through ectopic re-combination occurs at a faster rate in the zebra finch (flying bird)than in the chicken (ground-dwelling bird) (48). Furthermore, weobserve that flightless bird lineages (penguins and ostrich) havegained generally less DNA during evolution and tend to showmore older TEs than flying birds (Fig. 3, Fig. S1, and Dataset S2).
Thus, the larger genomes of flightless birds do not appear to re-flect increased DNA gains, but slower removal of DNA relative toflying birds. In other words, the genomes of flightless birds are lessdynamic overall than those of flying species.In addition to their connection with powered flight, resting met-
abolic rates are correlated with body mass in mammals (103) andbirds (104). Interestingly, in our dataset we note that animals largerthan other species within the same order (e.g., elephant vs. manateeand tenrec, cow vs. sheep, ostrich vs. tinamou) display lower micro-and midsize deletion rates (Figs. 5 and 6). Similarly, megabats havelarger body mass than microbats, and show a lower DNA loss co-efficient (Fig. 2). These observations are consistent with a re-lationship between body mass, resting metabolic rates, and genomicdeletion rates. However, we did not detect any general correlationbetween body mass and DNA loss when all mammals and birds inour dataset are considered (Datasets S2 and S5), suggesting thatthere is no simple relationship between these parameters.Finally, our results in bats are also consistent with the hypoth-
esis that the metabolic requirements for powered flight constraingenome size (99, 105) (Fig. 1). We found that bats have a DNAloss/gain ratio ∼4.3-fold higher than the other mammals examined(Fig. 2), as well as the highest midsize deletion rates (Fig. 6 andDataset S5). Importantly, however, we observe that neither bats(Figs. 5A and 6) nor flying birds (Fig. 6 and Dataset S5) exhibitincreased microdeletion rates relative to their flightless outgroups,again implying a predominant role of large deletion events inkeeping the genomes of the flying species particularly streamlined.Further studies are warranted to better characterize the molecularmechanisms underlying these large chromosomal deletions andtheir biological significance in amniote evolution.
MethodsGenomic and Biological Data. Versions of assemblies and species names arelisted in Datasets S2–S5. Genome sequences in fasta format were recoveredfrom UCSC for mammals (hgdownload.soe.ucsc.edu/goldenPath) and fromftp://climb.genomics.cn/pub/10.5524/100001_101000/101000/assembly/ (46) forbirds. There were 12 females (XX) and 7 males (XY) for mammals, and 10 fe-males (ZW) and 14 males (ZZ) for birds (Datasets S2 and S5). Body mass dataare from refs. 103, 106, and 107 for mammals, and from ref. 108 for birds.
For all mammals besides bats, TE annotation was obtained from www.repeatmasker.org/genomicDatasets/RMGenomicDatasets.html, RepeatMaskeropen-4.0.5 (54) ran with the repeat library release 20140131 from repbase(109). For bats and birds, we obtained TE annotations by running Repeat-Masker open-4.0.5 (using -e ncbi) with custom libraries (SI Methods).
Determination of Ancient vs. Lineage-Specific TEs. For mammals, we classifiedTE families as lineage-specific or shared between placental mammals (DatasetS1). We compiled data from Repbase and annotations of the RepeatMaskerlibraries (54, 109), complemented by our own orthology assessment (combi-nation of BLAT (https://genome.ucsc.edu/FAQ/FAQblat.html), observation ofthe conservation tracks on UCSC, and orthology assessment with the follow-ing script: https://github.com/4ureliek/TEorthology). In birds, the majority ofTEs belong to the CR1 superfamily (38, 46). CR1 have been active at least sincethe common ancestor of birds, always with several subfamilies at the sametime (110). This is because one CR1 lineage survived from the many lineages ofLINE present in the common ancestor of birds and crocodilians (111). CR1consensus sequences tend to be similar between ancient and recent families[e.g., families CR1-E and CR1-J across most of avian evolution (110)], whichcreates mis-annotations in the genome using RepeatMasker. Therefore, werelied on substitution rates to split TE-derived DNA into lineage-specific orshared. We developed a Perl script (parseRM.pl, available at https://github.com/4ureliek/Parsing-RepeatMasker-Outputs) to parse the raw alignmentoutputs from RepeatMasker (.align files). This process allowed us to use thecorrected percentage of divergence of each copy to the consensus from these.align files (accounting for the extremely high rate of mutations at CpG sites). Incase of overlaps (when a position could be aligned to more than one consensussequence), the smallest percentage divergence is chosen for that position.
DNA Loss Calculation. DNA loss coefficients were calculated as in Lindblad-Toh et al. (39). We estimated lineage-specific DNA loss coefficients kwith E =A e-kt, where E is the amount of extant ancestral sequence in the species
Kapusta et al. PNAS | Published online February 8, 2017 | E1467
EVOLU
TION
PNASPL
US

considered, A the total ancestral assembly size, and t the time, leading to k =ln(A/X)/t). Assuming, for eutherians, A = 2,800 Mb and t = 100 My, we getk = 0.0026 My−1 for human (X = assembly size minus gains = 2,150 Mb). SeeDataset S2 for all values and coefficients of other species. For birds, we usedA = 1,300 Mb (SI Methods) and t = 70 My [onset of the Neoaves radiation(55)]. We also characterized total loss at the same evolutionary timescales asthe ones of our microdeletions and midsize deletion calculations (Fig. S4).
Phylogenetic Correction by Independent Contrasts. To account for phyloge-netic dependence (112, 113), we used Felsenstein’s independent contrastsmethod implemented in the PDAP package (114) of Mesquite (115) (SIMethods and Dataset S2). To plot the data in R for Fig. 4, we generated theFile of Independent Contrasts and divided the Unstandardized Contrasts ofeach trait by their SD (Dataset S2).
Analysis of Microdeletions Using a Multispecies Alignment. We developedcustom Perl scripts (MAFmicrodel, v2.7), available at https://github.com/4ureliek/MAF_parsing, to recover gaps <30 nt from the MultiZ alignmentof human chromosomes 1–22 with 100 other species from the UCSC genomebrowser (MAF format, hgdownload.cse.ucsc.edu/goldenPath/hg19/multiz100way/).Studied species are listed in Fig. 5, with M. domestica and A. carolinensis asoutgroups for placental mammals and birds, respectively (Dataset S3). Gaps inalignments were placed on a phylogenetic tree based on parsimony and using
intersections of gap coordinates with Bedtools (116). See SI Methods formore details.
Analysis of Microdeletions and Midsize Deletions for Trio of Species. We de-veloped custom Perl scripts for the analysis of microdeletion and midsizedeletions in species trios, (v4.6, available at https://github.com/4ureliek/DelGet).See SI Methods for more details.
Screening for Large Deletions. Using a custom Perl script (maf_get_large_indels.pl, available at https://github.com/4ureliek/MAF_parsing), we recovered coor-dinates of indels >1 kb for each species in the MultiZ alignment of humanchromosomes 1–22 with 100 other species from the UCSC genome browser(MAF format, hgdownload.cse.ucsc.edu/goldenPath/hg19/multiz100way/). SeeSI Methods for more details.
ACKNOWLEDGMENTS. We thank the two anonymous reviewers for theirhelpful comments and suggestions; Aditi Rambani for her contribution indesigning the “DelGet” pipeline to find midsize deletions; Xiaoyu Zhuo, ZevKronenberg, Edgar J. Hernandez, Carson Holt, Barry Moore, and MarkYandell for their help with bioinformatics and statistics; Rachel Cosby forhelpful discussions; Cai Li for providing avian neutral substitution rates;Benoit Nabholz and Claudia C. Weber for providing avian body mass data;and Lel Eory and David Burt for providing RepeatModeler libraries. Thiswork was supported by NIH Grant R01GM077582 (to C.F.).
1. Petrov DA (2001) Evolution of genome size: New approaches to an old problem.Trends Genet 17(1):23–28.
2. Gregory TR (2005) The Evolution of the Genome (Elsevier Academic, San Diego, CA).3. LynchM (2007) The Origins of GenomeArchitecture (Sinauer Associates, Sunderland, MA).4. Linquist S, et al. (2015) Applying ecological models to communities of genetic ele-
ments: The case of neutral theory. Mol Ecol 24(13):3232–3242.5. Canapa A, Barucca M, Biscotti MA, Forconi M, Olmo E (2015) Transposons, genome
size, and evolutionary insights in animals. Cytogenet Genome Res 147(4):217–239.6. Elliott TA, Gregory TR (2015) What’s in a genome? The C-value enigma and the
evolution of eukaryotic genome content. Philos Trans R Soc Lond B Biol Sci370(1678):20140331.
7. Elliott TA, Gregory TR (2015) Do larger genomes contain more diverse transposableelements? BMC Evol Biol 15:69.
8. Ellegren H, Galtier N (2016) Determinants of genetic diversity. Nat Rev Genet 17(7):422–433.
9. Cavalier-Smith T (1982) Skeletal DNA and the evolution of genome size. Annu RevBiophys Bioeng 11:273–302.
10. Gregory TR, Hebert PD (1999) The modulation of DNA content: Proximate causesand ultimate consequences. Genome Res 9(4):317–324.
11. Andrews CB, Mackenzie SA, Gregory TR (2009) Genome size and wing parameters inpasserine birds. Proc Biol Sci 276(1654):55–61.
12. Wright NA, Gregory TR, Witt CC (2014) Metabolic ‘engines’ of flight drive genomesize reduction in birds. Proc Biol Sci 281(1779):20132780.
13. Petrov DA (2002) Mutational equilibrium model of genome size evolution. TheorPopul Biol 61(4):531–544.
14. Nam K, Ellegren H (2012) Recombination drives vertebrate genome contraction.PLoS Genet 8(5):e1002680.
15. Vicient CM, et al. (1999) Retrotransposon BARE-1 and its role in genome evolution inthe genus Hordeum. Plant Cell 11(9):1769–1784.
16. Bennetzen JL, Ma J, Devos KM (2005) Mechanisms of recent genome size variation inflowering plants. Ann Bot (Lond) 95(1):127–132.
17. Piegu B, et al. (2006) Doubling genome size without polyploidization: Dynamics ofretrotransposition-driven genomic expansions in Oryza australiensis, a wild relativeof rice. Genome Res 16(10):1262–1269.
18. Vitte C, Panaud O, Quesneville H (2007) LTR retrotransposons in rice (Oryza sativa,L.): Recent burst amplifications followed by rapid DNA loss. BMC Genomics 8:218.
19. Hawkins JS, Proulx SR, Rapp RA, Wendel JF (2009) Rapid DNA loss as a counterbal-ance to genome expansion through retrotransposon proliferation in plants. ProcNatl Acad Sci USA 106(42):17811–17816.
20. Kelly LJ, et al. (2015) Analysis of the giant genomes of Fritillaria (Liliaceae) indicatesthat a lack of DNA removal characterizes extreme expansions in genome size. NewPhytol 208(2):596–607.
21. Nystedt B, et al. (2013) The Norway spruce genome sequence and conifer genomeevolution. Nature 497(7451):579–584.
22. Petrov DA, Lozovskaya ER, Hartl DL (1996) High intrinsic rate of DNA loss in Dro-sophila. Nature 384(6607):346–349.
23. Petrov DA, Sangster TA, Johnston JS, Hartl DL, Shaw KL (2000) Evidence for DNA lossas a determinant of genome size. Science 287(5455):1060–1062.
24. Bensasson D, Petrov DA, Zhang D-X, Hartl DL, Hewitt GM (2001) Genomic gigantism:DNA loss is slow in mountain grasshoppers. Mol Biol Evol 18(2):246–253.
25. Wang X, et al. (2014) The locust genome provides insight into swarm formation andlong-distance flight. Nat Commun 5:2957.
26. Blass E, Bell M, Boissinot S (2012) Accumulation and rapid decay of non-LTR retro-transposons in the genome of the three-spine stickleback. Genome Biol Evol 4(5):687–702.
27. Aparicio S, et al. (2002) Whole-genome shotgun assembly and analysis of the ge-nome of Fugu rubripes. Science 297(5585):1301–1310.
28. Neafsey DE, Palumbi SR (2003) Genome size evolution in pufferfish: a comparativeanalysis of diodontid and tetraodontid pufferfish genomes. Genome Res 13(5):821–830.
29. Sun C, López Arriaza JR, Mueller RL (2012) Slow DNA loss in the gigantic genomes ofsalamanders. Genome Biol Evol 4(12):1340–1348.
30. Sun C, et al. (2012) LTR retrotransposons contribute to genomic gigantism in ple-thodontid salamanders. Genome Biol Evol 4(2):168–183.
31. Schubert I, Vu GTH (2016) Genome stability and evolution: Attempting a holisticview. Trends Plant Sci 21(9):749–757.
32. Gregory TR (2016) Animal Genome Size Database. Available at www.genomesize.com. Accessed December 12, 2016.
33. Shedlock AM, Edwards SV (2009) Amniotes (Amniota). The Timetree of Life, edsHedges SB, Kumar S (Oxford Univ Press, Oxford), pp 375–379.
34. Meredith RW, et al. (2011) Impacts of the Cretaceous terrestrial revolution and KPgextinction on mammal diversification. Science 334(6055):521–524.
35. Van de Peer Y, Maere S, Meyer A (2009) The evolutionary significance of ancientgenome duplications. Nat Rev Genet 10(10):725–732.
36. Waterston RH, et al.; Mouse Genome Sequencing Consortium (2002) Initial se-quencing and comparative analysis of the mouse genome. Nature 420(6915):520–562.
37. Gibbs RA, et al.; Rat Genome Sequencing Project Consortium (2004) Genome se-quence of the brown Norway rat yields insights into mammalian evolution. Nature428(6982):493–521.
38. Hillier LW, et al.; International Chicken Genome Sequencing Consortium (2004) Se-quence and comparative analysis of the chicken genome provide unique perspec-tives on vertebrate evolution. Nature 432(7018):695–716.
39. Lindblad-Toh K, et al. (2005) Genome sequence, comparative analysis and haplotypestructure of the domestic dog. Nature 438(7069):803–819.
40. Gibbs RA, et al.; Rhesus Macaque Genome Sequencing and Analysis Consortium(2007) Evolutionary and biomedical insights from the rhesus macaque genome.Science 316(5822):222–234.
41. She X, Cheng Z, Zöllner S, Church DM, Eichler EE (2008) Mouse segmental duplicationand copy number variation. Nat Genet 40(7):909–914.
42. St John J, Quinn TW (2008) Identification of novel CR1 subfamilies in an avian orderwith recently active elements. Mol Phylogenet Evol 49(3):1008–1014.
43. Nicholas TJ, et al. (2009) The genomic architecture of segmental duplications andassociated copy number variants in dogs. Genome Res 19(3):491–499.
44. Elsik CG, et al.; Bovine Genome Sequencing and Analysis Consortium (2009) Thegenome sequence of taurine cattle: A window to ruminant biology and evolution.Science 324(5926):522–528.
45. Bolisetty M, Blomberg J, Benachenhou F, Sperber G, Beemon K (2012) Unexpecteddiversity and expression of avian endogenous retroviruses. MBio 3(5):e00344-12.
46. Zhang G, et al.; Avian Genome Consortium (2014) Comparative genomics revealsinsights into avian genome evolution and adaptation. Science 346(6215):1311–1320.
47. Chalopin D, Naville M, Plard F, Galiana D, Volff JN (2015) Comparative analysis oftransposable elements highlights mobilome diversity and evolution in vertebrates.Genome Biol Evol 7(2):567–580.
48. Ji Y, DeWoody JA (2016) Genomic landscape of long terminal repeat retro-transposons (LTR-RTs) and solo LTRs as shaped by ectopic recombination in chickenand zebra finch. J Mol Evol 82(6):251–263.
49. Thomas JW, et al. (2003) Comparative analyses of multi-species sequences fromtargeted genomic regions. Nature 424(6950):788–793.
50. Organ CL, Shedlock AM, Meade A, Pagel M, Edwards SV (2007) Origin of avian ge-nome size and structure in non-avian dinosaurs. Nature 446(7132):180–184.
E1468 | www.pnas.org/cgi/doi/10.1073/pnas.1616702114 Kapusta et al.

51. Hughes AL, Hughes MK (1995) Small genomes for better flyers. Nature 377(6548):391.
52. Zhang Q, Edwards SV (2012) The evolution of intron size in amniotes: A role forpowered flight? Genome Biol Evol 4(10):1033–1043.
53. Lindblad-Toh K, et al.; Broad Institute Sequencing Platform and Whole Genome As-sembly Team; Baylor College of Medicine Human Genome Sequencing Center Se-quencing Team; Genome Institute at Washington University (2011) A high-resolutionmap of human evolutionary constraint using 29 mammals. Nature 478(7370):476–482.
54. Smit AFA, Hubley R, Green P (2015) RepeatMasker Open-4.0.2013-2015. Available atwww.repeatmasker.org. Accessed March 2, 2015.
55. Jarvis ED, et al. (2014) Whole-genome analyses resolve early branches in the tree oflife of modern birds. Science 346(6215):1320–1331.
56. Blanchette M, Green ED, Miller W, Haussler D (2004) Reconstructing large regions ofan ancestral mammalian genome in silico. Genome Res 14(12):2412–2423.
57. Ma J, et al. (2006) Reconstructing contiguous regions of an ancestral genome.Genome Res 16(12):1557–1565.
58. Organ CL, Edwards SV (2011) Major events in avian genome evolution. LivingDionsaurs: The Evolutionary History of Modern Birds, eds Dyke GJ, Kaiser GW(John Wiley & Sons, West Sussex, UK), pp 325–337.
59. Team RDC (2008) R: A Language and Environment for Statistical Computing (RFoundation for Statistical Computing, Vienna, Austria).
60. Teeling EC, et al. (2005) A molecular phylogeny for bats illuminates biogeographyand the fossil record. Science 307(5709):580–584.
61. Hedges SB, Dudley J, Kumar S (2006) TimeTree: A public knowledge-base of di-vergence times among organisms. Bioinformatics 22(23):2971–2972.
62. Ophir R, Graur D (1997) Patterns and rates of indel evolution in processed pseudo-genes from humans and murids. Gene 205(1-2):191–202.
63. Laurie S, Toll-Riera M, Radó-Trilla N, Albà MM (2012) Sequence shortening in therodent ancestor. Genome Res 22(3):478–485.
64. Bromham L (2011) The genome as a life-history character: Why rate of molecularevolution varies between mammal species. Philos Trans R Soc Lond B Biol Sci366(1577):2503–2513.
65. Sung W, et al. (2016) Evolution of the insertion-deletion mutation rate across theTree of Life. G3 (Bethesda) 6(8):2583–2591.
66. Shedlock AM (2006) Phylogenomic investigation of CR1 LINE diversity in reptiles. SystBiol 55(6):902–911.
67. Shedlock AM, et al. (2007) Phylogenomics of nonavian reptiles and the structure ofthe ancestral amniote genome. Proc Natl Acad Sci USA 104(8):2767–2772.
68. Janes DE, Organ CL, Fujita MK, Shedlock AM, Edwards SV (2010) Genome evolutionin Reptilia, the sister group of mammals. Annu Rev Genomics Hum Genet 11:239–264.
69. Adams MD, et al. (2000) The genome sequence of Drosophila melanogaster. Science287(5461):2185–2195.
70. Gregory TR (2003) Is small indel bias a determinant of genome size? Trends Genet19(9):485–488.
71. Gregory TR (2004) Insertion-deletion biases and the evolution of genome size. Gene324:15–34.
72. Mills RE, et al. (2006) An initial map of insertion and deletion (INDEL) variation in thehuman genome. Genome Res 16(9):1182–1190.
73. Nóbrega MA, Zhu Y, Plajzer-Frick I, Afzal V, Rubin EM (2004) Megabase deletions ofgene deserts result in viable mice. Nature 431(7011):988–993.
74. Han K, et al. (2007) Alu recombination-mediated structural deletions in the chim-panzee genome. PLoS Genet 3(10):1939–1949.
75. McLean C, Bejerano G (2008) Dispensability of mammalian DNA. Genome Res 18(11):1743–1751.
76. Ponting CP, Nellåker C, Meader S (2011) Rapid turnover of functional sequence inhuman and other genomes. Annu Rev Genomics Hum Genet 12:275–299.
77. Rands CM, Meader S, Ponting CP, Lunter G (2014) 8.2% of the human genome isconstrained: Variation in rates of turnover across functional element classes in thehuman lineage. PLoS Genet 10(7):e1004525.
78. Chan YF, et al. (2010) Adaptive evolution of pelvic reduction in sticklebacks by re-current deletion of a Pitx1 enhancer. Science 327(5963):302–305.
79. McLean CY, et al. (2011) Human-specific loss of regulatory DNA and the evolution ofhuman-specific traits. Nature 471(7337):216–219.
80. Hiller M, Schaar BT, Bejerano G (2012) Hundreds of conserved non-coding genomicregions are independently lost in mammals. Nucleic Acids Res 40(22):11463–11476.
81. Meredith RW, Zhang G, Gilbert MTP, Jarvis ED, Springer MS (2014) Evidence for a singleloss of mineralized teeth in the common avian ancestor. Science 346(6215):1254390.
82. Lovell PV, et al. (2014) Conserved syntenic clusters of protein coding genes aremissing in birds. Genome Biol 15(12):565.
83. Chaisson MJ, Wilson RK, Eichler EE (2015) Genetic variation and the de novo as-sembly of human genomes. Nat Rev Genet 16(11):627–640.
84. Lynch M, Bobay LM, Catania F, Gout JF, Rho M (2011) The repatterning of eukaryoticgenomes by random genetic drift. Annu Rev Genomics Hum Genet 12:347–366.
85. Whitney KD, Boussau B, Baack EJ, Garland T, Jr (2011) Drift and genome complexityrevisited. PLoS Genet 7(6):e1002092.
86. Figuet E, et al. (2016) Life history traits, protein evolution, and the nearly neutraltheory in amniotes. Mol Biol Evol 33(6):1517–1527.
87. Szitenberg A, et al. (2016) Genetic drift, not life history or RNAi, determine longterm evolution of transposable elements. Genome Biol Evol 8(9):2964–2978.
88. Konkel MK, Batzer MA (2010) A mobile threat to genome stability: The impact of non-LTR retrotransposons upon the human genome. Semin Cancer Biol 20(4):211–221.
89. Shirasu K, Schulman AH, Lahaye T, Schulze-Lefert P (2000) A contiguous 66-kb barleyDNA sequence provides evidence for reversible genome expansion. Genome Res10(7):908–915.
90. Devos KM, Brown JKM, Bennetzen JL (2002) Genome size reduction through illegitimaterecombination counteracts genome expansion in Arabidopsis.Genome Res 12(7):1075–1079.
91. Ma J, Devos KM, Bennetzen JL (2004) Analyses of LTR-retrotransposon structuresreveal recent and rapid genomic DNA loss in rice. Genome Res 14(5):860–869.
92. Tiley GP, Burleigh JG (2015) The relationship of recombination rate, genome struc-ture, and patterns of molecular evolution across angiosperms. BMC Evol Biol 15:194.
93. van de Lagemaat LN, Gagnier L, Medstrand P, Mager DL (2005) Genomic deletionsand precise removal of transposable elements mediated by short identical DNAsegments in primates. Genome Res 15(9):1243–1249.
94. Sen SK, et al. (2006) Human genomic deletions mediated by recombination betweenAlu elements. Am J Hum Genet 79(1):41–53.
95. Startek M, et al. (2015) Genome-wide analyses of LINE-LINE-mediated nonallelichomologous recombination. Nucleic Acids Res 43(4):2188–2198.
96. Lee J, Ha J, Son S-Y, Han K (2012) Human genomic deletions generated bySVA-associated events. Comp Funct Genomics 2012:807270.
97. Pagán HJT, et al. (2012) Survey sequencing reveals elevated DNA transposon activity,novel elements, and variation in repetitive landscapes among vesper bats. GenomeBiol Evol 4(4):575–585.
98. Platt RN, 2nd, et al. (2015) Targeted capture of phylogenetically-informative VesSINE insertions in genus Myotis. Genome Biol Evol 7(6):1664–1675.
99. Organ CL, Shedlock AM (2009) Palaeogenomics of pterosaurs and the evolution ofsmall genome size in flying vertebrates. Biol Lett 5(1):47–50.
100. Gregory TR, Andrews CB, McGuire JA, Witt CC (2009) The smallest avian genomesare found in hummingbirds. Proc Biol Sci 276(1674):3753–3757.
101. Shen Y-Y, Shi P, Sun Y-B, Zhang Y-P (2009) Relaxation of selective constraints onavian mitochondrial DNA following the degeneration of flight ability. Genome Res19(10):1760–1765.
102. Gregory TR (2002) Genome size and developmental parameters in the homeother-mic vertebrates. Genome 45(5):833–838.
103. Clarke A, Rothery P, Isaac NJ (2010) Scaling of basal metabolic rate with body massand temperature in mammals. J Anim Ecol 79(3):610–619.
104. Vinogradov AE (1997) Nucleotypic effect in homeotherms: Body-mass independentresting metabolic rate of passerine birds is related to genome size. Evolution 51(1):220–226.
105. Smith JDL, Gregory TR (2009) The genome sizes of megabats (Chiroptera: Pter-opodidae) are remarkably constrained. Biol Lett 5(3):347–351.
106. Garland T (1983) The relation between maximal running speed and body-mass interrestrial mammals. J Zool 199(Feb):157–170.
107. Stuart JA, Page MM (2010) Plasma IGF-1 is negatively correlated with body mass in acomparison of 36 mammalian species. Mech Ageing Dev 131(9):591–598.
108. Weber CC, Nabholz B, Romiguier J, Ellegren H (2014) Kr/Kc but not dN/dS correlatespositively with body mass in birds, raising implications for inferring lineage-specificselection. Genome Biol 15(12):542.
109. Bao W, Kojima KK, Kohany O (2015) Repbase update, a database of repetitive el-ements in eukaryotic genomes. Mob DNA 6:11.
110. Suh A, et al. (2011) Mesozoic retroposons reveal parrots as the closest living relativesof passerine birds. Nat Commun 2:443.
111. Suh A, et al. (2014) Multiple lineages of ancient CR1 retroposons shaped the earlygenome evolution of amniotes. Genome Biol Evol 7(1):205–217.
112. Felsenstein J (1985) Phylogenies and the comparative method. Am Nat 125(1):1–15.113. Garland T, Jr, Bennett AF, Rezende EL (2005) Phylogenetic approaches in compar-
ative physiology. J Exp Biol 208(Pt 16):3015–3035.114. Midford PE, Garland T, Maddison WP (2005) PDAP Package of Mesquite. Version
1.07. Available at https://github.com/MesquiteProject/Mesquite_PDAP. AccessedDecember 5, 2016.
115. Maddison WP, Maddison DR (2006) Mesquite: A modular system for evolutionaryanalysis. Version 1.1. Available at mesquiteproject.org. Accessed December 5, 2016.
116. Quinlan AR, Hall IM (2010) BEDTools: A flexible suite of utilities for comparing ge-nomic features. Bioinformatics 26(6):841–842.
117. Pace JK, 2nd, Gilbert C, Clark MS, Feschotte C (2008) Repeated horizontal transfer ofa DNA transposon in mammals and other tetrapods. Proc Natl Acad Sci USA 105(44):17023–17028.
118. Ray DA, et al. (2008) Multiple waves of recent DNA transposon activity in the bat,Myotis lucifugus. Genome Res 18(5):717–728.
119. Mitra R, et al. (2013) Functional characterization of piggyBat from the bat Myotislucifugus unveils an active mammalian DNA transposon. Proc Natl Acad Sci USA110(1):234–239.
120. Thomas J, Phillips CD, Baker RJ, Pritham EJ (2014) Rolling-circle transposons catalyzegenomic innovation in a mammalian lineage. Genome Biol Evol 6(10):2595–2610.
121. Zhuo X, Feschotte C (2015) Cross-species transmission and differential fate of anendogenous retrovirus in three mammal lineages. PLoS Pathog 11(11):e1005279.
122. Eöry L, et al. (2015) Avianbase: A community resource for bird genomics. GenomeBiol 16:21.
123. Warren WC, et al. (2010) The genome of a songbird. Nature 464(7289):757–762.124. Green RE, et al. (2014) Three crocodilian genomes reveal ancestral patterns of
evolution among archosaurs. Science 346(6215):1254449.125. Edgar RC (2004) MUSCLE: Multiple sequence alignment with high accuracy and high
throughput. Nucleic Acids Res 32(5):1792–1797.
Kapusta et al. PNAS | Published online February 8, 2017 | E1469
EVOLU
TION
PNASPL
US