dynamics of ethical climate: mediating effects of ethical
TRANSCRIPT
I
Aum
Dynamics of ethical climate: Mediating effects of ethical
leadership and workplace pressures on organisational
citizenship behaviour
by:
OUMESHSINGH SOOKDAWOOR
submitted in accordance with the requirements
for the degree of
DOCTOR OF BUSINESS LEADERSHIP
at the
UNIVERSITY OF SOUTH AFRICA
SUPERVISOR: PROF ANTON GROBLER
DATE SUBMITTED: JUNE 2021

ii
DECLARATION STATEMENT
Student No.: 79480608
I declare that “Dynamics of ethical climate: Mediating effects of ethical leadership and
workplace pressures on organisational citizenship behaviour” is my own work and that
all the sources that I have used or quoted have been indicated and acknowledged by
means of complete references.
I further declare that I submitted the thesis/dissertation to originality checking software
and that it falls within the accepted requirements for originality.
I further declare that I have not previously submitted this work, or part of it, for
examination at Unisa for another qualification or at any other higher education
institution.
………………….
Signature
(Oumeshsingh Sookdawoor)
Date: 02 June 2021

iii
ACKNOWLEDMENTS
I would like to acknowledge and sincerely thank the following people for their
valuable support and guidance during this research project:
1. Professor Anton Grobler (Supervisor) - For his thorough supervision and
guidance, enlightenment through valuable feedback, and motivation all
through the research journey.
2. Professor Breggie van der Poll (Doctorate Academic Coordinator) - For
her support and facilitation in progressing with the DBL programme as well as
for her valuable inputs and guidance at the colloquiums.
3. Professors Nicolaides, Henning and Dr Mathafena (Reviewers) - For
providing their respective constructive and valuable inputs as reviewers.
4. Dr Dion van Zyl (Statistician) - For his valuable support as statistician and
timely inputs provided whenever required on the methodological and
quantitative assessment phases.
5. Kantar (Data Collectors) - For their professional services in conducting the
field work according to the ethical and quality control guidelines.
6. Ms Tumelo Seopa (Programme Delivery, DBL) - For her steady
administrative support, coordination and help during the DBL programme.
7. Dr Neil Barnes - For his professional language editing services.
8. My closest ones – For their unflinching support, motivation and prayers
during this journey.
A note of thanks to the developers who provided their permissions for use of their
respective instruments for this research work.
Special gratitude to my beloved parents and to the supreme Lord for the divine
blessings and enlightenment all through.

iv
SUMMARY
The world has been facing unprecedented waves of financial crisis due to a number
of challenging ethical issues and cultures within organisations, and ethical leadership
and decision making amongst other things. Research has been undertaken to study
the relationship between ethics and leadership. However, the assessment of
interrelationships between specific ethical context dependent and independent
variables are yet to be undertaken within a multi-cultural multi-industry context.
Independent variables are conceptualised as organisational culture, ethical
organisational climate; mediating variables are conceptualised as ethical leadership
and decision making, and internal and external workplace pressures. Dependent
variables are conceptualised as organisational citizenship behaviour, employee
ethical behaviour and conduct, and perceived employee performance.
This study examines these dynamics within a conceptual research model using a
macro-meso-micro framework and establishes the interrelationships as well as
mediating effects on organisational citizenship behaviour, employee ethical behaviour
and conduct, and perceived employee performance. Out of an initial sample of 526, a
total of 523 participants of varying backgrounds working in ‘large’ organisations across
diverse industries in Mauritius (with a population of 2,534 ‘large’ establishments) were
subject to empirical study. A quantitative study was performed which employed
correlation, multiple regression, exploratory and confirmatory factor analysis, path
analysis and model fit assessments.
The outcomes of the study show that organisational culture and ethical organisational
climate (as macro independent variables) jointly influence the dependent variables
both directly and indirectly to varying degrees. It was also found that ethical leadership
and decision making, and internal and external workplace pressures (as meso
variables) have statistically significant mediating effects on the dependent variables of
organisation citizenship behaviour and perceived employee performance. The model
proved to have a good fit and can be adopted as a guiding model for the business and
research communities. The study also helps to better understand the prevailing state
of ethical climate, practices, and workplace pressures affecting employees’ ethical

v
stance as well as the key ethics related actions that are critical for implementation as
evidenced empirically in Mauritius.
Key Terms:
Ethics, organisational culture, ethical climate, ethical leadership and decision
making, internal and external workplace pressures, organisational citizenship
behaviour, employee ethical behaviour and conduct, perceived employee
performance

vi
TABLE OF CONTENTS
DECLARATION STATEMENT...……………….………………………………………………………………. ii
ACKNOWLEDGEMENTS...……………….……………………………………………………………………. iii
SUMMARY ………………......…………………………………………………………………………..……… iv
LIST OF TABLES …..….…………………………………………………………………….…………………. xi
LIST OF FIGURES ...…….………………………………………………………………….………………… xiv
CHAPTER 1: SCIENTIFIC ORIENTATION OF THE RESEARCH ............................ 1
1.1 INTRODUCTION ..................................................................................................... 1
1.2 BACKGROUND INFORMATION ............................................................................. 6
1.3 PROBLEM STATEMENT ...................................................................................... 17
1.4 RESEARCH QUESTIONS .................................................................................... 19
1.5 RESEARCH AIMS & OBJECTIVES ...................................................................... 20
1.5.1 General aim .................................................................................................... 20
1.5.2 Specific aims from a literature review standpoint ............................................ 20
1.5.3 Specific aims from an empirical study perspective .......................................... 21
1.6 RESEARCH DESIGN & METHODOLOGY ............................................................ 23
1.6.1 Research Methods ......................................................................................... 23
1.6.2 Proposed Instrument ...................................................................................... 24
1.6.3 Target Population ........................................................................................... 26
1.6.4 Delimitations ................................................................................................... 28
1.6.5 Sampling Method ............................................................................................ 29
1.6.6 Validity ............................................................................................................ 29
1.6.7 Reliability ........................................................................................................ 29
1.6.8 Variables ........................................................................................................ 30
1.6.9 Statistical Models & Techniques ..................................................................... 30
1.6.10 Statistical & Other Tools ............................................................................... 31
1.6.11 Limitations .................................................................................................... 31
1.6.12 Review of Professional & Academic Literature .............................................. 31
1.7 ETHICAL CONSIDERATIONS .............................................................................. 32
1.8 CHAPTERISATION ............................................................................................... 33
1.9 RESEARCH JOURNEY ........................................................................................ 34

vii
CHAPTER 2: LITERATURE REVIEW ..................................................................... 35
2.1 INTRODUCTION ................................................................................................... 35
2.1.1 Strategy for Literature Review ........................................................................ 37
2.2 CULTURE ............................................................................................................. 42
2.2.1 Introduction ..................................................................................................... 42
2.2.2 Common Characteristics of Culture ................................................................ 45
2.2.3 Culture Dimensions ........................................................................................ 47
2.2.4 Universality, Generality and Particularity of Culture ........................................ 51
2.3 ETHICS: ORIGIN AND PERSPECTIVES .............................................................. 52
2.3.1 Introduction ..................................................................................................... 52
2.3.2 Ethics: The Origin and the Religion Perspectives ........................................... 53
2.3.3 Ethics and Religion: The Relationship from an Empirical Perspective ............. 55
2.4 THE ROLE OF NATIONAL CULTURES IN SHAPING UP ORGANISATIONAL
CULTURES ........................................................................................................... 59
2.4.1 Introduction ..................................................................................................... 59
2.4.2 Cross-Cultural Studies: The GLOBE Perspective ........................................... 61
2.4.3 Cross-Cultural Studies: The Trompenaars’ Perspective .................................. 65
2.4.4 Cross-Country Studies: Ethical Business Culture ........................................... 66
2.5 ORGANISATIONAL CULTURE, BEHAVIOUR AND LEADERSHIP ...................... 71
2.5.1 Introduction ..................................................................................................... 71
2.5.2 Organisational Culture - The Origin in the Modern Era ................................... 71
2.5.3 Organisational Behaviour ............................................................................... 72
2.5.4 Organisational Culture - Perspectives and Typologies .................................... 76
2.5.5 Interrelationships between Organisational Culture, Personal Values and
Organisational Performance ........................................................................... 80
2.5.6 Organisational Culture: Does size Matter?...................................................... 86
2.5.7 Leadership Theories and Approaches ............................................................ 87
2.5.8 Authentic Leadership ...................................................................................... 89
2.6 ETHICAL THEORIES AND INTER-RELATIONSHIP ............................................. 93
2.6.1 Introduction ..................................................................................................... 93
2.6.2 Ethical Theories .............................................................................................. 93
2.6.3 Leadership and Interrelationship with Ethical Theories ................................... 97
2.7 ETHICAL ORGANISATIONAL CLIMATE ............................................................ 101
2.7.1 Introduction ................................................................................................... 101
2.7.2 Ethical Organisational Climate – Key Theories ............................................. 104
2.7.3 Ethical Virtues Model .................................................................................... 108

viii
2.7.4 Antecedents to and the Outcomes of Ethical Organisational Climate............ 111
2.8 ETHICAL LEADERSHIP AND DECISION MAKING ............................................ 113
2.8.1 Introduction ................................................................................................... 113
2.8.2 Ethical Leadership ........................................................................................ 114
2.8.3 Ethical Decision Making – Theoretical Models .............................................. 118
2.8.4 Ethical Decision Making – Empirical Findings ............................................... 126
2.9 INTERNAL AND EXTERNAL WORK PRESSURES ............................................ 129
2.9.1 Introduction ................................................................................................... 129
2.9.2 Merton’s Theory of Social Structure and Anomie .......................................... 130
2.9.3 Global Findings on Workplace Pressures ..................................................... 134
2.10 ORGANISATIONAL CITIZENSHIP BEHAVIOUR ................................................ 137
2.11 ETHICS STUDY – GLOBAL PERSPECTIVE ...................................................... 140
2.11.1 Key Survey Findings ................................................................................... 141
2.12 ETHICS STUDY - MAURITIUS PERSPECTIVE .................................................. 147
2.12.1 Introduction ................................................................................................. 147
2.12.2 Mauritius – Its Culture and Economic Background ...................................... 147
2.12.3 Mauritius – Its Legal and Corporate Governance Foundation ..................... 156
2.12.4 Ethics Challenges in Mauritius .................................................................... 160
2.13 SUMMARY OF THE CHAPTER .......................................................................... 164
2.13.1 Overview ..................................................................................................... 164
2.13.2 Schematic View of How They All Fit Together ............................................. 165
CHAPTER 3: RESEARCH DESIGN & METHODOLOGY ..................................... 166
3.1 INTRODUCTION ................................................................................................. 166
3.2 PHILOSOPHICAL FOUNDATIONS ..................................................................... 167
3.2.1 Research Approaches .................................................................................. 167
3.3 RESEARCH QUESTIONS & AIMS...................................................................... 171
3.3.1 Research Questions ..................................................................................... 171
3.3.2 Specific Research Aims from an Empirical Study Perspective ...................... 172
3.4 RESEARCH DESIGN & METHODS .................................................................... 174
3.4.1 Research Approach ...................................................................................... 174
3.4.2 Research Method & Strategy ........................................................................ 175
3.4.3 The Process for Establishing Instruments for Measurement ......................... 176
3.4.4 The Survey Instrument ................................................................................. 181
3.4.5 Population and Sample................................................................................. 184
3.4.6 Data Collection ............................................................................................. 187

ix
3.4.7 Quality Control .............................................................................................. 188
3.4.8 Statistical Analysis ........................................................................................ 189
3.4.9 Use of Statistical Tools ................................................................................. 196
3.4.10 Limitations to the Survey Methodology........................................................ 197
3.5 ETHICAL CONSIDERATIONS ............................................................................ 198
3.6 SUMMARY OF THE CHAPTER .......................................................................... 199
CHAPTER 4: RESEARCH RESULTS & INTERPRETATION ............................... 200
4.1 INTRODUCTION ................................................................................................. 200
4.2 THE SURVEY PROCESS, CHALLENGES & QUALITY CONTROLS ................. 201
4.2.1 The Survey Process ..................................................................................... 201
4.2.2 Challenges faced during field work ............................................................... 203
4.2.3 Quality Controls during Field Work ............................................................... 203
4.3 SURVEY DATA ASSESSMENT .......................................................................... 205
4.3.1 Case & Variable Screening ........................................................................... 205
4.3.2 Sample Representation ................................................................................ 207
4.3.3 Ethnic Group Representativeness ................................................................ 211
4.4 HIGH LEVEL INSIGHTS ..................................................................................... 213
4.5 MODEL FIT – ASSESSMENT & ADJUSTMENT ................................................. 225
4.5.1 CFA – Baseline Model (Construct: Organisational Culture) .......................... 226
4.5.2 CFA – Baseline Model (Construct: Ethical Organisational Climate) .............. 244
4.5.3 CFA – Baseline Model (Construct: Ethical Leadership & Decision Making) .. 255
4.5.4 CFA – Baseline Model (Construct: Internal & External Workplace Pressures) ....
………………………………………………………………………………………..261
4.5.5 CFA – Baseline Model (Construct: Organisational Citizenship Behaviour) .... 267
4.5.6 CFA Adjusted Model ..................................................................................... 273
4.5.7 CFA – Baseline Model (Construct: Ethical Employee Behaviour and
Conduct)……….. .......................................................................................... 277
4.5.8 Assessment of the Baseline Model (Construct: Perceived Employee
Performance) ................................................................................................ 284
4.5.9 Underlying Structure of the Conceptual Research Model .............................. 289
4.5.10 Constructs Descriptive Statistics ................................................................. 292
4.5.11 Group Differences ....................................................................................... 298
4.5.12 Correlation Analysis .................................................................................... 305
4.6 MODEL, PATH ANALYSIS & MEDIATION .......................................................... 306
4.6.1 Approach ...................................................................................................... 306
4.6.2 Summary of Statistical Outcomes on Mediation of Deconstructed Models .... 343

x
4.6.3 Holistic View & Analysis of the Path Diagram of the Conceptual Research
Model ........................................................................................................... 344
4.7 CHAPTER SUMMARY ........................................................................................ 349
CHAPTER 5: DISCUSSIONS, RECOMMENDATIONS & CONCLUSION ............ 351
5.1 INTRODUCTION ................................................................................................. 351
5.2 RECAP OF THE RESEARCH PROBLEM ........................................................... 352
5.3 RESEARCH FINDINGS & DISCUSSIONS .......................................................... 353
5.3.1 Research Questions ..................................................................................... 353
5.3.2 Specific Research Aims from an Empirical Study Perspective ...................... 356
5.3.3 Insights on Key Ethics Related Actions: Critical for Implementation .............. 391
5.4 LIMITATIONS ...................................................................................................... 397
5.5 RECOMMENDATIONS & CONCLUSION ........................................................... 399
5.5.1 Introduction ................................................................................................... 399
5.5.2 Recommendations ........................................................................................ 399
5.5.3 Imperatives for Future Research .................................................................. 406
5.5.4 Conclusion.................................................................................................... 408
5.5.5 Way forward for future research ................................................................... 419
6. REFERENCES ................................................................................................ 420
7. APPENDICES.................................................................................................. 460

xi
LIST OF TABLES
Table Name Page
1.1 Large Establishments by Industry Group 28
1.2 Target Population & Sampling 29
1.3 Examples of variables being considered for the study 30
2.1 Order of Intensity of Internal and External Pressure in Fortune 500 Companies (Adapted from Ethics Resource Centre Report, 2012)
136
2.2 Global Ethics and Ratings by Country – 2018 144
2.3 Gross Value Added Contribution by Industry – Large Establishments 156
3.1 Large Establishments by Industry Group 185
3.2 Target Population & Sampling 186
4.1 Gender Representativeness 207
4.2 Age Group Representativeness (as surveyed) 208
4.3 Industry Representativeness (as surveyed) 209
4.4 Industry Representativeness (partially regrouped) 210
4.5 Socio-economic Group Representativeness 211
4.6 Ethnic Group Representativeness 211
4.7 District Representativeness 212
4.8 Ethics & Compliance Standards and Practice by Industry 213
4.9 Prevalence of Ethics & Compliance Standards and Practice by Industry 215
4.10 Prevalence of Ethics & Compliance Standards & Practice by Establishment Size
217
4.11 Observed Ethical Deviances and Malpractices over the last 12-mths in the Workplace
218
4.12 Set of Items Measuring Ethical Behaviour & Conduct (as per global surveys)
219
4.13 Analysis of responses who "agreed” or “strongly agreed” in respect of pressures
223
4.14 Evaluation of Suggested Key Ethical Related Actions (KERAs) 224
4.15 CFA Model Fit Indicators 228
4.16 CFA Model – Reliability & Validity 229
4.17 KMO & Bartlett’s Results 230
4.18 Fit Indicators of adjusted model and reliability & validity 232
4.19 Communalities (EFA – OC Construct) 235
4.20 Total Variance Explained (EFA – OC Construct) 236
4.21 Pattern Matrixa (EFA – OC Construct) 237
4.22 Structure Matrix (EFA – OC Construct) 238
4.23 Factor Correlation Matrix (EFA – OC Construct) 239
4.24 Model Fit Indicators, Reliability & Validity (EFA Baseline Model – OC Construct)
239
4.25 Evolution of Model Fit Indicators and Validity & Reliability Indicators & Factor Structure of Final Model [OC - Construct]
241
4.26 Model Fit Indices 242

xii
Table Name Page
4.27 Mapping of Confirmed Factors – A theoretical perspective (OC) 243
4.28 KMO & Bartlett’s Results 245
4.29 Pattern Matrixa (EFA) 247
4.30 Evolution of Model Fit Indicators and Validity & Reliability Indicators & Factor Structure of Final Model [EOC Construct]
249
4.31 Items & Factors of EOC 250
4.32 Model Fit Indices 252
4.33 Mapping of Confirmed Factors – A theoretical perspective (EOC) 253
4.34 Model Fit Indicators including Validity and Reliability Indicators, and Factor Structure of CFA Alternative Model [ELDM Construct]
258
4.35 List of retained Items & Factors 259
4.36 Model Fit Indices 260
4.37 Model Fit Indicators, Validity & Reliability Indicators and Factor Structure of CFA Models [IEWP Construct]
264-5
4.38 Model Fit Indices 266
4.39 KMO & Bartlett’s Results 268
4.40 Communalities (EFA) – OCB Construct 270
4.41 Total Variance Explained (EFA) – OCB Construct 271
4.42 Factor Matrixa (EFA) – OCB Contruct 271
4.43 Pattern Matrixa (EFA) – OCB Construct 272
4.44 Structure Matrix (EFA) – OCB Construct 272
4.45 Factor Correlation Matrix (EFA) – OCB Construct 273
4.46 Evolution of Model Fit Indicators and Validity & Reliability Indicators & Factor Structure of Final Model [OCB Construct]
274
4.47 Model Fit Indices 275
4.48 Mapping of Confirmed Factors – A theoretical perspective (OCB) 276
4.49 Evolution of Model Fit Indicators and Validity & Reliability Indicators & Factor Structure of Final Model [EEBC Construct]
281
4.50 List of retained Items & Factors 282
4.51 Model Fit Indices 283
4.52 KMO & Bartlett’s Results 284
4.53 KMO & Bartlett’s Results 285
4.54 Communalities for PEP Items 285
4.55 Total Variance Explained for PEP Components 286
4.56 Component Matrixa of PEP Items – Single Component 287
4.57 Reliability Statistics – PEP Scale 287
4.58 Item-Total Statistics – PEP Scale 288
4.59 Underlying details of retained items by main & sub constructs 291
4.60 One Sample Statistics of the Seven Constructs 297
4.61 One Sample T-Tests of the Seven Constructs 297
4.62 ANOVA (Age Groups) 299
4.63 Post Hoc Tests (Age Groups) – Multiple Comparisons 300

xiii
Table Name Page
4.64 ANOVA (Socio-Economic Groups) 301
4.65 Post Hoc Tests (Socio-Economic Groups) – Multiple Comparisons 302
4.66 ANOVA (Industry Groups) 303
4.67 Post Hoc Tests (Industry Groups) – Multiple Comparison 304
4.68 Pearson Correlations of Seven Key Variables 305
4.69 Summary of Statistical Significance of Mediating Effects 343
4.70 Summary Assessment of Effect Sizes of Sub Models 343

xiv
LIST OF FIGURES
Figure Name Page
1.1 A preliminary compilation of key theory, model, components in relation to ethical climate, ethical leadership and decision making.
13
1.2 The conceptual research model within a macro-meso-micro framework. 21
1.3 Potential relevant instruments for the assessment of the independent, mediating and dependent variables.
25
1.4 Time plan for the research study. 34
2.1 The conceptual research model within a macro-meso-micro framework. 38
2.2 The GLOBE study – Clustering, strengths and weaknesses. 63
2.3 Leadership inclination. 64
2.4 Country classification by Trompenaar’s culture dimensions. 65
2.5 Shingo Model. 83
2.6 Ethical work climate types. 105
2.7 Comparative ethical decision making processes. 119
2.7b Stages of moral checks. 121
2.8 Ethical checks for leaders and managers. 121
2.9 An integrated decision making model. 122
2.10 Ethical decision making stages. 123
2.11 Global business ethics findings – The evolution since 1994. 141
2.12 Global findings and benchmark 143
2.13 Theoretical and empirical building blocks supporting the conceptual research model.
165
3.1 Identification of instruments/scales by key constructs of the conceptual research model.
177
3.2 Selected instruments/scales by key constructs of the conceptual research model.
179
3.3 Respective instruments’ details, rationale for selection and critics. 180
4.1 Ethical behaviour and conduct at the workplace. 220
4.2 Ethical behaviour and conduct at the workplace. 221
4.3 Analysis of pressure to compromise ethical standards, observed misconduct and experienced retaliation in the workplace in Mauritius compared to the global findings of ECI.
222
4.4 Conceptual research model of the present study. 225
4.4(a) Comparison of CFA base model and CFA of adjusted base model for OC construct.
233
4.5 Comparison of CFA of the EFA base model and CFA of adjusted EFA base model for OC construct.
240
4.6 Comparison of CFA of the EFA base model and CFA of adjusted EFA base model for OC construct.
248
4.7 The alternative CFA model for ELDM construct. 257
4.8 The adjusted CFA model for IEWP construct. 263

xv
Figure Name Page
4.9 Comparison of CFA of the EFA base model and CFA of adjusted EFA base model for OCB construct.
273
4.10 The adjusted CFA model of EEBC construct. 280
4.11 Underlying factor structure for measurement of constructs and Conceptual Research Model.
290
4.12 Normality assessment of measured OC and EOC constructs. 293
4.13 Normality assessment of measured ELDM and IEWP constructs. 294
4.14 Normality assessment of measured OCB and EEBC constructs. 295
4.15 Normality assessment of measured PEP construct. 296
4.16 Path analysis of model 1. 307
4.17 Path analysis of model 1. 308
4.18 Path analysis of model 1.1. 309
4.19 Path analysis of model 1.2. 310
4.20 Path analysis of model 1.3. 311
4.21 Path analysis of model 1.4. 312
4.22 Path analysis of model 2. 313
4.23 Path analysis of model 2. 314
4.24 Path analysis of model 2.1 315
4.25 Path analysis of model 2.2. 316
4.26 Path analysis of model 2.3. 317
4.27 Path analysis of model 2.4. 318
4.28 Path analysis of model 3. 319
4.29 Path analysis of model 3. 320
4.30 Path analysis of model 3.1. 321
4.31 Path analysis of model 3.2. 322
4.32 Path analysis of model 3.3. 323
4.33 Path analysis of model 3.4. 324
4.34 Path analysis of model 4. 325
4.35 Path analysis of model 4. 326
4.36 Path analysis of model 4.1. 327
4.37 Path analysis of model 4.2. 328
4.38 Path analysis of model 4.3. 329
4.39 Path analysis of model 4.4 330
4.40 Path analysis of model 5. 331
4.41 Path analysis of model 5. 332
4.42 Path analysis of model 5.1. 333
4.43 Path analysis of model 5.2. 334
4.44 Path analysis of model 5.3 335
4.45 Path analysis of model 5.4. 336
4.46 Path analysis of model 6. 337
4.47 Path analysis of model 6. 338
4.48 Path analysis of model 6.1. 339
4.49 Path analysis of model 6.2. 340
4.50 Path analysis of model 6.3. 341
4.51 Path analysis of model 6.4. 342
4.52 Path diagram of the Conceptual Research Model. 346

xvi
Figure Name Page
5.1 Emerging factors and tendency characterising the respective variables of the Conceptual Research Model prevailing in the business community of Mauritius.
379
5.2 Conceptual Research Model of the present study. 389
5.3 Ethical Climate Model for Organisational Citizenship Behaviour. 400
5.4 Classification of the nature of key ethics related actions. 404

1
CHAPTER 1: SCIENTIFIC ORIENTATION OF THE RESEARCH
1.1 INTRODUCTION
The concept of “culture” is based on a term first used in classical antiquity by the
Roman orator Cicero when he wrote on the cultivation of a soul “cultura animi” (Cicero,
ca. 45 B.C.E./1812, p.273). The term appeared first in its current sense in the 18th and
19th centuries to denote the process of cultivation or improvement. In the 19th
centuries, the term was developed to generally refer to the betterment of individuals
through learning. In the 20th century, “culture” emerged as a core concept of
anthropology whereby scientists generally adopted the definition of culture as applying
to all societies, literate and non-literate and settled and nomadic. The Cambridge
English Dictionary provides a simple but holistic definition of culture as being "the way
of life, especially the general customs and beliefs, of a particular group of people at a
particular time.” Over the years, the concept of culture spanned across societies,
communities and geographical boundaries as it projected learned behaviours in
diverse contexts. Through the study of patterns of thoughts and behaviours of
individuals and groups, one can determine the underlying driving forces that lead
people to live in a particular way within the society or organisation. Thus, a pattern of
collective behaviour and way of life is not only seen in a society or community but also
within organisations whether operating for a profit or social motive.
A very important component of behaviour of individuals or groups of people within an
organisation pertains to the philosophical theory on the nature of ethics. According to
MacIntyre (1998), ethics, which examines the right and wrong moral behaviour, moral
concepts and moral language, plays an instrumental role in the fulfilment of duty
towards stakeholders in a socio-economic context.

2
Over the past century and recent decades, organisations have been facing numerous
kinds of socio-economic challenges such as business survival, safeguarding of jobs,
value creation for the shareholders, keeping a balance between fulfilling employees’
demands and organisation’s quest for profitability, managing the dynamics of human
behaviour, and addressing ethical deviances amongst others. With the ever-growing
pressures from shareholders to maximise profits and keep value-creation on top of the
agenda, leaders have had to strike the right balance between attaining shareholder’s
goals and fulfilling their deontological duties of rightfulness, fairness, consistency to
moral duties, respect to human beings and their rights, and compliance to norms
amongst others (Ford, 2006; Knights & O’Leary, 2006). Over time, such economic
pressures have even led executives to relegate critical duties of leadership such as
managing with integrity, demonstrating ethical stewardship and fostering the right
working environment at the expense of financial rewards. Several research studies
have confirmed this finding. For instance, in a study conducted by the Institute of
Leadership and Management and Management Today, it was found that 50% of
respondents believed their organisations prioritised financial goals over ethics (The
Institute of Leadership and Management, 2011). In another survey undertaken by the
National Business Ethics Survey of Fortune 500 Employees, it was noted that “job
security” came out as the top source of internal pressure, and “meeting targets” as the
top source of external pressure influencing employees to compromise ethical
standards (Ethics Resource Centre, 2012). It could be noted that the ethical dimension
of leadership is drawing increased interest, especially with the recent upheavals
caused by unprecedented corporate scandals.
Studies into the relationship between ethics and leadership have noted over time that
leaders play an instrumental role in institutionalising values within the organisational
culture through the way they decide and act (Burns, 1978). The definition of ethical
leadership put forward by Brown, Trevino and Harrison (2005), as being “the
demonstration of normatively appropriate conduct through personal actions &
interpersonal relationships and the promotion of such conduct to followers through
two-way communication, reinforcement and decision making”, highlights influence of
leaders and their actions on their followers or team members. In an attempt to further
appreciate these underlying dynamics of human behaviour and conduct, scholars

3
have focused their attention on the use of the virtue approach (Arjoon, 2000; Sarros,
2006). This has therefore created awareness of the similarities and differences of a
moral person and moral manager (Cullia, 2005; Piccolo, Greenbaum, Den Hartog, et
al., 2010).
While existing researchers have established the linkages between ethics and
leadership there are nevertheless gaps that need to be bridged through further
research (Black & Morrison, 2014; Toor & Ofori, 2009; Victor & Cullen, 1998). This
would include policies and psychological climate and ethical leadership, performance
and leader-follower relationship (Sibiya et al., 2016; Niemeyer & Cavazotte, 2016).
Examples would be exploring the dynamics of ethical climate in respect of ethical
climate types and possible influence in business (Sibiya et al., 2016); exploring the
mediating and moderating variables such as trust, work environment, organisational
citizenship to better understand the relationship between ethical leadership and leader
effectiveness (Engelbrecht et al., 2017). Further instances would include evaluating
interrelationships and effects between elements within a conceptual macro-meso-
micro framework of business ethics (Li, 2012; Engelbrecht et al., 2017). These are
some key examples where further research studies will surely add value to the
community of scholars and professionals.
Considering the importance of creating the right work environment that would lead
employees to demonstrate ethical behaviour and conduct, motivate them to contribute
beyond their normal duties (organisation citizenship behaviour) and to perform for the
welfare of the organisation, there is a strong need to understand the underlying factors
that influence such ethical and citizenship behaviours within organisations. Attention
on employee ethical behaviour and organisational citizenship behaviour have lately
grown as businesses face more pressure to survive in the midst of fierce competitive
environment, globalisation and the recent advent of the pandemic of COVID-19. The
prevailing work culture and ethical climate in the organisation have important bearing
on how employees would behave, fulfil their duties and do beyond their usual job
descriptions. The role that business leaders play in the workplace, the way they act
and perform in the fulfilment of business goals, the way they are perceived by their
subordinates, and the prevalence of the nature and intensity of workplace pressures
are other key factors that influence employees’ ethical stance, citizenship behaviour

4
and performance. This research thus focuses on the study of these key components
so as to better understand the underlying dynamics and interplay within a structured
framework and provide crucial insights that can contribute to the business community
at large.
As the concept of ethics is complex in nature, it necessitates the adoption of a new
conceptual framework or paradigm to ease research in this sphere. Social scientists
can basically have recourse to four approaches to study such phenomena. These
could encompass a micro-theory based approach (focussing at the level of the
individual) or a macro-theory approach (focussing at the level of the nation, society or
institution). Alternatively, a micro-macro approach (focussing on the
interaction/integration of the micro and macro aspects), or a macro-meso-micro
approach (focussing on the interrelationship and effects of the intermediate/meso
components of ethical foundation) could be adopted (Jeurissen, 1997).
This study is proposed in light of the ever-growing ethical challenges being faced by
the business community and the need to apply new conceptual approaches to
addressing business ethics issues (Li, 2012). Its aim is to undertake an empirical study
to determine:
(a) The interrelationships and mediating effects of organisational ethics
components within the conceptual macro-meso-micro framework;
(b) The interrelationships between organisational culture, ethical organisational
climate, ethical leadership and decision making, workplace pressure and their
effects on organisational citizenship behaviour, employee ethical behaviour
and conduct, and perceived employee performance in a multi-cultural, multi-
industry and ‘large’ organisation context in Mauritius which is also
characterised by its economic, cultural, social and political specificities;
(c) The key ethics related actions that are viewed as critical for implementation in
the context being studied.
Through this research, it is expected that the findings will empower organisations and
practitioners, and also enable the development of a framework that will help in
promoting organisational citizenship behaviour and positive ethical behaviour and
performance amongst employees.

5
In summary, this chapter puts forward:
(a) A background on the various aspects and perspectives of scholars and
researchers on culture, organisational culture, ethics, ethical culture, ethical
climate, ethical leadership and decision making, workplace pressures,
organisational citizenship behaviour, and employee behaviour and conduct. It
also highlights challenges facing the research community, where gaps need to
be bridged with a view to contributing to the body of knowledge;
(b) An overview of the key problem statement which will be attended to through a
comprehensive study of ethical culture and climate components and their
interrelationships. This will examine their effects on organisational citizenship
behaviour, employee ethical behaviour and conduct, and perceived employee
performance. The effectiveness of key ethical related actions within the
organisation will also be assessed;
(c) A set of specific research questions that will be subjected to empirical studies,
analysis and interpretation with a view to attain the overall aim and objectives
of the study from general, literature and empirical perspectives;
(d) The research design and methodology to be adopted, the context and
boundaries in which the study was undertaken, and the statistical models and
techniques applied;
(e) Considerations which ensured that this study met all ethical imperatives; and
(f) A high level outline of the key chapters that would form the constituting
components of the thesis together with a high level plan guiding the study.

6
1.2 BACKGROUND INFORMATION
The way human beings and other species interact and live on earth is a topic of deep
interest for philosophers. If behavioural sciences and complex learned behavioural
patterns are explored from a broader perspective, it will be clear that the human race
is not the only species living through learned behaviour. Many other animal species
teach their young how to live and survive based on their own learning and existence.
All this makes the topic very interesting for behavioural scientists in what they have
coined as “culture”.
The word “culture” may mean different things for different groups. Whilst for some it
may be an appreciation of music, dance or food; for others in a biological sphere, it
may mean a colony of microorganisms growing in a laboratory for some specific tests.
For behavioural scientists it may simply be the learned human behaviour patterns.
Another way of understanding culture is to think of the “nature versus nurture” debate
that social scientists hold whereby “nature” refers to our biology or genetics and
“nurture” refers to our learned behaviours and other environmental factors influencing
our identities (Hernandez & Blazer, 2006). In a bid to establish the relationship,
academia has somewhat settled and acknowledged that “nature” and “nurture”
influence each other (Collins et al., 2000).
In his definition, Tylor (1871a, p.1) states that culture is “that complex whole which
includes knowledge, belief, art, law, morals, custom and any capabilities and habits
acquired by man as a member of society. Whilst culture will likely vary from continent
to continent, country to country or community to community, there is nevertheless
another perspective where it exists. This is ‘cultural universals’ where learned
behaviour patterns are shared by all humanity collectively (e.g. raising children in
family settings or distinguishing between good and bad behaviour).
Taking a macro level perspective of a human society down to a relatively micro level
of an organisation, culture will be a common factor dictating how individuals and
groups of people think, act and live in specific contexts. Understanding the importance
and dynamics of culture is thus central to the agenda of corporates.
7
An organisation depends heavily on its capabilities and resources to forge its path in
today’s competitive world. The way it models itself to respond to the challenging social,
political, economic, legal, and technological forces is critical for its survival and
sustaining performance (Schmieder-Ramirez, 2015). Furthermore, growing emphasis
is also being laid on intercultural elements as key issues that need deeper
consideration in properly managing organisational dynamics (Schmieder-Ramirez &
Mallette, 2007). Organisations now have to rely more on leadership philosophies,
organisational culture, ethical foundations, and execution approaches including
policies, procedures, codes and other control mechanisms to be able to survive the
competition.
This issue is not only relevant to business communities but also to non-profit
organisations including governing bodies, public administration and groups of people
working for a purpose or mission (Stare & Klun, 2016).
Today, human capital is proving not only to be a critical ingredient for organisational
effectiveness or for gaining competitive edge but also to successfully surmount
turbulent moments of economic crisis or the effects of globalisation (Phillips & Phillips,
2015). With the recent outbreak of the pandemic, sanitary issues have added to the
host of challenges that organisations will need to manage and adapt with a “new
normal”. The success of an organisation depends heavily on the capabilities of its
human capital and the strategies being implemented. However, the way people think,
act and operate within an organisation plays an even more fundamental role in
creating the right platform for addressing business challenges and attaining success.
Experts such as Kotter (1992), Hofstede (2010), Schein (2010) and Edmondson
(2012) refer to this as “organisational culture”.
Over the years, many sociologists and anthropologists have proposed various
definitions of culture. Edmondson defines culture as “a shared product of shared
learning” (Edmondson, 2012). This considers the kind of learning that has taken place
over time by conducting a historical analysis to decipher patterns that could explain
behaviours of a group. Van Maanen and Kunda (1989) defined culture as “a
mechanism of social control and can be the basis of explicitly manipulating members
into perceiving, thinking, and feeling in certain ways”. Schein & Schein (2017) uses a

8
representation of the “Lily Pond” to analyse culture in three levels. This is comprised
of:
(a) the visible and feelable aspects, termed as the “artifacts”, such as the physical
environment, observed behaviour, style, clothing ;
(b) the “espoused beliefs and values” which demonstrate the ideologies and the
underlying belief and value system of a group; and
(c) the ground-rooted “basic underlying assumptions” which provides its members
with a basic sense of identity (Hatch & Schultz, 2004) on who they are, how to
behave with each other, how to feel about themselves, and what kind of actions
to take in different circumstances.
Whilst various experts have provided views on the components of culture, they
nevertheless tend to converge towards aspects such as beliefs, values, behaviours,
feelings, perceptions, philosophy, norms, rules and rituals, which when tied together
make a coherent whole (Weick, 1995). These attributes are generally considered as
non-negotiable assumptions (Schein & Schein, 2017).
In a nutshell, culture is the personality or character of an organisation which can be
gauged through behaviour, attitudes and decision making processes. Culture plays a
pivotal role as to how the organisation develops talents, delivers service to its clients,
interacts with its stakeholders and adapts to the “new normal” post the pandemic.
When the underlying assumptions are shared amongst team members, they are
reinforced. Newcomers learn the implicit rules to integrate with the professional or
social group (Mayer et al., 2008).
Trompenaars’ model of national culture differences reinforces the theory of culture, its
dimensions and orientations (Trompenaars & Hampden-Turner, 1997). Culture will
tend to vary from country to country, organisation to organisation and group to group.
Culture can even vary within the same industry. For example, IBM and Apple are two
flagship technology brands in the global space. Whilst the former places strong
emphasis on the formality aspects exemplified with formal dress codes (dark suits,
white shirts and polished shoes), Apple, on the other hand, favoured simplicity and
informality with employees allowed to dress in T-shirts, jeans and tennis shoes (Morris,
1997). With the advent of internet and social networking, one can also note
behavioural changes in respect of telecommuting, cooperation and networking across
9
geographical boundaries. The emergence of new trends and social habits is calling for
people across the globe to evolve and adapt differently.
A question that often comes to light is how culture is formed, nurtured, maintained or
evolved? It all starts from the ground-rooted goals, values, norms and formal
philosophies set by the founder or leader of an organisation or group. Leaders create
new cultures and gradually shift to maintaining and consolidating them (Schein &
Schein, 2017). Some even change such cultures over time to suit their leadership style
and vision. Such foundations dictate the kind of desired characteristics of leadership
required over the lifetime of a business. This has also been coined as “forming,
storming, norming, and performing” (Tuchman, 1965). Leadership demonstrates the
key role in finding one’s identity and role, resolving differences and confrontations
through authority and influence, harnessing everyone to understand and appreciate
each other, and finally ensuring consensus is reached so as to attain the goal.
Leaders influence culture in a number of ways through their vision, behaviours and
decisions. Executives in organisations also tend to rely on their human resource
managers to uphold culture change or reinforcement programmes that could be
executed so as to engage their team members and guide them in a consistent way in
meeting business goals. Key matters need priority attention of the leaders such as
execution of strategies to ensure financial success of the organisation, growing
shareholders’ value, gaining market share, upholding brand and reputation, managing
the dynamics of globalisation, improving bottom lines, retaining talents, etc.. This has
caused leaders to consciously or unconsciously, relegate other very important
elements such as fostering the right culture within their organisations to a relatively
lower priority (The Institute of Leadership and Management, 2011).
The globe is facing unprecedented waves of challenges from globalisation (Black &
Morrison, 2014) or the effects of changing climatic conditions (IEG The World Bank,
2010). Disruptive economic environments have arisen from financial crisis (Flynn,
2012); and diplomatic power struggles, war, and the recent pandemic, to the ever-
changing ways of how people think, act and behave in the society at large (Mulroy &
Austin, 2004).

10
The financial disaster of 2008 brought down the U.S economy and others around the
world (Ciro, 2012). The further surfacing of several other cross industry global
scandals such as Citigroup’s role in the collapse of WorldCom in 2002 (English, 2004;
Wilmarth, 2013) have placed the spot light on “ethics” and “ethical behaviour”. Similar
examples were, AON being fined for bribery issues in 2009 (Treanor, 2009);
Alibaba.com’s fraud by sellers in 2011 (Lee & Chao, 2011) and Toshiba’s accounting
and the FIFA scandals, and the likes.
Ethics, which is commonly defined as “a set of moral principles or values”, has
recurrently been a passionate topic of debate amongst scholars, sociologists and
anthropologists. Ethics and moral values found their origin from several holy books
and epic poems in various religions at the beginning of the world literature (Hare,
2014). Since then, and from ancient Greece through to the middle ages, ethics has
continually received the attention of philosophers and scholars. In the 18th century,
Kant (1959) introduced the principle of universalizability providing for the correct rules
for everyone to follow, referred to as the “Kantian ethics” (Lacewing, n.d.).
Subsequently, we saw the development of “utilitarianism” in the 19th century providing
another view of right actions as those that are likely to result in the greatest happiness
or maximum utility (Bredeson, 2012). In the 20th century, we also saw increasing
developments and debates on meta-ethics, applied and business ethics. Trevino and
Nelson provided their definitions of ethics comprised of “the principles, norms and
standards of conduct governing an individual or group” and laid emphasis on conduct
(Trevino & Nelson, 2014). Another view of “society’s perception of what is right or
wrong” was also covered (Parboteea & Cullen, 2013).
Internal and external pressure factors are causing a shift towards an ethical culture
within organisations. Internal pressures usually take the form of elements personal to
the individual such as his own survival, job security, meeting his financial obligations,
or his career. External pressures usually come in the form of meeting business targets
and goals, ensuring financial success of a company, value creation for the
shareholders, and the like. Business and competitive pressures, investors’ and
shareholders’ demands, supervision by authorities, political pressure, scandals, socio-
economic pressures, globalisation and the pandemic are a few examples of the
external forces causing a radical change in behaviour and thereby putting ethics at the

11
centre of the debate. Similarly, internal forces such as work pressures to meet
business targets and deadlines are also affecting professional conduct of leaders. In
Kaptein’s (2008) Corporate Ethical Virtues Model, an 8-virtue model can be used to
measure the ethical culture of organisations. Kaptein calls this “The Virtue of
Feasibility” whereby the setting of unrealisable targets tends to lead towards a higher
level of unethical behaviour (Kaptein, 2008). This also corresponds to the empirical
findings of Schweitzer et al. (2004) thereby highlighting the linkages and risk of high
performance goals leading to unethical behaviour by depleting self-regulatory
resources over time.
In the 2005 US Integrity Survey, it was found that 74% of the respondents had
witnessed unethical behaviour in their work group (KPMG, 2005). In a National
Business Ethics Survey of Fortune 500 employees conducted in 2011, it was noted
that 52% of workers had observed misconduct in America’s most powerful companies,
despite having ethics programs and standards in place (Ethics Resource Centre,
2012). In a bid to curtail events of unethical behaviour, practitioners and researchers
are focussing more on the role of leaders, as they should demonstrate the highest
level of ethical conduct and be projected as the role model for their followers (Toor &
Ofori, 2009). The ethical climate represents the general perception of employees on
the prevalence of ethical behaviour within the organisation and also has a crucial
bearing on how employees behave (Victor & Cullen, 1998). All these issues of
observed misconduct, workplace pressures and ethical deviances are increasingly
calling for further attention to the concept of “ethical leadership” (Mayer et al., 2009).
According to studies conducted by Mayer et al. (2009), an ethical leader lives and
demonstrates key qualities of integrity, trustworthiness, fairness, care, and behaves
ethically. Almost similar traits were also found and reported by Brown et al. (Brown,
Trevino & Harrison, 2005). In another study undertaken earlier by Ethics Resource
Centre (2015), it was found that certain ethical related actions such as “leaders and
managers setting out good example of ethical conduct (“walk the talk”)”, “keeping
promises and commitments”, and “supporting others in adhering to ethical standards”
had a greater impact compared to other ethical related actions such as
“communicating the importance of ethics to employees, etc.” (Seliigson & Choie,
2006).

12
The phenomenon of ethical culture and climate is far reaching in terms of its
implications and impact, and warrants a deeper understanding of its theories, models
and associated constituent parts so that the whole dynamics can be understood. In a
bid to present a preliminary overview of the domain (theory, model and components
in relation to ethical climate, ethical leadership and decision making), a schematic
representation, as shown in Figure 1.1 on page 13 of the thesis, has been put forward
based on the outcomes of the short literature, so far. These building blocks will form
the basis for a deeper literature review in the context of this study. In particular,
understanding the dynamics of ethical climate types, the prevailing ethical virtues and
ethical decision making are bases for further literature review.

13
Figure 1.1. A preliminary compilation of key theory, model, components in relation to ethical climate,
ethical leadership and decision making.
Ethical Climate / Ethical Organisational ClimateTheory – Model – Types - Components
Ethical Virtues Model(Kaptein,2008)
5 Stages in Cognitive Moral Development
1. Authority/Fear of Punishment(You do what you are told to avoid
punishment)
2. Self Interests(You scratch my, I scratch yours)
3. Expectations of others (Decisions are made to please
other people and society)
4. Rules and Law stage (Follow the laws and regulations)
5. Principled stage(Base decision on ethical
principles of right or wrong)
6. Universal Ethical Principles(Follow universal ethical
principles)
Ethical Culture Components(Caroll,1998)
8 Ethical Virtues Model for Corporate
1. Virtue of Clarity(Lack of clarity is an antecedent of
unethical behaviour)
2. Virtue of Consistency of Management
(Bad Role Modelling of Top Management leading to unethical
behaviour)
3. Virtue of Consistency of Supervisor
(Contradiction lead to inconsistent signal to subordinates)
4. Virtue of Feasibility(Unreasonable targets, pressures
at the expense of ethical standards)
5. Virtue of Supportability
(Readiness to support to comply to ethical standards)
6. Virtue of Transparency(Expose unethical behaviour as a
deterrent)
7. Virtue of Discussability(Freedom to raise ethical
dilemmas)
8. Virtue of Sanctionability(Punishment of unethical
behaviour & reward ethical actions)
Ethical Climate Types(Victor & Cullen,1998)
Ethical Theory & Locus of Analysis
Theory: Egoism (What is good for oneself)
Locus of Analysis: Instrumental – Market Efficiency as a result of
companies acting under the rule of law and in their own self -interest
create an efficient economic system
Theory: Benevolence(Norms that encourage people to make ethical decision making for
welfare of others, team & members)
Locus of Analysis:Caring – Social Responsibility
Theory: Principle (Deontology)(Encourage people to make
ethical decisions based on a set of standards)
Locus of Analysis: Independence-Rules/Codes/
External Laws & Codes
Ethical Judgement Theory(Kohlberg,1969)
10 Key Components
Top Management Leadership
Code of Conduct
Ethics Program
Realistic Objectives
Process of Ethical Decision Making
Effective Communication
Disciplining of Ethics Violation
Ethics Training
Ethics Audit
Use of Whistle-blowing Mechanism
Ethical Leadership & Decision MakingCore Attributes – Decision Making Process – Ethical Checks & Decisions
Decision Making Process(Trevino & Nelson,2008)
Ethical Leadership Attributes(Yeki at al,2013)
Ethical Checks(Blanchard & Peale,1988)
Ethical Decision Making(Petrick & Quinnn,1997)
5 Reasons for Managers to Improve Ethical Decision
Making
1. Cost of unethical workplace conduct
2. Lack of awareness of ethically questionable,
managerial, role-related acts
3. Widespread erosion of integrity and exposure to ethical
risk
4. Global corruption pressures that threaten managerial and
organisational reputation
5. Beliefs of increased profitability and intrinsically
desirable organisational order
Ethical Decision Making Process
Ethical Awareness
Ethical Judgement
Ethical Behaviours
Influenced by: Characteristics of Individuals
(Individual differences & cognitive bases)
&Characteristics of
Organisations (Organisational pressure &
Culture)
The 3-Ethics Checks for Leaders/Managers
1. Is it Legal?(Will I be violating either civil law
or company policy?)
2. Is it balanced?(Is it fair to all concerned in the short and long term? Does it
promote win-win relationship?
3. How will it make me feel about myself?
(Will it make me proud? Would I feel good if the decision was
published? Would I feel proud if my family knew about it?
7 Core Attributes associated with Ethical Leadership
Honesty
Integrity
Fairness
Ethical-Value
Communication to Subordinates
Consistency
Altruism
Ethical Guidance of Subordinates

14
Researchers such as Dopfer et al. (2004) have elaborated a universal model, the
conceptual “macro-meso-micro” framework, to help in the analysis of economic and
organisational systems in three distinct levels.
In the context of this study, the “micro” aspects focus on the rules, systems, attitudes,
organisational citizenship behaviour, employee ethical behaviour and perceived
employee performance. The “meso” layer concerns aspects such ethical leadership,
decision making, work pressure, organisational policies, procedures and practices,
etc. Focusing on the broader organisational culture, ethical climate, industry or market
aspects would represent the “macro” layer. To better understand these dynamics,
researchers are gearing their attention more and more towards understanding the
interrelationships between key elements within the conceptual macro-meso-micro
framework (Li, 2012).
In an empirical study conducted by Kaptein (2008a) in multiple work settings through
a western European university, it was noted that six out of the eight dimensions of
ethical culture (Corporate Ethical Virtues Model) that were tested had a significant
negative relationship with the frequency of observed unethical behaviour within the
work groups (Kaptein, 2008a). In other words, the majority of the virtues of ethical
culture proved to be countering unethical behaviour materially in the corporate context
where the study was undertaken. However, they were not significant for dimensions
of clarity, transparency and sanctionability by rewards.
Research conducted in Spain by Ruiz-Palomino and Martinez-Canas (2011) found
that employees’ ethical behaviours are positively affected by top management role
modelling, but, unexpectedly, remained unaffected by sanctioning behaviour. It also
confirms that ethics should flow from the top-down, thus emphasising the requirements
for exemplary ethical conduct of top management in order for ethics to pervade the
organisation.
Lu and Lin (2014) examined, in the international port context, the effects of ethical
leadership and ethical climate on employee ethical behaviour. The study findings
revealed the mediating effect of ethical climate on the relationship between ethical
leadership and employee ethical behaviour. This study also highlighted the research
gaps that need to be bridged in examining the relationships between ethical climate,

15
organisational culture, job performance and supervisor influence, and particularly
behaviours or attitudes leading to misconduct.
In 2014, similar research focussed on understanding the relationship between ethical
leadership, employees’ in-role job performance, the mediating effects of goal
congruence and psychological capital (Bouckenooghe et al., 2015).The study also
highlighted that organisations should treat ethics as a prime pillar of the foundation
when building organisational culture and that ethical leadership indirectly affects the
performance of followers. In a bid to contribute towards the body of knowledge, it was
suggested that researchers should try to develop more inclusive models that refine the
predictions of mediator variables follower-leader goal congruence and psychological
capital.
Smith (1983) and Organ (1988) shed light on the concept of Organisational Citizenship
Behaviour (OCB) which fosters a positive working environment that calls for the
employees to surpass the minimum role requirements expected (Alizadeh et al., 2012;
Organ & Konovsky, 1989; Smith et al., 1983). This was achieved through employees
doing more than their usual job descriptions and assigned duties, and by helping other
teams, volunteering for extra work, avoiding unnecessary conflicts, respecting the
spirit and letters of rules and regulations and gracefully tolerating occasional work-
related impositions and nuisances (Robbins & Judge, 2013). With the growing need
for employees to embrace a citizenship behaviour thereby demonstrating an attitude
and willingness of doing beyond their normal job descriptions, more so, in a context
characterised by the “new normal” led by the recent pandemic (e.g. to fully collaborate
and deliver from home or as a front line resource in the midst of the prevailing sanitary
risks), the study of factors influencing OCB becomes even more pressing today. One
of the most recent studies conducted on OCB in Mauritius has examined the mediating
role of OCB on job satisfaction and performance of employees in the hospitality
industry (Ramesh & Goolaup, 2020). However, the assessment of OCB as a
dependent variable is yet to be undertaken in the local context. Furthermore, whilst
researchers have established the relationship between OCB and job performance, the
influences of ethical leadership and decision making and internal and external work
pressures on OCB have to be studied further in a multi-cultural context.

16
In a more recent study conducted by Grobler (2016), the ethical climate typology of
the Ethical Climate Questionnaire (ECQ) was analysed with a view to develop a
distinctive typology for the South African context. Exploratory factor analysis was
applied on the initial nine and subsequently five ethical climate typologies, considered
as the norm in the study of ethical climate (Martin & Cullen, 2006). This resulted in a
refined three ethical climate typology namely Institutionalised ethics, Instrumental and
Personal morality. These were tested for equivalence in the private and public sectors
and were found to be equal. This research calls for further study and analysis to
determine the consequences of the ethical climate types for organisational and
individual behaviour as well as their being possible precursors to ethical climate.
Walumbwa et al. (2017) examined the mediating influence of group ethical conduct,
justice climate and peer justice. Their study revealed that ethical leadership directly
and indirectly promotes an ethical and fairness-based context that promotes group
learning behaviour. It is suggested that future research integrates team performance
as a criterion variable which may partially result from learning, and worker well-being
and which may partially result from justice.

17
1.3 PROBLEM STATEMENT
Despite the existence of comprehensive legislation to combat crime at large, illegal
actions are still occurring in large numbers and are reported across the globe (OECD,
2016). Similarly, despite the establishment of governance and control systems, codes
of conduct, policies and procedures, and other management systems, organisations
are still faced with ethical issues thus making this whole phenomenon a topic for
research concern to understand its underlying causes (Ethics Resource Centre, 2012;
PwC, 2016).
Furthermore, the review of current literature on organisational culture, ethical culture,
ethical climate, ethical leadership and decision making, individual and group
behavioural dynamics, pressure factors, organisational and employee performance,
and the interrelationship of these components highlights the following key research
problems:
(a) The relationship between ethics and leadership has been studied by scholars
for quite some time (Burns, 1978; Deconinck et al., 2016), yet the world
continues to face major socio-economic challenges due to ethical issues
(Huang & Paterson, 2017). Therefore, the ethical dimension to leadership has
to receive further research attention in the midst of such mounting challenges
especially in areas of organisational ethics.
(b) Theoretical models have yet to determine whether mediation effects between
organisational ethics components within a conceptual macro-meso-micro
framework remain constant across different contexts, organisations and groups
of individuals (Grobler & Grobler, 2016).
(c) The need exists to determine the relationship between the organisational
culture and ethical organisational climate in a context that is largely
characterised by a plurality of cultures.
(d) The need exists to determine the interrelationships between organisational
culture, ethical organisational climate, ethical leadership and decision making,
internal and external workplace pressures, and their effects on organisational

18
citizenship behaviour, employee ethical behaviour and conduct, and perceived
employee performance in a cross-industry multi-cultural context.
(e) The need exists to evaluate the extent to which ethical related actions are
viewed as critical and which meso components influence the organisational
citizenship behaviour, employee ethical behaviour and conduct, and perceived
employee performance the most.
(f) A necessity for the development of a new or improved framework or model that
would enable enhanced ethical business practices and performance in a
dynamic context is largely influenced by internal and external pressures
compromising ethical standards.
(g) A need to put forward appropriate recommendations for the business
community with a view to further equipping them against ever-mounting ethical
challenges and addressing such dilemmas in a context is largely characterised
by a plurality of cultures.
From ontological and epistemological perspectives, leaders, practitioners, scholars,
organisational psychologists, sociologists and anthropologists need further knowledge
about the theoretical and observed contextual on-the-ground realities and their
interrelationships.
Research has been conducted in different countries relevant to the current areas of
interest. However, a study specifically orientated towards the assessment of
organisational culture, ethical organisational climate, ethical leadership and decision
making, workplace pressures, organisational citizenship, employee behaviour and
performance, as an interconnected unit, has not been yet been done in the multi-
cultural and cross-industry context of Mauritius. Given the economic, cultural, social
and political specificities of Mauritius, the study will go a long way in enlightening key
stakeholders about the interrelationships and dynamics of these variables in such a
context.

19
1.4 RESEARCH QUESTIONS
On the basis of the literature review, gaps identified and research goals, the following
research questions were put forward:
Research Question 1: How are the ethical context variables (organisational
culture and ethical organisational climate) conceptualised and explained by the
theoretical models in the literature?
Research Question 2: How are the mediating variables (ethical leadership and
decision making, and internal and external workplace pressures) conceptualised
and explained by the theoretical models in the literature?
Research Question 3: What is the nature of the theoretical and observed
interrelationship between the ethical context (organisational culture and ethical
organisational climate as independent variables) and mediating variables (ethical
leadership and decision making, and internal and external workplace pressures),
and their effects on organisational citizenship behaviour, employee ethical
behaviour and conduct, and perceived employee performance?
Research Question 4: Which of the key meso components (ethical leadership and
decision making, and internal and external workplace pressures) and ethical
related actions influence the organisational citizenship behaviour, employee ethical
behaviour and conduct, and perceived employee performance the most?
Research Question 5: Can a scientific theoretical model be constructed or
customised on the relationship between ethical context independent variables
(organisational culture and ethical organisational climate) and mediating variables
(ethical leadership and decision making, and internal and external workplace
pressures) with a view to empower organisations and practitioners to develop
appropriate strategies and processes to promote positive employee citizenship
behaviour, ethical conduct and performance at large?
Research Question 6: What are the key recommendations emanating from the
research findings for stakeholders, in the multi-cultural and cross-industry context
of Mauritius, to institutionalise through a framework or model that would provide
critical ethical levers influencing positive ethical behaviour and performance for the
success of organisations?

20
1.5 RESEARCH AIMS & OBJECTIVES
In view of the research questions formulated above, the aims and objectives of this
study were 3-fold as follows:
1.5.1 General aim
The general aim was to research, devise, construct and test a framework or
model that would empower organisations and practitioners and allow them to
identify, measure and manage key contextual ethical levers promoting positive
ethical behaviour and performance.
1.5.2 Specific aims from a literature review standpoint
The research aims, from a literature review perspective were as follows:
Research aim 1: To generally and theoretically explore the concept of
national culture, organisational culture, ethical organisational climate, ethical
leadership and decision making, internal and external workplace pressures,
organisational citizenship behaviour, employee ethical behaviour and
conduct, and perceived employee performance, their interrelationships and
the variables that influenced them.
Research aim 2: To theoretically explore the ethical context independent
variables conceptualised as organisational culture, ethical organisational
climate and the variables that influenced these constructs.
Research aim 3: To theoretically explore the ethical mediating variables
conceptualised as ethical leadership and decision making, and internal and
external workplace pressures, and the variables that affected these
constructs.
Research aim 4: To theoretically explore and assess the nature of the
relationship between the macro and meso components and subsequently
assess interrelationships between the ethical context independent variables
and ethical mediating variables and their effects on organisational citizenship
behaviour, employee ethical behaviour and conduct, and perceived
employee performance.

21
Ethical Leadership
& Decision Making
Internal & External
Workplace
Pressures
Ethical
Organisational
ClimatePerceived
Employee
Performance
Employee Ethical
Behaviour &
Conduct
Organisational
Citizenship
BehaviourOrganisational
Culture
macro meso micro
Figure 1.2. The conceptual research model within a macro-meso-micro framework.
Research aim 5: To theoretically explore and assess the importance of key
ethics related actions (imperatives and interventions) such as the
institutionalisation of an ethics structure and systems within the organisation
and how they could lead to organisational citizenship behaviour, employee
ethical behaviour and conduct, and perceived employee performance in the
workplace.
1.5.3 Specific aims from an empirical study perspective
From an empirical study viewpoint and as manifested in a sample of respondents
in a multi-cultural and cross-industry environment of Mauritius, the research aims
were as follows:
(a) How did the ethical organisational culture, climate and standards in
Mauritius compare with the global perspective?
(b) What were the key ethical climate types found, their characteristics,
specificities and how were they related to the variables under study?
(c) What were the most common internal and external workplace pressures
faced by organisations which could compromise ethical behaviour and
standards?
(d) Which were the most influential / impactful workplace pressure factors?
(e) What was the statistical relationship between organisational culture and
ethical organisational climate?

22
(f) What was the statistical relationship between the mediating variables of
ethical leadership and decision making, and internal and external
workplace pressures?
(g) What was the nature of the theoretical and observed interrelationships
between the ethical context (organisational culture and ethical
organisational climate as independent variables) and mediating variables
(ethical leadership and decision making, and internal and external
workplace pressures), and their effects on organisational citizenship
behaviour, employee ethical behaviour and conduct, and perceived
employee performance?
(h) Did the employees’ perception and behaviour in relation to organisational
culture, ethical leadership and decision making, internal and external
workplace pressures, and organisational citizenship behaviour remain
constant across different groups (age, industry and socio economic)?
(i) Which of the key meso components (ethical leadership and decision
making, and internal and external workplaces pressures) and ethical
related actions influence the organisational citizenship behaviour,
employee ethical behaviour and conduct and perceived employee
performance the most?
(j) Was there a good fit between the elements of the empirically manifested
structural model and the theoretically hypothesised model?

23
1.6 RESEARCH DESIGN & METHODOLOGY
Each and every research project has to be designed with a view to attaining its set
goals. Research design basically describes the strategy undertaken. Trafford and
Leshem specify “the act of designing research involves a critical thinking process to
determine how the research is to be undertaken” (Trafford & Leshem, 2012). Research
design integrates the strategy and methodological aspects to guide the research work.
The choice of research design is therefore fundamental to the overall process as it will
play a central role in linking the “what” and “how” aspects of the investigation and
fieldwork.
1.6.1 Research Methods
The two major research methods are quantitative and qualitative. Williams (1992)
refers to them as the two major methodological research traditions. Quantitative
methods are used when the study needs to be measured and hypotheses have to be
tested. They basically rely on testing theoretical propositions using the scientific
methods. Babbie and Mouton (2009) highlighted the main features of a quantitative
research approach as laying emphasis on the ‘quantification of the constructs’
variables in describing and analysing human behaviour. On the other hand, qualitative
methods enable building of a holistic picture, thereby reporting detailed views of
informants conducted in a natural environment (Cresswell, 1994).
Amongst the various types of research comprising of lab experiments, field
experiments, field studies and survey research, the latter is often used by researchers
to determine the characteristics of a population so that inferences can be made about
it. Kerlinger (1986) highlights that surveys usually focus on the “vital facts of people,
their beliefs, opinions, attitudes, motivations and behaviours, and generally are cross-
sectional in nature.”
The type of research is usually determined by the research questions to be answered.
For the purpose of the present study, and considering its pre-determined and
exploratory nature, a positivist approach (quantitative method) was used. A survey
strategy, as explained below, was adopted and deployed with a view to collecting

24
relevant data from a carefully devised sampling of Mauritian corporates operating
across industries.
1.6.2 Proposed Instrument
The foundation of good research work relies heavily on the quality of data, usually
assessed in terms of validity and reliability. It also depends on how data are gathered,
analysed, measured and assessed. To support this process, research instruments
such as surveys are used. Survey research grew within a positivist approach to social
science (Carr-Hill & Roy, 1984). Surveys, which may take the form of questionnaires,
internet polls or phone interviews, ease the collection of characteristics, opinions,
beliefs and behaviours from large samples when researching on culture and
behaviour. The questionnaire stands as one of the most widely used techniques for
data collection especially when large number of people have to be surveyed with
diverse set of variables (Neuman, 2013). The design of new, well adapted and
appropriate questionnaires is central to the effectiveness of the data collection process
and its subsequent phases of analysis and testing. In the context of this study,
measurements were undertaken from two perspectives namely: (a) organisational
culture; (b) ethical aspects.
Various types of questionnaires for the measurement of organisational culture, ethical
climate, ethical leadership and associated variables have appeared and are being
used by scholars and researchers in various contexts (Yukl et al., 2013). Some of the
key questionnaires and measurement scales relevant to the present study have been
compiled, as shown in Figure 1.3 on page 25 of thesis, during the short literature
review. This has helped to determine their potential relevance for measuring the
proposed macro, meso and micro variables under study (Charles & Harrison, 2010;
Cullen, Victor, & Bronson, 1993; Kalshoven, Den Hartog, & De Hoogh, 2011; Kaptein,
2008a; Most, 2005; Novelskaite, 2014; Sashkin & Rosenbach, 2013; Yukl et al., 2013).

25
1. Organisational Citizenship
Behaviour Scales
(Podsakoff & MacKenzie, 1994)
(Smith, Organ & Near, 1983)
(Lamber & Hogan, 2013)
2. Behavioural Intentions Scale of
Organisational Citizenship
(Menezes et al., 2016)
1. Corporate Culture Questionnaire
(Walker, Simon & Davies, 1996)
2. Organisational Culture Inventory
(Cooke & Lafferty, 1987)
3. Survey of Organisational Culture
(Tucker, McCoy & Evans, 1990)
4. Questionnaire Harrison & Handy
(Harrison & Handy, 2010)
5. Organisational Culture
Assessment Instrument
(Cameron & Quinn, 2006)
6. Organisational Culture Survey
(Glaser, Zamanou & Hacker, 1987)
7. Organisational Culture
Assessment Questionnaire
(Sashkin & Rosenbach, 2013)
8. Hofstede s Organisational Culture
Questionnaire
Hofstede et al.,1990)
macro
Ethical Organisational Climate
Organisational Culture
1. Ethical Climate Questionnaire
(Victor & Cullen, 1988)
2. Ethical Position Questionnaire
(Forsyth, 1980)
3. Attitude Towards Business Ethics
Questionnaire
(Newmann & Reichel,1987)
4. Corporate Ethical Value Scale
(Hunt et al., 1989)
5. Corporate Ethical Virtues
Questionnaire
(Kaptein, 2008)
6.Perceived Role of Ethics & Social
Responsibility Scale
(Singhapakdi et al., 1996)
1. Authentic Leadership
Questionnaire
(Avolio, Gardner & Walumbwa, 2011)
2. Ethical Leadership Scales
(Institute of Ethical Leadership, 2007)
3. Perceived Leader Integrity Scale
(Graig & Gustafson, 1998)
4. Ethical Leadership at Work
Questionnaire
(Kalshoven,De Hoogh & Hartog, 2011)
5. Servant Leadership Questionnaire
(Barbuto & Wheeler, 2006)
6. The Defining Issues Test
(Rest, 1986)
7. Multidimensional Ethics Scale
(Reidenbach & Robin, 1990)
8. Moral Reasoning Inventory
(Weber & Mc Given, 2010).
Ethical Leadership & Decision
Making
meso
1. Workplace Ethics Questionnaire
(Baylor University, n.d)
2. Areas of Worklife Survey
(Maslash & Leiten, 2000)
Internal & External Workplace
Pressures
Organisational Citizenship Behaviour
micro
1.Ethical Attitudes Survey
(Fritzsche & Becker, 1984)
(Jones & Gautschi, 1988)
2. Moral Potency Questionnaire
(Hannah & Avolio, 2010)
3. Ethical Dilemma Vignettes
(Lysonski & Gaidis, 1991)
4. Money Belief & Behaviour Scale
(Kirkcaldy & Furnham, 1993)
Employee Ethical Behaviour &
Conduct
1. Teseema & Soeters Questionnaire
(2006)
2. Performance Rating Scale
(Pestonjee & Singh, 1988)
3. Perceived Organisational
Performance Scale
(Delaney & Heselid, 1996)
4. Perceived Performance Scale
(PE Konsult, 2016)
Perceived Employee Performance
Figure 1.3. Potential relevant instruments for the assessment of the independent, mediating and
dependent variables.
The above listed instruments focus on multiple and diverse culture dimensions. It is
therefore fundamental to factor the appropriate instruments into the design to ensure
compatibility between the instrument and the aims, model and constructs of the
underlying study.

26
Considering the scope and complexity of the current study, it is unlikely that any single
instrument will suffice on its own to provide a valid and reliable assessment of the
effects of organisational culture and ethical organisational climate on the dependent
variables through the meso components.
For the purpose of this present research, a master questionnaire was put forward and
adapted based on valid and reliable instruments, having gained broad adoption
internationally (re. potential list of instruments provided in Figure 1.3 on page 25), to
measure the dimensions and variables being studied. An evaluation of these
instruments was undertaken and the valid and reliable set of items that most suit the
research objectives were used. The compiled questionnaire was marginally adapted
with the addition of few items to comprehensive cover and respond to the research
questions whilst retaining the underlying instruments’ validity and reliability strengths.
The use of the underlying instruments for this study was subject to all necessary
clearances being obtained from the developers. Furthermore, the reliability factor was
ascertained through the assessment of the Cronbach’s alpha coefficient (Brown,
2002).
1.6.3 Target Population
The present study focused on Mauritius, a country located in the Indian Ocean in the
so-called “golden triangle” connecting Africa, Asia and Australia.
The specificities of Mauritius make it a complex but interesting context characterised
by:
(a) Its plurality of cultures (originating primarily from Asian, African and European
continents);
(b) Its history which evolved from a colonial background to an independent
democratic republic state;
(c) Its economic, social, political and governance specificities;
(d) Its population of some 1.3 million inhabitants, country size and industry
diversification;

27
(e) Its high literacy level and strong economic development profile in the African
and global leagues. It is ranked 1st in Africa in the following Index (Economic
Development Board Mauritius, 2021):
World Bank Doing Business 2020
Global Competitive Index 2019
Mo Ibrahim Index of African Governance 2020
2018 Index of Economic Freedom
Social Progress Index 2019
Forbes Survey of Best Countries for Business 2019
Economic Freedom of the World 2020
Democracy Index 2019
Global Innovation Index 2020
International Property Rights Index 2019
The aim was to study “large” establishments in the multi-cultural and cross-industry
environment of Mauritius. In its report, Statistics Mauritius (2017), which is the official
government statistics body, reported its sixth census on economic activities from 2013
to 2015, with 2013 being the reference year. Such a census is conducted every 5
years with the last one undertaken in 2018. The 2013 census covered 127,000
establishments (referred to as ‘production units’) of which 2,200 (2%) were classified
as “large” establishments engaging at least 10 persons across various industries.
These were considered as the largest contributors to economic development of the
country; the remaining being small and itinerant engaging less than 10 persons.
Furthermore, the “small” establishments were relatively unstructured and in a majority
of cases were sole traders or smaller units of activities thereby making the “large”
establishments a better population for the research of the kind being envisaged.
The 2013 census did not provide a complete view as it did not cover “large”
establishments in certain specific industries such as agricultural, forestry, fishing and
others. In 2016, another survey conducted by the responsible government body
provided a broader and updated view of the population of ‘large’ establishments to
having reached 2,534 as shown in Table 1.1 on page 28 of the thesis (Statistics
Mauritius, 2017a):

28
Table 1.1
Large Establishments by Industry Group
No. Industry group No. of Production Units
1 Agriculture, forestry and fishing 110
2 Mining and quarrying 23
3 Manufacturing 585
4 Electricity, gas, steam and air conditioning supply 7
5 Water supply, sewerage, waste management and remediation activities 10
6 Construction 111
7 Wholesale and retail trade; repair of motor vehicles and motorcycles 457
8 Transportation and storage 90
9 Accommodation and food service activities 196
10 Information and communication 92
11 Financial and insurance activities 145
12 Real estate activities 33
13 Professional, scientific and technical activities 178
14 Administrative and support service activities 118
15 Public Administration and defence; compulsory social security 40
16 Education 176
17 Human health and social work activities 58
18 Arts, entertainment and recreation 74
19 Other Services 31
TOTAL 2,534
Note. Source: Digest of Labour Statistics 2016, Statistics Mauritius, Ministry of Finance & Economic
Development
Undertaking a pilot exercise was also considered necessary to test the effectiveness
of the process before embarking in a full data collection process.
1.6.4 Delimitations
The “small” establishments, that is, production units employing less than 10 persons,
did not form part of the study given their relatively unstructured nature, where the
majority of cases were either sole traders, one-man companies or smaller units of
activities with very limited structures and systems to suit the purpose of this study.

29
1.6.5 Sampling Method
Researchers generally have to choose between probability and non-probability
sampling methods. Whilst the former enables the researcher to make probability-
based confidence estimates of diverse parameters, the same cannot be said with non-
probability samples (Cooper & Schindler, 2014). Probability sample is often preferred
and considered as the “gold standard” for representative samples (Neuman, 2013).
For the context of this study, probability sampling design was favoured. Amongst the
various complex probability sampling techniques of Systematic, Stratified, Cluster &
Double sampling, the choice was funnelled down to Stratified and Cluster sampling,
the choice of which largely depended on the homogeneous or heterogeneous nature
of the groups being studied. Furthermore, the efficiency and precision gains offered
by cluster and stratified sampling respectively make them reliable choices.
Table 1.2
Target Population & Sampling
Target Population Based on ‘Large’ Establishments across industries in Mauritius (re. Table 1.1)
2,534
Sample Size Based on Target Population, Margin of Error of 5% & Confidence Level of 99%
526
Note. Source for target population: Digest of Labour Statistics 2016, Statistics Mauritius, Ministry of
Finance & Economic Development
1.6.6 Validity
The validity of a research study refers to the degree to which conclusions are sound
(Terre Blanche et al., 2006). Validity can be viewed from an internal or external
perspective. Whilst internal validity is the ability to eliminate alternative explanations
of the dependent variables, external validity is the ability to generalise research
findings to settings outside of the immediate context (Neuman, 2000). Appropriate
tests were undertaken in Chapters 3 and 4 to ensure the data set was valid.
1.6.7 Reliability
Gregory defines reliability as the consistency and dependability of the results of a
research study (Gregory, 2007). To ensure reliability, there is a strong need to ensure

30
clear conceptualisation of the constructs and precise measurements using various
indicators. The reliability assessment was undertaken in Chapters 3 and 4.
1.6.8 Variables
Variables are core to quantitative research as research investigations depend on their
possible values. Leedy and Ormrod (2010) define a variable as “any quality or
characteristic in research investigation that has two or more possible values”. The
effect analysis is performed through the study of the independent (predictor variables)
and the dependent (outcomes variables) both directly and through the mediating
variables. The relevant independent, mediating and dependent variables subject to
the present study have been conceptualised and presented in the table below:
Table 1.3
Examples of variables considered for the study
Independent (I) Variables Mediating (M) & Dependent (D) Variables
Ethical Organisational Climate (I) Ethical Leadership & Decision Making (M)
Internal & External Workplace Pressure (M)
Organisational Culture (I) Organisational Citizenship Behaviour (D)
Employee Ethical Behaviour & Conduct (D)
Perceived Employee Performance (D)
1.6.9 Statistical Models & Techniques
The present study aimed to empirically:
Assess the nature of the statistical relationships between the ethical context
independent variables;
Assess the nature of the statistical relationships between the ethical mediating
variables;
Determine the interrelationships between the ethical context independent
variables and ethical mediating variables and assess their effects on the
dependent variables;
To determine whether there was a good fit between the elements of the
empirically manifested structural model and the theoretically hypothesised
model.

31
Some of the statistical models and techniques used for the present empirical studies
were Descriptive Statistics (Trochim & William, 2006), Correlation Test, Multiple
Regression Test (Tabachnick & Fidell, 1996), Factor Analysis (Child, 2006), Goodness
of Fit, Path analysis and Cronbach alpha, as applicable for the empirical tests.
1.6.10 Statistical & Other Tools
The use of IBM SPSS and Amos Software Packages, Hayes’ Process Procedures for
SPSS and Microsoft Excel tools enabled the statistical computations and analyses
being undertaken. The Mendeley Desktop version 1.19.4 was used as a software tool
for referencing purposes and Turnitin for originality checking.
1.6.11 Limitations
The main limitations of the study were:
(a) Gaining access to the targeted respondents of the various industries and their
willingness to participate in the survey;
(b) The risk of having biased responses from the respondents due to the sensitive
nature of the study; and
(c) Limited empirical research information available in Mauritius in respect of the
topic under study.
1.6.12 Review of Professional & Academic Literature
The literature review undertaken includes a variety of educational and scholarly
resources accessible through the UNISA online library and databases including other
sources such as ResearchGate, ScienceDirect, EBSCOhost, ProQuest, Sage
Journals, SSRN and Ideas. A more in-depth literature review is conducted in the
subsequent chapter.
The research design and methodology is explained in further details in Chapter 3 of
the thesis.

32
1.7 ETHICAL CONSIDERATIONS
Irrespective of the research topic, whether covering scientific, social, economic
aspects or even ethics as a research subject, it is imperative for the researcher to
observe, recognise and consider all ethical aspects pertaining to the said research
(Neuman, 2013). This entails undertaking the research in an ethical manner whilst
observing all such requirements, legislation, codes, standards and factors in relation
to rights over the data and how can it be used, shared and protected. Some of the key
practical factors and ethical considerations for the present study were:
(a) The required clearances for the use of the relevant instruments for this study;
(b) The ethical issues involved with the choice of the topic and research methods
so that participation was made voluntarily, informed consent was obtained, and
rights of the respondents were upheld to withdraw their responses from the data
set should the need arise;
(c) The process to access the target group, gather the required relevant data and
how they were processed, used, reported whilst ensuring confidentiality and
non-disclosure was guaranteed;
(d) The commitment for authenticity in the research findings, providing of a fair view
of the outcomes and a pledge not to cause harm;
(e) The time and funding requirements influence the scale of the study and the
research methods being used. It was key to ensure that any funding raised
through sponsors did not, intentionally or unintentionally, cause infringement to
ethical standards. This issue was addressed by the research candidate through
self-funding the survey exercise and not having recourse to any sponsors.
Aspects such as conflict of interests were deeply observed and assessed in
such cases.
Appropriate care and diligence were taken to avoid any form of plagiarism by ensuring
all sources used during this research were acknowledged and referenced
appropriately. An extract of the Match Overview Result is appended as documentary
evidence of the outcome of the originality checking. The similarity index was found to
be reasonable and acceptable as it falls within the accepted requirements of originality.

33
1.8 CHAPTERISATION
The outlines of the main chapters are proposed as follows:
o Chapter 1: Scientific Orientation of the Research
This chapter provides an introduction of the thesis, problem statement, importance
and scope of the study. It summarises how the research is designed to respond to
the research questions both theoretically and empirically.
o Chapter 2: Literature Review
This chapter undertakes an in-depth review of the literature to better understand
the key underlying concepts, theories, models, constructs and empirical findings in
relation to the scope of this study. It enables to spot the specific research gaps and
frame a Conceptual Research Model to better evaluate and understand the
dynamics of the independent, mediating and dependent variables being studied.
o Chapter 3: Research Design & Methodology
This chapter formulates the research strategy and methodology to guide the
empirical study in the multi-cultural and cross-industry context of Mauritius, with a
view to fulfil the research objectives. The process for the selection and adaptation
of the required instruments to be used for the survey is explained including how
the survey will be undertaken. The proposed statistical analysis techniques
required to achieve the empirical aims of this study are also described.
o Chapter 4: Research Results & Interpretations
This chapter highlights the outcomes of the survey and the statistical significance
of the research results so as to draw appropriate interpretations on the state of
ethical culture, climate and practices, relationships and effects within the
Conceptual Research Model, and on how well the data fits the model.
o Chapter 5: Discussions, Recommendations & Conclusion
This chapter draws from the empirical findings to discuss and formulate appropriate
recommendations that will empower the business community to elevate ethical
standards and practices as well as foster organisational citizenship behaviour,
employee ethical behaviour and conduct, and performance.
o References - Listing of all references used in the thesis
o Appendices – Questionnaire used for the survey and other support documents

34
1.9 RESEARCH JOURNEY
The time plan that guided the conduct of the research, including its various stages in
the journey, is provided in Figure 1.4 below:
Short Literature Review, Prepare and Submit Research
Proposal to Supervisor for Review
March – October 2017
Tasks
Timeframe
Stage 1:
Present Proposal at Colloquium and Obtain Clearance to
Research
October – November 2017
Stage 2:
Conduct & Complete Comprehensive Literature
Review
November 2017 – October 2018
Stage 3:
Design Research & Develop Survey Kit
November 2018 - March 2019
Stage 4:
Prepare Submissions and Seek Research Ethics and Review
Committee s Clearance
April – August 2019
Stage 5:
Hire Specialist Firm to Conduct Survey & Undertake Data
Collection
September 2019 – February 2020
Stage 6:
Data Analysis & Interpretation
February – June 2020
Stage 7:
Discussions, Recommendations and Conclusions
Presentation to SBL Colloquium
July - October 2020
Stage 8:
Finalise Thesis, Conduct Language Editing and Submit to
Examining Panel
October – November 2020
Stage 9:
Assessment of Thesis by Examining Panel
December 2020 – May 2021
Stage 10:
Write Scientific Article from Thesis & submit to an Open
Access Journal for Peer Review & Publication
June 2021 (Planned)
Stage 11:
Stage 1 Stage 2 Stage 3 Stage 4
Stage 5 Stage 6 Stage 7 Stage 8
Stage 9 Stage 10 Stage 11
Figure 1.4. Time plan for the research study.

35
CHAPTER 2: LITERATURE REVIEW
2.1 INTRODUCTION
An organisation is commonly regarded as a collective unit of people organised to work
for a shared purpose, whether for an economic, social or political goal (Cambridge
Dictionary, 2018). Such organisations of people can often take various forms such as
a business, government, consortium, social institution, movement, federation, club,
society or simply a family. In all such settings, one will find common elements such as:
A context is often characterised by socio-economic and political settings;
A vision, purpose or goal which needs to be attained;
A leader whose role is to lead and guide towards attainment of the goal;
An approach, system or a way of doing things that is embraced collectively;
People with diverse profiles, values, abilities, behaviour, and motivation
forming an integral part of the collective unit to achieve something for the
organisation and also for their own good.
The above sets the scene of the key enabling factors that transform a simple group of
individuals into a collective functional organisation with capabilities to attain broad
objectives in a particular context. Each of these factors has its own vital bearing on the
overall dynamics of how the organisation will function as a collective unit in the
business community. This research work explored these vital factors, in a business
context, on the basis of sound theoretical concepts and empirical findings.
Business leaders play a fundamental role in shaping a particular culture in the
organisation whether formally (through policies, procedures, programs, systems, etc.)
or informally (through their behaviours, actions, role modelling, language and
communication, etc.). Thus, it is true that “leaders create, maintain or change the
cultural system by the way they say, do or support” (Trevino & Nelson, 2014, p. 156).
In other words, the way business leaders think, act, communicate, influence and direct
their employees shapes the cultural dimensions in both formal and informal ways. The
statement of Trevino and Nelson (2014) stems from the social learning theory whereby
human beings learn from one another and their behaviour is shaped through

36
observation, imitation and modelling (Bandura, 1977). In business organisations,
employees learn from their superiors and tend to mimic their behaviours as their role
models. Whilst under such conditions, one would tend to learn the good habits,
approaches and ways of doing things of their leaders, it is also true that the employees
would acquire any odd practices displayed by their bosses. The way the leaders
perform will therefore tend to dictate the organisational culture’s orientation and how
such culture, work environment and climate will evolve and be perceived by
employees (Patterson et al., 2005; Rousseau, 1988). Since the 1970s, several studies
have been undertaken to identify organisational climate dimensions across different
work contexts through the assessment of how employees perceive their work
environment and cognitively appraise it. This has produced better understanding of
the dynamics of organisational climate and how it influences the work environment,
employee behaviour, performance and engagement at large (Campbell et al., 1970;
Glick, 1985; James and James, 1989; Patterson et al., 2005).
Furthermore, founders of companies have often played the role of culture-creators
with their deep vision, thrust, personal values, ambitions and decision making
processes (Gagné et al., 2014). They often set the organisational ethos through their
underlying behavioural and belief systems. The noteworthy resilience and success of
the Southwest Airlines is a typical example despite the economic and industry
downturn resulting from the 9-11 terrorists’ attacks. The deep organisational culture
instilled by its legendary founder (Kelleher) was central to the company’s survival and
achievements. This was a culture considered almost like a “religion” and is
characterised by a blend of spontaneity, emotions, passion, cost-consciousness and
financial conservatism in the way they do things (Serwer & Bonamici, 2004). Similar
experiences of business transformation were noted in institutions such as General
Electric (Welch), Apple (Jobs) and Google (Page and Brin). This was characterised by
the specificities of their organisational cultures and dynamism instilled by the
respective founders and leaders and revolved around creativity, execution, great
people and virtues (Colvin, 2006; Galit, 2016; Gunther, 2004; Lashinsky, 2011).
Moreover, the influences of founders in family-owned institutions are alike, as they set
the pace and orientation of the culture they desire (Gagné et al., 2014).

37
Virtue is now taking an even more important place in research agenda, as leadership
integrity issues, role modelling, corporate citizenship, health and safety, and
environmental protection matters are gaining prominence. Business leaders have
continually been under pressure to achieve economic goals and it is becoming even
more relevant to understand how these are being achieved (Kaptein, 2008a). This
naturally points to ethics in business and ethical leadership at large (Avolio et al.,
2009). The two foundational elements of ethical leadership, i.e. being a moral person
and a moral manager have gained considerable interest from researchers and have
been found to be central to understanding the complex concept of ethical leadership
(Trevino et al., 2000, 2003). A moral person demonstrates traits of honesty, integrity
and trustworthiness, and these should be visible to the outer world in a consistent
manner. Doing the right things, showing concern for people and living a personal moral
life are typical behaviours of a moral person. Trevino and Nelson (2014) argue that
this does not stop by just being a moral person as the latter simply indicates how the
leader is expected to behave. It does not show how the leaders expect their employees
to act unless the “moral person” in the leader also assumes the role of a “moral
manager”, thereby instilling an ethical culture in its subordinates. Holding the right
communications, setting the proper expectations, promoting ethical practices,
encouraging collective interests and fairness, and fostering conditions for
organisational citizenship behaviour are typical of the moral manager.
Another important theory that supports the leader-follower relationship is that of the
social identity theory whereby individuals associate themselves with social groups to
enhance their own self-concept and self-worth (Islam, 2015; Tajfel & Turner, 1985).
Such leaders help their followers gain self-esteem, who then identify themselves with
their leaders and shape up their attitudes and behaviours accordingly (Becker et al.,
1996). Thus, those employees who identify themselves with a social group,
organisation or leader develop themselves so that their values become like such
entities.
2.1.1 Strategy for Literature Review
The study of organisational culture, ethical organisational climate, ethical leadership
and behaviour is so vast, and complex that it warrants the adoption of an appropriate
literature review strategy to dissect its interrelationships, as well as to assess the

38
relationships and effects. To simplify such a process, Dopfer, Foster and Potts (2004)
elaborated a universal model comprised of a conceptual “macro-meso-micro”
framework. This framework is used as the guide to conceptually map the key variables
for empirical study in the multi-cultural and cross-industry context of Mauritius.
Ethical Leadership
& Decision Making
Internal & External
Workplace
Pressures
Ethical
Organisational
ClimatePerceived
Employee
Performance
Employee Ethical
Behaviour &
Conduct
Organisational
Citizenship
BehaviourOrganisational
Culture
macro meso micro
Figure 2.1. The conceptual research model within a macro-meso-micro framework.
The “macro” layer focuses on the broad variables such as organisational culture and
ethical organisational climate, whilst the “micro” layer emphasises the granular
variables such as ethical behaviour and conduct that are influenced by the
intermediary mediating variables situated at the “meso” layer.
Thus, the conceptual model as shown above will form the guiding structure to conduct
the literature review process being envisaged in this chapter.
The structure of this chapter is as follows, :
It starts with a theoretical study of the underlying concept of culture, ethics, and
their origins and perspectives which form the backbone of the study. This is
prior to embracing a deeper theoretical exploration of the specific macro, meso
and micro variables encapsulated within the conceptual research model. The
topic under study is intrinsically related to ethics, therefore it is imperative to
examine the sources of ethics and moral values and to consider the religious
linkages both from a theoretical and empirical perspective. Next, ethics in
business is examined, as numerous corporate scandals, failures and ethical
deviances continue to be reported around the globe, thereby making ethics in

39
business a prominent item on the agenda of theorists (English, 2004; Treanor,
2009; Lee and Choa, 2011; Ciro, 2012).
With the scene set on culture and ethics, it is key to also study how people
within societies think and act, and any cultural and behavioural patterns
amongst various countries. This will help to understand any relationship with
the ethical challenges being faced by leaders in business communities. Thus,
the study of national cultures and cross-culture studies which have taken place
around the globe will form an integral part of the background study to enable
evaluation of the ethical trends across countries as well as identify any
potential macro issues which will help to explain the ethical challenges being
faced in the corporate community on a multinational perspective (Alas, 2006;
Ardichvilli, Jondle and Kowshe, 2010). This can also help to subsequently
compare the state and pattern of ethical practices that emerge from the local
context. This will constitute the steppingstone to embark on the background
study of leadership theories (critical enablers in shaping work behaviours and
environment). It will include deeper theoretical and empirical studies on the
specific macro variables of organisational culture and behaviour, ethical
organisational climate, and their relationship with leadership approaches and
organisational performance. The main area of investigation is organisational
culture, and the perception of organisational culture will be used as the
measure within the study.
Business leaders and executives are called to operate within a particular
context and deliver on corporate goals and targets. This is often characterised
by a pressure to meet shareholders’ or other stakeholders’ sometimes
unrealistic demands. A burden therefore mounts on the person to find an
equilibrium between attaining shareholder’s goals and fulfilling their
deontological duties (Ford, 2006). It sets the scene on “doing things right” and
“doing the right things”. Business leaders thus face the conundrum of how to
meet the stretching demands of their bosses whilst ensuring that ethical
standards and practices are not compromised (Knights & O’Leary, 2006). The
aspect of ethical leadership and the process of how leaders make decisions in
such contexts therefore becomes fundamental to the overall ethical
foundations in business organisations. This leads to studies of the key

40
leadership theories, ethical theories and ethical decision making theories and
how internal and external pressures, and the nature and intensities thereof,
affect ethical leadership practices or cause a climate of anomy in the
organisation. In the whole multitude of leadership theories, the objective was
to study certain specific leadership approaches such as directive, self-
leadership, authentic, situational, transformational and charismatic as
compared to the likes of servant leadership and leader-member exchange
which have been studied. The targeted ones supported by social learning and
social cognitive theories formed an important part of the study.
Ultimately, there existed a need to understand how ethical leadership, decision
making, and work pressures mediate between ethical organisational climate
and the micro variables such as organisational citizenship behaviour and
employee ethical conduct. As the objective of this study was to contribute
towards the body of knowledge, an empirical study in the multi-cultural and
cross-industry context of Mauritius characterised by colonial, multi-ethnic,
multi-cultural and diverse politico-socio-economic backgrounds could be of
great help, as no such studies had yet been undertaken. A study of these
contextual facets in this chapter would form an integral picture prior to
embarking on-the-field studies. Given that there are many aspects that
influence organisational culture, the aim was to also undertake empirical tests
in Mauritius, to assess whether organisational size plays an influential role in
shaping up particular types of culture within the enterprise. These findings
could be compared with the key ones undertaken globally (Gray, Densten and
Sarros, 2003; Man, Lau and Chan, 2001; Schneider, 1990b; Denison and
Mishra, 1995; Julien, 1995).
To summarise, the theoretical exploration of the concepts of national and
organisational culture, organisational ethics culture, ethical climate, ethical leadership
and decision making, work pressures, organisational citizenship behaviour, ethical
behaviour and employee performance, aimed to achieve the objectives set out under
“Research aims 1 and 2”. This served to understand the underlying cross-cultural
dynamics and how these influenced behaviours in societies or organisations at large.
It further helped to establish the degree to which cultural environment influenced
employees’ attitudes and behaviours and their ethical stances. The second phase of

41
the literature review helped to attain the objectives set under “Research aims 3, 4
and 5”. The objective was to study theoretical models related to the ethical mediating
variables (that is, ethical leadership and decision making, and internal and external
pressures) and explore how they are conceptualised and their influence in the
business context. The objective was also to explore the empirical findings on these
ethical mediating variables and their interrelationships with employee ethical
behaviour, employee performance, organisational citizenship behaviour, organisation
commitment, employee engagement and satisfaction. The goal was to also obtain a
broader understanding of what is happening on the global front with regard to ethical
practices, the nature of issues being faced by leaders and their subordinates in various
cultures, and the typical internal and external pressures affecting employees to depart
from ethical norms and standards. The literature review also established whether
these issues were related to cultures or nations, identify any patterns thereof, and
ultimately funnel down to the study of the ethical issues in Mauritius. The objective
was to also explore, study and identify whether there were any patterns between
ethical issues on the global and local fronts. This laid a strong base from a literature
review standpoint prior to embarking on the empirical study in the multi-cultural and
cross-industry context and specificities of Mauritius. It enabled a response to be made
to the research questions and to meet the 10 specific aims set out from an empirical
perspective as articulated in the preceding chapter.

42
2.2 CULTURE
2.2.1 Introduction
As the concept of “culture” was central to the study being undertaken, it forms the
starting point of the literature review process so as to establish a comprehensive
platform on which other key intrinsically-related variables, forming part of the scope of
the conceptual research model (Figure 2.1 on page 38 of the thesis), can be studied
theoretically. This section aims to go to the roots of the culture theories, understand
the perspectives of the “founding fathers”, and assess how they evolved over time into
the contemporary cultural philosophies and models. This section further constitutes
the background study of culture, highlighting its various facets and dimensions and
also makes easier, the understanding of broader transnational specificities. This will
ultimately form the basis for stepping into the study of the macro variables of the
conceptual research model.
The concept of “culture” is based on a term first used in classical antiquity by the
ancient Roman orator Cicero when he wrote on the cultivation of a soul “cultura animi”
(Cicero, ca. 45 B.C.E./1812, p.273). The term appeared first in its current sense in the
18th and 19th centuries to denote the process of cultivation or improvement. Culture is
defined as “that complex whole which includes knowledge, beliefs, arts, morals, law,
custom and any other capabilities and habits acquired by man as a member of society”
(Tylor, 1871a, p.1). Tylor’s definition is considered as one of the first anthropological
definitions of culture. A revolutionary in an era characterised by colonialism and social
evolutionism, he was the first to specify that culture is acquired through a learning
process as compared to being biologically inherent. Acknowledging the complexity of
the development of civilisation and difficulties in putting forward theories illustratively,
he explored a broad spectrum of theoretical and philosophical aspects relating to
culture in two comprehensive volumes of work. These covered areas such as the
evolution of the culture (from prehistoric through barbaric to civilised life) and survival
in culture (from superstitions to occult sciences and spiritualisation). They further
included emotional and imitative language, the art of counting (from a state of
arithmetic amongst uncivilised races through to its subsequent development),
mythology, and animism with its underlying doctrine of soul (Tylor, 1871b).

43
The word “culture” may mean different things for different groups. Whilst for some it
may be an appreciation of music, dance or food; for others in a biological sphere, it
may mean a colony of micro-organisms growing in a laboratory for some specific tests;
and for behavioural scientists it may simply be learned human behaviour patterns.
In the 19th century, the term “culture” was developed to generally refer to the
betterment of individuals through learning. In the 20th century, however, “culture”
emerged as a core concept of anthropology, where scientists applied the definition of
culture to all societies, literate and non-literate, settled and nomadic.
Contemporary cultural theory has been made possible through significant earlier
works of the so-called “founding fathers” such as Durkheim, Marx, Weber and Simmel
(Smith, 2001). Their works provided a solid philosophical baseline from which culture
was originally conceptualised and subsequently developed, thus enabling better
understanding of culture from a sociological standpoint.
For example, Marx (1867) is generally seen as an anti-cultural theorist as he posited
that historical materialism, the economy and economic forces drive both collective
ideology and individual behaviour. He used the “class-driven model” of social
organisation (i.e. owner v/s worker classes) to support his theory. From a Marxist
perspective, the bourgeoisie (the ruling class of owners) shape the life and culture of
the working class (Marx & Engels, 1945). He highlighted the use of “alienation” in all
aspects of society.
Furthermore, Durkheim (1895) advocated two key concepts referred to as
“functionalism” (societies analysed and described in terms of functions, interrelated,
to restore social equilibrium) and “positivism” (a philosophical theory whereby
knowledge is based on facts and empiricism). He stressed that society is very much a
moral phenomenon and glued together by the sentiments of “solidarity”. He advocated
that societies are characterised mechanical and organic types of solidarity. Societies
where there is little tolerance for deviance and where conformity is the rule would be
qualified as “mechanical solidarity”, where people would tend to think alike and do the
same work. Societies characterised by high tolerance for differences and division of
labour (role diversity) would be qualified as organic solidarity. He also stressed the
concept of “collective conscience” to depict shared moral awareness in societies, and

44
suggested that sentiments, emotional life, moralities, culture and behaviours work
towards generating social order and integration. He argued that when there is social
disintegration or dislocation, people will experience “anomie” (that is, a lack of usual
social or ethical standards in an individual or group) (Durkheim, 1897). He also
stressed that moral ties and sacred goals (with the study of religion) are critical in this
modern era characterised by the prevalence of materialism and rapid social changes.
To summarise, he advocated that culture brings social consensus or social integration
where people feel a strong sense of group belonging with the aid of music, chants,
rituals, artefacts, etc. as they bring collective and emotional vitality.
Another perspective worth exploring is that of Weber (1922). Materialistic in approach
and characterised by the realities of power and economic development, Weber
advocated a “Verstehen” (understanding) approach to identify and recognise the
underlying issue that forces or influences someone to act in a particular way. In other
words, one needs to uncover the motive and intent behind an action (Weber, 1922).
He further presented two contrasting modes of action:
Value-rationale action – mainly driven by culture beliefs, goals and a quest for
religious salvation for one’s own sake or value through forms of ethical, aesthetical
and religious behaviour.
Goal-oriented action – mainly driven by norms of efficiency, that is, means of
attaining specified goals but with a lack of an overarching moral and cultural
direction.
Over and above the effects of power and dominance on culture, Weber also
highlighted the concept and influence of “status” in a society where people are sharing
a common style of life and social prestige. This in turn directs the behavioural
responses and actions of individuals in the society (Weber, 1922). In the late 1990s
and in an attempt to explore further perspectives, a rather broad but simplistic
definition of culture was provided as “an entire set of social norms and responses that
condition people’s behaviour” (Rodrigues, 1997).
In more recent times, the definitions of culture did not evolve much from what was
originally put forward by various gurus except that some of the recent definitions
focused more on the ,customs and traditions of people. In this context, the Cambridge

45
Dictionary (2018) defines culture as being "the way of life, especially the general
customs and beliefs, of a particular group of people at a particular time”, whilst Kottak
(2013, p.5) defines culture as “the traditions and customs transmitted through learning,
that form and guide the beliefs and behaviour of people exposed to them”.
Hofstede, Hofstede and Minkov, (2010, p.6) defined culture as, “the collective
programming of the mind distinguishing the members of one group or category of
people from others”, the distinction that is created between groups of people simply
by their collective philosophy or school of thoughts. Furthermore, Hofstede (2015) saw
culture as “shared and transferable perceptions, values and practices”. He suggested
that culture is useful when it is shared, otherwise it will be an element of the individual-
level construct such as personality, experience, character, etc. and not culture, per
say. However, individuals carry culture around in their values and practices.
Another way of understanding culture is to think of the “nature versus nurture” debate
whereby “nature” refers to our biology or genetics and “nurture” refers to our learned
behaviours and other environmental factors influencing our identities (Hernandez &
Blazer, 2006). In a bid to establish the relationship, academia has acknowledged that
“nature” and “nurture” influence each other (Collins et al., 2000).
2.2.2 Common Characteristics of Culture
Kottak (2013) highlights key facets of culture namely:
(a) Culture is learned – If behavioural sciences are explored from a broader
perspective and complex learned behavioural patterns are examined, it will be
clear that the human race is not the only species demonstrating learned behaviour.
Many other animal species teach their young how to live and survive, based on
their own learning and existence. In the opinion of many scholars, researchers and
anthropologists, culture is acquired through the process of conscious and
unconscious learning (“enculturation” when learning one’s own group culture;
“acculturation” when learning another group’s culture) and by being exposed to
cultural traditions, and not through biological inheritance.
The culture learning process happens through observation, imitation, reward and
punishment, and this starts from birth onwards (Eliot, 2009). This process is also

46
intrinsically linked to learning about group’s dynamics. The length of time over
which the culture has been acquired will dictate how deep it is and how easily it
can change. Such deep cultures are harder to change as they are encrusted within
the unconscious shared values. However changing pressures on a group can
influence a change in its culture no matter whether this is deeply ingrained or not
(Hofstede, 2015). Moreover, changes within leaders, and economic pressures are
likely to influence culture changes.
(b) Culture is symbolic – The environmental settings often indicate the particularity
of the culture. Consisting of tools, implements, utensils, clothing, ornaments,
beliefs, rituals, games, work of arts, and language , one can ascertain the socio-
cultural characteristics of the group from these symbolic traits (White, 1959).
(c) Culture is shared - Based on the process of enculturation, culture is transmitted
from ancestors to subsequent generations thereby moulding the behaviour of the
people in a consistent way as inherited from their immediate surrounding members
(Kottak, 2013; Schein & Schein, 2017; Schneider, 1990a). Furthermore, the culture
change happens through processes of diffusion (the borrowing of traits between
cultures, directly or indirectly), enculturation/acculturation (the exchange of cultural
features occurring through first hand contact) and independent invention (the
creative abilities of humans in finding innovative solutions to problems).
(d) Culture is all-encompassing and integrated – Culture is not just a collection of
customs and beliefs, but it rather integrates a set of values, ideas, symbols and
judgements. It encompasses a broad set of features beyond taste, degree of
sophistication, education level and appreciation of fine arts and fabrics, etc.
(Ferraro, 1998).
(e) Culture is instrumental and adaptive – In general, people tend to adapt to a
particular socio-cultural context through the learning process and specially when
they are interacting often. They use culture to fulfil their fundamental needs
whether being basic, psychological or emotional. Over time, groups of individuals
have built and adapted to their own environment and have gradually passed down
47
their customs, traditions and practices to the next generation (Harris & Moran,
1979).
2.2.3 Culture Dimensions
Over the years, more so since the 1960s, there have been several cultural dimensions
used for cross-cultural study, analysis and comparisons. Many of the studies
conducted between 1960 and 1979 were based on three common dimensions namely
geography, language and religion. However, more recent ones, especially those of
Hofstede (1980) and House et al. (2004) were much broader in perspective, covering
four and nine culture dimensions respectively (Alas, 2006; Ardichvili et al., 2010;
Hoppe, 2011; Ronen & Shenkar, 1985).
In the earlier studies, researchers and scholars used geography, language and religion
as primary dimensions for culture evaluation. Geography and culture are
interdependent. Clothing, customs, languages, food, housing architecture, lifestyles
and tools are largely dictated by geography and prevailing climate in the regions where
people live. Life alongside sea coastal regions tends to influence their inhabitants and
residents to rely on fishing and adopt culinary habits rich in seafood. Similarly people
living in mountainous or cold regions develop different cultures (often isolationist in
nature) relying on raising sheep for wool and other animals and vegetation for their
living (Rugman & Collinson, 2009). Culture and lifestyles in developed cities are, very
different from people living inland, along seacoast or mountainous regions, and this
would tend to even vary from city to city. Language, another primary dimension of
culture, can be viewed as its verbal expression. It ties people together and enables an
environment for exchange and participation. Rugman & Collinson (2009) described
Benjamin Lee Whorf’s theory of linguistic relativity which advocated that language
shapes the way we think, and that one would tend to see the world differently
depending on the language one speaks. For example, Japanese was viewed as an
isolated language, much like their people who remained closed off from the world in
the 1700s. This translated into their earlier type of conservative behaviour, but it now
seems that the Japanese are moving away from their reliance on conservatism.
Religion is another major primary dimension that shapes the belief systems of people
and influences culture through shared core values. In certain religions, rites and rituals
guide individual behaviour. For instance, in Christianity wine is consumed as part of

48
the ritual practice, while in Islam, this is completely forbidden. Likewise, the dietary
practices in Indian and Chinese cultures are largely different due to their respective
religious distinctions (Ghemawat & Reiche, 2008).
Hofstede (1980) proposed four dimensions used for classifying international
differences in a society’s work related values namely power-distance, uncertainty
avoidance, individualism and masculinity were identified and developed.
People with a higher inclination for power-distance indicate that they tend to accept
centralised power and depend heavily on superiors’ directives. On the other hand, a
smaller power-distance demonstrates that people would rebuff centralised power and
also expect to be involved in the decision making process. Higher power-distance
translates into steep organisational hierarchies strongly influenced by autocratic
behaviour from the top and with low participation of people (lower ranked) in decision
making.
In societies with strong uncertainty avoidance, people call for structure, procedures
and direction as they are unsettled due to uncertainty. In weaker uncertainty
avoidance, people accept uncertain conditions, ambiguity and require autonomy with
minimal structure. Rugman and Collinson (2009) classified Japan, France and
Argentina in a high uncertainty avoidance cluster as these countries placed strong
emphasis on rituals and procedures to control risks of uncertainties. This is compared
to countries like India and Denmark which would be more inclined towards flexibility
and informality.
Contexts where individualism is prevalent are often characterised by individuals who
tend to look after their own interests over that of the organisations (e.g. United States).
On the other hand, societies favouring tight integration of a group of individuals to
evolve as a collective group would be characterised as collectivistic (e.g. China).
Societies could also be portrayed as being masculine or feminine. In the former
context, males would assert themselves, be ambitious and undertake competitive
roles in the society (Hofstede, 1980). Countries like Germany, the United Kingdom,
Mexico and Japan would be characterised as masculine societies, whilst countries like
Sweden, Denmark and Netherlands would be characterised by feminine values of
caring, relationship, modesty and quality of life.

49
In high-context cultures, prevalent in China, Japan, Spain and Arab countries, people
value personal relationships first and make agreements based on trust, unlike in low-
context cultures, such as in Italy, UK, North America and Germany, where people get
down to business and favour everything to be dictated by legal structures and
contracts valuing expertise and performance (Hall, 1976).
The GLOBE project measured nine core cultural dimensions namely: Uncertainty
Avoidance, Power-distance, Institutional Collectivism, In-group Collectivism, Gender
Egalitarianism, Assertiveness, Future Orientation, Performance Orientation and
Humane Orientation (House et al., 2004). Uncertainty Avoidance and Power-distance
are also similarly featured in Hofstede’s dimensions. The latter further treated aspects
of gender and collectivism/individualism. However, it is worth exploring the
perspectives of House et al. (2004) at least on the dimensions absent or covered
differently by Hofstede.
Institutional Collectivism determines the degree to which institutional practices favour
and reward collective efforts in a particular society or organisation. Here the social
institutions play an active role (e.g. Japan, South Korea) as opposed to where the role
of such institutions is relatively less active (e.g. Italy and Argentina). In-group
Collectivism, on the other hand, establishes the degree to which persons express their
own pride, loyalty and unity within their organisation or family cluster. Cohesion is
central to in-group/in-family collectivism and is more prevalent in countries like India
and China as opposed to Sweden and Denmark. Gender Egalitarianism assesses the
degree to which society promotes gender balance with a view to providing equal
chances to both genders. Assertiveness is used to determine the degree to which
people in organisations and society assert themselves in the face of confrontation,
negotiation and interaction. Strong prominence of such an attribute exists in countries
like the United States, Germany, Austria and Greece (Alas, 2006; House et al., 2004).
Future Orientation indicates whether people in a particular society or organisation
have a forward looking mindset or thought process. Such cultures are prevalent in
countries emphasise future-orientated planning, investment and execution activities
so that the societies reap benefits in the long run rather than immediately (e.g.
Singapore, Switzerland and Netherlands). This propensity of holding visionary flair and

50
undertaking long range planning and execution is relatively low in societies such as
Italy, Argentina and Russia as per the GLOBE findings.
In societies characterised by Performance Orientation attributes, one would find a
strong focus on collective performance improvement behaviours backed by reward
mechanisms to motivate the group members to attain performance objectives whether
at the organisational or national level. Typical countries demonstrating such cultural
characteristics are the United States, Singapore and Hong Kong. A Humane
Orientation measures the degree to which the society or organisation values fairness,
generosity, kindness and altruism, and rewards such behaviours. Malaysia, Ireland
and Egypt were countries that showed high levels of humane orientation (House et al.,
2004).
Trompenaars and Hampden-Turner (1997) presented seven cultural dimensions
based on earlier works of Hofstede. They used a comparative model measuring
relativeness on seven dimensions: Universalist versus Particularism, Individualism
versus Collectivism, Neutral versus Emotional, Specific versus Diffuse, Achievement
versus Ascription, Attitude towards Time and Attitude towards Environment.
Universalist cultures are fundamentally driven by the application of regulations
irrespective of particular conditions or circumstances. Neutrality (objectivity used for
decision making, based on facts and data) versus the use of Emotions (subjectivity
used in the decision making process, based on intuition, feelings, opinions) is another
dimension used to obtain the underlying basis of people’s culture on what guides them
for making decisions. The Specific versus Diffuse cultural dimension rates the
tendency to limit people’s engagement, relationship and support within the workplace
(specific) or beyond (diffuse and extended to social situations). Achievement versus
Ascription evaluates how people appoint, promote and reward others, that is, whether
status is earned on the basis of merit/performance (Achievement) or based on their
seniority, gender, religion or ethnicity (Ascription). Attitude towards time and Attitude
towards environment evaluates how people or the society react to time (punctuality,
sequential or synchronic in nature) and the welfare of the environment respectively.

51
2.2.4 Universality, Generality and Particularity of Culture
Culture can also be analysed from various perspectives based on the degree to which
they are universally, generally or specifically accepted. For example, while culture will
likely vary from continent to continent, country to country or community to community,
there is nevertheless another perspective where it exists as ‘cultural universals’. Here,
learned behaviour patterns are shared by the whole of mankind (e.g. raising children
in sorts of family setting, or distinguishing between good and bad behaviour). It can
also be seen as a state when a pattern, trait or institution is common to all human
cultures worldwide.
Generality in culture is characterised by certain cultural traits being visible in many
societies but not in all of them. In other words, though the cultural traits may be
prevalent, they are not necessarily embraced and lived by everyone. The concept of
family can be one such example demonstrating the generality aspects, where family
would be restricted to nuclear boundaries in a Westernised culture, whilst the same
concept of family would span over much larger groups of people when seen in Eastern
or African cultures.
The particularity nature of culture implies that it is not widespread but confined to a
specific society, group or place and sometimes can be in the form of a “sub-culture”
native to a particular group of people within a society. An interesting phenomenon is
that people tend to have cognitive biases about themselves and to the groups they
belong whereby they tend to favour their own groups at the detriment of others (Smith
et al., 2013).

52
2.3 ETHICS: ORIGIN AND PERSPECTIVES
2.3.1 Introduction
The macro layer of the conceptual research model is comprised of the “Organisational
Culture” and “Ethical Organisational Climate” variables. Both of these constituent parts
rely on the underlying concepts of “culture”, which were explored from a background
perspective in the preceding section, and “ethics”, which will now be the subject for
review. The culture that permeates the organisation is intrinsically linked with the
degree to which moral behaviour and ethical standards prevail, usually nurtured by
founders and leaders. The prevalence of moral behaviours and ethical standards
within the organisation will dictate the ultimate type of work climate amongst the
employees. For this reason, it is fundamental to embark on the study of “ethics”, the
second background feeder to support the study of the key variables in the conceptual
research model. The aim of this section is therefore to introduce the concept of
“ethics”, draw from its origin, and study the theoretical and empirical relationship with
religion prior to exploring its importance in the business world.
“Ethics” emerges as a critical facet in the overall behavioural dynamics of people. It
forms an integral part of how individuals think, respond, and act within organisations
and societies. To understand the interplay of ethics within the organisational context,
it is important to grasp its various definitions, theories, perspectives and roles so that
one can evaluate its effects in the business context.
Ethics is defined as “the principles, norms and standards of conduct governing an
individual or group” (Trevino & Nelson, 2014, p.18). Emphasis was laid on the aspect
of “conduct” which is subject to the influence of the work settings, the values of the
leaders and managers, and the overall cultural context. Trevino and Nelson (2014)
also presented ethics as “a set of moral principles or values”, which can be highly
personal and relative in the sense that it varies from person to person. In other words,
what might be perceived as morally correct for someone may not be for another one,
and this is seemingly more prevalent in different context, societies and cultures.
MacIntyre (1998) provided his views on ethics and positioned right and wrong moral
behaviours, moral concepts and moral language as being instrumental in the fulfilment

53
of duties towards stakeholders in a socio-economic context. Another view of ethics
can be considered as “the society’s perception of what is right or wrong” (Parboteea
& Cullen, 2013).
2.3.2 Ethics: The Origin and the Religion Perspectives
With a view to properly understand the behavioural pattern and moral compass of
people in a society or in an organisation, it is important to go the roots of ethics
foundation. Ethics and moral values find their origin from diverse holy books and epic
poems in various religions at the beginning of the world literature (Hare, 2014). Though
moral and ethical values are often used interchangeably, there is nevertheless a subtle
difference in the sense that moral values refer to first order-beliefs and practices about
good and evil, whilst ethics are second-order beliefs reflective of moral beliefs and
practices (J. P. Sun, 2011). Furthermore, morality tends to focus on personal values
whilst ethics emphasise more on collective beliefs.
Most religions put forward vital teachings about ethical behaviours.
In Christianity, The Ten Commandments guide what is considered as unethical and
play a vital role for believers and followers (Coogan, 2014). The Bible prescribes many
such ethical principles, some of which are provided below (King James, 1611):
(20:4-6) - the stewardship role each and everyone needs to play for the good
of individual human beings and the society, and the need to work according to
God’s standards of what is right and wrong
(20:7) – specifying the right set of characters and behaviours that need to be
upheld such as compassion, grace, love, faithfulness, forgiveness and justice
(honouring right set of values)
(20:12) – the duty to bring stability in the family and society at large (social
responsibility/citizenship behaviour)
(20:16) – the duty to provide the right and truthful view (veracity) and not give
false testimony (ethical conduct)
Likewise, in Islam , several such duties, qualities, values and directives are set for
people to adopt, be guided in living, and promote accordingly for the welfare of the

54
community (Sadeq, 2002). Some of the key ones from The Quran relevant to this
particular study are (Itani, 2012):
(2:195) – the duty to do good to others through charity and service (social
responsibility/citizenship behaviour)
(3:159) – right set of qualities to be nurtured and lived such as good natured,
gentle, trustworthy etc.
(17:35) – fair dealing and trade with no recourse of excessive charges and
interests (usury/“riba”) reinforcing ethical conduct in business practices
In Hinduism, several Vedic literatures have guided the behaviours and lives of people.
The Bhagavad Gita underpins such philosophy and sets the ultimate goal one needs
to achieve, that of attaining absolute perfection of the individual through the
consolidation of the society and God’s consciousness. It sets out many such qualities,
values and duties that an individual needs to fulfil (Prabhupada, 1998):
(16: 2-3) – prescribes 26 right divine qualities such as fearlessness, purification
of the heart, self-control, giving charity, freedom from greed and envy, modesty,
forgiveness, non-violence, patience, compassion for living beings .
(16:21-22) – the need to give up lust, anger, greed (considered as three gates
to hell) as they bring one’s ruin.
According to Dharmasiri (1992), Buddhism is essentially practical in approach and
stands as a means to attain the ultimate goal, that of happiness for oneself and for the
benefits of others. Buddhist ethics are not founded on any commandments which men
are forced to follow but are based on practical perspectives of the law of nature and
the unchanging law of cause and effect (“Karma”).The intrinsic relationship between
the Buddhist ethical values and nature makes its principles useful to the world.
It was also noted that the major religions are characterised by monotheistic belief
systems, and all contain moral principles providing similar moral orientation and
guidance (Ali et al., 2000).
Field (1979) highlighted that religions impart society members with values, norms and
practices which help to create what he coined as “reciprocal expectations of

55
predictability” and which, through continuous exposure and practice, eventually
become taken for granted.
Since the early days of the moral foundation, and from ancient Greece through to the
middle ages, ethics has continually received the attention of philosophers and scholars
and has evolved conceptually over time (18th century with “Kantian ethics”, 19th century
with “Utilitarianism”, and in the 20th century with the developments and debates on
“meta-ethics, applied and business ethics”).
2.3.3 Ethics and Religion: The Relationship from an Empirical
Perspective
Drawing from these religious sources and their moral teachings, the conceptual
relationship between religion and ethics appears to be strongly present. Furthermore,
Conroy and Emerson (2004) argued that people with a belief in God are less prone to
engaging in unethical acts due to the fear of divine punishment. They apply a utilitarian
approach in gauging the net effect of conducting something unethical versus the
outcomes of such an act (gains/losses).
However, from further empirical studies, it appears that researchers and scholars have
had challenges in reaching definitive conclusions about the relationships due to
differing and mixed research outcomes (Parboteeah et al., 2008; Tittle & Welch, 1983;
Weaver & Agle, 2002). These mixed results seem to be due to conceptual and
methodological issues (Parboteeah et al., 2008).
Whilst Agle and Van Buren (1999) have found a small relationship between religious
beliefs and corporate social responsibility, Hood et al. (1996) and Smith, Wheeler and
Diener (1975) found no differences between the ethical behaviours of religious and
non-religious individuals. Khavari and Harmon (1982) could not establish a positive
relationship between the use of illegal substances and individual religiousness. Based
on further empirical works, it was found that no relationship could be established
between religiosity and ethical judgements of managers (Kidwell et al., 1987).
Parboteea and Cullen (2008) studied 63,087 individuals from 44 countries and also
found that the cognitive, affective and behavioural components of religion were
negatively related to ethics. Cognitive refers to the (knowledge aspect of religion),

56
affective (feelings towards religious beings, objects or institutions) and the behavioural
(manifestations of being religious, e.g. through praying in private, participation to
prayers at churches, temples or mosques)
2.3.4 Ethics in Business
In the early days, ethical theorists developed approaches geared towards standards
of behaviour and codes of conduct. These were qualified as normative approaches
(Beck et al., 2010; Chonko, 1995). Later, broader definitions were put forward by
scholars and researchers. Business ethics is viewed as “the rules, standards, codes
or principles which provide guidelines for morally right behaviour and truthfulness in
specific situations” (Lewis, 1985).
Another view of ethical behaviour in business is considered as behaviour “that is
consistent with the principles, norms and standards of business practice that have
been agreed upon by society” (Trevino & Nelson, 2014, p.20). These two definitions
cover broadly the similar aspects of principles, rules, norms, codes and standards
required to guide behavioural practices in business. However, Lewis (1985) added a
situational dimension to his definition whilst Trevino and Nelson (2014) gave a
benchmark for measurement with what has generally been agreed by the society. This
made it relatively easier for someone to gauge the ethicality of particular actions from
the generally-accepted viewpoint of the society. “The application of principles to
govern and address moral matters arising in business environment” is another
perspective of work ethics (Huhtala, Feldt, Lämsä, et al., 2011).
Taking from these definitions, one would then tend to ask: what would constitute an
ethical issue in business? To answer this question, reference is made to works of
Ferrell and Fraedrich (1991), Berenbeim (1987) and Waters et al. (1986). According
to Ferrell and Fraedrich (1991) “an ethical issue is a problem, situation or opportunity
requiring an individual or organisation to choose among several actions that must be
evaluated as right or wrong, ethical or unethical”. From this one can gather that it can
take the form of a problem, situation or opportunity and more importantly there is a
need to apply a judgemental call to evaluate whether it is right or wrong (commonly
referred to as “ethical decision making” by scholars and researchers). Vitell and
Festervand (1987) suggested that it is an issue of conflict, that is, conflict between the

57
organisation’s or leader’s interests and one’s own personal ethics (Jamnik, 2017). This
conflict often leads someone to do something which is improper, referred to as “ethical
deviance” or “ethical violations”. Such a situation entails a pressure on the individual
to depart from the right path and indulge in deviating from ethical principles. For
example, a sales manager calling for his subordinates to generate sales at any cost
to meet sales targets set by the organisation either for reward, recognition or fear of
punishment. All this often leads to misrepresentation in sales to end clients (e.g.
overpromising on delivery and/or product features/capability) with a view to close deals
at any cost. In the same way, there are many other such forms of ethical issues also
highlighted in a major report from “The Conference Board” (Berenbeim, 1987). The
following seven issues came out as widely accepted key ethical issues faced by
managers:
Employee conflicts of interest
Inappropriate gifts
Sexual harassment
Unauthorised payments
Affirmation action
Employee privacy
Environmental issues
At a higher level in the hierarchy, CEOs gave their perspectives of what constituted
ethical issues in the same Conference Board report. They see the issues in four main
categories namely: equity (comparable worth/salaries, etc.), rights (privacy, equal pay,
equal opportunity, etc.), honesty (employee conflict of interest, acceptance of gifts
inappropriately, effecting unauthorised payments, etc.) and exercise of corporate
power (product safety, environment issues, political action, etc.) (Berenbeim, 1987;
Jamnik, 2017).
Based on the research works conducted by Waters, Bird and Chant (1986), it was
noted that the most frequent ethical or moral issues are in relation to the following five
key stakeholders:
(a) Vis-à-vis Employees: in respect of feedback on performance, work conditions
and employment security, etc.

58
(b) Vis-à-vis Peers and Superiors: in respect of being truthful, telling the truth,
loyalty and support, etc.
(c) Vis-à-vis Customers: in respect of being truthful, telling the truth about the
products and service, collusion and questionable practices, etc.
(d) Vis-à-vis Suppliers: in respect of fair practice, impartial treatment, balanced
relationship and unfair pressure, etc.
(e) Vis-à-vis other Stakeholders: in respect of adhering/respecting legal
constraints, truth-telling in public relations and protecting stakeholder’s
interests.
Thus, to ensure ethical practices prevail in organisations, there is a need to set
(explicitly or implicitly) ethical guidelines, codes and standards that would guide the
workforce in undertaking ethical work practices. Continuous education and coaching
also play a fundamental role in permeating the right standards and ethical culture.
Many researchers have also recommended the application of measures to recognise
and reward ethical behaviours. The absence of teaching organisational members on
ethics, or ethical behaviour and practices will simply encourage and fuel unethical
behaviours in the medium to long term.

59
2.4 THE ROLE OF NATIONAL CULTURES IN SHAPING UP ORGANISATIONAL CULTURES
2.4.1 Introduction
A background review has been conducted on “culture” and “ethics” as the key
underlying components for a comprehensive study of the macro variables of
organisational culture and ethical organisational climate. Attention is now drawn to
another important conceptual element, the “national culture”. The study of “national
culture” is relevant and linked to why certain organisational practices, behaviours and
cultures prevail in certain contexts and not necessarily in others. Several important
across-country cultural comparisons have been undertaken, as they play a pivotal role
in understanding behavioural patterns on the basis of culture dimensions. They include
geography, language, religion, power distance, human orientation, collectivism,
gender egalitarianism and the like which differ from country to country. The similarities
and differences will provide insights to researchers, enable them to draw contextual
conclusions about culture, organisational culture and ethical business culture. They
will subsequently gain insights into patterns of ethical leadership, behaviour and
standards across culturally-related countries. This section aims to explore the key
aspects of across-country studies both from a general culture and ethical business
culture perspective. It will extend from a broader transnational view down to the
specificities of certain cultures so that more focused theoretical and empirical studies
can be undertaken. The literature review of “national culture” will thus form another
important part of the building blocks supporting the study of core variables of the
conceptual research model.
In simple terms, national culture is described as a “set of norms, behaviours, beliefs
and customs that exist within the population of a sovereign nation.”
(BusinessDictionary, 2018). Trompenaars and Hampden-Turner's (1997) model of
national culture differences reinforces the theory of culture and its dimensions and
orientations. Culture will tend to vary between countries, between organisations and
between groups. Culture can even vary within the same industry and same society.
To better understand how people within societies think and act, it is important to
understand their origins, the philosophies guiding them over generations, and more

60
importantly the societies in which people evolve. Several cross-cultural field studies
since the 1960s have come a long way to shed light on the complexity of national
culture, and country-specific cultures have been analysed, assessed and classified.
Typical cross-cultural studies were those of Haire Ghiselli and Porter (1966), Sirota
and Greenwood (1971), Hofstede (1976), Redding (1976), Ronen and Kraut (1977),
Badawy (1979), Griffeth et al. (1980), Hofstede (1980), Ronen and Shenkar (1985),
Inglehart (1997), Schwartz (1999), Jackson (2001), House et al. (2004), Alas (2006)
and Ardichvili et al. (2010). (Alas, 2006; Ardichvili et al., 2010; Hoppe, 2011; Ronen & Shenkar, 1985)
These studies have come a long way to ensure that cross-cultural comparisons can
be determined on a sound basis of socio-economic-cultural traits, thereby enabling
sociologists, anthropologists, scholars and researchers to integrate, synthesise and
draw appropriate contextual lessons and conclusions (Ronen & Shenkar, 1985).
Inglehart and Welze (2005) demonstrated that modernisation is the underlying cause
for human development, where economic development gives rise to cultural changes
fostering a climate of autonomy, gender equality and democracy. Furthermore, with
the advent of internet and social networking, one can also note the behavioural
changes happening in respect of telecommuting, cooperation and networking across
geographical boundaries. The emergence of new trends and social habits is thereby
calling for people across the globe to evolve and adapt differently.
An attempt has been made to compare cross-cultural studies undertaken over the last
50 years and a few important ones have been identified and adapted in Annexure 1:
Empirical Studies and Clustering of Countries on Attitudinal Dimensions. Nine such
studies have been compiled which have clustered countries as part of their respective
designs.
The clustering of countries was done on the basis of national boundaries being a good
delimiter for legal, political and social environments within which one operates.
Furthermore, countries were assessed and classified on the basis of culture
dimensions. Most earlier studies were based on the three key dimensions of
geography, language and religion (Haire, Ghiseli and Porter, 1966; Sirota and
Greenwood, 1971; Redding, 1976; Ronen and Kraut, 1977; Badawy, 1979; Griffeth et
al., 1980). To classify the nations being studied, the most recent ones, e.g. Hofstede
(1980) and House et al. (2004) GLOBE study, used much broader culture dimensions

61
such as power distance, uncertainty avoidance, institutional and in-group collectivism,
masculinity index, gender egalitarianism, assertiveness, future orientation and
performance orientation.
The use of geography (as culture spreads first to place of birth), language (as it
contains meanings and values likely to influence one’s goals) and religion (as religious
beliefs are associated with certain values and norms) was common amongst the
earlier studies (Ronen & Shenkar, 1985). Where countries were grouped across
continents, it was noted that values were mainly attributed to the prevalence of
colonisation and immigration.
The countries in particular clusters shared many facets of the same culture and also
tended to have a similar way of life and belief systems as shown in Annexure 1:
Empirical Studies and Clustering of Countries on Attitudinal Dimensions.
2.4.2 Cross-Cultural Studies: The GLOBE Perspective
Generally regarded as one of the most comprehensive research programmes ever
conceived on culture and leader effectiveness across the world, the Global Leadership
Organisational Behaviour Effectiveness (GLOBE) was spearheaded by House et al.
(2004). It studied the similarities or differences in norms, values, beliefs and practices
amongst societies globally (Hoppe, 2011). The first wave of this study covered 62
countries and obtained responses from 17,300 middle managers from 931
organisations operating in the food processing, financial services and
telecommunications sectors.
The second wave covered in-depth studies of 25 societies (Hoppe, 2011). This was
built on the findings of Hofstede (1980), Schwartz (1994), Smith and Peterson (1995),
Inglehart (1997) and others. The countries were assessed and classified based on
nine established cultural dimensions such as Power Distance, Uncertainty Avoidance,
Human Orientation, Institutional Collectivism, In-Group Collectivism, Assertiveness,
Gender Egalitarianism, Future Orientation and Performance Orientation (House et al.
2007). These dimensions provided a sound basis to undertake comparative cross-
cultural analysis and clustering of the different societies forming part of the study.

62
In Figure 2.2, countries with the largest cultural similarities were clubbed together and
those which differed were mapped in relation to the degree of their differences (e.g. a
completely different culture was set opposite, whilst the closer the clusters, the more
similar they were in terms of culture settings). Typical examples of such opposing
culture representations are demonstrated by Eastern versus Nordic Europe, Sub-
Saharan Africa versus Latin America and Anglo versus Middle East in the GLOBE
illustration.
Furthermore, Figure 2.2 also depicts the culture strengths and weaknesses of the
respective nations and clusters based on their “world mean” scores. Higher scores
indicate that the particular culture dimensions are very prominent amongst the
corresponding clustered societies/nations, while lower scores indicate a weaker
culture dimension.
For instance, the way of life of countries in the Anglo cluster (characterised by a strong
cultural inclination towards Performance Orientation and Individualism) are very
different from those in the Eastern Europe (characterised by strong culture for In-
Group Collectivism and Gender Egalitarianism).
Likewise, cultures in countries of the Southeast Asian cluster have a stronger Humane
Orientation in their culture (softer in approach) compared to Germanic Europe which
are more driven by characteristics of Assertiveness, Future Orientation and
Performance Orientation (harder in approach). Nations inclined towards Confucianism
predominantly advocate In-Group Collectivism and also strongly support a high
throughput and performance culture. Interestingly, these countries have not registered
lower scores, particularly in the nine dimensions of the House et al.(2004) study
thereby indicating a unique specificity in the Confucian-oriented cultures.
Another pattern emerging from the GLOBE study was a larger group of clusters on the
global landscape (Confucian, Eastern Europe, Latin America, Middle East and
Southeast Asia) which inclined towards In Group Collectivism. This concentration also
demonstrated that the underlying cultural philosophy of Asians, Eastern Europeans
and Latin Americans favoured a collective unit rather than individualism.

63
Figure 2.2. The GLOBE study – Clustering, strengths and weaknesses. Source: Adapted from House, et al. (2004). Source: Adapted from House, R. J. , Hanges, P. J., Javidan, M., Dorfman,
P.W., Gupta, V. Culture, Leadership, and Organisations: The GLOBE
Study of 62 Societies, 2004 Sage Publication
Figure 5: The GLOBE Study - Clustering, Strengths & Weaknesses

64
The GLOBE study also revealed further insights on the leadership aspects prevailing
in the respective nations/societies. On the basis of the large and diverse responses
analysed (some 17,300 middle managers from 62 countries), 112 leadership traits
were identified and measured globally. Based on the “world means”, 21 leadership
scales were determined and subsequently statistically reduced to 6 scales:
1. Performance-Oriented style – Generally seen as charismatic and value
based; it depicts prevalence of high standards of output, decisiveness and
innovation;
2. Team-Oriented style – Driven by team cohesion, loyalty and collaboration
amongst members of the society;
3. Participative style – Fosters inputs from others in the decision making and
execution processes;
4. Humane style – Stresses compassion for others and is supportive to those in
need;
5. Autonomous style – Characterised by independent and individualist
approaches to leadership
6. Self-Protective style – Focuses on safety and security of the individual and/or
the group.
Figure 2.3 presents how social clusters in the GLOBE study have been rated in terms
of their degree of inclination towards the 6 rationalised leadership styles:
Figure 2.3. Leadership inclination. Source: Adapted from House et al. (2004)
Performance
Oriented
Team Oriented Participative Humane Autonomous Self or Group
Protective
High Anglo
Germanic
Nordic
Southeast Asian
Latin European
Latin American
Southern Asian
Confucian
Latin American
Eastern European
African
Lating European
Nordic
Anglo
Middle Eastern
Germanic
Germanic
Anglo
Nordic
Southeast Asian
Anglo
African
Confucian
Germanic
Eastern European
Confucian
Nordic
Southeast Asian
Anglo
African
Middle East
Latin European
Latin American
Middle East
Confucian
Southeast Asian
Latin American
Eastern European
Medium Confucian
African
Eastern European
Latin European
Latin American
African
Germanic
Middle East
Latin American
Eastern European
African
Latin European
Low Middle Eastern Eastern European
Southeast Asian
Confucian
Middle East
Latin European
Nordic
Anglo
Germanic
Nordic
The 6 Rationalised Leadership Scales in GLOBE Studies
Deg
ree o
f In
cli
nati
on
Figure 6: Leadership Inclination
Source: Adapted from House et al, 2004

65
As seen in Figure 2.3, Autonomous and Team Oriented leadership styles seem to be
more prevalent in a larger number of societies as depicted by the House et al. (2004)
study.
One of the most interesting elements that came to light from the GLOBE study is that,
generally in the countries studied, people want their leaders to be trustworthy, just,
honest, decisive (Hoppe, 2011).
2.4.3 Cross-Cultural Studies: The Trompenaars’ Perspective
Trompenaars and Hampden-Turner (1997) conducted their cross-cultural research
involving 15,000 employees from 50 countries, whereby the focus was on “cultural
extremes and incomprehension that can arise when doing business across culture”
(Rugman and Collinson, 2009). A comparison of where each country is positioned
relative to others was compiled and adapted, and is shown in Figure 2.4:
Figure 2.4. Country classification by Trompenaar’s culture dimensions. Source: Adapted from Trompenaar (1997) and Rugman & Collison (2009)
Universalist Individualism Neutral Specific Achievement Sequential
United States
United Kingdom
France
Belgium
Italy
Austria
Germany
Switzerland
C.slovakia
Canada
United States
Switzerland
United Kingdom
Brazil
Argentina
Mexico
Spain
Austria
Canada
Japan
Indonesia
Hong Kong
Singapore
United Kingdom
Argentina
Mexico
Venezuela
Spain
Austria
C.slovakia
United States
United Kingdom
France
Belgium
Austria
Switzerland
C.slovakia
Australia
Netherlands
United States
Australia
United Kingdom
Canada
Argentina
Mexico
Spain
Austria
Germany
Norway
Sweden
Sweden
North European
Particularism Collectivism Emotional Diffuse Ascription Synchronous
Japan
China
Indonesia
Hong Kong
Singapore
Brazil
Argentina
Mexico
Venezuela
Spain
Korea
Russia
India
Japan
China
Indonesia
Hong Kong
Singapore
France
Belgium
Italy
Germany
Switzerland
C.slovakia
Egypt
India
Italy
France
Belgium
China
United States
Brazil
Germany
Switzerland
Japan
China
Indonesia
Hong Kong
Singapore
Brazil
Argentina
Mexico
Venezuela
Spain
Italy
Germany
India
Japan
China
Indonesia
Hong Kong
Singapore
Venezuela
Brazil
Grance
Belgium
Italy
Switzerland
C.slovakia
Egypt
Turkey
South European
Latin American
Arabic States
Study based on Trompenaar's Culture Dimensions
(Relative Assessment & Classification)
Figure 7: Country Classification by Trompenaar's Culture Dimensions
Sources: Adapted from Trompenaar (1998) & Rugman and Collison (2009)

66
2.4.4 Cross-Country Studies: Ethical Business Culture
With a view to determine whether there is any link between the underlying ethical
business culture and the broader nation’s culture, an evaluation of the cross-country
studies was conducted. Amongst the various across-country studies conducted on
ethical business culture, the ones by Ardichvili, Jondle and Kowske (2010) and Alas
(2006) are of particular interest. The former study was undertaken to survey 13
countries in the Europe, Asia and America and evaluate the responses of over 23,000
managers/ employees more particularly the prevailing ethical business practices. The
key findings are analysed and commented on below:
The Anglo Cluster – Countries including the United States, United Kingdom, Canada
and Australia formed part of this cluster given their common cultural heritages and
close cultural dimension scales. Whilst other studies have confirmed these countries
as being high in individualism and low in uncertainty avoidance cultural traits, it was
noted that ethical cultures in these countries were based on the interrelationship
between formal structures and systems, and senior leadership ethical behaviour. The
authentic behaviours of leaders in supporting strong ethical standards and practices
are seen as a major enabler in setting the right operating framework for maintaining
ethical standards and combatting threats (Trevino & Nelson, 2014). The Anglo cluster
comes out as being strongest in emphasising the development, implementation and
enforcement of ethics standards and practices including setting out ethics-based
mission statements, enforcement procedures for reporting ethics deviances as well as
alignment to corporate values (Meyers, 2004; Trevino & Nelson, 2014). In an earlier
study, it was found that corporations in the United States have properly
institutionalised ethics guidelines and code of ethics with incentive systems to reward
ethical behaviours (Trevino et al., 1999).
The China Cluster (including Hong Kong) – Heavily reliant on the foundations of
Confucianism, the Chinese business leaders are guided by values originating from
Confucianism of “Ren” (Compassion), “I” (Appropriateness), “Li” (Norms) and “Chin”
(Wisdom) (Ip, 2003). Similar patterns were also found in Hong Kong, where leaders
were driven by values and principles such as benevolence, harmony, loyalty,
righteousness, humility, learning; all emanating from the Confucian/Ruism moral
foundation (Cheung & Chan, 2005). Another key underlying the operating philosophy

67
of Chinese business leaders is that of trust. It was noted that they tended to rely more
on trustworthiness of business partners than formalising business engagement
through contracts or agreements (Koehn, 2001). This further demonstrates the
influence of the Confucian value system on in the lives of the Chinese leaders and
people at large. Emphasis is also placed on social harmony and nurturing of genuine
relationships as these help in addressing sensitive issues openly (Chatterjee &
Pearson, 2003). The importance of fulfilling one’s own duties towards one’s ancestors,
elders and parents (filial piety) is also seen as fundamental in their behavioural system.
Chinese business leaders are also very sensitive to upholding their prestige and
honour by being right, successful and demonstrating stewardship in ethical behaviour
and practices (Hwang et al., 2003; Koehn, 2001; Li et al., 2007). Also guided by
collectivism, the Chinese businesspeople promote such moral values across their
organisations, thereby reinforcing the ethical culture in the group and ensuring that
deep routed socio-cultural phenomena continue within the organisation and society at
large.
The Japan Cluster – Though Japanese cultural traits and ethical behaviours are also
based on Confucianism; they have adopted their own ways in developing their society
and ethical value system. Also based on the principles of harmony and benevolence
(as seen in the Chinese culture), it was advocated that Japan however places more
prominence on “situational ethics” and tend to rely on policies on business ethics to
guide ethical decision making (Chung et al., 2008; Nakano, 1997). This ethical
behaviour was found to be stronger in the Japanese business context compared to
the one in the United States).
The Continental Western and Central Europe Cluster – The underlying cultural and
historical diversity in this particular cluster makes it difficult to make a common view
on the ethical approaches in Western and Central Europe. Already, France and
Germany have been treated separately in other studies given their underlying cultural
differences (Jackson, 2001). The ethical systems, approaches and practices
prevailing in this particular cluster are somewhat different to the ones prevailing in the
United States. According to Crane and Matten (2004), continental Europe places more
emphasis on the application of legal frameworks to guide and control business conduct
rather than on ethical systems (such as codes of ethics, ethical standards, etc.). This

68
is more prevalent in the United States given the magnitude of their budget allocation
and policies towards the promotion of ethics systems and programmes (Mele, 2008).
The Germans also viewed the ethical practices prevailing in the United States as being
overly prescriptive and legalistic due to their strong belief system on law for all
(universalism), irrespective of context/circumstances (Trompenaars & Hampden-
Turner, 1997).
The Latin America Cluster – Countries in this cluster have been subject to a higher
level of ethical violations, corruption, political instability, poverty and deviations from
established religious and moral values (Arruda, 1997). Furthermore, the business
culture prevailing in a country like Brazil is heavily characterised by paternalism, power
concentration, loyalty to leaders and social cohesion whereby group leaders reward
their supporters, through welfare strategies and social ethics, for their loyalty (Tanure
& Duarte, 2005). One very interesting piece of ethical findings from Tanure and
Dharte’s (2005) study is that Brazilian leaders have embraced an “intermediary path”
or “adaptation mechanism”. This enables them to manoeuvre existing between a tight
legislative environment and what is practically possible. In other world, people and
businesses find a middle ground between what is and what is not allowed (referred to
as “jetinho” in the Brazilian culture). This flexible approach brings with it possible
benefits to the Brazilian business community but also exposes it to abuses by being
in “grey” zone.
The Kingdom of Saudi Arabia and Middle East Cluster – As found in various
across-country cultural studies, individual and business behaviours in Arab countries
are largely (if not, totally) influenced by Islamic principles and moral values. Business
transactions, within the cluster, are governed by the law of Islam and most dealings
have to pass the moral filter test with traders obliged to provide full disclosures on their
products and services in a fair and transparent way (Abbasi et al., 1989; Rice, 1999).
Characterised by collectivism, countries in this particular cluster favour group
cohesion, social welfare for all, and maximising social good. As such, business leaders
tend to decide on the basis of what would yield maximum value for the organisation
and society at large, and on what is right or wrong (Rawwas, 2001).
The India Cluster – India has been studied in comparison with the ethical culture and
practices in the United States. The findings of Chakraborty (1997), Jackson (2001)
69
and Carroll, Brown and Buchholtz (2016) demonstrate considerable differences
between these two cultures as to how they view ethical business behaviour. The
business leaders in the United States are more analytical in their ethical decision
making and rely more on normative ethics, while Indian businesspeople rely more on
traditions and relations, and unconditional loyalty to their organisations. However, it
was also noted that business leaders of these two states view profit/value creation as
being the most important as compared to ethics in business.
To summarise, it was also found that:
American and Indian business leaders are perceived to be promoting ethical
cultures more than other societies. They also place more emphasis on
shareholders’ interests. This in itself, could be a form of pressure leading to
ethical violations whilst fulfilling the demands of the shareholders (quest for
profits versus ethics dilemma).
Countries in the Anglo cluster have stronger policies and systems such as
whistleblowing avenues to report ethical deviances.
Indian and Saudi Arabian businesspeople seem to advocate an
institutionalisation of ethical standards and behaviours within the organisations
whilst ensuring their behaviours are aligned to corporate values.
On the basis of the GLOBE project, further empirical research was undertaken, on
ethics in countries with different culture dimensions, by Alas (2006) with a group of
4,874 respondents from 12 countries. He classified the 12 countries into two groups
namely Group-1 (comprising of China, Poland, Hong Kong, South Korea, the United
States and Hungary), based on cultural dimensions of “Institutional Collectivism”,
“Future Orientation” and “Uncertainty Avoidance”, and Group-2 (comprising of Japan,
Italy, France, Finland, Estonia and Spain), based on cultural dimensions of
“Assertiveness”, “Performance Orientation”, “Power Distance” and “Group
Collectivism”. It was noted that countries in Group-1 valued ethics more than those in
Group-2. Societies with a lower inclination towards “Performance Orientation” valued
relationship (e.g. for family and society), loyalty and belonging more than those
societies driven by the quest for performance (Koopman et al., 1999). Similarly,
societies with a higher inclination for “Power Distance” had lower degrees of

70
integration between social groups (Carl et al., 2004). The levels of motivation were
higher amongst individuals in societies having a future-orientated culture.
The need to bring moral considerations into decision making was found to be crucial
in developing ethical culture. People need to be trained on how to apply moral
judgement in the process of decision making. Furthermore, the successful
implementation of codes of ethics depends heavily on how it is integrated within
organisational systems, the sort of rewards applicable for promoting and
demonstrating ethical behaviours, and the type of consequences set for ethical
violations. All these have been seen to be key enablers in nurturing the “right” ethical
standards and practices in many countries where studies have been conducted (Alas,
2006).

71
2.5 ORGANISATIONAL CULTURE, BEHAVIOUR AND LEADERSHIP
2.5.1 Introduction
The foregoing sections highlighted the overarching importance of culture, ethics and
national culture in the context of the present study. This chapter now describes the
first cluster of the conceptual research model regarding the macro variables under
study. The literature review, going forward, will focus on the specific variables of the
model and how they all fit together in a wider puzzle. This section will explore the
theoretical concepts of organisational culture and organisational behaviour
management and study the dynamics in family-owned and non-family owned
institutions. As the economic environment of Mauritius is widely dominated by family-
owned companies, with a majority controlling the top 10 chart show (Business
Publications Ltd, 2018), the objective will be to understand how this phenomenon in
ownership evolves in the international arena. This will also help to identify
organisational culture and behavioural patterns in relation to shareholding models and
how far they can be compared to the ones in Mauritius. The topics under study will
also review organisational culture typologies so as to identify their relationships with
leadership styles and theories. A broad review of the interrelationships between
organisational culture and other important variables such as personal values of
leaders, operational excellence system, organisational agility and employee
performance will be relevant for this study. The study of the existing empirical findings
from the global scene will help in comparing the future results when the study is
undertaken in the context of Mauritius and the effects on the identified micro-level
variables of the conceptual research model.
2.5.2 Organisational Culture - The Origin in the Modern Era
The origin of human organisation and emergence of modern culture could be traced
back to the philosophical works of Immanuel Kant, The Critique of Judgement, (Kant,
1790). His work was based on the fundamental concept and faculty of cognition
highlighting critical enabling factors such as freedom, justice and reasoning. The
interrelationships between “Understanding”, “Judgement” and “Reasoning” were also
explored from a philosophical standpoint and seemingly drew attention to a leading

72
question of Kant’s theory of culture (how is it possible to communicate about new
events which cannot necessarily be expressed in our words and rules?).
Based on Kant’s work, Harste (1994 p.4) provided a sociological definition of culture
as “Culture has to be considered as a form of communication which makes it possible
for different human beings to undertake judgements of unusual situations and cases
in the same indeterminate, reflexive and unconditional way”.
In the second part of The Critique of Judgement, (Kant, 1790/1914) put forward an
aspect relating to the modern theory of “self-organising systems” highlighting how
nature organises itself and forms its own systems in order to distinguish itself from the
environment. Based on Kant’s work, Harste (1994, p.5) provided the following
definition of organisational culture: “Organisation culture is created when groups of
human beings can, in spite of their differences, reflexively judge in a common,
universalising way how the organisation can be differentiated from the demands of the
environment”.
Based on these foregoing works, it is apparent that the three main constituent parts of
culture are:
(a) The codification of civilised interaction;
(b) The codification of civilised organisation; and
(c) The culture of communication.
The key contribution of the Kantian theory is that organisational culture is based on a
trusted acceptance of differences, where employees share goals, self-organise and
mobilise themselves as a collective unit intimately linked with the organisation to attain
the set goals.
2.5.3 Organisational Behaviour
Many experts and philosophers such as Plato (427-347BC), Smith (1723-1790),
Taylor (1856-1915), Weber (1864-1920), Follet (1868-1933), Mayo (1880-1949),
Barnard (1886-1961), McGregor (1906-1964) and Maslow (1908-1970) have studied
organisations in the past centuries. However, Follet (1868-1933) set a new foundation
with a pioneering approach applied to organisation behavioural aspects such as

73
organisational democracy, team dynamics, employee involvement, conflict
management, power and leadership (McShane & Von Glinow, 2010). McShane and
Von Glinow (2010 p.4) define organisation behaviour as “the study of what people
think, feel and do in and around organisations” and it focuses on employee behaviour,
decisions, perceptions and emotional responses.
A deeper look into the concept of organisational behaviour reveals important sub-
constructs of organisational psychology and commitment, employee engagement, and
organisational citizenship behaviour . In recent years, the concept of “employee
engagement” has gained popularity amongst business strategists and leaders, given
empirical evidences of its impact on productivity, working environment, and
organisational success (Towers Perrin, 2003; Macey & Schneider, 2008). Towers
Perrin (2003, p.2) defined engagement as “employees’ willingness and ability to
contribute towards company success…the extent to which employees put
discretionary effort into their work”. It is made of different psychological states such as
involvement, mood, attachment, commitment, job satisfaction, positive affectivity, etc.
(Ludwig & Frazier, 2012; Macey & Schneider, 2008; Saks, 2006). Rational and
emotional aspects form the two major sub-constructs of engagement (Corporate
Leadership Council., 2009). Rational engagement is “the extent to which employees
believe that managers and organisations have their self-interests (financial,
developmental or professional) in mind”. Emotional engagement is seen as “the extent
to which employees value, enjoy and believe in their jobs, managers or organisations.”
(Corporate Leadership Council., 2009)
Daniels (2010) proposed an alternative view of engagement, that of organisation
behaviour management, commonly termed as “OBM”. Whilst he highlighted the effects
of human behaviour on organisational outcomes, he stressed the fact that
organisations need to craft their operating policies, systems and practices in line with
the known facts about prevailing behaviour so as to create an engaged workforce.
Literature reviews show that there are some critical elements that need to be
considered in the process of organisational behaviour management (Ludwig & Frazier,
2012):

74
(a) Reinforcements – The role of “positive reinforcement” (recognising and
rewarding good behaviours) in creating effective and engaging work
environment (Daniels, 2010).
(b) Adequate Resources – The role of “availability of adequate resources” in
promoting the right behaviour thereby enabling employees to engage and
deliver successfully (Deming, 1986).
(c) Management Behaviours – The enabling role of “clarity of tasks and goals” in
the overall execution process whereby ambiguities are identified and
proactively corrected leading to positive employee behaviours.
(d) Autonomy – The ability of setting one’s own goals and providing a span of
control gives a feeling of greater responsibility for the outcomes of one’s own
work culminating in work motivation and positive desirable behaviours (Ludwig,
2001).
The behaviours emanating from these critical elements create a positive psychological
state amongst employees of organisations whilst also fostering organisational
commitment, productivity, loyalty and organisational citizenship behaviour (Allen &
Meyer, 1990; Brown et al., 2005; Skinner, 1974; Yadav & Punia, 2012).
Having discussed organisational behavioural aspects in a broad perspective, it is
critical to also gain understanding of the behavioural dynamics within family-owned
organisations. This will be relevant to the context of the present study in Mauritius,
where a significant number of large private organisations are family-owned (Business
Publications Ltd, 2018).
The study of organisational behaviour in family businesses is another interesting
dimension for scholars and business leaders to examine so as to understand the
behavioural dynamics of individuals, and interpersonal and group-level relationships.
A family business is characterised by its members exerting significant control over its
affairs (Gagné et al., 2014). There is a predominance of family businesses across the
world, with nearly a third of 500 S&P listed companies and around half of the Fortune
1000 being family businesses (Astrachan & Shanker, 2003). La Porta, Lopez-de-
Slianze and Shleifer (1999) studied 27 wealthy economies, more specifically the

75
ownership pattern, and the predominance and heritages of family ownership was
found to be even higher in Africa, Asia, Europe, Latin America and Middle East.
The organisational behavioural processes and outcomes in family businesses are
likely to be different from those in the non-family firms on the following fronts (Gagné
et al., 2014):
(a) The economic behavioural dynamics whereby family businesses tend to
promote communal relationships. Here benefits are given to improve welfare of
the related members of the community rather than following an economic
exchange principle of equitable transaction of benefits between two parties as
applicable commonly in non-family businesses (Clark & Mills, 2011);
(b) Goal setting processes and goal readjustment strategies of retiring founder
members;
(c) Commitment level to family firms;
(d) Behavioural patterns and characteristics of upcoming generation’s members;
(e) Career development strategies of family and non-family top executives.
Furthermore, the role that values play in a family-oriented structure or organisation is
key for consideration. For example, values define acceptable norms of behaviour and
are passed on to generations. The longevity of family businesses has also been widely
influenced by family values. Kotlar and De Massis (2013) reveal some very interesting
learning points, where the nature of interactions varies between family and non-family
organisations. For instance, interactions are predominantly affective, guided by the
family hierarchy and with members sharing the history and vision of the future in family
owned institutions. On the other hand, in organisations where individuals are not
related by family ties, interactions and bargaining are based on the principles of
rewards (for good behaviour and performance) and sanctions (for adverse behaviour
and performance). Moreover, in family businesses, founders play a central and long
standing leading role, guiding generations over a period of time. However, their
preparation to pass over control tends to be problematic if not properly planned. In an
empirical study conducted by Gagné, Sharma and De Massis, (2014), it was noted
that retiring founders with strong willingness to disengage from their initial role
embrace a satisfactory post-retirement journey. Trust, justice and handling conflicts
are other key elements influencing behaviour in family businesses. Repairing trust

76
violations (competency-based or integrity-based) in individuals and groups could be a
challenging task. This is because of a broader set of risks such as family members’
rivalries, conjugal issues, succession and heritage concerns, family altruism and
power handling. Consequently, conflicts are bound to occur, and their frequency and
magnitude have been found to be increasing with closer family members within
organisations. Thus the institutionalisation of family councils to deal with governance
of such matters (McKee et al., 2014).
Having reviewed the organisational behavioural aspects and issues relevant to the
business context, it is necessary now undertake a study of the broader perspectives
of organisational culture. This will help to determine how behaviours of individuals,
groups of individuals, leaders and followers result in a culture of its own forming in the
organisation. It will also help to gauge the interrelationships between organisational
culture, common behavioural traits, and organisational performance which is key to
the context of this present study.
2.5.4 Organisational Culture - Perspectives and Typologies
Being a key independent variable of the model being studied, organisational culture
needs to be accordingly studied from a theoretical perspective. The understanding of
its typologies may provide further insights on any pattern in ethical behaviour and
practices that could potentially be useful to the present study. Organisational culture
refers to a “system of shared meaning held by members that distinguishes the
organisation from other organisations” (Robbins & Judge, 2013, p.512). It can also be
seen as a complex set of artefacts as a 3-tier structure (visible and feelable elements),
adopted beliefs and values (values, ideologies, goals and aspirations) and basic
underlying assumptions (unconscious or taken-for-granted beliefs and values)
(Schein & Schein, 2017, p.18). McShane and Von Glinow (2010) saw organisation
culture as the shared values and assumptions within an organisation that direct every
member to do things in the “right way”. Often considered as the organisation’s DNA,
organisational culture shapes the working environment.
Schein (2010, 2016) highlighted that organisational culture basically stems from the
following three sources:

77
(a) The beliefs, values and assumptions of the founders;
(b) The learning experiences gathered by the members of the organisation over time;
(c) The new beliefs, values and assumptions emanating from new leaders and joiners.
Schein (2016) considered organisational culture as a powerful but largely invisible
social force. Because organisational culture affects how employees perceive things
within the enterprise and various other aspects of their work, there is a need to
carefully manage the organisational culture and its evolution.(Reeves & Bednar,
1994).
Organisational culture is also regarded as the norms and expectations that are shared
amongst the group of employees and which guide them how to think and behave in
their work environment (Cooke & Rousseau, 1988). It is the character or personality
of an organisation which directs how employees behave, work, react and
communicate (Ribiere & Sitar, 2003; Schneider, 1990a).
Kotter and Heskett (1992, p.11) stated that their studies revealed that “corporate
culture can have significant impact on the long term economic performance and will
probably be an even more important factor in determining the success or failure of the
firms in the next decade”. This confirms the critical role that organisational culture
plays in the development and survival of enterprises and why it warrants further study
in various contexts.
2.5.4.1 Organisational Culture Typologies
Many scholars and researchers have been studying the underlying constructs,
dimensions or types of organisational culture.
Wallach (1983) has identified 3 main categories of cultures namely:
(a) Bureaucratic culture, being hierarchical in nature and characterised by
centralised authority and decision making powers. Often very structured and
procedural in nature, they tend to be found in large organisations operating in
stable market conditions (Zhang & Zhu, 2012);
(b) Innovative culture, characterised by a dynamic environment where people
demonstrate a creative and entrepreneurial mindset, challenging the status-quo
and who are ready to embrace challenges and risks. Individuals within such

78
organisations are results-oriented and ambitious in nature and tend to influence
the organisational culture and behaviours with such traits (Hauser & Paul,
2006);
(c) Supportive culture, as the word expresses, promotes supportive, helpful and
friendly environment leading to a harmoniously, equitably, socially, and
collaboratively inclined working environments. It is often seen as a warm place
to work almost like an extended family unit (Ismail Ababaneh, 2010; Lund,
2003; Wallach, 1983).
Cameron and Quinn (2006) proposed four types of culture comprising of:
(a) Clan Culture – A typically very friendly and family-oriented working
environment where the leaders are often regarded as the father-figure or
mentor. This culture lays emphasis on loyalty and traditions whilst favouring
teamwork, participation and consensus amongst members of the organisation.
The culture is also characterised by high levels of engagement.
(b) Hierarchy Culture - Usually this culture promotes a very formal and structured
work setting with procedures and rules directing how everyone has to work and
operate within the organisation. The leader tends to focus on policies and
reliable delivery with control and decision making flowing from the top down.
(c) Market Culture – This culture promotes a result-oriented environment amongst
all members thereby favouring competitiveness. The organisation is tied
together with a mindset of winning.
(d) Adhocracy Culture - The work environment is characterised by dynamism,
entrepreneurial and creative philosophies. Leaders promote innovation and risk
taking with emphasis laid on growth, trendsetting and creating new market
space.
Cooke and Szumal (2013) proposed a different perspective to culture types as
compared to Quinn and Cameron (2006). Cooke and Szumal (2013) put forward three
culture types comprising of:
(a) Constructive Culture – Whereby the organisation promotes healthy
interactions with freedom to share ideas amongst all individuals. Such cultures
also promote motivation amongst employees and a positive working ambiance

79
with minimal degrees of conflicts as they feel their views and ideas are heard
and considered.
(b) Passive Culture – Employees operating in organisations with passive cultures
tend to work and please their superiors. They tend to abide (even unhappily)
and follow the rules just to ensure they keep their jobs safely. Decisions stay at
the level of the boss who commands the operations. The conduciveness of the
work environment may be a challenge in such cultures.
(c) Aggressive Culture – In such a culture, employees are encouraged to
compete amongst each other with a view to outperform fellow workers. This
culture tends to promote perfectionism, competitiveness, opposition and drive
for power.
From the literature review, it was noted that several other types of cultures were
identified and studied by scholars, researchers and leadership gurus.
Transformational, transactional, entrepreneurial and innovative cultures are other
commonly-spoken cultures.
Transformational organisational culture is characterised by flexibility, adaptability
and innovation capabilities within the organisation and the way it operates. Employees
in such cultures encourage open discussions and formulation of new ideas to address
business challenges. They often make extra efforts with passion and determination to
go beyond their self-interests and attain their goals (Bass, 1998). Transformational
leaders permeate transformational cultures within organisations. Five key constituent
parts of transformational leadership are idealised attributes, idealised influence
behaviour, inspirational motivation, intellectual stimulation and individual consideration
(Bass & Avolio, 1993). It was found that there is a strong positive correlation between
transformational cultures and individual / organisational outcomes (Parry & Proctor,
2001).
On the other hand, in organisations with transactional cultures, people tend to
measure predominantly with a financial lens. Under such cultures, individualism is
largely prominent and often, the self-interests of people are put ahead of those of the
organisations (Bass, 1998; Bass & Avolio, 1993). Furthermore, it was also found that
transactional culture correlates significantly and negatively with organisation and
leadership outcomes (Parry & Proctor, 2001).

80
2.5.5 Interrelationships between Organisational Culture, Personal
Values and Organisational Performance
2.5.5.1 Relationship between Personal Values & Organisational Culture
Many researchers have studied the linkages between leaders’ personal values, their
leadership styles and organisational culture (Chatman & Barsade, 1995; Douglas et
al., 2001; Parsons & Shils, 1951; Schein, 2010). A common pattern was found
whereby personal values of leaders are intrinsically linked with organisational culture.
Leaders’ personal values and personalities influence the group behaviour within an
organisation, forging a particular type of culture (Schwartz, 1992).
A few theories will be used to support this argument namely, institutional theory, social
learning theory, social exchange theory and the concept of isomorphism. Institutional
theory proposes that the organisation is a legitimised pattern of social behaviour that
gradually finds a way to normalise itself whilst minimising the risks of uncertainty over
a period of time (Bondy, 2009). It concerns the deeper aspects of social structures
including processes, norms and rules such that they become firm and authoritative
operating guidelines for social behaviour. This theory emphasises rational myths,
isomorphism and legitimacy (Scott, 2008). Whilst organisations try to find their
legitimacies to successfully operate within their socio-economic boundaries, they tend
to respond by incorporating elements of institutions in their own products, services and
ways of conducting business. In so doing, many such institutions imitate by embracing
socially accepted ideas and recreating already accepted practices. This process has
been coined isomorphism (Dimaggio & Powell, 1983). There are typically three types
of pressures causing isomorphism namely:
(a) Coercive isomorphism, whereby institutions are forced to adopt cultural
expectations of their societies by both formal and informal pressures. For
instance, pressure to comply with government rules, societal norms, and
regulatory and financial reporting standards would cause such coercive
pressure in a typical workplace environment;
(b) Mimetic isomorphism, whereby organisations imitate or model themselves on
other institutions or competitors to withstand challenges and uncertainties in the
operating environment. Often others’ success, systems and practices may be

81
perceived as more lucrative and effective and hence driving institutions to mimic
the others;
(c) Normative isomorphism, whereby pressure for change is brought by the
profession. Often, people from the same school of thought or education
background will approach a particular problem in a similar way (Dimaggio &
Powell, 1983). This creates another pattern in dealing with things in an
organisation.
All the above forces drive organisational change. They put pressure on the
organisation to embrace a particular path, operating approach and form a particular
culture.
Likewise, the social learning theory of Bandura (1977) considers that employees learn
from others. In other words, they learn from the values, attitudes and behavioural
patterns of their leaders. The followers view their leaders as the role models and tend
to imitate them.
In addition, the social exchange theory posits that human relationships are developed
on the concept of exchange or of mutually rewarding processes (Homans, 1958,
1961). Leaders have the capability of creating a cohesive group by their personality
and leadership traits. The more cohesive a group is, the more the team members
exchange feelings or activities amongst themselves, and the more they relate to each
other. Employees tend to go the extra mile in terms of delivering on assignments, goals
and targets in return for benefits and support obtained from their leaders, as they
perceive value recognition in the process (Mayer et al., 2009; Rioux & Penner, 2001).
Schwartz (1992) classified his identified 10 value types (i.e., self-direction, stimulation,
conformity, tradition, security, universalism, benevolence, achievement, power and
hedonism) into two bipolar building blocks:
Openness to change (characterised by self-direction and stimulation) versus
Conservatism (characterised by conformity, tradition and security). Leaders
with a dominant openness to change tend to think and act independently and
foster an adhocracy culture. In contrast, leaders with an inclination towards
conservatism tend to foster a hierarchical culture characterised by conformity
and stability.

82
Self-transcendence (characterised by universalism and benevolence) versus
Self-enhancement (being achievement and power). On the one hand, people
with dominant self-transcendental values tend to lay emphasis on welfare,
equity and acceptance of others thereby fostering a clan culture. On the other
hand, leaders characterising power with self-enhancing values tend to control
resources and achieve market growth and personal success.
Recent research conducted by Gao (2017) which studied 370 business leaders of
independent native organisations in China found that leaders with different sets of
personal values create different types of organisational culture. This research
somewhat confirmed Schein (2010) who also found that leaders of organisations,
consciously or unconsciously influence organisational culture through their personal
values. They put their imprints on the organisation.
2.5.5.2 Relationship between Operational Excellence and Organisational
Culture
The world has become fiercer and more competitive, with ever changing market
conditions and the growing influence of technology in the lives of people and
organisations. It has therefore become even more important for today’s organisations
to embrace operational excellence initiatives so as to stay in the game over the
medium to long term. Operational excellence is considered “a strategic weapon” and
is based on a combination of “a set tools, quality improvement methods and deeper
business philosophy of human and people motivation” (Liker, 2004, p.18). In other
words, it is about focusing on the philosophy of leadership, teamwork, problem solving
and continuous improvement throughout the organisation and laying emphasis on
customer needs, empowerment and process optimisations. The European
Foundation of Quality Management (2018) provides a similar perspective of
operational excellence in that “Excellence is about doing your best…and every day,
we are reminded of how important it is to strive for excellence, be it in life or at work.
By nurturing a culture of excellence within your organisations, you open the path to
success.” (EFQM, 2018).
The literature review indicates that scholars have established relationships between
operational excellence and both organisational culture and organisational agility
(Carvalho et al., 2017; Lee et al., 2015). Excellence is intrinsically related to the values

83
and cultures of organisations and there is a strong need to ensure cultural fitness when
deploying strategies for operational excellence programmes to ensure effectiveness
and success (Adebanjo, 2001; Aziz & Morita, 2016; Evans & Jack, 2003; Maull et al.,
2001). Organisational agility is “the organisation’s ability to develop and quickly apply
flexible, nimble and dynamic capabilities… and encompass more broadly an
organisation’s capacity to respond and adapt quickly and thrive in the changing
environment” (Holbeche, 2015, p.11). In other words, it is a state where organisations
can appropriately react and adapt to sudden disruptive business and market
environments (Iizuka & Kaneko, 2014). The way in which an organisation reacts to
unexpected changing business environments (through its leadership, culture,
strategies, people engagement and commitment, systems and execution approaches)
would dictate its long term sustainability. The role of quality, together with excellence
programmes and models, has also been emphasised by many scholars and
institutions. This is because they are key determinants in establishing the right
institutional structures and systems to enable operational excellence within
organisations (Shingo Institute, 2018). Scholars have also explored the fitness
between organisational culture and excellence programmes and found them to be
positively related (Evans, 2010; Irani et al., 2004). The Shingo Model, for instance,
aims at elevating the level of organisational practices, guiding principles, systems,
tools and culture to achieve a higher level of efficiency and results in the long run
(Shingo Institute, 2018).
Figure 2.5. Shingo modelTM
Source: https://shingo.org/model
Shingo Institute (2018)

84
However, a major reason behind the failures of quality systems or excellence models
is due to a neglect of the factors that make them sustainable in the future (Bertels &
Buthmann, 2013). This is intrinsically linked to the degree of emphasis which leaders
place on its post-implementation stages in ensuring that organisational culture and
behaviour are tuned properly to support such models throughout the journey. An
organisational culture that promotes continuous improvement behaviour from
employees, across levels, is more likely to achieve better performances than those
with lesser culture-orientation.
2.5.5.3 Relationship between Organisational Culture and Organisational
Performance
Organisational performance refers to the measurement of the extent to which the
management goals of a business are achieved. (Duquette & Stowe, 1993). Past
research and empirical findings show that organisational culture has a strong influence
on organisational performance (Barney, 1986; Kotter & Heskett, 1992). It was also
found that strong cultural standards render organisations more efficient and ultimately
influence performances through appropriate behavioural patterns (Peters &
Waterman, 1981). Brown (1995) also suggests that organisational culture is a strong
tool for improving performance and can stand as a prominent competitive differentiator
for enterprises. Magee (2002) further drew attention to the fact that culture is
intrinsically connected to organisational practices and performance. Organisational
culture is thus seen as a management control tool capable of directing and controlling
employee behaviour as well as building commitment towards the achievement of goals
(Sun, 2009).
However, bureaucratic culture reduces short-term profitability and hampers long-term
growth to the point that it can even threaten the survival of an organisation (Ogbonna
and Harris, 2000). Subsequent studies conducted in the first two decades of 2000
somewhat confirmed a similar trend whereby organisations with bureaucratic cultures
faced job satisfaction and performance challenges unlike supportive and innovative
cultures (Brewer & Clippard, 2002; Huey Yiing & Zaman Bin Ahmad, 2009;
Silverthorne, 2004; Zhang & Zhu, 2012).
Literature-based theory emphasises the importance of culture as a prime enabler for
innovation and enhancement of quality and organisational performance (Bass and

85
Avolio, 1990). Furthermore, companies that supplemented the development of their
organisational cultures with the implementation of management maturity
systems/models have records of long term sustainable success. Such models include
the Balanced Scorecard (Kaplan & Norton, 2001), Crossby’s Qualilty Management
Maturity grid (Crosby, 1979), Capability Maturity Models (Humphrey, 1989), Process
and Enterprise Maturity Model (Moreira & Gutierrez, 2010), Capability Maturity Model
Integration (CMMI Institute LLC, 2018) and ISO 9000:2009 (International Organisation
for Standardization, 2009). However, it was also noted that several such
implementations have failed to deliver on expectations due to an absence of
leadership and organisational commitment to sustain it over the long run (Bertels and
Buthmann, 2013; Naftanaila and Cioana, 2013). A recent study conducted in China
which surveyed the largest state-owned steel company found that both innovative and
supportive cultures are positively associated with organisational performance.
Management maturity had an indirect relationship and a moderating effect on the
dependent variable of organisational performance (Kuo & Tsai, 2017).
Research conducted in Russia found that there is a significant relationship between
firm’s performance and dismissal of senior executives (Abe & Iwasaki, 2010).
Organisations with a dominant shareholder were more likely to dismiss the whole
management team compared to companies with foreign ownership that would tend to
cause a partial turnover, that is, limit the replacement to the senior most executive
only. The study shows that non-payment of dividends is a major decisive factor for the
dismissal of top executives in the Russian society. Similar patterns were found in
transition economies such as Ukraine, China and the Czech Republic. In countries
such as the United States, United Kingdom, Germany, Denmark, Japan, Australia etc.
the performance of stocks was also found to be a key determinant for dismissal of top
executives (Abe & Iwasaki, 2010). It appeared that Russian executives are somewhat
able to avoid the adverse impact for their poor performance compared to those in
America and Japan. Management accountability practices in Russia were also rated
as being highly deficient (Fey & Denison, 2003).
2.5.5.4 Ambidextrous Organisational Culture and its effect on Performance
Tushman and O’Reilly (1996) put forward an interesting perspective to the study of
organisational culture with the concept of ambidexterity. They state that firms that are

86
capable of simultaneously exploiting the existing capabilities and exploring new ones
are ambidextrous in nature. Such cultures, built upon the two underlying processes of
learning (exploitation and exploration) and foster innovation within the organisation
(Rafailidis et al., 2017; Tushman & O’Reilly, 1996). Organisations were also called to
hold a relative balance between exploitation and exploration so as to ensure
successful innovation and long term success (Gibson & Birkinshaw, 2004; March,
1991; Tushman & O’Reilly, 1996). In an ambidextrous organisational culture,
employees and their leaders should continuously refine their knowledge base, skills
and expertise through the research process and/or creating new knowledge (Mom et
al., 2009).
It was also found that quality acts as mediator between organisation learning culture
and innovation and that total quality management promotes innovation performances
(Martınez-Costa & Martinez-Lorente, 2008; Rafailidis et al., 2017). Rafailidis, Trivellas
and Polychroniou (2017) studied Small and Medium Enterprises (SMEs) in the
technology space in Greece, an area very relevant to this present research, and noted
that organisational culture oriented towards exploitation and exploration learning and
development capabilities positively impacted innovation performance (Dahlgaard-Park
& Dahlgaard, 2010). The influence of the ambidextrous nature within the
organisational culture enables success through quality and competitive capabilities. A
general consensus was also noted whereby organisations that are permeating a
culture of creativity, innovation and performance-orientation amongst their employees
have a competitive edge for long term sustainability (Chang & Lee, 2007; Hartmann,
2006; Lau & Ngo, 2004).
2.5.6 Organisational Culture: Does size Matter?
When studying organisational cultures, a prominent question that often comes to mind
is whether the size of organisations matters. In other words, would business cultures
differ in organisations categorised as small, medium and large? With a view to respond
to this question, one may refer to the research work of Gray, Densten and Sarros
(2003) which put forward interesting empirical findings based on a survey conducted
in Australia whereby the perceptions of 1918 executives were studied. Organisations
are often categorised by the number of people they employ, and this may vary between

87
countries. In certain countries, organisations employing less than 100 people would
be classified as “Small” whereas in others they may be classified as SMEs. The
underlying findings indicated that small groups would tend to operate and evolve
differently from the larger ones (regardless of the threshold being used for such
classification). It was found that small entities are more competitive, performance
oriented, supportive and innovative, compared to larger organisations. The structures
of SMEs and the ways they operate, compete, and respond to business challenges
are indeed different from larger organisations (Man et al., 2001); corporate cultures
are fundamentally different between small, medium and large organisations
(Julien,1995). Whilst SMEs evolve with greater flexibility, given their light and organic
structures, larger organisations tend to be more bureaucratic with heavier structures
and lower levels of trust (Alvesson, 2002; Ghobadian & Gallear, 1997). Due to these
underlying differences in resource strengths, strategies, approaches and inter-
relational complexities within larger groups, organisational cultures are shaped
differently (Denison & Mishra, 1995; Schneider, 1990a). In essence, SMEs tend to
have a flexible culture, are ready to embrace change, and have a competitive
advantage over their larger counterparts. Organisations that show concern for their
people with higher degrees of supportiveness are better at enhancing competitiveness
(Ettlinger, 1997). The objective of the current research was to test whether similar
patterns could be found in the context of Mauritius.
Another major construct tested empirically in the study was “ethical leadership and
decision making”. It was thus appropriate to first explore the various leadership
theories and approaches prior to embarking in the theoretical exploration of ethical
dimensions of leadership.
2.5.7 Leadership Theories and Approaches
In the early part of the 20th century, leadership research was orientated towards
understanding leadership traits such as personality factors and abilities (Bass, 1990).
Subsequently, it was noted that the study of leadership traits was not enough, and a
shift was made in emphasis towards leadership styles and behaviour whereby the
interpersonal elements (leader-follower relationship) and task orientation were
considered as critical dimensions making leaders effective (Bryman, 1992). Further
developments in research, revealed that even leadership traits and styles were

88
insufficient determinants of leader effectiveness. In the 1960s-1970s period, many
scholars postulated that situation is the other new dimension necessitating attention,
as it creates the required conditions for leader efficacy (Aronson, 2001). This led to
the emergence of contingency theory (Fiedler, 1967), situational leadership (Hersey &
Blanchard, 1969b), path-goal theory (House & Mitchell, 1975) and leadership
substitutes. In recent times, the phenomenon of transactional, transformational and
charismatic leadership became prevalent whereby researchers explored their
interrelationships and how they influence processes (Bums, 1978; Conger & Kanungo,
1988; Kerr & Jermier, 1978).
Dion (2012) conducted a scan of key leadership theories together with a critical view
of the interrelationships between the leadership approaches and ethical theories. To
understand the dynamics between leadership, culture, ethics, ethical theories, and
behaviour, it is key to first understand the various leadership approaches that exist
and their underlying characteristics. Some of the key ones are:
2.5.7.1 Directive Leadership
This is often considered as an instructional type of leadership style, where the leader
would tend to tell the subordinates what to do. Flamholz (1990) provided a larger
spectrum of directive leadership types, presented as a continuum of the following:
Autocratic - Typically directive in approach with instructions flowing top down
and decision making powers resting in the hands of the leader
Benevolent-autocratic - Typically leaders with decision or policy making
powers and control but yet guided by noble benevolent values, e.g. religious
leaders, Buddhists Monks, Kings/Monarchs, etc.
Participative - Typically guided by a collective approach to decision making
with the leader having a more decisive role or authority in the overall process
Consultative - Typically leaders with strong willingness to consult their
surroundings prior taking decisions
Consensual - Typically reliant on a consensus being reached with concerned
parties’ prior execution of any assignment or project
Laissez faire - Typically where leaders are hands-off and allow decision
making by group members, i.e. an attitude to allow them to do whatever they
want

89
2.5.7.2 Self- Leadership
The theoretical foundation of self-leadership stems from social learning and social
cognitive theories (Bandura, 1986). Self-leadership is about how a leader can
influence his/her own cognition, motivation and behaviour (Kraft, 1998). Yun, Cox and
Sims (2006) defined self-leadership as “both thoughts and actions that people use to
influence themselves”.
The underlying strategies enabling self-leadership are (Neck & Houghton, 2006):
Behaviour-focus - These are strategies that focus on elevating self-awareness
and personal behavioural attributes through the use of methods such as self-
goal setting, self-appraisal, self-punishment, self-reward, etc.
Natural reward - Typically embedding pleasant features into ones’ own
activities so that the task becomes self-gratifying and naturally rewarding with
ultimately giving a feeling of being competent
Constructive thought - Adopting ways and means to enable a positive and
forward looking mindset through techniques such as optimistic self-talk
(Seligman, 1991)
Need for autonomy - Basically influencing self-leadership traits and motivating
oneself towards being autonomous and engaging in activities of one’s own
choice (Deci & Ryan, 2000)
The ultimate objective of these strategies is to enhance the perception of self-efficacy,
that is how one’s own beliefs influence one’s lives (Dion, 2012).
2.5.8 Authentic Leadership
Many authors have come up with a variety of definitions often geared towards
transparency and ethical behaviour.
For example, Jensen and Luthans (2006) referred to authentic leaders as those people
who are instrumental in creating a transparent, future-oriented and associate-building
organisation. It is about getting the allegiance of others through nurturing of trusted
relationships (Duignan & Bhindi, 1997). Authentic leaders tend to be more conscious
about the values that drive them and their decisions and behaviours at large (Leroy et
al., 2012); it concerns how an individual feels (Bishop, 2013). Whilst some definitions

90
have centred on the individual and his/her values and behaviours, authentic leaders
must look beyond their own interest and focus on the common goals (Zhu, May and
Avolio (2004a).
2.5.8.1 Transactional Leadership
Transactional leadership is based on the “leader-member exchange” theory whereby
members are rewarded for the exchange of efforts dispensed in delivering services,
attaining goals or meeting set targets (Bass, 2008). Followers/subordinates/members
are incentivised when they achieve results and organisational goals set by the leader
(Pastor & Mayo, 2008). It was also noted that transactional leadership also enables
the followers to reduce workplace anxiety as they are encouraged to fulfil their own
self-interest and focus on increasing throughput, service quality and cost savings in
the organisation (Sadeghi & Pihie, 2012).
Whilst Sarros and Santora (2001) laid emphasis on achieving results through
organisational processes, policies, procedures and reward programmes, Green et al.
(2003) considered transactional leadership as having a focus on the bottom line.
2.5.8.2 Shared Leadership
Shared leadership is considered an emergent state where team members work in such
a way that they collectively lead each other (B. J. Avolio et al., 2009). Carson, Tesluk
and Marrone (2007) stated that shared leadership produces “patterns of reciprocal
influence” which gradually build relationships between team members across levels
and structures. The shared leadership process was also qualified as being “dynamic
and interactively influential” thereby leading one another in attaining business goals
(Pearce & Conger, 2003). Lee-Davies, Kakabadse and Kakabadse (2007) stated that
shared leadership is about helping others to realise their potential. It also implies that
behaviours are enacted by multiple individuals irrespective of the role and position
they hold (Bligh et al., 2006). To sum up, it is a state whereby everybody is ready to
accept and fulfil their leadership role with a view to attain a specific mission (Dion,
2012).

91
2.5.8.3 Servant Leadership
Servant leadership focuses on providing a service to followers (Stone et al., 2004). It
is about showing concern for people by genuinely coaching and empowering them,
honouring commitments made to them and emphasising trust-building (Joseph &
Winston, 2005).
Stone, Russell and Patterson (2004) presented the attributes of servant leaders in two
broad categories namely:
Functional attributes (being visionary, honest, trustworthy, service-oriented,
role modelling, empathetic, appreciative of others’ services and empowerment)
Accompany attributes (being good communicator, listener, credible and
competent)
The meaning of servant leadership would tend to vary considerably between countries
or regions due to their cultural specificities. It will have different facets in Western,
Confucian, Buddhism, Islamic, Hinduism and Occidental cultures (Dion, 2012).
2.5.8.4 Situational Leadership
Originally developed by Hersey and Blanchard (1969), situational leadership theory
highlights that effective leadership requires a rational understanding of the situation
and responds accordingly considering the environment (Grint, 2011; Hersey &
Blanchard, 1969, 1996). The leader basically adjusts themself to fit the development
level of the followers. In other words, it is about relating the leader’s style to the
maturity level of the followers, the context, and focusing on leaders’ behaviours as
either task or people focused. The style will be called to change continually to meet
the needs of the organisation as per the demands of situations faced.
2.5.8.5 Transformational Leadership
Burns (1978) profiled a transformational leader as someone who is able to raise the
level of his/her followers’ consciousness about the importance and value of desired
outcomes and show the process and methods of reaching those outcomes.
Avolio, Waldman and Yammarino (1991) and Bass (1995) referred to the four “I”s of
transformation leadership namely:

92
Idealised influence (being a role model for their followers)
Inspiration (being a provider of a sense of direction and a motivator to excel)
Intellectual stimulation (encouraging innovation, creativity and problem-
solving abilities and development of the right environment)
Individualised consideration (listening to each followers’ needs and
concerns, recognising efforts and progress, ensuring fairness)
A similar view was provided whereby the leaders provide the followers with
individualised consideration, helping them to unlock their potential and possibilities in
the future (Pastor & Mayo, 2008).
2.5.8.6 Charismatic Leadership
Charismatic leaders are considered as those who provide the vision and energise the
organisation with knowledge sharing and passion (Politis, 2002). Such leaders have
significant influence on how the employees perform and deliver results (Huang et al.,
2005). Some scholars see charismatic leadership traits as being part of the
transformational leadership and in some cases these terms are used interchangeably
(Aaltio-Marjosola & Takala, 2000).

93
2.6 ETHICAL THEORIES AND INTER-RELATIONSHIP
2.6.1 Introduction
An overview has been conducted of the various leadership theories in the foregoing
section. This focused on how the aforesaid theories evolved from the early days when
focus was more on the study of leadership traits and gradually shifted towards
leadership styles, approaches, behaviour and situational management aspects. It is
now an opportune time to introduce ethical theories with the view to establishing the
conceptual linkages that have been identified between ethical and leadership theories.
This further warrants a careful review of the literature considering that two critically-
related components (ethical organisational climate and ethical leadership) were
subject to empirical tests as part of the scope of this present study. An analysis of the
extent to which these two broad categories of theories (ethical and leadership) are
related necessitates in-depth examination and interpretation. For instance, it is
effective to research and obtain answers to questions such as:
Is there any inclination for certain kinds of ethical and leadership behavioural
patterns in countries sharing common ideologies and backgrounds?
Are leadership philosophies and approaches dependent on cultural, religious
and belief systems?
How is ethics of virtue considered in the contemporary work environment and
how does it reconcile when notions of power or pressures to deviate from
ethical standards come into play?
How does the willingness to transform institutions with creativity and innovation
reconcile with the creation of an ethical environment?
An attempt to find answers to these sorts of questions will be made in this and the
forthcoming sections based on a critical review of the literature.
2.6.2 Ethical Theories
The literature reviews reveal the emergence of various ethical theories related to the
leadership approaches mentioned above. Some of the key ones are:

94
2.6.2.1 Philosophical Egoism
Egoism forms part of the teleological ethics theory. It was suggested that individuals
consider an action to be moral or immoral depending on the extent of achieving their
personal goals (Rallapalli et al., 1998).
Hobbes (1960) evaluated the main factors motivating human beings to act in some
particular ways. It was found that the main motives are the “desire to have more power
over others” and the “desire to avoid death”. In this Hobbesian context, people focus
on their self-interests but would obey to social rules to avoid sanctions imposed by the
leader. They would tend to act prudently.
Hume (1983) was of the view that people would tend to be virtuous because they could
gauge the implications of transgressing moral rules. The way one judges whether a
given action is morally right is usually based on whether such an action would receive
social approval from most of the people.
2.6.2.2 Utilitarianism
Utilitarianism is another major classification of teleological ethics theory. The basic
principle of utilitarianism states that a given action is morally right when it promotes
the greatest levels of wellbeing for the maximum number of people (Bentham, 1789).
There are two principles that would make utilitarian assessment morally acceptable
namely:
(a) How would the majority of people perceive a given action in terms of pleasure
and pain they would feel?
(b) How would people classified in different socio-economic groups perceive and
feel the pleasure and pain as compared to other groups?
Utilitarianism is conceptually made up of two underlying principles, that of
consequentialist and hedonist. Consequentialists view an act as being morally right if
the consequences of that particular act are good, and vice versa. As regards
hedonism, Bentham (1789) used the statement “the greatest happiness principle” to
explain the underlying philosophy. Hedonists view people as having the right to do
anything in their power to attain maximum pleasure whilst surpassing the amount of
pain (Aronson, 2001; Bentham, 1789; Helms & Hutchins, 1992).

95
There are two main types of utilitarianism namely:
(a) Act utilitarianism - The right action is the one that brings the highest level of
happiness to the maximum number of people. Each behaviour is basically
evaluated in terms of its potential to create the maximum amount of good to the
largest number of people (Regan, 1980). In other words, it is based on the
principle of utility evaluating the most effective option that is producing the
highest level of good to most people.
(b) Rule utilitarianism – An action is considered to be morally right if it conforms
to the rules that bring the greatest level of happiness. It also postulates that the
correctness of an action is determined by the correctness of its rules and should
also ensure the most favourable outcome possible for the largest base of
people (Regan, 1980).
Going to the sources, Ross (1930) linked moral duties with the concept of “prima facie
obligations”, the latter being a duty which can be overridden by a more important moral
obligation. He stated that most moral duties are “prima facie obligations” and can be
in the form of help provided to the poor and the needy or for the wellbeing of others.
2.6.2.3 Deontology
Kant (1959) evaluated actions (right or wrong) without taking into account their
consequences. One does not need to know the probable outcomes, but rather the
nature of motives behind the action, when defining the rightness or wrongness of a
given action. Kant (1959) provided two important principles to assess this, namely:
(a) Is it universally accepted? – An action is morally right if it is accepted by one
and all as being morally correct and vice versa.
(b) Is it violating freedom of someone? – An action is morally incorrect if the
person is using someone as a means to attain their own objective at the
expense of another person’s freedom and autonomy. In other words, the rights
of human beings (rights to fairness, freedom, equality, justice, respect, etc. or
so-called principles of natural justice) have to be observed for the action to be
morally acceptable.

96
Frankena (1973) stated that moral rightness is determined by the characteristics of
behaviour itself and is not dependent upon producing the greatest level of good as
opposed to evil. Furthermore, as originally put forward by Kant, it was also advocated
that the moral value of a behaviour is independent of the outcomes as one is unable
to determine the certainty of the result when he/she decides to act (Helms & Hutchins,
1992).
In the literature, two major categories of deontological theories emerge namely:
(a) Rule deontology accords logical priority to rules rather than to judgements
(Ross, 1930). It establishes that individuals should adhere to and follow
prescribed rules, codes and standards at all times (e.g. do not lie). The
determination of whether a behaviour is ethical or not, is dependent on the
action with regards to a predetermined set of rules and standards rather than
the outcomes of the said act (Rallapalli et al., 1998).
(b) Act deontology (also referred to as particularist), on the other hand, accords
priority to particular moral judgements rather than the rules (e.g. do the right
things). Being human, people have to behave in a particular way with
obligations to respect the rights and dignity of others regardless of the
outcomes of an act (White, 1988).
2.6.2.4 Virtue Ethics
Though the term “virtue ethics” was coined in the 20th century, the underlying
philosophy dates back to the time of Aristotle (384BC-322BC) and since the 5th century
BC (Dierksmeier, 2011). Aristotle defined a virtue as “a settled disposition of the mind
determining the choice of actions and emotions, consisting essentially in the
observance of the mean relative to us, thus being determined by principle as the
prudent man would determine it” (Harvard University Press, 1926, p.95). He said that
one cannot be prudent without being good.
Whilst in deontological and consequentialist theories, focus is on the rightness or
goodness of the act, on the other hand, virtue ethics lays emphasis on goodness of
the agent.

97
Virtues were also put forward as being those qualities that will enable a person to
achieve happiness (use of the Greek term “eudaimonia”) and the lack of which will
restrict attainment of a particular goal (MacIntyre, 1981). Aristotle held happiness as
being the central purpose of life. His moral theory focussed on virtue and the virtuous
way of life albeit in relation to happiness. He was of the view that virtue is achieved by
maintaining a mean as a balance between the two excesses (Dierksmeier, 2011).
2.6.2.5 Ethics of Responsibility
Ethics of responsibility was presented as a by-product of post-modernism (Dion,
2012). Ethics of responsibility is based on a theory of being responsible for ourselves
and also for all human beings (Sartre, 1970). As a person we have the full
responsibility of who we are, what we do and what we become in the future. It is about
the creation of one’s own self in life. This was supported further by stating that it is this
responsibility that guides one’s own actions and requires every person to recognise
each other in an interaction or relationship, as a responsible subject who continually
adjusts their conduct (Habermas, 1992).
According to Aronson (2011), a converging indication emerged from the works of the
philosophers, scholars and ethical theorists that moral judgement will usually be based
on a combination of the following key components:
The deontological and teleological evaluation;
The personal characteristics of the moral agent; and
The prevailing contextual factors.
2.6.3 Leadership and Interrelationship with Ethical Theories
Dion (2012) conducted an analysis, primarily based on the Western world, of the
extent to which key leadership approaches and ethical theories are connected. On the
Basis of his comprehensive analysis of the leadership approaches, their behavioural
characteristics and the underlying ethical theories, he provided a critical view on
ethical leadership.
(a) Directive Leadership – The underlying cultural dimension (and sometimes
religious or spiritual) dictates the kind of expectations people have from a
directive leader. For instance, in Asian countries, most people are accustomed

98
to directive leadership. On the one hand, as they are inclined towards social
harmony and discourage egoistic attitudes, they submit to clear directives
coming from their superiors and leaders whether being the head of state, a
religious body, kingdom or family. On the other hand, and in some of the
Western countries (e.g. United States of America), leaders are guided by
philosophical egoism. This is generally authoritative in nature but with a strong
inclination towards self-centred individualistic behaviour. Such Western leaders
are guided by their own philosophies and self-interests due to their underlying
cultural orientation. Thus, directive leadership will be dependent on the cultural,
religious or spiritual context in which it is developed and evolving. In China,
social harmony is closely related to Confucianism, whilst in Japan, the
Buddhism value system tends to predominate. In countries like Indonesia,
people are guided by the Islamic values and belief systems (Dion, 2012).
(b) Self-Leadership – According to Hume (1983), there is a general acceptance
by most people for leaders having certain kinds of qualities, characters and
actions that would be beneficial to them. They would also tend to reject any
such actions that they would perceive as being harmful to their social order.
Self-leadership is thus seemingly linked with a need for social approval.
(c) Authentic Leadership – Authenticity and integrity are intrinsically linked and
form the basic attribute of sincerity. Authentic leaders tend to be naturally
comfortable with an ethics of virtue. Such leadership style would tend to
embrace deontological principles and stand guided by moral values in fulfilling
their duties. Leaders with such virtues would tend to promote ethical culture in
their organisations.
(d) Transactional Leadership – Whilst Aronson (2001) suggested that
transactional leadership mirrors the utilitarian philosophy, Kanungo (2001)
connected this leadership approach to the Machiavellian notions of power as
one tends to use others as a means (though rewarded for) to reach their own
goals. Kanungo and Mendonca (1996) flagged an issue of “demolishing
followers’ self-worth” emanating from transactional leaders who expect
followers to deliver set tasks and objectives without necessarily considering
their possible issues. It was also found that the influential style associated with
transactional leadership was “highly offensive” and affecting the conditions
required to build the ethical social fabric. This is seen to have ethical

99
implications. However, it was pointed out that transactional leadership can be
ethically appropriate under certain conditions whereby leaders maintain a
balance between attaining formal goals whilst maintaining respect and fairness
and are guided by proper codes of conduct (Bird, 1999). Under such
circumstance’s followers feel respected and exhibit higher degrees of
engagement and productivity.
(e) Shared Leadership – True to the meaning of the word, “shared leadership”
actually fosters a culture of sharing of tasks so that a common organisational
or societal goal could be attained. Shared leadership seems to be tuned to the
utilitarian theories, as leaders with such philosophies will accept an action as
morally right if it brings the maximum benefit and pleasure to the majority of the
people.
(f) Charismatic Leadership – The inherent characteristics of charismatic leaders
lie in successfully mobilising people to embrace a path and solve ethical
dilemmas. Charismatic leadership thus seems to be aligned with the “prima
facie obligations” theory of Ross, as no leader would be aware of those duties
to be accomplished in advance of a circumstance (Ross, 1930). It will only
depend on the situation before it is decided as to how it will be attended or
addressed. Howell and Avolio (1992) suggested that leaders use their charisma
in a socially constructive way (ethical) to lead others towards a common goal
for the welfare of the society and organisation. Unethical leaders, however, may
use the same charismatic trait for their own self-interest and self-serving ends.
Therefore, whilst it appears that charismatic style supports ethical leadership,
it could also lead to unethical behaviour.
(g) Transformational and Servant Leadership - The nature of these leadership
styles are such that they are seemingly connected to the ethical theories of
deontology (Kantianism), philosophical egoism (Spinoza) and ethics of
responsibility. Sarros and Santora (2001) asserted that transformational
leadership stimulated creativity, autonomy and care whilst ensuring that goals
are attained by their followers. Furthermore, it was also highlighted that with
transformational leadership, there is an increased level of motivation and
morality experienced by leaders and followers. This is in comparison to
transactional leadership, seen as restrictive and exploitative of subordinates
(Bums, 1978). According to Kanungo and Mendonca (1996), transformational

100
leadership creates an ethical environment promoting self-efficacy, self-
determination and mutual goal alignment through strategies of empowerment .
This influences followers’ basic attitudes, beliefs and values. In another study
undertaken, it was found that inspirational leadership was negatively related to
bribery and favouritism (Banerji & Krishnan, 2000). A similar relationship was
found between transformational leadership and ethical behaviour which created
a more conducive and ethical environment, easing the resolution of challenging
moral dilemmas (Ciulla, 2014).
Whilst researchers have recognised the socialised (ethical) and personalised (self-
interest, unethical) traits of charismatic leaders and effectively distinguished between
authentic and pseudo-transformational leaders, scholars have suggested that
transformational leadership may not necessarily translate into ethical leadership. For
example, Aronson (2001) posited that the various findings indicate that ethical
leadership does not necessarily depend on the leader’s style but more on the moral
development and ethical values guiding their actions in particular situations.

101
2.7 ETHICAL ORGANISATIONAL CLIMATE
2.7.1 Introduction
“Ethical Organisational Climate” stands as one of the core macro-level variables in the
context of this study. Leadership philosophies, behaviour, approaches and
personalities are some of the key influencing variables in establishing and nurturing a
specific kind of work environment. Furthermore, external conditions also influence the
work climate. The way ethical dilemmas are handled by the leaders in a working
environment, often characterised by the pressure to meet challenging business
targets, will create the right or adverse organisational climate. The state of anomie
often arises as a result of adverse leadership actions which fail to restore moral
standards. This section also examines key theories and models of ethical
organisational climate and identifies relationships between workplace ethics and work
engagement. For this study, it is also helpful to examine the effects of ethical climate
on employee conduct, satisfaction, motivation and performance. But, before exploring
the ethical aspects of organisational or workplace climate, it is essential to gather a
proper understanding of what its constituents are.
Organisational climate has consistently been defined as the “employees’ perception
of their organisations” (Patterson et al., 2005). Rousseau (1988) viewed organisational
climate as the “perception of the work environment”. In essence, organisational climate
shows how employees experience their organisations and the behaviours of their
members. Other scholars and researchers have conceptualised organisational climate
as “the shared perceptions of the organisational events, practices and procedures”
(Arnaud, 2006).
Research on organisational climate stems back to the days when Lewin et al. (1939)
studied different leadership styles to establish whether they are interrelated and
whether specific leadership styles lead to distinct organisation climates (Lewin, 1951).
Initially Schneider and Reichers (1983) presented these perceptions, as being rather
descriptive (“the description of things that happen to employees in the organisation”).
Subsequent studies however suggested both affective and evaluative perspectives
(Patterson, Warr & West, 2004). Both the organisational culture and climate describe
how employees experience their organisation. Whilst organisational culture reveals

102
the shared values within the organisation through its forms (e.g. artefacts, symbols,
etc.), the organisational climate reflects “the prevalent norms, values and attitudes of
the organisational culture” (Moran & Volkwein, 1992). In other words, organisational
climate can be conceptualised as the surface of the culture of the organisation (Schein,
1985; Schneider, 1990b), comprising a character, personality and psychological
atmosphere of an organisation’s internal work environment (Evan, 1968; Pritchard &
Karasick, 1973).
Various organisational climate studies were undertaken since the 1970s, where
researchers and scholars identified climate dimensions across a number of different
work contexts. Based on the climate studies conducted, Campbell et al. (1970)
established individual autonomy, degree of structure imposed on the situation, reward
orientation and consideration, warmth and support as being common dimensions.
James and James (1989) established another set of common dimensions (some being
common to those of Campbell et al.) such as role stress and lack of harmony, job
challenge and autonomy, leadership facilitation and support and work group
cooperation, friendliness and warmth. The literature review also indicates that there
has been an emergence of various other dimensions (e.g. managerial trust, risk
orientation, communication flow, equity, service quality, centrality etc.). These have
birthed some conflicting views, thus slowing down theoretical development (Gavin &
Howe, 1975; Glick, 1985; Joyce & Slocum, 1979; Lawler et al., 1974; Patterson et al.,
2005).
The financial disaster of 2008 brought down the U.S economy and others around the
world (Ciro, 2012). Other cross industry global scandals included Citigroup’s role in
the collapse of WorldCom in 2004 (English, 2004), AON being fined for bribery issues
in 2009 (Treanor, 2009), Alibaba.com’s fraud by sellers in 2011 (Lee & Chao, 2011),
Toshiba’s accounting and FIFA scandals. These all put the spotlight on “organisational
ethics”, “ethical organisational culture and behaviour” and “ethical organisational
climate”.
These major failures shook the global economy and raised serious concerns about the
fundamentals of business governance, ethical leadership and ethical business
practices. The time was therefore right to review and understand the main driving
causes leading to such economic traumas and, second to bring effective and

103
sustainable measures to address the ethical dilemmas. Since then, there has been a
resurgence amongst scholars of studies of ethical organisational climate and
leadership. For instance, the development of the Corporate Ethics Virtues Model by
Kaptein (2008a) and his subsequent studies brought further insights. These
strengthened the core base of ethical foundations, complementing the already
established Victor and Cullen’s Ethical Climate Model (Kaptein, 2008a, 2009; Victor &
Cullen, 1988).
Huhtala et al. (2013), and Apriliani, Anggraini and Answer (2014) presented the formal
and informal perspectives of workplace ethics culture and how they influence
employees’ decision making, commitment and engagement to prevent unethical
deviances. According to them, ethics, codes, rewards and learning are the formal
influential factors that help prevent unethical behaviours, the informal ones being peer
behaviour and ethical norms. Ethical organisational climate is viewed as “the shared
atmospheric conditions influencing employee behaviours towards policies, procedures
and practices with moral consequences” (Huhtala et al., 2013; Martin & Cullen, 2006;
Trevino & Weaver, 2003; Victor & Cullen, 1988). Some of the conditions which they
identified as being key influencers to ethical climate are:
Care – The employees feel being cared for when they see decisions being
made on the basis of safeguarding their interests and welfare
Law and codes - The perception that the organisation embraces and lives
strong principles of decision making based on prevailing laws and external
codes to conduct its business
Rules - The perception that the organisation and its members comply
consistently with rules set internally (e.g. company’ policies, procedures,
standards and codes of conduct)
Independence – The degree to which members of the organisation believe
they should use and rely upon their personal moral principles in making the
right ethical decisions
Instrumental – The degree to which employees lay emphasis on and favours
serving the interests of their own good self as opposed to those of others

104
2.7.2 Ethical Organisational Climate – Key Theories
Over time, several theories have emerged assessing ethical context and variables of
organisations but very few were found to be specifically focusing on ethical
organisational climate (Arnaud, 2006). The few key ethical work climate theories are:
2.7.2.1 The Theory of Ethical Work Climate by Victor and Cullen (1987, 1988)
Considered as the pioneering theory of Ethical Work Climate (“EWC”), Victor and
Cullen (1988) viewed EWC as the shared perceptions of what can be considered as
ethically correct behaviour and how ethical dilemmas should be tackled. To
understand the type of ethical climate prevailing in an organisation, one has to put
questions such as “how does an employee identify the right option when faced with an
ethical dilemma that has consequences for others?” or “how does a person in the
organisation decide whether it is right or wrong to bribe someone to secure a business
deal?”. The responses to such questions, if mapped properly according to an
established and empirically supported framework, will help determine the prevailing
ethical climate within the firm.
EWC was applied to these contexts for the determination of the ethical climate types
(Victor & Cullen, 1987). They have built this theory on the premise that employees’
perceptions of ethical climate (events, practices and procedures) are based on two
key dimensions, namely:
(a) “Ethical Criteria” used for organisational decision making
(b) “The loci of analysis” used as referent in ethical decision making
Figure 2.6 on page 105 of the thesis is a pictorial representation of the cross-tabulation
put forward by Victor and Cullen (1987). This was based on the integration of
philosophical ethical theory, psychological theory of moral development and socio-
cultural theory of organisations, to determine nine climate types.

105
Figure 2.6. Ethical work climate types. Source: Adapted from Victor & Cullen (1987)
The “Ethical Criteria” dimension comprises three main types of ethical reasoning and
is grounded in the Kohlberg’s Cognitive Moral Development theory (Kohlberg, 1981).
This theory is based on moral reasoning thereby exploring how people use their
judgement to resolve moral problems or ethical dilemmas. Kohlberg (1981) suggested
that the moral reasoning skills of individuals tends to change and evolve depending
on person and situation specific factors. His framework is based on three broad levels
of cognitive moral reasoning namely:
(a) Pre-conventional Level – Considered as the most infant stage of the
framework, whereby a person has not yet acquired, adopted or internalised the
society’s rules of what is right or wrong. Such persons see rules as something
external being imposed on them and their moral judgement and decisions are
solely made on an egoistic manner, in terms of their own interests and in terms
of rewards or punishment (e.g. how do I avoid punishment?; what’s in it for
me?). At this stage, a person’s moral judgement will either be guided to obey
such rules to avoid any form of punishment (stage 1) or be guided to perform
an action for best self-interests (stage 2) with limited or no consideration for
others. At stage 2, a person will tend to ask “what’s in it for me to do the job?”
(Arnaud, 2006).
(b) Conventional Level – At this level, a person has acquired the shared norms
of the family, organisation or society, and responds according to what is
considered as morally acceptable by others. One has to consider the society’s
expectations to judge the morality of actions. The person’s ethical behaviour is
thus influenced by the perspectives of the society and will tend to make moral
decisions based on what pleases others and what has obtained social
consensus (stage 3). People at this stage are reputation-conscious and would
appreciate being thought well of. At the next stage, it is expected that everyone
Individual Locus Local Locus Cosmopolitan Locus
(the person) (the organisation) (the society)
Egoism (self-centered) Self-Interest Company Profit Efficiency
Benevolence (concern for others) Friendship Team Interest Social Responsibility
Principle (integrity) Personal Morality Company Rules & Procedures Law & Professional Codes
Loci of Analysis
Ethical
Criteria
Figure 8: Ethical Work Climate Types
Source: Adapted from Victor & Cullen (1987) Ethical Work Climate Types

106
has to abide by and uphold laws, rules and moral reasoning, going beyond the
needs of the individual, dictated by external forces and obedience to authority
and social order (stage 4) (Kohlberg, 1981).
(c) Post-conventional Level – Considered as the principled level, post-
conventional theorists live by their own ethical principles in respect of life, liberty
and justice. At this level, individuals have gone beyond identification with other’s
expectations, rules and laws (recognised by Kohlberg himself as somewhat
difficult to conceptualise and possibly find people who consistently operated at
this level). At stage 5, one views the world as holding various kinds of values
and rights which should be respected as unique to each individual, group and
society (social contract driven). At stage 6, moral reasoning is abstract using
universal ethical principles and its recognition as a concrete stage is seemingly
yet to receive empirical confirmation (Sullivan, 1977).
Pursuing the analysis of Victor and Cullen’s (1987) EWC climate types, the moral
philosophy is organised according to three core types of ethical reasoning namely
egoism (maximising self-interest), benevolence (maximising joint interests), principle
(deontology, adherence to principle).
According to Kohlberg (1981) and Gilligan (1977), the types of ethical reasoning are
relatively incompatible. People who are principled-oriented tend to be less inclined
towards benevolence and are often insensitive to particular effects on others. In
contrast, people who are benevolent in nature are relatively less acquainted to law
and rules.
The study also showed that though organisations usually did not have single climate
types, they nevertheless had a dominant one. For instance, in organisations with a
benevolent climate, the welfare for others may be the dominant reasoning considered
by employees when resolving ethical dilemmas. Likewise, in organisations
characterised by a principle-oriented climate, the application of rules might be the
dominant form of reasoning of employees when addressing ethical challenges. In
organisations with prevailing egoistic climate, the consideration of self-interest is
central to the moral reasoning of employees (Victor & Cullen, 1988).

107
Victor and Cullen (1988) have conceptualised three organisational referents (also
referred to as the “loci of analysis”). The “ethical criteria” dimension was based on solid
foundations of cognitive model development theory put forward by Kohlberg. Similarly,
the ‘loci of analysis’ dimension was derived from the sociological theories of Merton
and Gouldner which identified different types of referent groups that help shape
behaviours and attitudes of the role incumbents. They found that those having local or
cosmopolitan roles applied different reference groups as sources to define appropriate
role expectations (Gouldner, 1957; Merton, 1957).
For instance, in organisations characterised by benevolence criteria, people are
inclined towards a friendly environment at the individual locus of analysis. But as it
shifts to the right in Figure 2.6, that is from local to cosmopolitan, the consideration
also evolves from an individual perspective to a collective (teams’ interests) focus and
further to a much broader beyond-the-organisation societal interest (corporate social
responsibility). Similarly, on the principled ethical dimension, the interests are guided
by personal ethics at the individual locus, and by extra-organisational principles
spanning across the profession, industry, national or global perimeters when analysed
from a cosmopolitan perspective. The source lies within the organisation (e.g.
company’s policies, procedures and codes) when considered at a local locus of
analysis (Victor & Cullen, 1988).
2.7.2.2 The Moral Climate Continuum by Vidaver-Cohen (1995, 1998)
Vidaver-Cohen (1995) put forward a concept of “continuum” to identify the moral
climate of the organisation. Basically, the two extremes of the continuum would
represent the two main states of ethical and unethical climate. At one end of the
continuum is ethical climate whereby moral behaviour and practices are strongly
prevalent in the organisation. At the other end is the unethical climate characterised
by a lack of organisational norms promoting moral behaviour and practices. For
example, on the positive end of the continuum, one would tend to see ethical oriented
conditions and behaviours. These are characterised by strong norms promoting
interpersonal respect, rewarding responsible actions, evaluating the best interests for
others while solving ethical dilemmas, allocating resources to create long term
goodwill and fulfilling social constructs. On the negative end, one would tend to find all
such conditions fostering unethical behaviour and climate.
108
Vidaver-Cohen’s (1995) EWC comprises five dimensions laying emphasis on:
Goals– What are the norms guiding the choice of organisational goals?
Means – What are the norms guiding the attainment of business goals?
Reward – What are the prevailing rules to reward performance?
Task support – How resources are allocated to support the execution of task?
Socio-emotional support – What are the prevailing norms of the sort of
relationship expected in the organisation
2.7.3 Ethical Virtues Model
Kaptein (2008a) has put forward the Corporate Ethics Virtue Model which, in itself,
stems from Solomon’s virtue-based theory of business ethics (Dierksmeier, 2011). An
organisation will have both formal (policies, codes, ethics programs, etc.) and informal
control systems (ethical culture and ethical climate) in some form, and the examination
of the virtuousness prevailing in the organisation will be key in its evolution (Trevino et
al., 1998). Solomon’s theory is centred on the premise that both the individual (the
leader and member of the organisation) and the organisation (as a collective group)
should uphold certain virtues and be guided by them to excel morally (Kaptein, 2008a).
Kaptein (2008a) based his research work on the analysis of diverse unethical
behavioural cases which mainly resulted from dysfunctional organisational culture and
climate. He was of the view that the evaluation of the extent of the ethical culture
problem and level of prevailing virtuousness could be determined through the
Corporate Ethics Virtue Model.
His research uncovered eight critical dimensions of the ethical culture of organisations
as follows:
2.7.3.1 The Virtue of Clarity
It was highlighted that vagueness and ambiguity in the approach to handling ethical
issues are underlying sources causing unethical practices to prevail in the organisation
(Tyler & Blader, 2005). A lack of clear rules, guidelines, policies and normative
frameworks in an organisation tends to leave employees to their own self judgement
and value system to handle a particular moral issue. Such a lack of definition or clarity
in a normative framework shifts the onus of resolution of ethical issues onto diverse

109
individuals whose level of virtuousness may largely vary. Kaptein (2008a) also found
that whilst organisations had codes of ethics, this did not contribute much to the
concerned organisations due to their poor ethics communication and dissemination
rendering them ineffective in the proper behavioural orientation of the managers and
employees.
2.7.3.2 The Virtue of Consistency
Kaptein (2008a) presented this issue from two perspectives, that of the role of the
managers and that of the supervisors. In essence, the way leaders, managers and
supervisors demonstrate their ethical virtues at work is key in shaping the right
perception of their personalities in the eyes of their employees. Because leaders are
role models, through the way they consistently act, communicate, behave and guide
others, employees look up to them for inspiration. Kaptein (2008a) observed that in
many cases where unethical deviations were noted, they were due to bad role
modelling of the managers and supervisors. Employees tended to resort to unethical
ways when they saw that their own managers were not living up to moral values and
upholding ethical standards at work. Kaptein (2008a) finding was consistent with the
empirical findings of Brown et al. (2005), whereby employees emulate the ethical or
unethical behaviour of their superiors at work.
2.7.3.3 The Virtue of Feasibility
The virtue of feasibility is another major aspect which has emerged quite prominently
in several ethical studies. Major corporate ethical failures were characterised by
abnormal pressures to meet goals that were often not realistic. Setting overstretched
targets to attain sales objectives, market share, profits, dividends, stock prices and
value creation for shareholders, etc. are issues that fuel employees to depart from the
ethical pathway and more so when the pressure to achieve is unrealistic. When
employees do not have sufficient time, budget, tools and empowerment to meet the
set goals, pressure mounts up. When this prevails in uncertain or adverse economic
conditions, the pressure takes even greater magnitude. Under abnormal stress and
for fear of punishment (as also seen in surveys conducted by the Ethics Compliance
Initiative), employees tend to embrace unethical ways in an attempt to meet unfeasible
targets. Trevino (1986) highlighted that employees under time constraints and
pressure are less inclined to uphold rules and ethical standards than those having
110
sufficient time. Kaptein (2008a) found a similar issue of unethical behaviour on the part
of the managers and employees having insufficient means to deliver on the objectives
set. This is in line with other empirical findings (Schnatterly, 2003).
2.7.3.4 The Virtue of Supportability
A lack of support for employees and managers is often characterised by deficient
commitment to comply with ethical standards or mistrust and is likely to create a
sensitive or even a hostile working environment. Research findings showed that a lack
of commitment to ethical standards, demotivation and mistrust prevailing amongst
employees, and unconducive working environment are typical antecedents of
unethical behaviour (Kaptein, 2008a). The presence of such issues in an organisation
only increases the risks of unethical behaviour and practices in the workplace.
2.7.3.5 The Virtue of Transparency
When ethical issues are identified and reported within the organisation, there is a need
to ensure that all employees, across levels are given full visibility on the consequences
of and actions undertaken for ethical deviances. When corrective actions are promptly
observable, it elevates the level of perception of employees on the organisational
philosophy to penalise unethical practices irrespective of the grade of the employee.
When managers and employees see the seriousness of the consequences of their
unethical acts (e.g. being deprived of career opportunities or being severely punished
by the human resources department), they would tend not to resort to unethical
means. Giving visibility to such issues in the organisation acts as a deterrent to others
from embracing the same unethical path, as the consequences of such departures
can be seen to adversely impact the incumbent (Detert et al., 2007). On the contrary,
a lack of transparency on how ethical issues were handled, and the resulting
consequences of such deviations would fuel a climate of distrust, as employees would
perceive it as being unimportant to the organisation and its leaders. Such a lack of
visibility has also been found to have adverse effects on the behaviour of employees
(Kaptein, 2008a).
2.7.3.6 The Virtue of Discussability
A working environment opened for raising and discussing ethical challenges, their
sources and any alleged unethical behaviours strengthens the organisational ethical

111
fabric. It elevates the moral standards and maturity of discussing such issues for the
welfare of one and all. Conversely, obstructing open discussions of ethical dilemmas
being faced by managers or employees is counterproductive to permeating the right
ethical culture within the organisation. Kaptein (2008a) found that in such contexts,
ethical issues could not be shared, ideas exchanged, and the willingness to openly
discuss ethical matters were simply absent; which Bird and Waters (1989) term as
“moral muteness”. Such moral muteness only propagates amorality in the organisation
and discourages initiatives on behalf of employees in making appropriate disclosures,
reporting ethical deviances and taking corrective actions. It was also found that
persistent trends in avoiding moral talk is a clear predictor influencing the degradation
of ethical norms and climate within the organisation.
2.7.3.7 The Virtue of Sanctionability
The virtue of sanctionability refers to the likelihood of unethical behaviours of leaders,
managers and employees being punished or of ethical actions being recognised
positively and rewarded in some form. It was found that when there is no enforcement
of the rules and policies and where deviations are not punished, members of the
organisation view unethical deviances as acceptable and tolerated within the
organisation. Their views are reinforced, as perpetrators would be seen as going
unpunished. Falkenberg and Herrenans (1995) highlighted that “sanctions are
behavioural stimuli” and that employees and managers will not ignore ethical rules if
they are punished for wrongdoings and if the resulting impacts are more severe than
the benefits from that particular unethical action. Other similar views were noted
thereby re-iterating the need to punish or reward depending on the ethical nature of
the actions (Ball et al., 1994; Muel Kaptein, 2011).
The effectiveness of sanctionability is broader when it is also supported by the virtue
of transparency as it makes the consequences (sanctions or rewards) more visible to
all members of the organisation (Roman & Munuera, 2005).
2.7.4 Antecedents to and the Outcomes of Ethical Organisational
Climate
It has been established that workplace ethics culture and climate positively predicts
work engagement behaviour and negatively predicts employee intention to leave

112
(Huhtala, Feldt, Lamsa, et al., 2011; Mitonga-Monga & Cilliers, 2015; Zehir et al.,
2012). The research of Mitonga-Monga and Cilliers (2015) revealed that workplace
ethics culture and workplace ethics climate had the most impactful contribution to the
work engagement variables such as absorption, dedication and vigour. It was also
found that work ethics culture and work ethics climate were significantly related to
employee engagement.
Huthala et al. (2011) concluded that employees tend to be more emotionally engaged
to their work in organisations characterised by strong support and inclination towards
ethical standards, systems and practices. In other words, employees are more
committed when organisations promote a climate of care, work ethics, recognition and
reward of ethical actions or punishment of ethical deviances. The development of an
ethical environment can lead to increased mental resilience and engagement levels.
Patterson et al. (2005) suggested that the perceptions of organisational climate are
intrinsically linked to diverse outcomes emanating from individuals, groups and
organisations. Aspects such as leader behaviour, turnover intentions, job satisfaction,
individual job performance and organisational performance play an instrumental role
in shaping a particular climate in organisations. Furthermore, Brown and Leigh (1996)
posited that when employees perceive the working environment and climate as
motivating and engaging, it is likely to influence supervisory ratings of performance
positively. Moreover, supervisors also noted that their employees delivered better
results when they felt that the organisational climate promoted clarity in the way things
were done and how risks were managed.
Arnaud (2006) highlighted that the individual’s behaviour and attitudes are intrinsically
linked with the prevailing climate at work and vice versa. This reciprocal relationship
makes the study of such issues and environment more complex. Arnaud (2006) also
highlighted the effects of organisational climate on satisfaction, performance,
individual work attitudes, motivation and behaviour of individuals. This was confirmed
by many other researchers and scholars such as Mudrack (1989), Johnson (1996)
and Glisson and James (2002) in their respective studies.

113
2.8 ETHICAL LEADERSHIP AND DECISION MAKING
2.8.1 Introduction
Having explored the macro-level variables of the conceptual research model in the
preceding sections of this chapter accompanied by the study of key supporting culture,
leadership and ethical theories, it was possible to critically establish important
interrelationships and effects. Other important findings revealed include:
Modernisation, economic development and the rise of a gig economy are giving
rise to cultural changes and promoting a climate of autonomy, gender equality
and democracy (Inglehart & Welze, 2005);
In the global landscape, the underlying cultural philosophy of Asians, Eastern
Europeans and Latin Americans favours group collectivism compared to
individualism, expressed by the Anglo clusters who are also more inclined
towards performance orientation (House et al., 2004). Furthermore, whilst the
United States and India demonstrate significant differences in their cultures,
their business leaders are perceived to be promoting ethical cultures more than
leaders of other societies. However, American leaders are more analytical in
their ethical decision making and rely on normative ethics, whereas Indian
leaders rely more on institutions, relations, and hold strong affinity with their
organisations (Chakraborty, 1997);
Organisational performance is conditional upon organisational culture (Brown,
1995; Magee, 2002). Such a culture also influences employee behaviour and
builds commitment to the organisation (Sun, 2009);
Formal and informal perspectives of workplace ethics influence employees’
decision making, commitment and engagement levels (Huhtala et al., 2013;
Apriliani, Anggraini & Answer, 2014).
The above are few considerations worth mentioning at this stage given their relevance
to the present study. Research attention will now be turned to one of the main
mediating variables “Ethical Leadership and Decision Making” with a view to
understand the theoretical foundation of ethical leadership. Established decision
making models, meta-models dealing with ethical challenges, and the relationships
between ethical leadership and employee behaviour and performance will be

114
discussed. The linkages between culture, ethical decision making, and moral intensity
are also worth establishing from an empirical perspective.
2.8.2 Ethical Leadership
Brown, Trevino and Harrison's (2005, p.120) definition of ethical leadership is
commonly referred to amongst scholars and researchers such as Den Hartog, Trevino,
Piccolo, Walumbwa and others. They define ethical leadership as the “demonstration
of normatively appropriate conduct through personal actions and interpersonal
relationships, and the promotion of such conduct to followers through two-way
communication, reinforcement and decision making”. Through this definition, the
importance of the leader’s own conduct, how these are promoted within the
organisation or society, and how people “read” and perceive their conduct are central
to the understanding of ethical leadership. Constituents of ethical leadership are
comprised of their role modelling in promoting ethical standards and practices. They
reinforce this through their own stewardship, permeating the ethical culture through
right actions, communication approaches, decision making and inculcating these into
others.
Attention was focused on two main pillars of ethical leadership that of the moral person
and moral manager (Trevino et al., 2000, 2003). Central to ethical leadership is the
person’s or the leader’s own set of moral traits, values and behaviours (as a moral
person). This encompasses their role as a leader or manager in setting up and living
the right moral standards, conduct and practices through their own actions and those
of their followers and collaborators (as a moral manager). The moral manager has a
duty to conform and be seen to be conforming with a complex code of morals. They
are expected to have certain moral traits and engage in a set of professionally and
socially acceptable behaviours and to reconcile these with their personal and
professional lives in a consistent manner (Brown, 2007). Being a moral person and
having a strong sense of ethical awareness are not the only required ingredients to be
a success ethical leader. It also demands managerial skills to direct attention on ethics,
and infuse the right set of principles guiding ethical actions and citizenship behaviours
(Toor & Ofori, 2009; Trevino et al., 2000, 2003). Ethical leadership is ultimately about
formulating and advocating ethical principles and organisational concerns related to

115
moral and sustainable interrelationship between the enterprise and its members
(Brown et al., 2005).
Lawton and Páez (2015) presented virtues (the who), purposes (the why) and
practices (the how) as three interlocking dimensions of ethical leadership. In other
words, the interplay of these three dimensions can lead to different forms of ethical
leadership. Ethical leaders are “individuals who are impartial and unbiased, exhibit
ethical behaviours, take the wishes of people into notice and protect their employees’
rights fairly” (Zhu et al., 2004b). Ethical outcomes often demand that the leader is
virtuous (e.g. courageous, truthful, fair, honest, etc.), and engages others for a
purpose (social or economic) through the execution of the right practices (e.g.
judgement, ethical decision making, etc.). Cunliffe (2009) called this the “being” and
“doing” of leadership and which can be mapped onto the virtue-purpose dimension.
Authors such as Ciulla (2005) highlighted the need to distinguish between moral
excellence (being a good leader in a moral sense) and technical excellence (being an
effective leader).
Khokhar and Rehman (2017) classified most of the current research studies being
undertaken on ethical leadership as:
(a) Ethics within the leader – This is similar to the moral person, as
conceptualised by Trevino et al. (2003) with the ethical qualities and traits, such
as trustworthy, honest and fairness, required for ethical leadership
(b) Ethical leaders influencing followers – This pertains to the attributes,
principles, values, “walk-the-talk” behavioural style, role modelling of the moral
manager and their interaction and engagement approaches to inspire their
subordinates (Mayer et al., 2009). Ethical leaders tend to give priority to ethics
in their agenda to influence followers in their behavioural journey. They also
use reward and punishment mechanisms for the accountability of followers
against well-established standards (Brown et al., 2005).
(c) Challenges faced by organisations in implementing ethics – These pertain
to situational dynamics prevailing in the organisation such as the pressure from
shareholders or other stakeholders, ethical climate, barriers to implementation
and compliance of ethical standards and codes etc.

116
In the study of moral orientation to leadership, Leithwood, Jantzi and Steinbach (1999)
put forward two key issues necessitating attention, and which could be useful to the
understanding of the ethical leadership and decision making variable in the present
study, namely:
(a) The nature of values used by the leaders in their decision making processes
(b) How the conflicting issues are addressed among the values
2.8.2.1 Relationship between Ethical Leadership and Employee Moral Attitude
and Behaviour
Mo et al. (2012) established ethical leadership as a key predictor influencing
employees’ moral attitude and behaviour. Avey et al. (2009) highlighted psychological
capital as being a key enabling factor on positive organisational behaviour. The four
key psychological constructs of self-efficacy (employee’s firm confidence in their own
ability to achieve goals), optimism, resilience and hope thus to play a fundamental role
in regulating employees’ motivation.
2.8.2.2 Relationship between Ethical Leadership and Employee Performance
In a study conducted by Khokhar and Rehman (2017) in the educational arena, a direct
relationship was established between ethical leadership and employees’ performance.
Ethical leadership positively influenced the employees’ performance in a significant
way. It was also found that an indirect link existed between these two variables through
the partially mediating effect of a counterproductive work environment on employees’
performance. Interestingly though, a mediating variable such as organisation
citizenship behaviour did not influence the relationship between ethical leadership and
employees’ performance.
Park, Song and Kim (2015) conducted a similar study in the Korean public sector. This
was grounded in social learning theory or social cognitive theory but focused on the
effects of ethical leadership on the employee in-role performance. It was found that
ethical leadership has a significant indirect impact on in-role performance. The
employee psychological ownership is a state where the employees feels the
organisation as being theirs and hence they invest more efforts or demonstrate
stronger commitment. This played a mediating role between ethical leadership and

117
employee in-role performance. It has been established through these theories and
empirical findings that people learn from their models (leaders demonstrating ethical
behaviour in their workplace consistently), then react through internal cognitive events
before responding with positive attitudes and behaviours. The findings of Brown,
Trevino and Harrison (2005c) reinforced the positive association of ethical leadership
with employees’ job satisfaction, motivation, and organisational commitment.
Outcomes from the studies by Piccolo et al. (2010) and Walumbwa et al. (2011) both
confirmed that ethical leadership has a significant positive effect on employee
performance or job/task performance. It was also established that employees perform
better as they are psychologically motivated by their leaders’ ethical behaviours.
These studies also highlighted the importance of the quality of the relationship
between the leaders and followers. It is an enabling factor ensuring alignment between
the two parties, and engagement and motivation of the followers in attaining business
goals ethically. Some studies used trust as an indicator to measure the quality of
relationship. However, Zhu et al. (2013) and Bouckenooghe, Zafar and Raja (2015)
focused on the study of goal congruence between leaders and followers as being the
key factor explaining how ethical leadership influences followers’ in-role job
performance. Their findings indicated that ethical leadership enhances followers’ in-
role performance through positive effects of motivation and its underlying constituents
of self-efficacy, optimism, resilience and hope (coined as psychological capital) by
Avey et al. (2009). To sum up, ethical leaders who communicate openly, show
consistency and alignment in their ethical messages and actions, role model and
create a fair context at work unlock the positive psychological states and behaviours
of their subordinates. The study also confirmed that goal congruence is an enabling
mechanism between ethical leadership and employee performance.
2.8.2.3 Relationship between Ethical Leadership, Organisational Commitment
and Job Satisfaction
Several researchers have studied the interrelationship between ethical leadership,
organisational commitment and job satisfaction. Organisational commitment is defined
by Mowday, Porter and Steers (1982, p.27) as “the relative strength of an individual’s
identification and involvement in particular organisation”. Allen and Meyer (1990)
presented a three dimensional model of organisational commitment comprising:
118
Affective commitment – Whereby the employee holds strong job commitment
due to emotional reasons;
Continuance commitment – Whereby commitment arises due to the fear of
losing the job position or gains attached to the position, and hence commitment
continues for that main reason;
Normative commitment – Whereby there is a clear motivation to stay
committed to the organisation so as to uphold responsibilities and obligations
towards the employees.
Çelİk, Dedeoğlu and İnanir (2015) conducted a study on these key variables in the
hotel industry and found that ethical leadership has a positive effect on both
organisational commitment and job satisfaction. The interrelationship between
organisational commitment and job satisfaction was also established, with
organisational commitment having a mediating effect on job satisfaction. This is also
supported by the earlier findings, where managers demonstration of clear ethical
behaviours affected job satisfaction and organisational commitment positively (Vitell &
Singhapakdi, 2008).
2.8.3 Ethical Decision Making – Theoretical Models
Decision making stands as a crucial process in the overall organisational dynamics,
as it is the trigger point for subsequent actions with varying impacts. Individuals or
groups of individuals are all subject to such a process when confronted with a moral
dilemma. Both Rest (1986) and Trevino (1986) defined almost similar processes of
ethical decision making thereby specifying the subtle psychological stages through
which a person progresses to reach to an ethical decision as depicted below.
However, Rest (1986) identified moral intensity as a component which plays a crucial
role in the overall ethical decision making process. This component subsequently
became the research dimension for many studies conducted by scholars and
researchers (Barnett, 2001; Chia & Mee, 2000; Frey, 2000; Harrington, 1997; Lincoln
& Holmes, 2008; Singhapakdi et al., 1996).

119
Figure 2.7. Comparative ethical decision making processes. Source: Trevino (1986), Rest (1986)
Moral recognition (also referred to as ethical awareness or moral sensitivity) refers to
the ability of a person to determine and recognise a moral issue in a particular situation
(Rest, 1986). This requires the person to be aware of the potential harm and/or benefit
that their actions may entail for other people within the organisation or society. At this
stage, a person is able to decipher that a particular situation has a moral content and
implication (Hunt & Vitell, 1986; Reynolds, 2006).
The subsequent stage as conceptualised by both Trevino (1986) and Rest (1986) is
the process of moral judgment (also referred to as ethical judgment). At this stage, the
individual judges between what is right and wrong. The individual evaluates possible
avenues or solutions to an ethical dilemma and then applies their reasoning to
determine the ethical soundness of such options by evaluating their respective
potential consequences (Lincoln & Holmes, 2011). It was also highlighted that moral
judgment differs from person to person, depending on the degree of their moral
development (Reidenbach et al., 1995).
The third stage of Rest’s model is the process of moral intention or moral motivation
which refers to the intention to opt for an ethical decision over another solution of
different value. At this stage, the individual takes an ethical stance and chooses the
moral value. For instance, a leader may be confronted to choose between two
solutions to an ethical dilemma, but their decision is motivated by consideration of the
value of morality over the alternative solution.
The last stage of the ethical decision making process is moral behaviour (also referred
to as ethical behaviour or moral action). This is the culminating point of the influences
Moral Recognition Moral Judgment Moral Intention Moral Behaviour
Ethical Decision Making Process as conceptualised by Rest
(1986)
Ethical Awareness Ethical Judgment Ethical Behaviour
Ethical Decision Making Process as conceptualised by Trevino
(1986)
Figure 9: Comparative Ethical Decision Making Processes
Trevino and Rest (1986)

120
of the earlier stages whereby the individual acts in the situation. It involves
determination, courage and ability to follow through to reach an ethical decision
(Lincoln & Holmes, 2011). Rest and Narvez (1994) concluded that any shortcoming or
failure at any of the stages of the process is likely to result in a failure in ethical decision
making.
The theoretical model put forward by Rest (1986) attracted further studies. Jones
(1991) developed a moral intensity model based on the Rest’s theory. This proposed
that moral intensity (i.e. the degree to which an individual sees an issue as an ethical
one) influences ethical decision making. He identified six underlying factors or
dimensions of moral intensity having effects, at varying degrees, on someone’s ethical
decision making:
(a) Magnitude of Consequences - This refers to the degree of ethical impact
(harm or good) caused by the decision maker’s action; the larger the
significance of the moral impact, the higher will be the moral intensity.
(b) Temporal Immediacy – This relates to the time difference between an action
happening and its likely ethical impact or consequences; the more immediate
the consequences are manifested in a negative way the higher will be the moral
intensity and vice versa.
(c) Proximity – This refers to the closeness of the decision maker and the
person(s) whom the decision is likely to affect. It measures the physical, social,
cultural or psychological association of the decision maker and the potential
victims or beneficiaries. An increased proximity implies intense moral
implications.
(d) Social Consensus – This refers to degree of consensus amongst individuals
or social groups of whether an action is regarded as good or bad. Accordingly,
when there is a strong social consensus that an act is unethical, then there is
an increased moral intensity.
(e) Probability of Effects – This concerns the likelihood that the predicted
consequences and anticipated level of harm or good will happen. If the
probability and level of impact are high, so will, the moral intensity.

121
(f) Concentration of Effects – This refers to the number of people impacted and
the magnitude of such ethical impact; the higher such concentration, the higher
the moral intensity.
Lincoln and Holmes (2008) developed an empirically supported meta-model
combining Rest’s psychological processes and Jones’s characteristics of the moral
situation. This was a check model or framework to help individuals to evaluate, analyse
and resolve ethical challenges. This is compared with the ethical check model of
Blanchard and Peale (1988) as depicted below.
Moral Awareness I feel
Is there anything wrong here?
Moral Intensity Checks:
1. How close do I feel to those affected to my decision?
(Proximity)
2. What does my social group think? (Social Consensus)
Moral Judgment I ask
Is it fair?
Moral Intensity Checks:
1. How likely is it that something bad will happen? (Probability of
Effect)
2. How much someone will be harmed or benefited (Magnitude of
Consequences)
3. What does my social group think? (Social Consensus)
Moral Intention I think I will
What do I think I should do?
Moral Intensity Checks:
1. How would my peers likely to act? (Social Consensus)
2. How my perception of their intentions influence my moral intention? (Social Consensus)
Moral Action I act
Do I follow through my intention?
Moral Intensity Checks:
1. Would my peers act on their decisions? (Social Consensus)
2. How does their potential action influence my behaviour? (Social
Consensus)
Figure 2.7b. Stages of moral checks Adapted from Holmes Meta-Model based on Rest (1986) and Jones (1991) models
Ethics Check 1:Is it legal?
Will I be violating either civil law or company policy?
Ethics Check 2:Is it balanced?
1. Is it fair to all concerned in the short and long term?
2. Does it promote win-win relationship?
Ethics Check 3:How will it make me feel about myself?
1. Will it make me proud?
2. Would I feel good if the decision was published?
3. Would I feel proud if my family knew about it?
Figure 2.8. Ethical checks for leaders and managers.
Adapted from Blanchard and Peale (1988)

122
Whilst Holmes (2007) meta-model is a step-by-step process for dealing with ethical
challenges, Blanchard and Peale (1988) provided a simpler view of how ethical checks
can be undertaken for proper decision making. Holmes (2007) used a combination of
various moral intensity factors such as proximity, social consensus, magnitude of
consequences and probability of effects to reach the ethical decision making point. In
contrast, the ethics checks proposed by Blanchard and Peale (1988) seemed to be
driven heavily by the social consensus factor and to some extent to magnitude of
consequences.
As depicted in Figure 2.9 below, Schell-Busey (2009) presented an integrated model
of ethical decision making using three key models put forward by Rest (1986), Trevino
(1986) and Jones (1991). Meta-analysis was used to examine the preventative effects
of ethics on corporate crime. Results showed that codes and support systems such as
enforcement and top management support were key factors having effects on ethical
decision making and behaviours (Schell-Busey, 2009).
Jones Dimensions of Moral Intensity
1. Magnitude of Consequences2. Temporal Immediacy
3. Proximity4. Social Consensus
5. Probability of Effects6. Concentration of Effects
Recognise
Moral Issue
Make
Moral Judgment
Establish
Moral Intent
Engage in
Moral Behaviour Rest (1986)
influenced by: Characteristics of Individuals
(Individual differences & cognitive
bases)
influenced by: Characteristics of Organisations (Organisational Pressure, Culture
& Situations)
Aware of
Ethical Issue
Make
Moral Judgment
Engage in
Moral Behaviour Trevino (1986)
Figure 2.9: An integrated decision making model.
Source: Adapted from Schell-Busey Model (2009), Rest (1986), Jones (1991) and Trevino
(1986)

123
Mumford et al. (2008) stressed the reasoning aspects of human beings when
confronted with challenging ethical pressures. Several researchers and psychologists
spoke about the concept of sensemaking in the overall process of ethical decision
making (Antes et al., 2007; Caughron et al., 2011; Weick, 1995).
According to Weick (1995, p.14) for example, sensemaking helps to “construct, filter,
frame, create facticity and render the subjective into something more tangible”. In other
words, it is a process or act of discovery which precedes interpretation. In fact, when
someone faces situations characterised by novelty, complexity and ambiguity, it will
likely cause the person(s) involved to realise that there is something abnormal
happening for which they would wish to obtain an understanding of their situations.
The individual would tend to gauge what such novel, complex or ambiguous situations
mean to them, how they would be impacted by these conditions, and based on the
information they gather, what would be their understanding for future decisions. This
process is often referred to as sensemaking. This process starts when someone
recognises the disturbing situation and tries to gather information so as to deduce what
is happening. The individual is then at a stage where they can put together the pieces
of information to draw a deeper understanding and on the basis of which they will act
upon it, monitor or ignore the situation (Weick, 1995).
In the study conducted by Caughron et al. (2011), based on Mumford et al.’s (2008)
cognitive reasoning strategies, the effects of situational conditions and the mediating
effects of cognitive reasoning strategies and sensemaking on ethical decision making
were established as depicted below.
Figure 2.10. Ethical decision making stages. Source: Adapted from Caughron et al. (2011)
Situational Conditions/
Environmental Factors
Cognitive Reasoning
StrategiesSensemaking
Ethical Decision
Making
Figure 13: Ethical Decision Making Stages
Adapted from Caughron et al. (2011) Mediated Model

124
Mumford et al. (2008) established seven distinct cognitive reasoning strategies that
promote ethicality namely:
(a) Recognising circumstances – The process of understanding from where the
problem sources, why it is happening, who are involved, who are impacted, to
what extent, what are the principles, goals and values?
(b) Seeking outside help – The process of consulting others, seeking advice and
support of the leaders, peers, subordinates and external contacts who could
have witnessed similar situations and learn from them.
(c) Questioning one’s own and others’ judgement – The process of identifying
associated challenges from ethical decision making and determining whether
the decisions/judgement were proper or not.
(d) Dealing with emotions – The process of assessing and controlling emotions
when confronted with ethical dilemmas or challenging situations.
(e) Anticipating consequences of actions – The process of determining
potential impacts of particular decisions or actions on others whether in the
short, medium or long term.
(f) Analysing personal motivations – The process of considering one’s own set
of guiding principles, values, interests, and decisions and how the ensuing
actions can be presented, explained and justified to others. It also concerns
gauging one’s own ability of making ethical decisions.
(g) Considering the effects of actions on others – The process of gauging the
effects (social and professional) on others of decisions taken or actions
undertaken whilst being mindful of people’s perceptions, concerns and
reactions.
Mumford et al. (2008) highlighted that such reasoning strategies will help in the
sensemaking process and also enhance ethical decision making. Caughron et al.
(2011) explained that the process of sensemaking can be impacted by one’s own
biasness and situational/environmental factors. They also posited that there is a need
to integrate all relevant information on the situation so that an assessment can be
made on the various options available for proper ethical decision making whilst
recognising the concerns of various people.

125
A key finding from the various studies as well as that of Caughron et al. (2011) is that
an emphasis on outcomes relevant to oneself, as compared to a broader group, is
likely to have repercussions on the ethical decision making process. In other words, a
motivation for personal-level rewards or consequences could influence an individual
to make a less ethical decision. It therefore becomes important for leaders to consider
and emphasise broader outcomes when ethical decisions are being made.
Mumford et al.’s (2008) attributes of cognitive reasoning reveal that there is a major
underlying philosophy of sensing the ethical issue through a process of taking
cognisance of the ethical dilemma, the circumstances, reasons and motivations
behind it, and understanding the effects of decisions or actions on other people.
Following this sensing process, a response of the individual would typically follow
through decision making or actions of some form. This typically encapsulates a
philosophy of sense and response. This has been prominently applied in fields where
there is an element or environment of unpredictability which necessitates an
organisation or individual to be ready in effectively responding to such situations. For
instance, such dilemmas have been dealt with in the post-industrial paradigm when it
comes to sensing and responding to changing customer demands, preferences or
behaviour (Haeckel, 1999). The concept of “sense and respond” has evolved into a
fully-fledged business theory in this dynamic world. Haeckel (1999) refers to this
paradigm as “a comprehensive, scalable and internally consistent recasting of
industrial age strategy, structure and governance to cope with the post-industrial
environment of unpredictable change.” The complexity associated with human
behaviour in handling ethical challenges warrants, similarly, the application of such
dynamic approaches. Sensing ethical issues earlier and responding through
appropriate decisions and actions is a leadership imperative today when it comes to
shaping the right ethical climate and culture within organisations. Whilst a dynamic
sensing of ethical dilemmas is key, the prompt determining of which key ethics related
actions should be applied and executed in such circumstances is accordingly
fundamental in an ever-changing business environment.
The study of Kurtines (1986) highlighted contextual factors as an important influential
issue on ethical decision making. Situational factors were better predictors than
individual factors when assessing their effects on ethical decision making (Kurtines,

126
1986). Vergés (2010) also highlighted the importance of the context in which the
dilemma happens when putting in place strategies to proactively address ethical
challenges. Along similar lines, Hill, Glaser and Harden (1998) considered the social
context in their “feminist model”, whilst Betan (1997) incorporated the context in which
therapeutic relationships occurred to understand ethical decision making implications.
It was also noted that models have in general laid more emphasis on solving ethical
issues reactively than addressing them before they arise. In their studies, Cottone and
Claus (2000) confirmed that most models, except that of Welfel (2006), had
considered ethical dilemmas as the starting point of the respective process models
with little emphasis on preventive steps. In their study of how graduate students react
to conflicting ethical situations in research, Mumford et al. (2007) found that the
environment dimensions were better predictors than climate dimensions of ethical
decision making.
2.8.4 Ethical Decision Making – Empirical Findings
2.8.4.1 Relationship between Ethical Decision Making and Moral Intensity
It is suggested that moral intensity would directly influence the moral recognition, moral
judgment and moral intention stages of the ethical decision making process as
conceptualised by Trevino (1986) and Rest (1986) with moral recognition and moral
judgment also jointly playing a mediating role influencing moral intention (Jones, 1991;
Yang & Wu, 2009). Both Singhapakdi, Vitell and Kraft (1996) and Singer (1998)
confirmed, through their respective studies, that moral intensity influences ethical
decision making. In a study conducted by Singhapakdi, Vitell and Kraft (1996) with
members of the American Marketing Association, it was found that all the six
dimensions of moral intensity, as put forward by Jones (1991), influenced the ethical
perceptions of marketing professionals.
Jones (1991) also observed that when the moral intensity is high in a particular issue
(more unethical in nature), it will be recognised more often than when the moral issue
has a low intensity (less unethical in nature). According to the various studies, it was
found that moral intensity influences moral judgment, with individuals spending more
time and effort in situations characterised by high moral intensity. Likewise, in
situations of low moral intensity, individuals tend to spend relatively less effort (Davis
et al., 1998; Frey, 2000; Jones, 1991). It was also found that moral intensity is

127
positively linked to the intention of decision making (Harrington, 1997; Singhapakdi et
al., 1996).
Bearing in mind the influences of moral intensity on ethical decision making, it was
suggested that organisations should implement ethical training programmes to help
employees understand the ethical decision making process, and the interrelationships,
differences and effects of the moral intensity factors for their own effectiveness in
handling ethical challenges (Okleshen & Hoyt, 1996).
Lincoln and Holmes (2011) focused their research on 812 service academy students
of diverse backgrounds, races and ethnicity in Canada, to learn about the factors
influencing decision making. The results supported the relationship between moral
intensity and ethical decisions, highlighting that people’s abilities to recognise a moral
dilemma, make judgments, and act are seriously affected when they are confronted
with ethically charged situations. This also helps to understand, to a certain degree,
why so many ethical deviances occurred that adversely impacted the global economic
scene since the fall of Enron and others. Lincoln and Holmes (2011) found that social
consensus was a key influencing factor guiding the students’ judgment and decision
making as they were significantly influenced by what others within their own social
group saw as being morally right or wrong. A strong relationship between proximity
and moral awareness was also identified, but consensus was not reached with other
previous studies linking these two components (Barnett, 2001; Frey, 2000). However,
there was consistency with previous studies that the surveyed students consider the
magnitude of consequences and probability of effects when having to make a moral
judgment and intention to act. They considered how likely and impactfully their actions
would be to harm or benefit others (Lincoln & Holmes, 2011).
2.8.4.2 Relationship between Ethical Decision Making and Culture
When studying prevailing cultures in certain societies, it is noted that there is an
evident pattern in the way decisions are made. For instance, Chinese societies are
largely influenced by Confucian rules and values relying on filial and personal
relationships (“guanxi”). Yang and Wu (2009) highlighted that guanxi becomes an
enabler of transactions in such a society, as the culture is to respect and nurture the

128
relationship with the boss, show full loyalty to him, and maintain secrecy of the decision
making process. In such environments, the ethical perspectives of accountants are
likely to be challenged by traditional values, thereby influencing their ethical judgment.
It was flagged that the promotion of subordinates is normally subject to the degree of
the subordinates’ loyalty to and guanxi with the boss and thus making ethical
judgments more challenging (Wright et al., 2002).
In a relatively more recent study conducted by Zheng et al. (2014), focus was centred
on the influence of American and Chinese cultures on consequentialism orientation in
decision making. The study examined the effects of culturally-oriented ethical beliefs
on psychologists’ decision making, and significant differences were noted between
these two cultures. This was mainly explained by the fact that the American and
Chinese ethics originated from two different philosophies. The rule consequentialism,
characterised by the fact that a set of rules have the best consequences for producing
good and impartial outcomes, is more popular amongst American psychologists
(Hooker, 2000; Kahn, 2012). In contrast, the Chinese ethical system which stems from
Taoism, Confucianism and Buddhism places significant emphasis on relationships
when considering ethical deliberation. Human relationships are considered as an
important aspect in the overall ethical process in the Chinese culture, where the
assessment of moral worth of a particular action is based on the extent to which it
created goodness and harmony for the state (Ivanhoe, 2005). The Chinese culture
which includes modes of social learning, cultural rituals and modes of politics holds
significant influence on individuals’ decision making. In such contexts, decisions are
made in consideration of the overall good to the state rather than the individual self.
Hence decisions are oriented more towards state-consequentialism (Zheng et al.,
2014).

129
2.9 INTERNAL AND EXTERNAL WORK PRESSURES
2.9.1 Introduction
On the back of multiple corporate failures and ethical deviances registered on the
global front, work pressure stands out as one of the common influential factors
affecting professional behaviour of employees (Ethics and Compliance Initiative,
2018c). Work pressure was viewed as a core mediating variable in the conceptual
research model of the present study. Given the multiple implications of work pressure
on the employees’ morale, attitude, conduct and behaviour, it is subjected to literature
review so as to obtain answers to questions such as:
What are the main sources of work pressure and how are they rated in terms
of prevalence or intensity?
What are the underlying theoretical or contextual explanations?
What are the main causes leading to an unethical climate in the organisation?
What role does work culture, leadership and decision making play in shaping
up the right ethical climate or fuelling a state of anomie in the organisation?
What is the level or intensity of pressure facing employees in different countries
and is there any relationship with national culture or leadership behaviour?
Internal and external pressure factors are causing a shift in the way ethical culture
evolves within organisations. Internal pressures would usually take the form of
elements personal to the individual such as his own survival, job security, meeting his
financial obligations and his career. External pressures usually come in the form of
meeting business targets and goals, ensuring financial success of the organisation,
value creation for the shareholders and the like. Business and competitive pressures,
investors’ and shareholders’ demands, supervision by authorities, socio-economic
pressure, political pressure, scandals, globalisation and the pandemic are but few
examples of the external forces causing a radical change in behaviour thereby putting
ethics at the centre of the debate. Similarly, forces such as work pressures towards
meeting aggressive business targets and tight deadlines are also affecting the
professional conduct of leaders. In his Corporate Ethical Virtues Model, the 8 virtue
model used to measure ethical culture of organisations, Kaptein (2008a) calls this “The

130
Virtue of Feasibility” whereby the setting of unrealisable targets tends to lead towards
higher levels of unethical behaviour. Schweitzer, Ordonez and Douma (2004)
discovered similar empirical findings.
2.9.2 Merton’s Theory of Social Structure and Anomie
Vidaver-Cohen (1993) examined how anomie (lack of ethical standards) occurs in the
workplace. One of the main causes of unethical behaviour in workplaces is the
excessive pressure which management puts on goal attainment without a
corresponding counterbalance for legitimate procedures. Vidaver-Cohen (1993)
backed his examination by Merton’s theory of social structure and anomie. Whilst the
individual’s moral character was often considered as a key determinant of ethical
conduct, it was found that the work environment plays an equally influential role on the
behaviour of employees. Since its initial conceptualisation stages in 1938, Merton’s
model gradually evolved to become one of the most important frameworks for
explaining criminal conduct in societies (Merton, 1964). Merton identified and put
forward some key issues worth considering for the understanding of organisational
anomie:
High rates of unethical practices, anti-social behaviour and illegal conduct
occur as a result of inordinately strong emphasis placed on achieving goals
and targets without corresponding emphasis on adhering to legitimate
procedures helping to attain such goals.
A discrepancy between the “means and ends” or a social disequilibrium
characterised by non-adherence and ineffectiveness of conduct-governing
rules causes anomie.
The application of Merton’s theory to the corporate world is worth exploring. One
criminologist suggested that “the goal-seeking nature of corporations make them
inherently criminogenic” (Box, 1983). This is largely due to the fact that organisations
operate in an unpredictable environment where the survival of the fittest dictates the
corporate play. In such conditions dictated by uncontrollable pressures, legitimate
opportunities to meet business goals become limited.

131
In the same way, it was noted that the ever-mounting quest for profit maximisation led
to a climate conducive to unethical practice, as employees face constant pressure to
meet profit goals, sometimes at any cost. Under such conditions from their superiors,
employees feel compelled to depart from the ethical path in order to accomplish
organisational objectives (Passas, 1990). Such challenges are not only present in
profit-oriented organisations but also in non-profit institutions, where their survival
nonetheless rests on an economic foundation. Similar pressures to meet institutional
goals and maintain their existence may force members to respond to such pressure
through illegal practices (Vaughan, 1983).
Vidaver-Cohen (1993) highlighted that anomie creates a non-conducive working
environment characterised by futility, alienation, powerlessness and mistrust amongst
employees. Vidaver-Cohen (1993) drew attention to the following key reasons leading
to unethical conduct arising from psychological experiences of the members, ethical
climate, work culture and systems of the organisations:
(a) Climate of non-adherence to legitimate practice: The degree to which the
members of the organisation are adhering to standards of legitimate practice is
central to how one perceives, observes and respects the working environment.
One may see it futile to abide by such standards if others disregard their
importance, compliance and enforcement. In such conditions, people are more
likely to indulge into unethical actions (Passas, 1990).
(b) Climate of alienation and disrespect: Anomie in organisations often creates
a feeling of alienation and lack of respect (Vidaver-Cohen, 1993). The
interpersonal issues emanating from such anomies may foster an odd attitude
in employees to abstain from showing respect to and care for the welfare of
others, and also the potentially adverse consequences of their actions on others
(Lickona, 1976). These situations tend to fuel conditions for ethical deviances
amongst employees.
(c) Climate of inordinate pressure to meet objectives: The issue of inordinate
pressure coming from higher authorities in the organisations to engage in some
forms of unethical practices to meet business goals puts employees or
subordinates in a delicate situation of powerlessness to counter such demands.
132
This may be due to fear of being severely reprimanded, losing opportunities for
future career growth, or having their jobs or positions at stake. Such conditions
may lead employees to depart from sound ethical standards just for the sake of
being in the “good books of the boss” and avoid such pressures. Accordingly
employees may perceive that the only way they can gain greater influence in
such an environment is through committing illegitimate or illegal acts (Vidaver-
Cohen, 1993). It was also noted that leaders are more concerned about
addressing issues obstructing goal realisation without necessarily considering
the aftermath should the goals be achieved through unethical means. Leaders’
performances, rewards mechanisms and personal brands are often judged by
attaining hard business targets (whether being profits maximisation, dividends
to shareholders, revenues, market share, share prices, etc.). Thus, they are
themselves in a conflict between an egoist and moral perspective. Furthermore,
it was highlighted that coercion and control constitute an external force
influencing the behaviour of marketing managers through threats and other
similar sources of power (Beck et al., 2010; Fritzsche & Becker, 1983).
(d) Climate of organisational deficiencies: In organisations where fairness,
equity, role modelling and compliance to ethical standards, and responsiveness
to people issues are lacking, there is an inclination towards moral regression
amongst the individuals and distrust in the organisational systems and norms.
Some of the key aspects influencing the organisational climate which need
consideration include culture, reward and punishment philosophies, leadership,
clarity in policies and mission statements as explained below.
Culture - An organisation culture that is communicating a strong message to
the staff that “the ends justify the means” only amplifies the prevalence of
normlessness and anomie in the organisation. Formal and informal cultures
prevailing in the organisation thus have effects on the ethical work climate.
The dynamics of rewards and punishment - Furthermore, a culture of rewarding
good behaviours and performance, but punishing any forms of unethical action
or assistance used will help to curb anomie in the organisation. An institution is
likely to witness higher levels of unethical climate prevailing if employees are
133
punished for not realising goals, but are rarely penalised if they resort to
unethical ways of attaining goals (Vidaver-Cohen, 1993).
Leadership and decision making – The role modelling of the leaders in
preaching, adhering to and living the ethical standards is of paramount
importance to setting the right ethical environment. As Trevino (1990) stated,
“leaders communicate values and standards directly through their actions”.
Ignorance of rules, regulations, procedures and policies for ease of attaining
any business goal or objective by the leaders can simply ignite ethical
deviances amongst the followers. In the absence of “walk the talk” in embracing
ethical approaches, employees tend to mimic their leaders and over time, one
can only see a degradation of the ethical work climate and an upsurge of
anomie. Moreover, a leader who is willing to obtain full participation of the
organisational members on a particular plan or project will ensure that they
participate in the decision making process. The non-enlistment of their support
or views, however, often tends to create disengagement and grudges (which
may not be voiced due to fear of the hierarchy, but are manifested through an
adverse organisational climate emanating from such disengagements and
grudges). Likewise, if the ethical and legal ramifications of management
decisions are not assessed, it is very-likely that subordinates will deduce
incorrect perceptions and be inclined to resort to unethical approaches. In this
regard, the integration of ethical considerations in the decision making process
of the organisation is suggested, thereby enabling the right ethical climate to
permeate (Trevino, 1990).
Rigidity in organisational structures – In organisations characterised by
directive leadership with a strong authoritative style, the structures and levels
are often very rigid in nature and remote from being challenged by
subordinates. Even if bold targets are set, they are rarely justified. It was
highlighted that employees feel obliged to accept such directives due to their
subordinate roles rather than being guided by their own moral compass of what
is right or wrong (Batson, 2011; Kelman & Hamilton, 1989). Furthermore, when
the responsibility of actions or results are blurred and accountability diffused, it
becomes hard to ascertain who has gone wrong or failed (Boisjoly et al., 1989).

134
Such work environments hinder the establishment of the right climate to
promote ethical practices. It should be noted that inadequate formal and
informal controls to spot and curtail unethical behaviour and practices will only
expose the organisation systems to be “beaten” by the deviants.
Clarity of policies and mission statements - Broad and unclear specifications of
organisational policies, codes and reporting are considered as enablers of
anomie in organisations. This allows employees to have full latitude to interpret
the codes as they wish and react as per their own understanding. They can
accomplish the set objectives through illegitimate means whilst not violating
behavioural guidelines (Vidaven-Cohen, 1993).
Similarly, shareholders and top management communicate issues of great
importance through their corporate mission statement (Burke, 1982). It is crucial
that mission statements be carefully crafted to send the right signals to
employees of the organisation. A performance-oriented or competitive-driven
message without an adequate balance on soft values such as customer,
employee, community care and service considerations may lead to higher
degrees of anomie. This is because employees may see it as more important
to focus on the harder aspects of goal attainment than considering the softer
aspects (Vidaver-Cohen, 1993). Furthermore, even carefully crafted mission
statements can only yield the required effectiveness when: (a) the
organisational members are supported with appropriate programmes on how
to deliver on the company’s mission whilst observing ethical requirements and,
(b) such mission statements are lived by one and all (across the hierarchy)
consistently over time. A gap in the specification and application of such
corporate statements will only fuel the risk of anomie.
2.9.3 Global Findings on Workplace Pressures
Having evaluated the factors causing anomie from a conceptual perspective, it is worth
now exploring the situation on-the-ground to get a proper reality check through what
has been studied as it will enable to subsequently evaluate and compare the findings

135
from the present study, for the first time, with those undertaken on the global front
more specifically with regards to workplace pressures and ethical practices.
In this connection, when assessing the state through surveys (2005 US Integrity
Survey), it was found that 74% of the respondents had witnessed unethical behaviour
in their work group (KPMG, 2005). In the National Business Ethics Survey of Fortune
500 employees conducted in 2011, it was noted that 52% of workers had observed
misconduct in America’s most powerful companies, despite having ethics programmes
and standards in place (Ethics Resource Centre, 2012).
In the latest survey conducted by the Ethics and Compliance Initiative in 2017, it was
found that pressure and retaliation are the two metrics that could materially jeopardise
redress of ethical deviances. It was noted that pressure to compromise ethical
standards was on the rise with an increase of 23% in 2017 compared to the last survey
undertaken in 2013. A total of 84% of those who felt pressure also observed
misconduct thereby indicating effects of pressure leading to misconduct.
Furthermore, it was noted that organisations characterised by a strong culture
experienced lower reported rates of pressure (12%) compared to those with weaker
cultures. Their employees experienced pressure by almost 3 times (34%) more than
their counter parts in organisations with stronger culture. Interestingly there is an
apparent correlation between pressure and the S&P 500 index. It was noted that as
the market improves (characterised by mounting performance of the S&P 500 index),
more employees felt increased pressure to compromise ethics standards. When
markets faced recession, fewer employees felt the pressure to compromise. Linked to
the stock trading context, the issue of pressure was seen to come in a different form
in the survey of 2012 by the then Ethics Resource Centre. It indicated that 1/3rd of the
surveyed Fortune 500 employees who watched stock prices all day long confirmed
having been pressurised to compromise ethical standards (Ethics Resource Centre,
2012). The survey also highlighted that the most profound pressured resulted from
personal motivation and needs, the top ones are depicted in Table 2.1 on page 136 of
the thesis:

136
Table 2.1
Order of Intensity of Internal and External Pressure in Fortune 500 Companies (Adapted
from the Ethics Resource Centre Report, 2012)
Order of Intensity
Nature of Pressure
Source of Pressure
1. Keeping your job Internal
2. Meeting your personal financial obligations Internal
3. Meeting quarterly earnings targets External
4. Upholding brand and reputation External
5. Advancing your career Internal
6. Ensuring financial success of company External
7. Increasing shareholder value External
8. Innovating External
9. Expanding globally External
Furthermore, it was revealed that employees working for US public-traded companies
felt more pressure to compromise ethical standards. Moreover, employees working for
those companies in the middle and upper-middle bands of the Fortune 500 group felt
greater degrees of pressure to compromise in a quest for those companies to move
up the ladder into the highest tier of US businesses. The upsurge of pressure in the
workplace of public-listed companies resulted mainly from public scrutiny,
shareholders expectations for growth, the challenges to manage cultural diversities
and operations in various geographical locations (Ethics Resource Centre, 2012).
This pattern was also observed and confirmed among the higher-revenue companies
of the broad base of businesses in the United States.
Outside the United States, countries such as Brazil (47%), India (40%),Turkey (37%)
and United Arab Emirates (33%) were amongst the top most ones where employees
felt pressure to compromise ethical standards in the last 12 months of the survey
conducted in 2017 (Ethics & Compliance Initiative, 2018a).
Spain (10%), Mexico (13%) and Japan (15%) were lowest in the rank as regards
pressure on employees to compromise. The rest of the countries surveyed had a
median point of 22%, with countries such as Germany, the United Kingdom, South
Korea and China falling in the median band. The rate of observed misconduct was
slightly different to the trend in pressure, with countries such as Indonesia (48%),
Russia (45%), Brazil (43%) and India (40%) coming up in the pecking order.
137
2.10 ORGANISATIONAL CITIZENSHIP BEHAVIOUR
The preceding sections of this chapter focused on the study of the macro and meso
level variables of the conceptual research model as well as their underlying theories
and relationships. The coverage of the literature review will now be extended to the
micro-level variables and in particular the “Organisational Citizenship Behaviour”. The
aim is to uncover the conceptual theories unpinning organisation citizenship behaviour
and what are mediating factors affecting it.
Smith, Organ and Near (1983), Organ and Konovsky (1989) and Alizadeh et al. (2012)
shed light on the concept of organisational citizenship behaviour with the aim of
fostering a positive working environment that influences employees to surpass the
minimum role requirements expected from the incumbents.
Organisational citizenship behaviour can be considered as a set of behaviours in
which employees act and perform beyond their prescribed duties and engage in
improving the individual’s or company behaviour (Bateman & Organ, 1983). The
underlying philosophy of organisational citizenship behaviour is driven by the fact that
employees’ delivery levels go beyond their official contractual requirements and job
descriptions to go the extra mile for the organisation’s welfare out of loyalty for their
bosses and the company at large. This is often the result of voluntary compassion for
and reciprocity towards their leaders in exchange for the fair treatment and welfare
they obtain. As Konovsky and Pugh (1994) highlighted, organisational citizenship
behaviour occurs in an environment characterised by social exchange and quality of
superior-subordinate relationships. Gouldner (1960) referred to employees’ feelings of
obligation to pay back what they benefited from their employers.
Van Dyne and LePine (1998) used the concept of in-role and extra-role performance
to explain the concept of employee organisational behaviour. In-role performance
refers to the expected behaviour for regular performance whilst extra-role performance
refers to going the extra mile (beyond one’s job description and contractual
employment obligations). Employees may not be rewarded or disciplined for these
efforts.
138
Employee organisational citizenship behaviour implies self-motivated behaviours of
the employees in contributing towards attaining organisational goals even if these are
not prescribed as part of their job descriptions (Lavelle, 2010). Typical manifestations
in such work environments are:
People showing greater concerns for their organisation and its sustainable
development;
People voluntarily going beyond the call of their official duties for the best
interests of their organisation and stakeholders involved;
People pondering upon the welfare of their organisation as a matter of priority
and driving their decisions accordingly on what is the right thing to do for the
organisation and its stakeholders.
According to the motive theory, it was noted that motives facilitate organisational
citizenship behaviours as they influence employees’ thoughts and feelings about their
jobs and organisations (Organ and Ryan, 1995).
Based on an empirical study in the pharmaceutical industry of China, the relationship
between ethical leadership and organisational citizenship behaviour was examined
through two key mechanisms (Mo & Shi, 2017):
(a) Social learning (from the social learning theory)
(b) Social exchange (from the social exchange theory)
The findings confirmed a positive relationship between ethical leadership and
organisational citizenship which was sequentially mediated by perceived procedural
justice and employees’ organisational concerns (Mo & Shi, 2017). This was in line with
previous empirical findings, where it was noted that employees working with ethical
leaders were more favourably inclined to go beyond their official scope of work to help
attain broader organisational goals (Kalshoven et al., 2011). This was supported by
the social learning theory of Bandura (1977), whereby employees look up to their
leaders, learn from their behavioural patterns and acts, and imitate them. In other
words, ethical leaders enhance their employees’ behaviours through their own ethical
role modelling and personal moral traits. Empirical studies showed that the relationship
between ethical leadership and organisational citizenship behaviour was largely
influenced by the mediating effects of employees’ perceptions of their leaders’ ethical
stance (Mayer et al., 2009). They are based on the social exchange theory to explain

139
how employees go the extra mile and express proactive citizenship behaviour in the
organisation. Employees generally feel indebted to their leaders if they are being
looked after and treated well which results in the employees reciprocating accordingly
in supporting their leaders to attain the bigger organisational objectives (Mayer et al.,
2009; Rioux & Penner, 2001).
The American context produced similar findings, where ethical leadership positively
influenced employees’ organisational citizenship behaviour through employee
motivational orientation towards attaining organisational goals (Neubert & Roberts,
2013).
The positive effects of organisational citizenship behaviour resulting in organisational
performance and productivity, efficiency, customer satisfaction and cost reduction are
well supported by empirical findings (Podsakoff et al., 1997). This is further
supplemented by a recent study conducted in Mauritius whereby it was found that
organisational citizenship behaviour plays a mediating role on job satisfaction and
employee performance (Ramesh & Goolaup, 2020). However, factors influencing such
organisational citizenship behaviour to manifest were yet to be assessed in the local
context.
In the same way, counterproductive work behaviour adversely impacts employees’
performance and behaviour. Mayer et al. (2009) further explained the link between
ethical leadership and employee misconduct arising through the mediating effects of
ethical climate. In order words, an adverse ethical climate emanating from ethical
leadership deficiencies causes employee behavioural deviances. This could be
minimised by more prominent ethical leaders and ethical actions from the top, flowing
into the establishment of a more ethical climate (Elçi et al., 2013).

140
2.11 ETHICS STUDY – GLOBAL PERSPECTIVE
The purpose of this section is to supplement the literature review process and
empirical findings on the core ethics-related variables forming part of the macro-meso-
micro framework established through the conceptual research model. It is therefore
deemed important to study key global surveys which are relevant to this particular
research work. Before beginning the ethics study in the multi-cultural and cross-
industry context of Mauritius to understand the inherent contextual ethical practices, it
will be resourceful to gather insights on global realities, identify key ethical issues and
also gauge the trends since the early days of any such surveys. The aim is to
understand the evolution of ethical practices across continents and countries and
determine the intensity of pressure being faced to comprise ethical standards. This
review will establish the state of awareness and implementation of ethical programs,
and also shed light on the key challenges being faced on the global scene to curtail
ethical deviances.
The Ethics and Compliance Initiative (formerly known as Ethics Resource Centre) has
played an instrumental role since 1994 in the research and development of ethical
standards and practices. Their journey started in the United States through the polling
and reporting of national ethics with a focus on the corporate world (the National
Business Ethics Survey) and gradually the scope was expanded to cover similar
surveys on the global fronts (the Global Business Ethics Survey).
Since 1994, the Ethics & Compliance Initiative has been conducting a longitudinal
cross-sectional study of the workplace from an employee’s perspective. Over the
years, above 39,000 employee responses have been studied on the US front and over
18,000 employees were surveyed across other countries (18) to gauge the global state
and patterns as depicted in Figure 2.11 on page 141 of the thesis (Ethics &
Compliance Initiative, 2018b). In the latest 2020 survey of Ethics & Compliance
Initiative, it is noted that globally more employees reported pressure to compromise
ethical standards as compared to the previous year (29% in 2020 compared to 20%
in 2019). Retaliation rates and observed misconduct have sharply increased with 61%
of the global employees reported experiencing retaliation and eight out 10 reported
misconduct (Ethics & Compliance Initiative, 2020).

141
Figure 2.11. Global business ethics findings – The evolution since 1994. Source: Adapted from Ethics & Compliance Initiative (2018)
Note: At the time of the undertaking this thesis, the latest report available (2018) was used as basis for study and
evaluation.
2.11.1 Key Survey Findings
The Ethics and Compliance Initiative measured the effects of initiatives through what
is known as the Favourable Ethics Outcomes (“FEO”). According to the findings of the
Ethics and Compliance Initiative (2018), FEO has considerably increased:
By 11x, when employees are encouraged to make decisions on the basis of
organisational values and standards;
By 12x, when employees realise that they will be held accountable by their
supervisors / managers for any wrong-doing from their parts;
By 10x, when employees see, hear and feel that a High Quality Program (HQP)
for Ethics and Compliance (comprising of strategy, risk management, culture of
integrity, openness to speak up/report and accountability) is present;
By 14x, when employees feel they can speak up freely, even when the news is
bad.
1994
2000
2003
2005
2009
2011
2013
2016
2017
Employee
prefer to go to
the
supervisors
for advice
about ethics
5 major
outcomes [*]
are influenced
by Ethics &
Compliance
Programs
Management
directly
influences
employee
conduct by
demonstrating
ethical-related
actions
Culture
influences
employee
conduct more
than
programs
2007
Ethics and
Compliance
Programs
reduce the
risk of non-
compliance
Employees
report
wrongdoing to
a supervisor,
not the
helpline
Top
managers and
supervisors
are primary
drivers of
culture
Top and
middle
managers
commit the
most
misconduct
Retaliation
happens
quickly after
an employee
reports
misconduct
Employee
pressure to
compromise
values is
consistent
with the rise
and fall of the
S&P Index
major findings
5 Major Outcomes [*]:
1. Feel less pressure to compromise
2. Observe less misconduct
3. Are more satisfied with the response to the reported misconduct
4. Are more satisfied with their organisations overall
5. Feel more valued as employees
Figure 14: Global Business Ethics Findings: The Evolution since 1994Adapted from Global Business Ethics Survey (2018)
Ethics & Compliance Initiative

142
It was also noted that organisations or countries with strong cultures have favourable
ethics outcomes, with the leaders and managers being instrumental to the
development and nurturing of the ethics and compliance culture through HQPs. For
instance, 85% of all employees surveyed in 2017 observed favourable outcomes with
a strong organisational culture, compared to 15% with a weak leaning organisational
culture.
In the 2017 survey of employees’ conduct in US workplaces, there were three major
revelations as classified below:
(a) The good news – The rates of observed misconduct are on the decline from
51% in 2013 to 47% in 2017 (historically low). Furthermore, the rate of
employees reporting misconduct was at the highest point in 2017 (grew from
56% in 2000 to 69% in 2017).
(b) The bad news – There is a growing number of employees who feel under
increased pressure to compromise ethical standards and “cut corners”. This
was reflected by an increase of 23% in 2017 compared to 2013. On top of this,
there has been a significant upsurge of retaliation (doubled over the past two
surveys from 22% in 2013 to 44% in 2017) from the supervisors of those
employees who are reporting ethical incidents and deviations. Moreover, out of
those who observed misconduct, 67% of the wrong doings were repetitive and
on an ongoing basis. A total of 63% of the employees observed that incidents
of misconduct were committed by a member of management or first line
supervisor. The leading types of reported misconduct in 2017 were as follows:
Misuse of confidential information: 79%
Giving/accepting bribes or kickbacks: 76%
Stealing: 74%
Failed specifications: 73%
Sexual harassment:70%
(c) The worst news – There has not been enough progress made on the
implementation of a strategy to curtail down ethical deviances across the
country. Furthermore, it was noted that despite the fact that misconduct drops
significantly in organisations with strong culture, there was no change in the
number of organisations with such a culture.
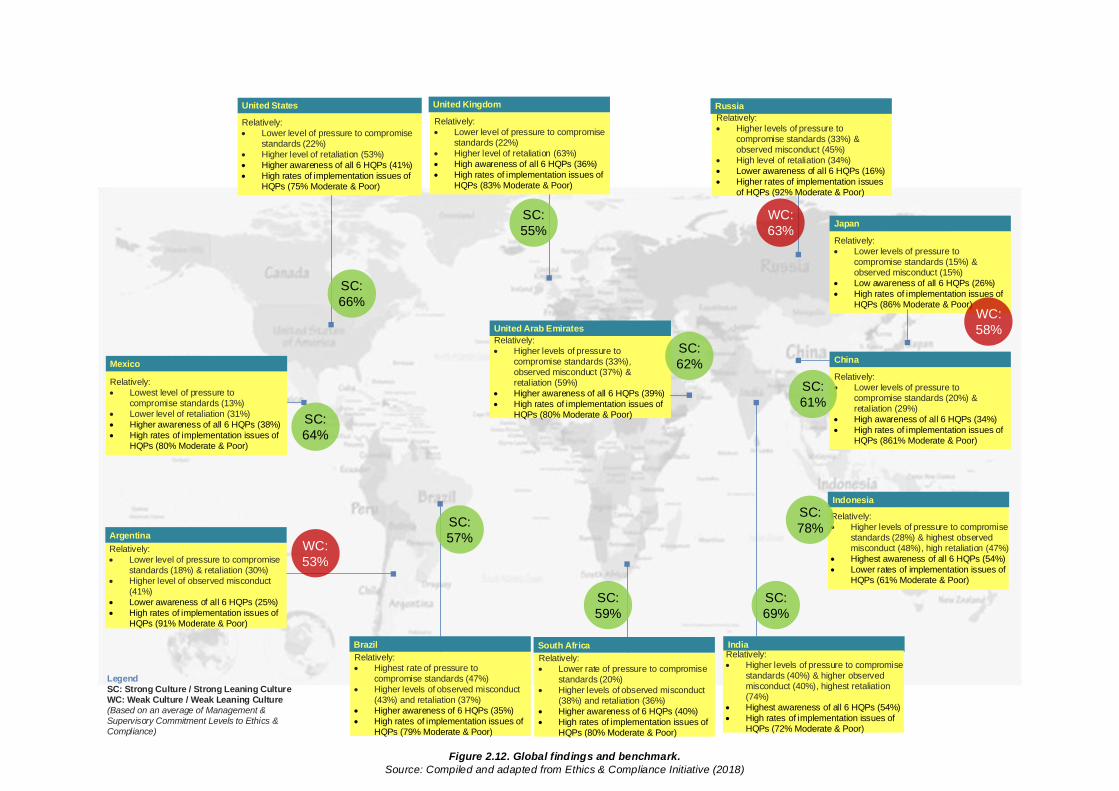
143
Relatively:
Lower level of pressure to compromise standards (22%)
Higher level of retaliation (53%)
Higher awareness of all 6 HQPs (41%)
High rates of implementation issues of HQPs (75% Moderate & Poor)
United States
Relatively:
Highest rate of pressure to compromise standards (47%)
Higher levels of observed misconduct (43%) and retaliation (37%)
Higher awareness of 6 HQPs (35%)
High rates of implementation issues of HQPs (79% Moderate & Poor)
Brazil
Relatively:
Lowest level of pressure to compromise standards (13%)
Lower level of retaliation (31%)
Higher awareness of all 6 HQPs (38%)
High rates of implementation issues of HQPs (80% Moderate & Poor)
Mexico
Relatively:
Lower level of pressure to compromise standards (18%) & retaliation (30%)
Higher level of observed misconduct (41%)
Lower awareness of all 6 HQPs (25%)
High rates of implementation issues of HQPs (91% Moderate & Poor)
Argentina
Relatively:
Lower level of pressure to compromise standards (22%)
Higher level of retaliation (63%)
High awareness of all 6 HQPs (36%)
High rates of implementation issues of HQPs (83% Moderate & Poor)
United Kingdom
Relatively:
Higher levels of pressure to compromise standards (33%) & observed misconduct (45%)
High level of retaliation (34%)
Lower awareness of all 6 HQPs (16%)
Higher rates of implementation issues of HQPs (92% Moderate & Poor)
Russia
Relatively:
Lower levels of pressure to compromise standards (15%) & observed misconduct (15%)
Low awareness of all 6 HQPs (26%)
High rates of implementation issues of HQPs (86% Moderate & Poor)
Japan
China
Relatively:
Lower levels of pressure to compromise standards (20%) & retaliation (29%)
High awareness of all 6 HQPs (34%)
High rates of implementation issues of HQPs (861% Moderate & Poor)
Indonesia
Relatively:
Higher levels of pressure to compromise standards (28%) & highest observed misconduct (48%), high retaliation (47%)
Highest awareness of all 6 HQPs (54%)
Lower rates of implementation issues of HQPs (61% Moderate & Poor)
Relatively:
Lower rate of pressure to compromise standards (20%)
Higher levels of observed misconduct (38%) and retaliation (36%)
Higher awareness of 6 HQPs (40%)
High rates of implementation issues of HQPs (80% Moderate & Poor)
South Africa IndiaRelatively:
Higher levels of pressure to compromise standards (40%) & higher observed misconduct (40%), highest retaliation (74%)
Highest awareness of all 6 HQPs (54%)
High rates of implementation issues of HQPs (72% Moderate & Poor)
Relatively:
Higher levels of pressure to compromise standards (33%), observed misconduct (37%) & retaliation (59%)
Higher awareness of all 6 HQPs (39%)
High rates of implementation issues of HQPs (80% Moderate & Poor)
United Arab Emirates
SC:
66%
SC:
55%
SC:
69%
SC:
78%
WC:
63%
SC:
61%
SC:
64%
WC:
53%
SC:
57%
SC:
59%
SC:
62%
WC:
58%
LegendSC: Strong Culture / Strong Leaning CultureWC: Weak Culture / Weak Leaning Culture(Based on an average of Management & Supervisory Commitment Levels to Ethics & Compliance)
Figure 2.12. Global findings and benchmark.
Source: Compiled and adapted from Ethics & Compliance Initiative (2018)

144
Table 2.2
Global Ethics and Ratings by Country – 2018
Source: Compiled from Ethics & Compliance Initiative (2018)
No Country Pressure to
Comprise
Standards
Observed
Misconduct
Experienced
Retaliation
Strong/Strong
Leaning Culture
Weak/Weak
Leaning Culture
Strong/Strong
Leaning Culture
Weak/Weak
Leaning Culture
All 6
Elements
Some
Elements
No Element /
Did not know
Well
Implemented
Moderately
Implemented
Poorly
Implemented
1 United States 22% 30% 53% 67% 33% 64% 36% 41% 47% 12% 24% 36% 39%
2 Mexico 13% 33% 31% 65% 35% 63% 37% 38% 55% 6% 21% 40% 40%
3 Brazil 47% 43% 37% 56% 44% 57% 43% 35% 56% 9% 21% 33% 46%
4 Argentina 18% 41% 30% 49% 51% 45% 55% 25% 64% 12% 9% 34% 57%
5 South Africa 20% 38% 36% 59% 41% 58% 42% 40% 53% 6% 11% 22% 68%
6 Spain 10% 21% 43% 47% 53% 38% 62% 30% 53% 17% 11% 29% 60%
7 France 30% 33% 33% 33% 67% 32% 68% 18% 50% 33% 6% 16% 78%
8 United Kingdom 22% 29% 63% 57% 43% 53% 47% 36% 51% 13% 17% 33% 50%
9 Germany 22% 26% 50% 43% 57% 37% 63% 12% 55% 33% 7% 18% 76%
10 Italy 24% 34% 35% 37% 64% 37% 63% 26% 59% 15% 11% 31% 58%
11 Turkey 38% 30% 56% 55% 45% 57% 43% 23% 64% 13% 15% 32% 53%
12 Russia 33% 45% 34% 38% 62% 37% 63% 16% 61% 23% 8% 24% 68%
13 United Arab Emirates 33% 37% 59% 62% 38% 62% 38% 39% 54% 7% 20% 46% 34%
14 India 40% 40% 74% 68% 32% 70% 30% 42% 54% 4% 28% 45% 27%
15 China 20% 34% 29% 58% 43% 63% 37% 34% 55% 10% 19% 33% 48%
16 South Korea 22% 28% 36% 27% 73% 26% 74% 24% 50% 25% 11% 22% 68%
17 Japan 15% 15% 34% 43% 57% 42% 58% 26% 40% 33% 14% 21% 65%
18 Indonesia 28% 48% 47% 76% 24% 79% 22% 54% 44% 3% 38% 39% 22%
A Highest 47% 48% 74% Overall 32% 54% 12% 16% 33% 51%
B Median 22% 33% 36%
C Lowest 10% 15% 29%
Colour Legend:
Compiled from Ethics & Compliance Initiative - Global Benchmark on Ethics
[Accessed online on 14 July 2018]
Program Awareness Program Implementation
Program Awareness & Implementation
Top 6, above Median
Lowest most, below Median
Supervisor Commitment Management Commitment
Culture Assessment

145
The latest survey conducted by the Ethics and Compliance Initiative was based on
data collected from 18,000 participants between 2016 and 2017 across eighteen
countries (Ethics & Compliance Initiative, 2018a). The key findings as depicted in the
Table 2.2 on page 144 of the thesis are as follows:
(a) Pressure to compromise standards - In most of the countries surveyed,
pressure to compromise standards was felt by 1 in every 5 employees working
for corporates over the last 12 months. Brazil had the highest percentage of
employees who felt pressure to compromise (47%) whilst Spain had the lowest
(10%).
(b) Observed misconduct – It was noted that as pressure to compromise rises,
so does the rate of observed misconduct. Indonesia recorded the highest rate
of employees observing misconduct (48%) with Japan having the lowest rate
(15%). It was also noted that a significant segment of employees (63%+) who
observed misconduct did not report due to fear that:
The report would not stay confidential (74%)
No corrective action would be taken (69%)
They could not report the issues anonymously (64%)
They would be coined as a snitch (63%)
(c) Retaliation - Another major barrier to escalation/reporting was retaliation.
Employees in a majority of the countries personally experienced retaliation in
the past 12 months to a considerable extent (36% on average); India being the
topmost country experiencing such an issue (74%) and China being the least
experienced by employees (29%).
(d) Culture Measurement – The culture levels were also measured based on the
assessment of supervisor and management commitment to uphold ethical
standards. Strong leaning cultures are those where employees feel that their
leaders, managers or supervisors are ethical and demonstrate ethical
leadership traits. Weak leaning ones are simply where the degree of
commitment towards ethical standards are lower amongst the supervisors or
leaders. It was noted that when top management promotes workplace integrity,
employees feel more motivated to report misconduct. South Korea (74%),
France (68%) and Russia (63%) were the countries with the weakest culture

146
rates based on the employees’ responses in these countries. Indonesia (79%),
India (70%) and the United States (64%) were found to be strong leaning
cultures by employees.
(e) Awareness and Implementation of Program – The survey used, as a
reference to benchmark countries, 6 standard program elements comprising:
Written standards of workplace integrity
Training on standards of workplace integrity
Ability to seek feedback/advice related to workplace integrity
Confidential or anonymous reporting mechanisms
Workplace integrity as part of the performance appraisal process
Formal process to discipline violations of the code of conduct
The levels of program awareness and program implementation were assessed.
The level of awareness of all six programs were somewhat low across many
countries (e.g. Germany: 12%, Russia: 16%, France: 18%). It was further noted
that well implemented programs are rare (only 16%) with 84% of programs
implemented moderately and poorly (Ethics & Compliance Initiative, 2018a).

147
2.12 ETHICS STUDY - MAURITIUS PERSPECTIVE
2.12.1 Introduction
Research studies on business ethics have been prominent in several developed
countries and continents (around 55.9% published articles in journals come from North
America, 25.3% from Europe and 8% from Asia-Pacific regions for the period 1999-
2008). However, coverage in the African and South American regions made up a small
percentage for the said period (Chan et al., 2010). South Africa has spearheaded most
of the research in the business ethics sphere in the African continent. Ethics research
studies, as undertaken globally, are yet to be conducted in the current context of
Mauritius.
Having scanned through the global ethical practices and realities in the preceding
section, it is now appropriate to focus on the local context and study the ethical
practices, standards, challenges and realities in the multi-cultural and cross-industry
context of Mauritius. This will go a long way to contributing to the body of knowledge
whilst bringing Mauritius onto the global map of ethical research studies.
2.12.2 Mauritius – Its Culture and Economic Background
Mauritius is considered as one of the model economies in the African region
characterised by a strong economic development profile and ranked 1st in Africa in a
number of economic and governance indicators (Economic Development Board
Mauritius, 2021). It now stands under the global spotlight as a case study to learn from
its economic development.
Research has advanced into business ethics around the world. However, empirical
studies in Mauritius (country located in the Indian Ocean in the so-called “golden
triangle” connecting Africa, Asia and Australia) has nevertheless been restricted. The
specificities of Mauritius make it a complex but yet interesting context for study as
characterised by:
(f) Its plurality of cultures and colonial background – Asgarally (2007) named
Mauritius “An Island of Cultures” with its culture sourcing from Europe, Africa

148
and Asia and characterised by a plurality of languages, religions, myths and
festivals .
Mauritius was under European colonisation for some two and a half centuries
before gaining its independence from British rule on 12 March 1968. Since then
Mauritius operated as a sovereign state.
The enculturation process started before the 16th century with visits of Arab
navigators who discovered the island and named it “Dina Arobi”. Given the
strategic location of the island for sailors and traders, it subsequently witnessed
waves of visitors from various parts of the world. Post the Arabs, the
Portuguese came in and used the island, which they called “Isola de Cirne”, as
a port of call for their journeys towards the Eastern part of the world. During
their visits they introduced pigs and monkeys onto the island and maintained it
as a natural reserve for fresh meat, given the then presence of giant tortoises
and Dodo (a unique bird, now extinct). At the end of the 16th century, the Dutch
settled in when they introduced sugarcane and deer from Java on the island
which they called as “Mauritzius”. During the short span of Dutch colonisation,
however, the resources on the island were exploited culminating in the
disappearance of indigenous trees, ebony and the Dodo (Asgarally, 2007).
In 1715, the French took possession of the island, then known as “Isle de
France” which saw the first wave of French people called “colons” settling in the
island with slaves they brought from Africa. There was a growing number of
settlers, originating from maritime provinces of France, following the arrival of
the French Governor, Mahé de La Bourdonnais. He provided incentives to
retiring officers such as land and loans to purchase slaves, so as to settle them
on the island. Slaves were procured from countries such as Mozambique,
Madagascar, Senegal and Guinea (Eastern and Western coasts of Africa where
presumably the navigators harboured).
The British, who held a firm presence in in the Indian Ocean , mounted a plan
to take over the surrounding islands of Isle de France before capturing the
latter, defeating the French troops in 1810. The Treaty of Paris was signed in
1814 and enabled the sharing of the possession of the islands in the Indian

149
Ocean between the French and British, with the latter taking over Isle de France
and its dependencies. The island was then named Mauritius and the British
started the cultivation of sugarcane and progressive agricultural development.
With insufficient labour arising because of the abolition of slavery in 1835,
where freed slaves shifted from plantations to small trades, fishing and crafts,
there was a growing need to import labour to support the development of the
island. The British then imported indentured labourers (known as “coolies”) from
India on a contractual basis recruited from places such as Calcutta, Madras
(now Chenai) and Bombay (now Mumbai). This process gradually formed a
large Indian population who settled down permanently on the island for various
reasons. Subsequently, this also saw the settling in of Indian and Chinese
traders with their clerks from places such as Gujerat in India and Canton in
China.
From an inhabitancy of 50,000 people in 1789 (some 5,000 European settlers
and around 42,000 slaves), the total population of Mauritius grew with the
arrival of immigrants from India and China reaching around 826,000 (c. 52%
Hindus, 17% Muslims, 3% Chinese and 28% classified as general population)
in the early 1970s (Asgarally, 2007). The population today stands at around
1.27 million people with diverse religious groups consisting of 48.54% following
Hinduism, 26.26% of Roman Catholicism, 17.30% of Islam, 6.45% of other
Christians, 0.43% of Buddhism and 1.03% of others and not stated (Wikipedia,
2018). Mauritians speak 12 (English, French, Creole, Bhojpuri, Hindi, Marathi,
Urdu, Arabic, Tamil, Telegu, Chinese and Gujerati; the former three being the
most common amongst the Mauritians).
The journey of Mauritius since the 16th century saw the development of a multi-
cultural, multi-ethnic and multi-lingual population. This is characterised by large
socio-economic and cultural diversities including religious and cultural festivals,
cuisines, architectures, myths and legends, literature, arts, entertainments,
dressings and crafts. The fascinating aspect is that they all came with their own
ways of life, but gradually found themselves knitted as one collective force
whilst respecting each one’s rights, faith, values and diversities.
150
(g) Its economic, social, political and governance specificities – Ng (2015)
coined the French phrase “L’économie de la diversité” (meaning “the
diversification of the economy”) to characterise the Mauritian economy. Since
the independence of the country, Mauritius developed itself from a low-income
agriculturally based economy to a middle-income diversified economy with
activities spanning across industries such as manufacturing, tourism, financial
services and technology sectors. The country experienced an average Gross
Domestic Product (GDP) growth rate of 3.9% between 2001 and 2018 (GDP at
USD 13.34bn in 2017) with increasing GDP per capita (USD 10,186 in 2017)
(The World Bank Group, 2018; Trading Economics, 2018). Mauritius is also
characterised by a relatively low unemployment rate of 7.2% and low inflation
rate of 3.67% in 2017 (Statistica, 2018).
In a short span of time, post-independence, Mauritius developed itself to
become No.1 in Africa in (Economic Development Board Mauritius, 2021):
World Bank Doing Business 2020
Global Competitive Index 2019
Mo Ibrahim Index of African Governance 2020
2018 Index of Economic Freedom
Social Progress Index 2019
Forbes Survey of Best Countries for Business 2019
Economic Freedom of the World 2020
Democracy Index 2019
Global Innovation Index 2020
International Property Rights Index 2019
Productive Capacity Index 2021
Mercer’s 2019 Quality of Life Survey
Travel & Tourism Competitiveness Index 2019
The configuration of Mauritius’ politics has traditionally revolved around four
main political parties (Labour, MSM, MMM and PMSD) which often run in
coalition. The country was governed for a longer period by the labour and

151
socialist parties as being the prime leading parties of any coalition. Smaller or
newly emerging parties often come up with constructive worthy ideas and
programmes. However, they have had difficulty challenging the bigger parties
mainly due to lack of financial support and the dominating political affinities of
the larger parties’ candidates with social cultural groups. All this has traditionally
resulted in the formation of political coalitions whereby the relatively smaller
parties have joined forces with the main parties to challenge those in power or
stay in government.
From a governance perspective, Mauritius operates within a framework of
parliamentary democracy with separation of powers between the Legislative,
Executive and the Judiciary as spelt out in its Constitution. Based on a
Westminster system of government, it features the head of the state (the
President), head of the Government (the Prime Minister, democratically
elected), a parliamentary opposition (the Leader of the Opposition), the
Parliament with democratic televised debates and recorded in Hansards, the
legislature and Courts.
Over and above the multi-cultural and multi-ethnic specificities in the current
context of Mauritius, there is also a strong need to understand the underlying
dynamics and roles of key economic players in the development of the country.
Whilst the power to elect the country’s policy makers has shifted into the hands
of the majority of the population, the economic powers have nevertheless
stayed with the ones who held the same before independence. According to
Salverda (2015), the event of Mauritius gaining its independence also marked
the end of the white Franco-Mauritians colonial elite regime,. This elite segment
represents a minority group of people of below 1% today. They often play a low
profile but have well-devised strategies regarding investment in the local
economy. This, coupled with the timing of such investments, collaborating with
political powers, and initiating projects has consolidated their economic
positions. In the post-colonial era of Mauritius, they regularly felt themselves in
danger of losing economic power and market dominance which were their main
strengths primarily with the plethora of land banks and sugar industries which
they owned. Salverda (2015) was of the view that there were collaborative

152
strategies between the Franco-Mauritians and the country’s political powers to
secure their interests and address their anxieties of the post-colonial era. To
understand the subtle politico-economic thread in the current context, it is worth
drawing from Bachrach and Baratz's (1962) study which identified an important
issue regarding the power dynamics, coined as the “two faces of power”. They
highlighted that, under the colonial regime, the strategy was to ensure there
was control over the political agenda which kept critical issues outside the
political process. Their studies highlighted problems of power in the
contemporary society and drew a parallel between the pluralist and elitist
models to explain these dynamics. Pluralist is a condition or system where two
or more groups or sources of authority co-exist, whereas elitist is a condition
or system tied to an elite. Backrach and Baratz (1962) particularly suggested
the need to investigate the issue coined as “mobilisation of bias” in the
institution to establish the rules of the game and determine how the biasness
benefits and handicaps any particular group. They also called for study of the
non-decision making, or status quo oriented persons’ or groups’ influence on
the community and political system. Lukes (2005) also attempted to understand
the extent to which American politics is dominated by a ruling elite or pluralist
democracy. He posited that “each view of power rests on different conceptions
of interests”; this is very relevant in the context of Mauritius which is
characterised by a diversity in interests of the key economic players, socio-
cultural groups, political leaders and the general population. He also highlighted
through his three conceptual views that there are varying degrees of differences
in decision-making and control over political agendas and observable (overt,
covert and latent) conflicts between interests. This makes it harder to be
recognised in the overall power dynamics amongst political actors, economic
players and other social forces.
Today, the Franco-Mauritians remain the most important players and have
prolonged their elite position in the economics of Mauritius with a host of diverse
businesses under their common family-related control. These include sugar
factories, power plants, textiles mills, banks, financial institutions, hotels,
property and smart cities’ development. They control five of the largest 10
companies of Mauritius (Business Publications Ltd, 2017). According to

153
Salverda (2015), the Franco-Mauritians have prevented significant erosion in
their position through the exercise of different forms of power whilst playing a
noteworthy role in the successful economic journey of the country; a success
that can be seen as intrinsically linked with that of these large economic players.
Another specificity in Mauritius resides within the socio-political relationship.
Over time, it was noted that certain socio-cultural-ethnic groups have supported
specific political parties due to their past support they have received for the
welfare of their families and/or members of those socio-ethnic groups. Major
economic players do not like politics, though it could be seen otherwise, as it
often brings uncertainties due to political agenda and lack of competencies (Ng,
2005). One is reminded of Lord Acton’s powerful statement: “power corrupts,
absolute power corrupts absolutely” implying that as a person gains more
power, their sense of morality reduces considerably (Houghton Mifflin Harcourt
Publishing Company, 2005). This should be considered in the overall
interpretation and understanding of actions of political leaders specially when
confronted with ethical dilemmas.
(h) Its industry diversification
At the time of independence in the late 1960s, the Mauritian economy was
pretty weak, with heavy dependence on monocrop (sugar) and high rates of
unemployment. Ever since the British colonisation period and more so post the
independence days, the Commonwealth Sugar Agreement has been of great
help to Mauritius and the growth of its sugar industry, as it could export its sugar
to the United Kingdom. The Commonwealth Sugar Agreement played an
enabling role in the colonial development policy of Britain with an overarching
objective to provide long term assurance to the future of the sugar industry in
the Commonwealth (Abbott, 1989). Sugar was initially traded under the
Commonwealth Sugar Agreement since 1951 and subsequently under the
Sugar Protocol since 1975 (Lichts, 2004). However, the heavy dependence on
monocrop and the likely risk of sugar cane fields being severely impacted by
cyclonic conditions over the island required policy makers to explore alternative
economic pillars to create economic resilience. Pressure also started mounting

154
from big sugar producers such as Australia, Brazil and Thailand, challenging
the legality of such agreement / protocols under the World Trade Organisation
rules (Government of Mauritius, 2004). The call for diversification was already
set for countries dependent on such agreements. In 1970, government took
appropriate measures to start its economic diversification process by the
enactment of the Export Processing Zone Act. A host of incentives and
concessions were provided to business enterprises that were export-orientated.
These facilities led to the emergence of a multitude of factories engaging in
textiles, manufacturing and exports, paving the path way to economic success
(Rogerson, 2008). This was further boosted by the Multi-Fibre Agreement which
gave formal quotas and access to a guaranteed share of the rich markets (Ernst
et al., 2005). Moreover, the Multi-Fibre Agreement constrained several
countries to export, thereby encouraging overseas investors to capitalise on the
Mauritius platform which is characterised by cheap and literate labour, and
government incentives and benefits under the Multi-Fibre Agreement. All these
culminated in a host of overseas investors setting up their production units for
garments in Mauritius for mutual economic benefit. This episode is constituted
as the second era of economic development of Mauritius.
With continuous pressures mounting to end non-preferential trades and treaties
on the global front (in respect to compliance with the World Trade
Organisation’s rules), Mauritius’ privileges surrounding the sugar protocol were
increasingly challenged. On the other hand, post the industrial boom with the
Export Processing Zone, the cost of production gradually started to mount with
the increased cost of living of factory workers. This rise in costs of production
was coupled with other competing countries gearing up to provide more
advantageous production platforms with cheaper labour. The manufacturing
industry in Mauritius (more specifically, textiles) thus started to be confronted
with other economic challenges with the risk of investors shifting their
production plants to other competing countries. This issue was further
compounded by the increasing literacy level of Mauritians who preferred office
and white collar jobs rather than a career in the manufacturing plants. Mauritius
then had to promptly embrace its 3rd wave of development and diversified with
an emerging hospitality sector. Mauritius is still largely in its natural state and is

155
surrounded by exquisite sand and sea, there were promising opportunities to
develop and promote itself as a tourist destination in the Indian Ocean. This
saw some large chains of hotels being established around the coastal regions
targeting initially the European market and gradually shifted to the South African
and Asian markets.
Today Mauritius has transformed itself into a middle-income country with a
breadth of diverse growing services characterised by strong contributions from
the financial services, technology and hospitality sectors over and above the
traditional sectors. With an ambition to turn Mauritius into a high-income country
and embrace its Vision 2030, one is bound to see further progress in economic
diversification strategies. Potential opportunities exist for the development of
the ocean economy, renewal energy, the digital economy with FinTech
amongst the emerging ones (Economic Development Board Mauritius, 2018b,
2018a; Foreign Affairs, 2017).
Table 2.3 on page 156 of the thesis provides a breakdown of the 2016 position
by industry focusing on private establishments classified as “large” by Statistics
Mauritius.
Given very limited empirical studies in the ethical leadership spheres in
Mauritius, the aim is to study these “large” establishments especially within a
multi-cultural and cross-industry environment of the country stemming from a
colonial background. Statistics Mauritius (2017b) reported its sixth census on
economic activities from 2013 to 2015, with 2013 being the reference year.
Such a census is conducted every 5 years with the next one due in 2018. The
2013 census covered 127,000 establishments (referred to as ‘Production
Units’) of which 2,200 (2%) were classified as “large” establishments engaging
at least 10 persons across various industries. These were considered as the
largest contributors to economic development of the country; the remaining
being small and itinerant, engaging less than 10 persons. Furthermore, the
“small” establishments are relatively unstructured and in the majority of cases
are sole traders or smaller units of activities thereby making the “large”
establishments a better population for the research of the kind which was
envisaged for the present study.

156
The 2013 census did not provide a complete view as it did not cover “large”
establishments in certain specific industries such as agriculture, forestry, fishing
and others. In 2016, another survey conducted by the responsible government
body provided a broader and updated view of the population of ‘large’
establishments to having reached 2,534 as shown below in Table 2.3 (Statistics
Mauritius, 2017a):
The data set provided in Table 2.3 below does not include establishments and
employees of institutions forming part of the Government, Local Authorities and
Rodrigues Regional Assembly (an out-island district of Mauritius).
Table 2.3
Gross Value Added Contribution by Industry – Large Establishments
(at current basic prices)
Note. Exclude Government, Local Authorities and Rodrigues Regional Assembly
Year 2016 statistics were considered as Year 2017 figures were still provisional
2.12.3 Mauritius – Its Legal and Corporate Governance
Foundation
Stepping out of the colonial era and evolving independently post 1968, Mauritius had
to put in place an appropriate corporate governance foundation that could support its
socio-economic development and which would gradually position itself as a reliable
jurisdiction in the regional and global space.
No. Industry Group Year
2016
Average
Contribution
%
(Year 2014-2016)
No.of
Production
Units
(Year 2016)
Employment in
Large
Establishment
(Year 2016)
1 Agriculture, forestry and fishing 3.6 3.6 110 9,273
2 Mining and quarrying 0.2 0.2 23 1,043
3 Manufacturing 14.0 14.7 585 70,962
4 Electricity, gas, steam and air conditioning supply 2.2 1.9 7 2,331
5 Water supply, sewerage, waste management and remediation activities 0.4 0.4 10 1,903
6 Construction 4.2 4.5 111 13,897
7 Wholesale & retail trade; repair of motor vehicles and motorcycles 11.9 11.9 457 27,354
8 Transportation and storage 6.3 6.2 90 15,415
9 Accommodation and food service activities 6.9 6.5 196 27,338
10 Information and communication 4.2 4.3 92 10,189
11 Financial and insurance activities 12.1 12.0 145 12,711
12 Real estate activities 5.9 6.0 33 1,063
13 Professional, scientific and technical activities 4.6 4.6 178 8,914
14 Administrative and support service activities 2.9 2.9 118 18,265
15 Public administration and defence; compulsory social security 6.4 6.3 40 4,007
16 Education 4.9 4.9 176 15,882
17 Human health and social work activities 4.3 4.2 58 4,851
18 Arts, entertainment and recreation 3.4 3.4 74 3,852
19 Other service activities 1.5 1.6 31 1,466
TOTAL 100.0 100.0 2,534 250,716
Exclude Government, Local Authorities & Rodrigues Regional Assembly
Year 2016 statistics were considered as Year 2017 figures were still provisional
Private Sector
Table 6: Gross Value Added Contribution by Industry - Large Establishments
[at current basic prices]

157
Established in 1966, the Bank of Mauritius was amongst the first controlling institutions
having the role and duty to regulate the banking services whilst also being responsible
to formulate and execute the monetary policy of the country (Bank of Mauritius, 2018).
The governing Bank played an instrumental role in putting the right platform and
controls for commercial banks to operate properly post-independence. At the same
time, there was the necessity to put the appropriate legislation to enable companies
to be formed and run. The first version of the Companies Act was thus introduced in
1984 followed by the setting up of the Stock Exchange of Mauritius in 1989 to enable
companies to be listed and traded through an appropriate exchange (Stock Exchange
of Mauritius, 2018).
However, in the beginning of the new millennium, Mauritius had to embrace a new
wave of modernisation with regard to its legal and corporate governance framework
to be able to keep pace with globalisation and stay tuned with international standards.
This led to:
The introduction of a new Companies Act (2001)
The introduction of the International Accounting Standards (IAS)
The introduction of a new Listing Rules for the Stock Exchange of Mauritius
The setup of the Financial Services Commission (2001) as the regulatory body
of the non-banking financial institutions including insurance, leasing, stock
broking companies (Financial Services Commission, 2018). The Financial
Services Commission was mandated to enable legislations such as the
Insurance Act 2005, Securities Act 2005 and Private Pension Scheme Act
2012.
Setting up of the Independent Commission Against Corruption (ICAC) under
the Prevention of Corruption Act 2002 with the main objective to educate the
public against corruption as well as investigate and combat acts of corruption
in its various forms (Independent Commission Against Corruption, 2018).
Setting up of the National Committee on Corporate Governance (NCCG) in
2003 to prepare Mauritius to embrace best practices in corporate governance.
The introduction of the Financial Reporting Act which led to the creation of the
Mauritius Institute of Directors as a platform to promote best practices at the
level of the Board and governance of organisations as well as assist in the
competency development of directors (Mauritius Institute of Directors, 2018).

158
Setting up of the Competition Commission of Mauritius in 2009 primarily to
investigate and regulate anticompetitive behaviours from economic players
(Competition Competition of Mauritius, 2018).
On the back of seminal studies and reports from the Organisation for Economic Co-
operation and Development (OECD) and Commonwealth reports, it was deemed
appropriate to prepare a Code of Corporate Governance for Mauritius. This led the
NCCG to invite Mervyn King (Chairman of the King Committee of South Africa and
former Governor of the Bank of England) to guide this project (The Committee on
Corporate Governance, 2004). The first revised version of this National Code of
Corporate Governance (“National Code”) was successfully completed and released in
April 2004. It covered key aspects relating to compliance, disclosures, enforcement,
roles of the board, directors, board committees, secretary and matters concerning risk
management, auditing and reporting. In 2016, it was felt opportune to update the
National Code for Mauritius, especially after witnessing the corporate debacles on the
global front. The second version of the National Code was thus released in 2017 and
was based on eight basic principles of Corporate Governance and an innovative
concept of “apply and explain” versus the departing “comply and explain” methodology
(National Committee on Corporate Governance, 2016). The concept of apply and
explain is (a philosophy whereby public interest entities and others are required to
apply all the principles of the Code and also explain, in their annual reports, how they
have been applied. The latest National Code covers key principles of governance
structures, the structure of a board and its committees, appointments, duties,
remuneration and performance of directors. It further includes risks governance,
internal control, reporting with integrity, audit and relations with shareholders and other
stakeholders. A scorecard is used to self-assess and score the company’s governance
practices under each principle of the Code on a total score of 100.
The National Code provides for ethical standards of behaviour and corporate values
to be implemented through a written Code of Ethics by organisations and family owned
enterprises. Such a Code of Ethics should address issues relating to ethical practices
in the particular circumstances of the business environment while covering aspects
related to conflict of interests, fair dealings with all stakeholders, proper use of
organisation’s property, policies related to procurements, giving and receiving gifts, a

159
process for reporting unethical practices and decision making, and compliance with
laws and regulations. It is expected that the Code of Ethics should make acceptable
and unacceptable practices clear to the stakeholders especially the officers and
employees so as to make proper ethical judgements.
During this period of transition, several large public and private corporations
established their own internal Codes of Ethics to better guide their leaders and
employees. The following are some of the key ones stemming from various work
spheres, and which are worth mentioning for the purpose of this literature review:
Code of Ethics for Barristers (Attorney General’s Office, 1997)
Code of Ethics and of Banking Practice for Banks (Mauritius Bankers
Association, 2013)
Code of Conduct and Ethics for the Mauritius Revenue Authority (Mauritius
Revenue Authority, 2004)
Code of Ethics for the Mauritius Institute of Education (Mauritius Institute of
Education, 2011)
Code of Ethics for Public Officers (Republic of Mauritius, 2010)
Code of Ethics for the Financial Reporting Council (Financial Reporting Council,
2018)
These Codes are all geared towards building a culture of integrity within its
organisational framework, work systems, processes and the profession at large.
However, the effectiveness of the implementation of such Codes of Ethics and whether
employees in the organisations know how well to make ethical judgements between
what is ethical and what is not is still to be assessed from an empirical perspective.
Furthermore, an evaluation of whether such Codes of Ethics are effective in curtailing
unethical behaviours and practices within organisations, and whether the underlying
apply and explain philosophy of the National Code is serving its purpose is still to be
determined from an empirical perspective.
It is expected that the National Code and the Code of Ethics will supplement each
other to guide ethical norms and practices within organisations. Nevertheless, it is yet
to be established from a practical and operational standpoint, what key ethics related
actions (“KERAs”) are that are critical for businesses to implement to elevate ethical

160
standards and behaviour. This is even more important in the light of the prevailing
business dynamics and challenges. From the literature review, it was found that some
evaluations of KERAs have been done in global studies, and it would be useful to
evaluate the relevance of such KERAs in the local context as well. The development
of any future ethics strategy and recommendation would also necessitate empirical
inputs from the operators or actors on what type of ethics related actions are perceived
to be critical, in the present context, so as to strengthen the ethical organisational
climate and culture. (Such actors are coined as Voice of the Actors in a similar manner
that one would apply the Voice of the Customer when it comes to listening to the
ultimate client when devising a product or service).
2.12.4 Ethics Challenges in Mauritius
As has been the case globally, Mauritius has also witnessed numerous cases of
ethical issues whether on the social, political and business fronts. Whilst a series of
legal, regulatory and governance framework and codes of conduct exist in the country,
the media has nevertheless reported several issues pertaining to influence of power,
corruption, nepotism, frauds, corporate failures, pressures, lobbies and economic
cartels. Thus, for Mauritius to uphold its image and standing in the global economic
space and also embrace its upcoming waves of development, there is a need to study
prevailing ethical issues, understand their underlying causes. It is required to put
forward appropriate recommendations to policy makers at the level of government,
public, private and social organisations, so as to take proactive measures in curtailing
ethical violations. As Mauritius is a country with limited natural and human resources
compared to bigger countries, it rests on the shoulders of each and every economic
player to embrace the right mindset and uphold ethical standards for the nation to keep
shining.
Despite research in various domains focusing on Mauritius, there have not been many
empirical studies conducted on ethical leadership in the country over the last two
decades. A few were nevertheless noted covering ethical decision making (Napal,
2005), ethics in journalism (Chan-Meetoo, 2013), ethical leadership (Ah-Kion &
Bhowon, 2017; Ah-Teck & Hung, 2014) and assessment of corporate governance
practices (Padachi et al., 2016).

161
Based on the studies conducted by Napal (2003) on ethical decision making amongst
a sample of business executives, it was noted that personal ethics predominate in the
making of ethical choices, regardless of the presence of a code of conduct.
Furthermore, it was also found that the behaviour of management was a critical
influential factor of ethical conduct. For example, Chan-Meetoo (2013) uncovered
several ethical issues facing the profession of journalism in Mauritius. She highlighted
the key issues facing the profession such as issues of competition on the digital front
to stay ahead of the curve in news disclosures to the public. There were pressures to
publish fast, with the accompanying dangers of transgressing accuracy and veracity
of information, inclination towards sensationalism to boost sales of newspapers and
revenues. Job insecurity and high turnovers existed due to the inherent risks of the
profession, and external pressure from the government, political figures and economic
players. Journalists have also faced substantial pressure to refrain from publishing
delicate news on powerful politicians. In certain cases, gifts and rewards have been
used to benefit from positive media coverage. A total of 50% of the surveyed
participants confirmed having either witnessed or personally confronted such ethical
dilemmas.
Padachi, Urdhin and Ramen (2016) conducted a study on companies listed on the
Stock Exchange of Mauritius and non-listed banks to assess corporate governance
practices. Their findings showed that there is a sectoral disparity in relation to the
compliance levels within the financial sector (covering banks, insurance and other
financial institutions). These were much more compliant to the corporate governance
framework as compared to other sectors. The main reason explaining this fact resides
upon the stringent compliance requirements imposed by the relevant regulators to
operate in such a sector and mitigate any inherent financial or economic risks (“Bank
of Mauritius” for Banks, the “Financial Services Commission” for all non-banking
institutions and the “Stock Exchange of Mauritius” for all listed entities). This increased
in the aftermath of the global economic turmoil arising from the large corporate and
market failures in the financial services industry. Compliance to rules and regulations
tends to raise public trust and interests in corporates over and above their disclosures
of performance and bottom line results. According to the authors, there have been
various instances characterised by an apparent “disconnect” between what appears
to be and what is actually happening on the ground with regard to corporate

162
governance compliance. This does raise concerns about the actual purpose of
implementing ethical codes and their effectiveness (Padachi et al., 2016). In other
words, are organisations merely implementing such codes of conduct for the purpose
of meeting certain requirements in the compliance checklist, or is it meant to be
deployed and lived by one and all and maintain high ethical standards across-wide?
The answer to such questions warrants the attention of business leaders and
members spearheading compliance to corporate governance projects and ethical
standards.
Recent research conducted by Ah-Kion and Bhowon (2017) in Mauritius surveyed 247
managers working in three higher education institutions on leadership approaches and
their corresponding ethical decision making processes. It was found that
transformational leadership had a negative impact on ethical judgment and intention
of the subordinates in respect of ethical issues such as bribery, nepotism, political
backing and favouritism. This suggested the possibility of pseudo-transformational
leadership or the influences of cultural factors.
According to Napal (2005), bribery was found to be an acceptable cultural practice
amongst Mauritian managers. Similarly, seeking political backing to get a favour or a
job was also seen to be prevailing cultural practice in the country, even though this
would be seen as a corrupt practice in other developed countries and societies. Local
politicians often resort to keeping a day or two in a week to receive the inhabitants of
their respective constituencies with an objective to listen to their issues and help them
in some way. This may be seen as a service to them (people who may have
contributed to finance their elections, voted or be expected to vote for them in the
future). It could also force political leaders to indulge into implicit unethical actions in
a quest to satisfy those who voted or supported them in their election campaigns. The
absence of a framework guiding the financing of political parties in Mauritius has
attracted significant debates amongst political commentators. This is because it is
being revealed as a clear cut influential factor for favouritism, nepotism and similar
sorts of unethical deviances in the country. This issue has also gained significant
prevalence within the business community, as economic players tend to donate funds
(officially or unofficially) to political parties for them to run their election campaigns.
The result of such donations, which may also be perceived as an “unethical

163
investment”, is an implicit expectation of a payback through favours and other types
of economic benefits once their supported political candidate or party is in power. In
some quarters, issues of political vendettas have also been perceived and felt, where
supporters of opposition parties have witnessed antagonising consequences through
covert unethical moves. This has been felt under the different political reigns when
they have been in power.
As it could be deduced, politicians also have to face this ethical dilemma and implicit
pressure to provide support to their supporters (socio-economic players) and voters
(individuals and their family members). This is because of the fear of losing their
financing aids or on- the-ground support to mobilise resources or obtain votes if they
do not meet the demands of their constituencies and financial backers.
As regards corporates, it is often felt amongst the community that there is an undue
pressure for economic gains, characterised by profits for the organisation, dividends
to shareholders and market growth to dominate market practice. Thus, the pressure
to meet the demands of the shareholders, boards or top executives is likely to entail
resorting to unethical practices. According to Ah-Kion and Bhowon (2017), the
patriarchal nature of the Mauritian society forces the vision, goals and targets from the
top down for employees to adopt. There is little or no leeway or authority to discuss
and contest this, even if the goals are unfeasible and questionable. This inability to
hold such discussions or raising such issues is also due to the pressure for the
employees to submit to the bosses or owners due to fear of losing their jobs.
The study by Ah-Kion and Bhowon (2017) also revealed that not only transformational
but also passive and laissez-faire leaderships have negative effects on ethical
judgement and intention. This is more apparent in situations of bribery, nepotism and
political favouritism.
Given growing reported ethical challenges, it is even more essential for the academic
and business communities to invest time and effort in studying the ethical dilemmas
and challenges in the country. They must put an appropriate ethical framework in place
to withstand the current and emerging challenges and building business and personal
resilience to those persistent pressures.

164
2.13 SUMMARY OF THE CHAPTER
2.13.1 Overview
The objective of this chapter was multi fold. It was key to take a broad perspective and
funnel down to key concepts and theories underpinning organisational culture, ethical
climate and ethical leadership. However, it was fundamental to adopt an appropriate
structure, model and strategy and to undertake the literature review in the midst of the
huge theoretical sphere.
The adoption of a suitable framework (macro-meso-micro framework) was central to
placing key macro-meso-micro variables in an appropriate context for the literature
review. This led to the framing of a conceptual research model as was shown in Figure
2.1 on page 38 of the thesis. This model formed the backbone of the comprehensive
literature review process both from a theoretical and empirical perspective thereby
guiding the study of the key constructs of the model.
Furthermore, attention has also been given to the underlying concepts of culture,
national culture, and ethical and leadership theories which contributed to the study of
specific variables defined in the conceptual research model. Several relevant and
valuable research outcomes and relationships have been identified and studied from
a literature review standpoint.
Based on the outcome of the overall literature review, an attempt has been made to
present an extended schematic representation, as shown in the Figure 2.13 on page
165 of the thesis, with the relevant theories, models, and studies supporting the macro-
meso-micro level variables, and how they all fit together from a conceptual
perspective.
This will serve as a stepping stone to progress towards the next wave of the research
work, focussing on the empirical study of the key constructs in the multi-cultural, cross-
industry context of Mauritius with a view to respond to the research questions and
meet the 10 specific aims set out from an empirical perspective.
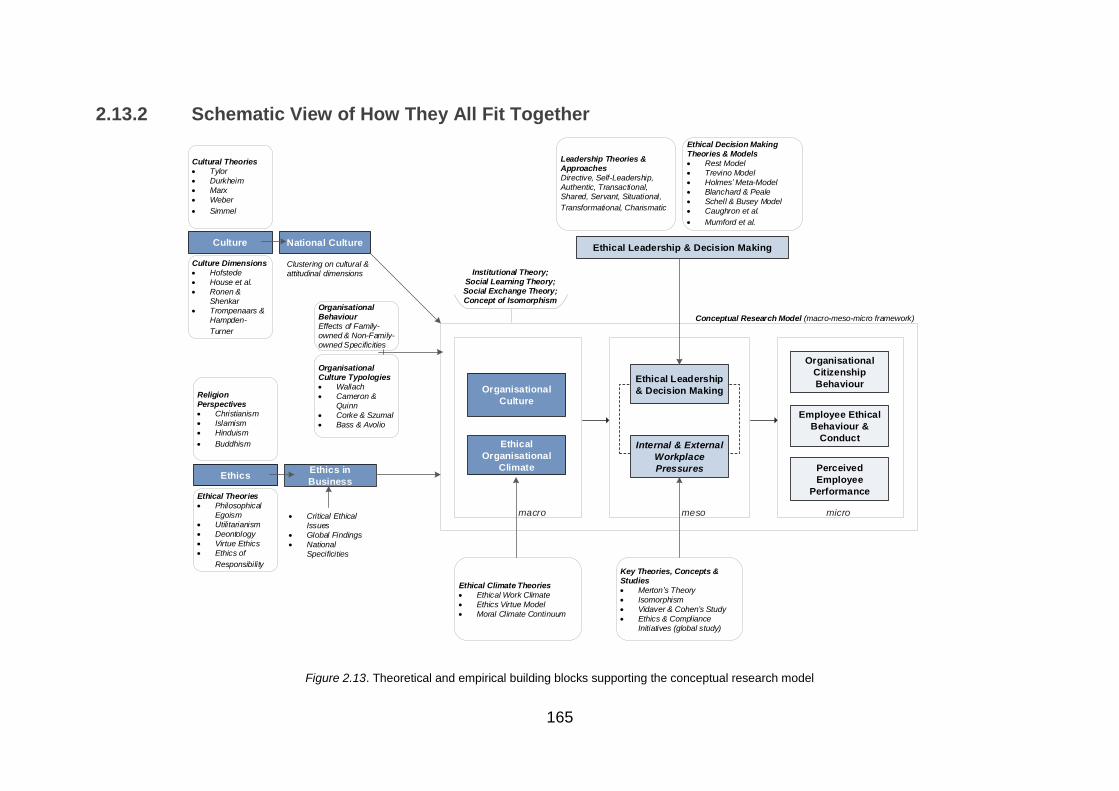
165
2.13.2 Schematic View of How They All Fit Together
Ethical Leadership
& Decision Making
Internal & External
Workplace
Pressures
Ethical
Organisational
Climate Perceived
Employee
Performance
Employee Ethical
Behaviour &
Conduct
Organisational
Citizenship
BehaviourOrganisational
Culture
macro meso micro
Conceptual Research Model (macro-meso-micro framework)
Culture
Clustering on cultural & attitudinal dimensions
National Culture
Culture Dimensions
Hofstede
House et al.
Ronen & Shenkar
Trompenaars & Hampden-
Turner
Cultural Theories
Tylor
Durkheim
Marx
Weber
Simmel
Ethics
Critical Ethical Issues
Global Findings
National Specificities
Ethics in
Business
Ethical Theories
Philosophical Egoism
Utilitarianism
Deontology
Virtue Ethics
Ethics of
Responsibility
Religion Perspectives
Christianism
Islamism
Hinduism
Buddhism
Organisational Culture Typologies
Wallach
Cameron & Quinn
Corke & Szumal
Bass & Avolio
Organisational BehaviourEffects of Family-owned & Non-Family-owned Specificities
Ethical Climate Theories
Ethical Work Climate
Ethics Virtue Model
Moral Climate Continuum
Ethical Leadership & Decision Making
Leadership Theories & ApproachesDirective, Self-Leadership, Authentic, Transactional, Shared, Servant, Situational,
Transformational, Charismatic
Key Theories, Concepts & Studies
Merton s Theory
Isomorphism
Vidaver & Cohen s Study
Ethics & Compliance Initiatives (global study)
Ethical Decision Making Theories & Models
Rest Model
Trevino Model
Holmes Meta-Model
Blanchard & Peale
Schell & Busey Model
Caughron et al.
Mumford et al.
Institutional Theory; Social Learning Theory;Social Exchange Theory;Concept of Isomorphism
Figure 2.13. Theoretical and empirical building blocks supporting the conceptual research model

166
CHAPTER 3: RESEARCH DESIGN & METHODOLOGY
3.1 INTRODUCTION
The comprehensive literature review undertaken in the earlier chapter enabled the
establishment of an overarching schema showing how the key concepts and theories
underpinning the major constructs in the macro-meso-micro framework of the
Conceptual Research Model are related. The established schematic view in Figure
2.13 on page 165 summarises, out of the body of knowledge, the theoretical and
empirical building blocks supporting the Conceptual Research Model as the underlying
foundation of this research work.
This now forms the basis for the present chapter with a view to design the research
and establish the appropriate instruments and scales for the measurements of the
constructs within the macro-meso-micro framework of the Conceptual Research
Model. This chapter sets the base for the empirical study of the key constructs in the
multi-cultural, cross-industry context of Mauritius, whilst ensuring that the research
questions and specific aims are soundly responded to from an empirical perspective.
This chapter also focuses on the process of identifying the relevant instruments and
scales that could be used to measure the set of independent, mediating and
dependent variables in the Conceptual Research Model and selecting the ones that
are most suited and adapted for the context of this study. This chapter will also cover
the research methods, data collection processes and data analysis techniques being
envisaged.

167
3.2 PHILOSOPHICAL FOUNDATIONS
3.2.1 Research Approaches
Every research study stems from a philosophical foundation which guides the
researcher on the approach and path to embrace (Sousa, 2010). Each and every
approach leads to a particular perspective from a research standpoint. Roth and Mehta
(2002) advocated that one can adopt various approaches to study a particular context
or subject matter, where each approach brings its own merits, perspectives and
learning points.
The two areas of philosophy that are related to major research approaches are
ontology and epistemology. “Ontology is an area of philosophy that deals with the
nature of being, or what exists; the area of philosophy that asks what really is and what
fundamental categories of reality are.” (Neuman, 2015, p.94). In other words, it is
about the way the world is thought to be, or the kind of things that exist in the world;
knowing the truth. There are usually two ontological viewpoints, i.e. whether there is a
single reality (a realist position) or there are different realities (a nominalist position).
The realist will see the world as being “out there” for one to research and discover and
assumes that the world exists independently of humans and their understandings.
As regards epistemology, “it is an area of philosophy concerned with the creation of
knowledge; focuses on how we know what we know or what are the most valid ways
to reach truth.” (Neuman, 2015, p.95). It concerns how human beings can acquire
knowledge about the world, i.e. through an empiricist/positivist/objectivist or
interpretivist/constructivist pathway.
According to Fleetwood (2005), researchers often embrace one of the three key meta-
theories namely positivism, post modernism and critical realism. Other scholars and
researchers see positivism, interpretive social science, critical social science,
feminism and post modernism as the main approaches to social research.
Positivism is regarded as the oldest and most commonly applied approach to
research. Over time and amongst researchers, there have been different
versions of positivism. However, a set of principles and logic is common in all
sciences. According to Newman (2015, p.97), positivist social science is

168
defined as “an organised method for combining deductive logic with precise
empirical observations of individual behaviour in order to discover and confirm
a set of probabilistic causal laws that can be used to predict general patterns of
human activity.” In other words, positivists view the world as a closed system
within which the causal relationship and effects could be studied through a
logical, empirical, probabilistic and deductive process. It is based on precise
quantitative data and empirical observations that others can apply.
Interpretive social science stems from the time of Max Weber (1864-1920). It is
defined as “the systematic analysis of socially meaningful action through the
direct detailed observation of people in natural settings in order to arrive at
understandings and interpretations of how people create and maintain their
social worlds.” (Newman, 2015, p.104). In other words, it is a descriptive and
qualitative approach using hermeneutics, ethno-methodological, subjective
experience, symbolic and cognitive aspects so as to understand how the social
system functions and sustains itself. It often takes a practical orientation
whereby the feelings and experiences of others are key to understanding the
subject under study. Interpretivism (or the constructionist’s view that reality is
socially created by humans, their social interactions, reasoning and behaviour)
is a direct alternative to the positivism approach to social research.
Critical social science is another approach stemming from the time of Karl Marx
(1818-1883). It combines nomothetic (the study of general scientific laws) and
ideographic (use of symbols to describe) approaches and criticises positivist
science as being restrictive, antidemocratic and non-humanist (Adorno et al.,
1976). The criticism towards the positivist approach resides in the latter not
dealing with people and their abilities to feel and think and their social context.
This approach favours a critical interaction with the participants so as to learn
from disruptions or disturbances or social life emanating from these
interactions. In other words, it aims to uncover social reality that liberates and
empowers people. On the basis of its merits, the critical social science
approach is seemingly more prevalent amongst political or socio-cultural
groups than with academic researchers.
Feminist research is conducted by women so as to make their voice heard and
to correct male-oriented perspectives. It is often motivated by a feminist self-

169
identity which posits that women learn and express themselves differently from
men (Belenky et al., 1986). According to its advocates, positivism is regarded
as being more male orientated, given its objective, logical and task oriented
facets. Feminist research is sensitive to understanding the interrelationships
between gender and power and how it permeates in the social life (Neuman,
2015, p.118). This approach also integrates the personal feelings, living
experiences and views of the researchers with those whom they are studying
thereby gaining from an empathetic relationship and understanding.
Post modernism sources from humanities and rejects the philosophies of
modernism characterised by logical reasoning, optimism about the future, trust
in technology and science, and judgement. Post modernists see the world as
being socially constructed by humankind, and who are instrumental in the way
it functions. Advocates of post modernism share similar goals of critical
socialism in uncovering reality from the underlying social layers by demystifying
the overlaying perceptions and revealing the hidden structures and realities.
They also favour a descriptive, dramatic and expressive style in presenting
knowledge and insights, whilst relying heavily on intuition, imagination,
personal experience, subjectivity, emotion and pessimism. The advocates of
post modernism also assert that research cannot effectively reflect what occurs
in the social world and that studies undertaken in the past or at other places are
not relevant to the present context.
The research approaches enunciated above provide the diversity that exists in the
research spectrum, and one has to really assess the merits and shortcomings of each
before choosing a research approach. The three key ones namely positivism, and the
interpretive and critical social sciences are all regarded as major approaches to study
social science. As Neuman (2015, p.122) summarises it well; they are all empirical,
systematic, theoretical, self-reflective, explicit, shared, and open-ended processes
despite their respective differences. This is in particular relevant to the present study
as it gives a broad perspective which can guide the selection of the research approach
appropriate for the context of this study.
Over and above the ontological and epistemological stances, there is a need to
determine the right research methods and techniques (“methodology”) to be adopted

170
for the study of the world as well as which causes influence, make and change the
world (“aetiology”) (Ackroyd & Fleetwood, 2000). This will be discussed in Section 4
of this Chapter in the context of the present study.
Ontology stands as the overarching meta-theoretical dimension that has significant
bearing on the research approach and influences epistemology, methodology and
aetiology (Sousa, 2010). Research studies are thus built upon these major
philosophical foundations which in turn guide researchers in embracing the
appropriate methodologies.

171
3.3 RESEARCH QUESTIONS & AIMS
3.3.1 Research Questions
On the basis of the literature review, gaps identified and research goals, the following
research questions are being put forward and reinforced here so that the research
design and methodologies are suitably formulated to test and respond to these
questions:
Research Question 1: How are the ethical context variables (organisational
culture and ethical organisational climate) conceptualised and explained by the
theoretical models in the literature?
Research Question 2: How are the mediating variables (ethical leadership and
decision making, and internal and external workplace pressures) conceptualised
and explained by the theoretical models in the literature?
Research Question 3: What is the nature of the theoretical and observed
interrelationships between the ethical context (organisational culture and ethical
organisational climate as independent variables) and mediating variables (ethical
leadership and decision making, and internal and external workplace pressures),
and their effects on organisational citizenship behaviour, employee ethical
behaviour and conduct, and perceived employee performance?
Research Question 4: Which of the key meso components (ethical leadership and
decision making, and internal and external workplace pressures) and ethical
related actions influence the organisational citizenship behaviour, employee ethical
behaviour and conduct, and perceived employee performance the most?
Research Question 5: Can a scientific theoretical model be constructed or
customised on the relationship between ethical context independent variables
(organisational culture and ethical organisational climate) and mediating variables
(ethical leadership and decision making, and internal and external workplace
pressures) with a view to empowering organisations and practitioners to develop
appropriate strategies and processes to promote positive employee citizenship
behaviour, conduct and performance at large?

172
Research Question 6: What are the key recommendations emanating from the
research findings for stakeholders, in the multi-cultural and cross-industry context
of Mauritius, to institutionalise through a framework or model that would provide
critical ethical levers influencing positive ethical behaviour and performance for the
success of organisations?
3.3.2 Specific Research Aims from an Empirical Study Perspective
The following empirical research aims have been put forward considering the
scope of the study and the multi-cultural and cross-industry environment of
Mauritius:
(a) How do the ethical organisational culture, climate and standards in
Mauritius compare with the global perspective?
(b) What are the key ethical climate types found, their characteristics,
specificities and how they are related to the variables under study?
(c) What are the most common internal and external workplace pressures
faced by organisations which could compromise ethical behaviour and
standards?
(d) Which are the most influential / impactful workplace pressure factors?
(e) What is the statistical relationship between organisational culture and
ethical organisational climate?
(f) What is the statistical relationship between the mediating variables of
ethical leadership and decision making, and internal and external
workplace pressures?
(g) What is the nature of the theoretical and observed interrelationship
between the ethical context (organisational culture and ethical
organisational climate as independent variables) and mediating variables
(ethical leadership and decision making, and internal and external
workplace pressures), and their effects on organisational citizenship
behaviour, employee ethical behaviour and conduct, and perceived
employee performance?
(h) Do the employees’ perceptions and behaviours in relation to
organisational culture, ethical leadership and decision making, internal

173
and external workplace pressures, and organisational citizenship
behaviour remain constant across different groups (age, industry and
socio economic)?
(i) Which of the key meso components (ethical leadership and decision
making, and internal and external workplaces pressures) and ethical
related actions influence the organisational citizenship behaviour,
employee ethical behaviour and conduct and perceived employee
performance the most?
(j) Is there a good fit between the elements of the empirically manifested
structural model and the theoretically hypothesised model?

174
3.4 RESEARCH DESIGN & METHODS
3.4.1 Research Approach
Considering the research aim, nature of this study and research questions being put
forward, a positivist approach under objectivism epistemology was chosen. This
decision was also motivated by the following key elements:
(a) The present research focused on the study of interrelationship as set out in the
conceptual macro-meso-micro framework thereby studying the effects of the
macro level independent variables on the micro ones, through the mediating
variables. The aim was to hold a neutral and objective view to measure the
social aspects of the context being studied. According to Hammersley (2013),
the understanding of the phenomena, in reality, must be measured and
supported by empirical evidence. The positivist approach was thus ideally
suited to confirm the interrelationship and effects through instrumental
orientation and empirical tests.
(b) The insights gained through a positivist approach provided a higher quality of
standard of validity and reliability (Cohen et al., 2011). This, in turn, built the
case for the learning points or findings to be generalised for a larger population.
(c) Positivism has gained wide acceptance in the community of researchers across
the world post World War II, as the United States became the leading
powerhouse. This led to the development of objectivism, with researchers
adopting more rigorous approaches to measure behavioural aspects through
quantitative methods (Newman, 2015). In an attempt to embrace a rigorous
approach to assessing the complexity of the variables under study, their
interrelationships and effects, the adoption of quantitative methods is being
favoured to support the underlying study.

175
3.4.2 Research Method & Strategy
For the purpose of the present study and considering the underlying constructs to be
measured in a complex multi-cultural cross-industry context, quantitative methods
were used. The goal was to use a set of appropriate techniques to precisely collect
and measure empirical data from the ground for analysis and forming evidence-based
views on the study.
This adopted approach also enabled the conceptual research model to be clearly
thought out and consideration given as to how its variables could be measured through
a reliable process and instrument.
A survey strategy was adopted and deployed with a view to collect relevant
quantitative data from a devised sample of participants from Mauritian corporates
operating in several industry sectors.
At the centre of this research work was the need for an effective measuring instrument
and scales. It was fundamental to undertake a process to identify and select
appropriate instrument(s) as it was very unlikely that a single instrument would suffice
on its own, given the scope and complex inter-relationship within the proposed model.
The goal was to also provide a valid and reliable assessment of the effects of the
independent variables (organisational culture and ethical organisational climate) on
the dependent variables (organisational citizenship behaviour, employee ethical
behaviour and conduct, and perceived employee performance) through the meso
components (ethical leadership and decision making, and workplace pressures).
For the purpose of this present study, a comprehensive and integrated questionnaire
was constructed, based on underlying well-established instruments that have proven
their reliabilities on the global front, to measure the variables being studied. The
objective was to adapt such instruments so as to make the questionnaire valid and
reliable to cover the complete scope of the study, and ensure compatibility between
the instruments and the aims, model and constructs of the underlying study in the
given context.
An evaluation of such instruments was undertaken (re. Figure 3.1 on page 177) and
the relevant items that most suited the objective of this study were used, the process
176
of which is explained in the following section of this chapter. Relevant critics have also
been considered accordingly as shown in Figure 3.3 on page 180 of the thesis.
3.4.3 The Process for Establishing Instruments for Measurement
Given the multi-faceted and complex nature of this research work and with a view to
gain appropriate levels of validity and reliability, it was key to embrace a process of
identifying, assessing, reviewing and establishing the right instruments that helped to
respond to the research questions and empirical aims set out above.
3.4.3.1 Identification & Review Process of Potential Instruments/Scales
A literature review process was undertaken so as to identify relevant instruments that
were used in earlier research across the globe. This was done for every construct in
the Conceptual Research Model. In total, 41 instruments were identified which were
relevant for consideration and assessment as depicted in Figure 3.1 on page 177 of
the thesis.
There was a larger number of relevant instruments available for measurement of
certain key constructs such as Organisation Culture, Ethical Organisational Climate
and Ethical Leadership & Decision Making. There were, however, fewer well-
established instruments to measure the other variables such as Internal & External
Work pressures and Organisational Citizenship Behaviour.
The reviews of the identified instruments by scholars and researchers were also
considered for the purpose of selecting the most appropriate instruments (Walker,
Symon and Davies, 1996; Scott et al., 2003; Bös, Bernhard, Dauber & Springnagel,
2011; Human Synergetics International, 2017; Valas & Raghunathan, 2018; Klontz et
al., 2011;Bowra et al., 2012; Arnaud, 2006).
A schematic representation of these instruments mapped on the respective constructs,
across the macro-meso-micro framework, has been provided Figure 3.1 on page 177:

177
Figure 3.1. Identification of instruments/scales by key constructs of the conceptual research model.
(CAMERON & QUINN, 2006); (GLASER ET AL., 1987); (SASHKIN & ROSENBACH, 2013); (G. HOFSTEDE ET AL., 1990);
(VICTOR & CULLEN, 1988B); (FORSYTH, 1980); (NEUMANN & REICHEL, 1987); (HUNT ET AL., 1989); (M. KAPTEIN, 2008A); (SINGHAPAKDI ET AL., 1996);
(J. B. AVOLIO ET AL., 2007); (KARIANNE KALSHOVEN ET AL., 2011); (THE INSTITUTE FOR ETHICAL LEADERSHIP, 2007); (CRAIG & CUSTAFSON, 1998); (BARBUTO & WHEELER, 2006);
(MAESSCHALCK, 2004; JAMES R. REST ET AL., 1999); (REIDENBACH & ROBIN, 1988); (J. WEBER & MCGIVERN, 2010); (MAY & PAULI, 2002)
(CORLEY ET AL., 2001); (ULRICH ET AL., 2007); (BAYLOR UNIVERSITY, N.D.); (LEITER & MASLACH, 2003); (INSTITUTE OF BUSINESS ETHICS, 2015); (LASAKOVA & REMISOVA, 2017)
(P. M. PODSAKOFF ET AL., 1997); (C. A. SMITH ET AL., 1983);(LAMBERT & HOGAN, 2013); (MENEZES ET AL., 2016); (SHARMA & JAIN, 2014); (FRITZSCHE & BECKER, 1983); (GAUTSCHI & JONES,
1998); (HANNAH & AVOLIO, 2010);(LYSONSKI & GAIDIS, 1991); (KIRKCALDY & FURNHAM, 1993); (MAESSCHALCK, 2004); (TESSEMA & SOETERS, 2006); (PESTONJEE & SINGH, 1978); (DELANEY
& HUSELID, 1996); (PE KONSULT, 2016)
(JOHN B CULLEN ET AL., 1993; K. KALSHOVEN ET AL., 2011; KARIANNE KALSHOVEN ET AL., 2011; M. KAPTEIN, 2008A; MARTINS & VON, 2003; SASHKIN & ROSENBACH, 2013; YUKL ET AL.,
2013); RESULTS_THROUGH_PEOPLE. (2012)
Figure 3: Potential Relevant InstrumentsFor Measurement of Independent & Dependent Variables
1. Organisational Citizenship
Behaviour Scales
(Podsakoff et al., 1990)
(Smith, Organ & Near, 1983)
(Lamber & Hogan, 2013)
2. Behavioural Intentions Scale of
Organisational Citizenship
(Menezes et al., 2016)
3. Scale for Measuring Organisational
Citizenship Behaviour
(Sharma & Jain, 2014)
1. Corporate Culture Questionnaire
(Walker, Simon & Davies, 1996)
2. Organisational Culture Inventory
(Cooke & Lafferty, 1987)
3. Survey of Organisational Culture
(Tucker, McCoy & Evans, 1990)
4. Questionnaire Harrison & Handy
(Harrison & Handy, 2010)
5. Organisational Culture
Assessment Instrument
(Cameron & Quinn, 2006)
6. Organisational Culture Survey
(Glaser, Zamanou & Hacker, 1987)
7. Organisational Culture
Assessment Questionnaire
(Sashkin & Rosenbach, 2013)
8. Hofstede s Organisational Culture
Questionnaire
Hofstede et al.,1990)
macro
Ethical Organisational Climate
Organisational Culture
1. Ethical Climate Questionnaire
(Victor & Cullen, 1988)
2. Ethical Position Questionnaire
(Forsyth, 1980)
3. Attitude Towards Business Ethics
Questionnaire
(Newmann & Reichel,1987)
4. Corporate Ethical Value Scale
(Hunt et al., 1989)
5. Corporate Ethical Virtues
Questionnaire
(Kaptein, 2008)
6.Perceived Role of Ethics & Social
Responsibility Scale
(Singhapakdi et al., 1996)
1. Authentic Leadership
Questionnaire
(Avolio, Gardner & Walumbwa, 2011)
2. Ethical Leadership Scales
(Institute of Ethical Leadership, 2007)
3. Perceived Leader Integrity Scale
(Graig & Gustafson, 1998)
4. Ethical Leadership at Work
Questionnaire
(Kalshoven,De Hoogh & Hartog, 2011)
5. Servant Leadership Questionnaire
(Barbuto & Wheeler, 2006)
6. The Defining Issues Test (DIT &
DIT-2)
(Rest, 1986; 1990;1999)
7. Multidimensional Ethics Scale
(Reidenbach & Robin, 1990)
8. Moral Reasoning Inventory
(Weber & McGivern, 2010).
9. Moral Intensity in Ethical Decision
Making
(May & Pauli, 2002)
Ethical Leadership & Decision
Making
meso
1. Moral Distress Scale
(Corley et al., 2001)
2. Ethics Related Stress
(Ulrich et al., 2007)
3. Workplace Ethics Questionnaire
(Baylor University, n.d)
4. Areas of Worklife Survey
(Leiten & Maslach, 2003)
5. Ethics at Work Survey
(Institute of Business Ethics, 2015)
6. Factors Eliciting Managerial
Unethical Decision Making
(Lasakova and Remisova, 2017)
Internal & External Workplace
Pressures
Organisational Citizenship Behaviour
micro
1.Ethical Attitudes Survey
(Fritzsche & Becker, 1983)
(Gautschi & Jones, 1998)
2. Moral Potency Questionnaire
(Hannah & Avolio, 2010)
3. Ethical Dilemma Vignettes
(Lysonski & Gaidis, 1991)
4. Money Belief & Behaviour Scale
(Kirkcaldy & Furnham, 1993)
5. Scale for Measurement of
Questionable Behaviour
(Maesschalck, 2004)
Employee Ethical Behaviour &
Conduct
1.Scale for Measurement of
Perceived Employee Performance
(Teseema & Soeters, 2006)
2. Performance Rating Scale
(Pestonjee & Singh, 1978)
3. Perceived Organisational
Performance Scale
(Delaney & Heselid, 1996)
4. Perceived Performance Scale
(PE Konsult, 2016)
Perceived Employee Performance

178
3.4.3.2 Selection Process for Potential Instruments/Scales
The review and assessment processes reduced the 41 identified instruments, to
measure the macro-meso-micro variables of the Conceptual Research Model, to eight
instruments. These were deemed to be most relevant and appropriate, considering
the research aims, research questions, and nature and context of this research work
and the respective merits of the chosen instruments. The chosen ones, mapped within
the Conceptual Research Model against their corresponding macro-meso-micro
constructs, are shown in Figure 3.2 on page 179 of the thesis:

179
Figure 3.2. Selected instruments/scales by key constructs of the conceptual research model.
Ethical Leadership
& Decision Making
Internal & External
Workplace
Pressures
Ethical
Organisational
Climate Perceived
Employee
Performance
Employee Ethical
Behaviour &
Conduct
Organisational
Citizenship
BehaviourOrganisational
Culture
macro meso micro
Conceptual Research Model (macro-meso-micro framework)
Instrument: Organisational Culture Assessment Questionnaire (Sashkin & Rosenbach, 2013)
Instrument: Ethical Climate Questionnaire (Victor & Cullen, 1988)
Instrument: Adapted from Factors Eliciting Managerial Unethical Decision Making (Lasakova and Remisova, 2017)
Instrument: Ethical Leadership at Work (Kalshoven, De Hoogh & Hartog, 2011)
Instrument: Organisational Citizenship Behaviour Scale(Podsakoff, MacKenzie, Moorman & Fetter, 1990)
Instrument: Adapted Perceived Organisational Performance (Delaney & Heselid, 1996)
Instrument: Adapted from Scale for Measurement of Questionable Behaviour (Maesschalck, 2004)
Instrument: Adapted from 2018 Global Business Ethics Survey(Ethics & Compliance Initiative, 2018)

180
The basis for the selection of these instruments/scales is provided below:
Figure 3.3. Respective instruments’ details, rationale for selection and critics.
No. Layer ConstructChosen
Instrument/Scale
No.of
ItemsKey Dimensions Measured Rationale for Selection Critics
1 MacroOrganisational
Culture
Organisational Culture
Assessment
Questionnaire (Sashkin
& Rosenbach, 2013)
30
(1) Managing Change;
(2) Achieving Goals;
(3) Coordinating Teamwork;
(4) Customer Orientation;
(5) Culture Strength
Organisational Culture Assessment Questionnaire
(OCAQ) provides baseline information that highlights
the discrepancies between the way things are and
the way they should be.
It has been used by scholars and institutional
consultants in various types of corporations (Sashkin,
Rosenbach, Mueller, 1994; Endeman (1993));
Giese (1995)'s study showed a reliability coeffecient
of 0.89 with an amended version of the OCAQ.
Issues relating to the
instrument's language were
noted. Most instruments were
developed for and geared
towards business organisations
and would not apply in the
context of other instittions such
as educational and voluntary
(Uzzo, 2002)
2 Macro
Ethical
Organisational
Climate
Ethical Climate
Questionnaire (Victor &
Cullen, 1988)
36
(1) Self Interest;
(2) Company Profit;
(3) Efficiency;
(4) Friendship;
(5) Team Interest;
(6) Social Responsibility;
(7) Personal Morality;
(8) Rules, Standards, Operating
Procedures;
(9) Laws, Professional Codes
According to Arnaud (2006), 73% of Ethical Work
Climate published till that date used Ethical Climate
Questionnaire (ECQ).
ECQ appears to be most favoured method of
measuring ethical climate (Lemmergaard &
Lauridsen, 2008).
With the later version of ECQ (1993), the tests
proved that it has strong validity and reliability
(Newman et al. 2017)
Critique relating to the definition
underpinning ECQ was
highlighted (Mayer et al., 2009;
Grobler, 2015)
Issues such as inconsistent
factor structure was reported
(Arnaud, 2006).
3 Meso
Ethical
Leadership
and Decision
Making
Ethical Leadership at
Work (Kalshoven, De
Hoogh & Hartog, 2011)
38
(1) People Orientation;
(2) Fairness;
(3) Power Sharing;
(4) Concern for Sustainability;
(5) Ethical Guidance;
(6) Role Clarification;
(7) Integrity
Ethical Leadership at Work ("ELW") scales provide
good variability and high degree of reliabilities. The
seven factor structure was stable across
independent field samples, with good internal
consistencies and supporting construct validity,
thereby making ELW a meaningful measure for
ethical leadership (Kalshoven et al., 2011).
The multidimensionality of ELW bring along both
empirical and theoritical merits.
Concerns for sustainability have
been noted.
ELW has a mixture of positively
and negatively words where the
negative ones could load on a
factor (Ibrahim, 2001).
4 Meso
Internal &
External
Workplace
Pressure
Adapted from Factors
Eliciting Managerial
Unethical Decision
Making (Lasakova and
Remisova, 2017)
A set of items was added
for the measurement of
the context variable
9
19
(1) Prioritisation of Economic
Results;
(2) Violation of Internal Ethical
Guidelines;
(3) Situational Tensions
Measure of Workplace Pressure:
(a) Source;
(b) Types/Nature;
(c) Underlying Motivators
The scales used by Lasakova and Remisova 92017)
were based on theoritical insights emerging from
numerous works on unethical decision making and
behaviour prevailing in organisation.
The added items broaden the perspective to measure
the context variables more deeply.
Given limited number of items to
fully assess the scope of the
present study, additional items
are being introduced to broaden
the measurement of internal and
external workplace pressures
5 Micro
Organisational
Citizenship
Behaviour
Organisational
Citizenship Behaviour
Scales (Podsakoff,
MacKenzie, Moorman &
Fetter, 1990)
24
(1) Altruism;
(2) Conscientiousness;
(3) Sportsmanship;
(4) Courtesy;
(5) Civic Virtue
High internal consistency indices of 0.81 and 0.85
were reported for Organisational Citizenship
Behaviour Scales (OCBQ) (Organ et al., 2006)
Commonly use scale for measurement of OCB.
6 Micro
Employee
Ethical
Behaviour &
Conduct
Adapted from
Maesschalck (2004)
Global Business Ethics
Survey (EIC, 2018)
31
15
(1) Self Interest;
(2) Organisational Interest;
(3) Efficiency;
(4) Friendship;
(5) Team Interest;
(6) Stakeholder Orientation
(7) Personal Morality;
(8) Rules & Law;
(9) Public Interest
All scales' reliabiility was acceptable with most being
above 0.70;
Study with common constructs, useful for
comparative analysis.
The added items broaden the perspective to measure
the context variables more deeply and enable
comparison with global trends (EIC, 2018).
Specific items were added to
better cover the context variables
and scope
7 Micro
Perceived
Employee
Performance
Adapted from Perceived
Organisational
Performance (Delaney &
Huselid, 1996)
A set of items was added
for measurement of
context variable.
7
10
(1) Product, Service, Culture,
Program
(2) Customer Acquisition &
Retention
(3) Talent Acquisition & Retention
(4) Management-Employee
Relationship
(5) Internal Cohesion &
Relationships
Influence of:
(a) Organisation Culture
(b) Ethical Work Climate
(c) Workplace Pressure
(d) Role of Leaders, Managers
(e) Role of Colleagues
(f) Ethics Programs
(g) Market Climate & Performance
The scale of Delaney & Huselid has been widely used
in many researches given its established merits
(Shea et al., 2012)
High cronbach alpha of 0.85
The added items broaden the perspective to measure
the context variables more deeply whilst addressing
any identified limitations of the chosen instrument.
Results of a first time substantial
investigation of psychometric
properties, through us of Rasch
model analysis, indicated that the
original 2-factor structure was
not supported but rather a 3-
factor with good psychometric
properties covering internal,
external and market performance
(Shea et al., 2012);
To bridge identified gap in
respect of the scope and
purpose, additional questions
were introduced to support the
measurement.

181
3.4.4 The Survey Instrument
The chosen instruments and scales were adapted to the context of this research work
without losing their intrinsic reliabilities and validities they brought to the research work.
The master instrument was structured as follows:
Section A: A set of generic items to obtain the respondent’s basic profile and
demographics
Section B: A set of generic items to gather first level of pulse on Ethics &
Compliance at the workplace adapted from:
2018 Global Business Ethics Survey (Ethics & Compliance Initiative, 2018)
Section C: A detailed set of items to measure the respective constructs within
the Conceptual Research Model originating from:
Organisational Culture Assessment Questionnaire (Sashkin & Rosenbach,
2013)
Ethical Climate Questionnaire (Victor & Cullen, 1988)
Ethical Leadership at Work (Kalshoven, De Hoogh & Hartog, 2011)
Adapted from Factors Eliciting Managerial Unethical Decision Making
(Lasakova & Remisova, 2017)
Organisational Citizenship Behaviour Scale (Podsakoff, MacKenzie, Moorman
& Fetter, 1990)
Adapted from Scale for Measurement of Questionable Behaviour
(Maesschalck, 2004)
Adapted from 2018 Global Business Ethics Survey (Ethics & Compliance
Initiative, 2018)
Adapted Perceived Organisational Performance (Delaney & Heselid, 1996)
The master instrument was laid out in such a way that the questions flowed logically
from the generic to the more specific, from least sensitive to the most, and from the
factual and behaviour to the cognitive..
The instrument measured the macro-meso-micro constructs within the Conceptual
Research Model through a total of 232 items using 5-point Likert-type Scale Response
Anchors for most of the constructs being measured (Vagias, 2006).
Likert scales were first introduced in 1932 in an attempt to simplify the complexity of
the Thurstone scaling technique (Edmondson, 2005, p.127). Likert developed his

182
scale with a view to collect a finite number of attitudes in an ordinal scale format (Likert,
1932). The Likert Scale is today considered as the most universal method for survey
collections given ease of coding, understanding, quantification and computation
(Rinker, 2014). It provides the researchers and respondents with the opportunity to
measure attitudes with a degree of flexibility and agreement rather than being forced
to take a particular stand. The use of Likert-type Scale Response Anchors as
presented by Vagias (2006) enabled measurements in a continuum (e.g. level of
agreement and knowledge of action) whilst accommodating neutral feelings as well.
According to Nunnally and Bernstein (1994) and Munshi (2014), a 7-point Likert type
scale provides a relatively better precision when compared with the 5-point equal
interval scale. However, the choice was to opt for a 5-point Likert-type scale for this
instrument as:
(a) The degree of differences in precision between a 5-point and a 7-point Likert
scale is not by much (Sauro, 2010).
(b) The underlying constituting instruments to measure specific macro, meso and
micro constructs such as ECQ for Ethical Organisational Climate, ELW for
Ethical Leadership and Decision Making, Perceived Organisational
Performance Scale for Perceived Employee Performance, respectively, were
based on a 5-point Likert scale and its application was favoured to keep
consistency. This also helped to compare results with previous research
findings which had used such scales.
Some additional items were purposely added to support the measurement of certain
items in the constructs such as Internal & External Workplace Pressure and Perceived
Employee Performance so as to be able to better respond to the empirical aims set
out for this study.
The 232-items instrument also enabled measurement of several sub-dimensions of
the underlying constructs with a finer degree of precision and better understanding of
the dynamics of interrelationships and effects.

183
3.4.4.1 Reliability
The quest of any researcher is to obtain reassurances of reliability and validity as they
are the central concerns associated with any instrument. According to Neuman (2015,
p.212), “reliability means dependability or consistency” where the same results recur
when applied to a similar condition. In other words, it is about assessing whether the
instrument yields the same outcomes over multiple trials. In quantitative research, one
will come across three main types of reliability (Neuman, 2015):
Stability reliability, whereby the assessment is to find whether the measure
delivers the same result across time;
Representative reliability, whereby the assessment confirms whether the same
outcome is reproduced when applied to different groups of people;
Equivalence reliability, whereby the researcher measures a particular
construct with various specific measures to assess whether consistent results
or patterns are observed.
As part of the reliability assessment process of the questionnaire, internal consistency
reliability test was done using Cronbach’s alpha coefficient. Though other internal
reliability measuring techniques exist, Cronbach’s alpha was chosen given it has
proven reliability and widespread acceptance amongst researchers. The goal was to
determine the degree to which the items of a particular scale were related to one
another, such that the same construct could be measured consistently, given that
certain scales were adapted, and items added. In the particular construct cases where
well established instruments were being used, it was unlikely to witness any internal
consistency reliability issues. Nevertheless, Cronbach alpha coefficients were
calculated and reported accordingly.
3.4.4.2 Validity
Another critical aspect in the development of the instruments was to ensure validity.
This is about assessing an instrument’s ability to measure what it was designed to
measure. Neuman (2015, p.215) indicates that “measurement validity indicates how
well an empirical indicator and the conceptual definition of the construct that the
indicator is supposed to measure ‘fit’ together”. According to Borsboom and

184
Mellenbergh (2004), “a test is valid for measuring an attribute if variation in the attribute
causes variation in the test scores”.
Validity theory highlights numerous types of measurement validity, the key common
ones being:
Content validity measures the extent to which the items in the scale are
accurately measuring the information that is being evaluated;
Construct validity is about assessing whether the scale measure the underlying
construct accurately. It is about determining “how well the multiple indicators
of one particular construct converge, or how well the indicators of different
constructs diverge” (Neuman, 2015, p.217). It uses statistical techniques such
as correlation as well as expert reviews to verify the relevance of the questions.
If the scores are highly correlated, then convergent validity is supported.
Criterion validity, whereby some criteria are used to indicate a construct
accurately. It is used to measure the ability of an instrument to predict future
outcomes (predictive validity). It is also about comparing two instruments’
ability to predict similar outcome with a single variable being measured
(concurrent validity).
Prior to undertaking the full scale survey in the context of this present research work,
a pilot exercise was undertaken so as to identify any room for improving the reliability
of the measures. This included obtaining honest feedback on the ease of
understanding the questions and on the questionnaire design. Furthermore, the pilot
exercise also served to assess the content validity of the questionnaire through a
group of independent experts prior to finalisation of the instrument for survey roll out.
Such measures enhanced the likelihood of an effective, reliable and valid outcome
upon execution of the survey exercise.
3.4.5 Population and Sample
3.4.5.1 Population
The aim was to study “large” establishments in the multi-cultural and cross-industry
environment of Mauritius. The latest available 2013 census conducted by Statistics
Mauritius (the official government statistics body) covered 127,000 establishments,

185
referred to as “production units”. Of these, 2,200 (2%) were classified as “large”
establishments engaging at least 10 persons across various industries and were -
considered as the largest contributors to economic development of the country
(Statistics Mauritius, 2017b). The remaining were small and itinerants engaging less
than 10 persons. The latter, classified as “small” establishments, are relatively
unstructured and in the majority of cases are sole traders or smaller units of activities.
This made the “large” establishments a better population for the research of the kind
being envisaged through the present study.
The 2013 census did not provide a complete view as it did not cover “large”
establishments in certain specific industries such as agricultural, forestry, fishing and
others. It was therefore supplemented by another government survey lastly
undertaken in 2016, which provided a complete and more appropriate view of the
population of ‘large’ establishments, reaching 2,534 units, as shown below in Table
3.1 (Statistics Mauritius, 2017a):
Table 3.1
Large Establishments by Industry Group (Digest of Labour Statistics 2016)
No. Industry group No. of Production Units
1 Agriculture, forestry and fishing 110
2 Mining and quarrying 23
3 Manufacturing 585
4 Electricity, gas, steam and air conditioning supply 7
5 Water supply, sewerage, waste management and remediation activities 10
6 Construction 111
7 Wholesale and retail trade; repair of motor vehicles and motorcycle 457
8 Transportation and storage 90
9 Accommodation and food service activities 196
10 Information and communication 92
11 Financial and insurance activities 145
12 Real estate activities 33
13 Professional, scientific and technical activities 178
14 Administrative and support service activities 118
15 Public Administration and defence; compulsory social security 40
16 Education 176
17 Human health and social work activities 58
18 Arts, entertainment and recreation 74
19 Other Services 31
TOTAL 2,534
186
3.4.5.2 Delimitations
Given the relative unstructured nature of the “small” establishments or producing units
(e.g. sole traders, one-man companies or smaller units of activities), they did not form
part of the scope of this study. Furthermore their relative very small sizes with limited
or no structure and systems made them inappropriate for consideration in the scope
of this study, where constructs such as organisational culture, ethical climate, ethical
leadership and decision making, workplace pressure and organisational citizenship
behaviour, etc. were measured.
3.4.5.3 Sampling
The role of sampling was instrumental in the process of research of the current nature
whereby a generalised view had to be obtained about the population of some 2,500
cross-industry organisations. To obtain an effective and sound judgement, it was of
utmost importance, for the purpose of the empirical study, to create a representative
sample which closely reflected the characteristics of the larger population. Precise
sampling procedures, relying on mathematical fundamentals, were required to
ascertain that the outcomes from the sampling units could be generalised for the entire
population (Freedman, 2005; Tabachnick & Fidell, 1996)
Researchers generally have to choose between probability and non-probability
sampling methods. Whilst the former enables the researcher to make probability-
based confidence estimates of diverse parameters, the same cannot be effected with
a non-probability sample (Cooper & Schindler, 2014). According to Neuman (2015),
probability sample is often preferred and considered as the “gold standard” for
representative samples. A well devised and executed probability sample “may cost
1/1000 the cost and time of gathering information on the entire population, yet it will
yield virtually identical results” (Neuman, 2015, p.247).
In their seminal work on research design, Campbell and Stanley (1966) were of the
opinion that researchers must randomise whenever possible. For the context of this
study, a probability sampling design was therefore favoured. Amongst the various
complex probability sampling techniques of Systematic, Stratified, Cluster & Double
sampling, the choice was Stratified and Cluster sampling. This choice largely
depended on the homogeneous or heterogeneous nature of the groups being studied.

187
The Table 3.2 below indicates the sample size determined for the survey based on set
parameters for the target population, margin of error and confidence level.
Table 3.2.
Target Population & Sampling
Target Population Based on ‘Large’ Establishments across industries in Mauritius (re. Table 3.1)
2,534
Sample Size Based on Target Population, Margin of Error of 5% & Confidence Level of 99%
526
3.4.6 Data Collection
Prior undertaking the survey, a pilot study was conducted to specifically test the
instrument amongst a small group of respondents from the sample with a view to
identify any challenges they face in providing reliable responses. On the basis of the
outcomes of the pilot study, few changes were brought in simplifying certain
terminologies and the flow of questions. The refined instrument was then used for the
purpose of conducting the full scale survey with the participants forming part of the
established sample.
The instrument was administered electronically through digital tablets using the
Computer Aided Personal Interview (CAPI) tool.
To ensure the target group was reached and the execution of the surveys was
conducted, the services of a professional data collection firm were procured. The
services of Kantar was retained for the data collection purposes only. Kantar is a
globally recognised firm operating in over 100 countries to conduct quantitative and
qualitative studies across the world with a track record of having conducted over 80
million interviews globally and working with 65% of the Fortune 500 companies (Kantar
Group & Affiliates, 2019; Kantar TNS, 2019). The data collection services of Kantar
(Mauritius office) was hired independently by the researcher and at his own costs. A
rigorous approach that meets the research methodological, ethical and legal
requirements and standards was agreed for adoption to guide the data collection
project. The scope of services primarily covers the following:

188
(a) Reaching the target participants in the respective industries through the firm’s
data collection processes and capabilities. It was planned that the data
collection firm would use its network and carry out on-the-field contacts with the
working population in various cities, villages and council areas as per
established survey methodologies with a view to reach the potential
participants. Upon presentation of the objective of the study, survey and terms,
a preliminary qualifying process of the approached participants, and receipt of
their consent to participate, the questionnaire was filled in electronically.
(b) Data collection and compilation in an electronic format;
(c) Data validation and quality control to ensure completeness and reliability of
data; and
(d) Reporting of any issues faced during the process.
In the context being studied, this process was more likely to achieve a higher response
rate, greater degree of independence in the way the survey was conducted as well as
a benefit from a shorter cycle time for data collection given the breadth of the data
collection capabilities, channels and strategies of the firm. Any issues and challenges
faced during this process were also flagged so as to ascertain the extent to which the
data collection process and responses can be relied upon.
3.4.7 Quality Control
A diligent quality control mechanism was implemented by Kantar to ensure reliability
of the survey process and the collected data by the interviewers. It was planned that,
post receipt of the survey responses, a separate independent team of quality
controllers would call checks to the participants with the following questions for cross-
validation:
Name of the respondent (identity will be kept confidentially at the level of Kantar
as per its survey control system)
Whether the respondent participated in the survey and provided their consent
Place where survey was conducted
Duration of the survey
Occupation of the respondent

189
Sector of activity
Number of employees in the organisation where the respondent work
Age group
The responses from the call checks were compared with the responses collected by
the interviewers through CAPI so as to determine the accuracy and reliability of the
collected data. According to the quality control mechanism put in place, for the data to
be qualified as reliable for analysis purposes, 70% of the total questionnaires done per
interviewer should pass the quality control checks. As per the quality control standards
set out, all the questionnaires of an interviewer were rejected when not passing 70%
of the quality control checks.
3.4.8 Statistical Analysis
The following statistical methods were used for data analysis of the surveyed data with
a view to assess the dynamics of interrelationships and effects within the Conceptual
Research Model and respond to the research questions and empirical aims set out for
this study. These were supplemented by relevant methods for further analysis as was
required once the data was prepared.
3.4.8.1 Descriptive Statistics
The main objective of this method was to use a descriptive approach to analyse and
represent the data through the use of frequency distributions and graphical charts such
as histograms, bar charts and pie charts. The measures of central tendency (mode,
median, mean) were used to summarise the information about one particular variable
into a single number (Neuman, 2015). Descriptive statistical methods depicted the
centre, spread and shape of distributions (Cooper & Schindler, 2014).
For the context of the present study, this method was used to describe, :
(a) An analysis of observed ethical misconduct;
(b) An analysis of the nature of pressures to compromise ethical standards in the
workplace thereby highlighting the most common pressures faced by
organisations;

190
(c) An analytical evaluation of the measures or strategies applied to reduce ethical
deviances;
(d) The extent to which the ethical organisational culture and standards in
Mauritius compared with the global perspective;
(e) Types of key ethical climates found, their characteristics and specificities and
how are they were related to the variables under study based on the outcomes
of the correlation and regression tests undertaken.
3.4.8.2 Correlation Statistics
Correlation is a statistical technique that can demonstrate whether pairs of variables
are related and if so, how strong the relationship is. In other words, it expresses the
degree of association of two variables. Correlational studies are also known as ex post
facto studies, literally meaning from after the fact (Simon & Goes, 2013).
Correlation measures the linear relationship between two variables with the coefficient
indicating the strength of the relationship. Coefficient values range from -1 to 1). A
positive correlation coefficient indicates a positive linear relationship between the
variables such that as one variable increases in value, so does the other. A negative
correlation coefficient indicates if one variable increases in value, the other
decreases. A complete absence of correlation is represented by 0. It is also important
to highlight that correlation does not imply causation, hence the need to supplement
the study with regression analysis if effects need to be ascertained between variables
(Gogtay & Thatte, 2017).
This current study focused on assessing the relationships amongst the various macro-
meso-micro variables within the Conceptual Research Model such that relationships
between two or more variables could be studied. For instance, there was a need to
determine:
(a) The statistical relationship between organisational culture and ethical
organisational climate;
(b) The statistical relationship between ethical leadership and decision making,
and internal & external workplace pressures;
(c) The nature of the theoretical and observed interrelationships between
organisational culture and ethical organisational climate (macro level

191
independent variables) and ethical leadership & decision making and internal
& external workplace pressures (meso level, mediating variables)
(d) The nature of relationship of the above with the micro dependent variables of
organisational citizenship behaviour, employee ethical behaviour and conduct,
and perceived employee performance.
3.4.8.3 Regression Analysis
Regression is another very important technique used in research work to study the
effects of one variable onto another. In other words, it is used to investigate the effect
of one or more independent or predictor variables on a dependent or outcome variable.
It allows the researcher to make statements or conclusions on the relationships and
effects between the independent variable(s) and the dependent variable(s).
Regression analysis can provide further insights into the influence of one variable over
the another variable, beyond what correlation analysis can provide (Cooper &
Schindler, 2014).
In the event the researcher aims to assess in how a particular variable (X, dependent)
might vary as function of another variable (Y, independent), then this kind of
relationship is referred to as simple regression. However, it is common to come across
situations where there is a need to assess the effects of several independent variables
on an observed or dependent variable. In such cases multiple regression analysis can
be performed (Campbell & Stanley, 1966, Tabachnick & Fidell, 1996)
In the context of the present study, there is a need to:
(a) Determine the effects of the macro and meso level variables on organisational
citizenship behaviour, employee ethical behaviour & conduct, and perceived
employee performance (being the three micro level dependent variables);
(b) Determine which of the key meso components (i.e. ethical leadership &
decision making, and internal & external workplace pressures) influences the
three micro level dependent variables;
(c) Identify the most influential and impactful workplace pressure factors;
(d) Determine which ethical related actions influence the dependent variables the
most;
192
(e) Determine which critical ethical levers influence positive ethical outcomes such
that a framework or model could be adapted and institutionalised for the
context being studied;
(f) Evaluate how ethical climates influence employees’ behaviour directed
towards “unethical pro-organisational behaviour” so as to address the gap in
literature as highlighted by Newman et al. (2017). In other words, an attempt
to integrate theory to explain how ethical climates shape work outcomes and
when ethical climates are more likely to influence such outcomes.
3.4.8.4 Factor Analysis
Factor analysis involves grouping similar variables into dimensions. In other words it
aims to simplify data by reducing many individual items into a smaller set of
dimensions, in regression models, whilst identifying latent variables (Child, 2006). For
instance, factor analysis could be used to justify reducing questions with a view to
shorten questionnaires.
It is a combination of methods used to study the dynamics of underlying factors
influencing the responses on a number of measured variables (Decoster & Hall, 1998).
There are two main types of factor analysis namely (Decoster & Hall, 1998; Statistics
Solutions, 2019):
Exploratory Factor Analysis (“EFA”) – This determines the number of common
factors influencing a set of measures as well as establishing the strength of
relationship between each factor and each observed measure.
Confirmatory Factor Analysis (“CFA”) – It is a multivariate statistical procedure
that measures the extent to which the measured variables represent the
number of constructs. It determines whether a predetermined factor model fits
an observed set of data. Under this procedure, the researcher can specify the
number of factors required in the data as well as which measured variable is
related to which latent variable. It enables confirmation or rejection of the
measurement theory.
193
For the current study, one of the most important empirical aims was determining
whether there was a good fit between the elements of the empirically manifested
structural model and the theoretically hypothesised model.
The literature suggests that a CFA should be evaluated in light of the outcomes of a
combination of indices (Matsunaga, 2011). These include the:
Exact fit index (e.g. Chi-square, CMIN/df)
Root Mean Square Error of Approximation (“RMSEA”)
Incremental fit index, such as Comparative Fit Index (“CFI”), Tucker-Lewis
Index (“TLI”), Relative Non-centrality Index (“RNI”)
Residual-based index, such as Standardised Root Mean Square Residual
(“SRMR”)
CMIN/df – The CMIN/df is one of the prime absolute fit indices that directly measures
how well the hypothesised model, as specified by the researcher, reproduces the
observed data. In other words, it assesses whether the hypothesised model is
representative of the data (Hair et al., 2014). The CMIN/df is the Chi-square equivalent
in CFA.
RMSEA – The RMSEA is one of the most widely used measures to indicate how well
a model fits a population. According to Hair et al. (2014), it explicitly corrects for both
model complexity and sample size by including each in its computation with lower
RMSEA values indicating better fit. Based on empirical assessment of several
measures, it was found that the RMSEA was best suited to use in a confirmatory model
as samples become larger (Hair et al., 2014).
CFI – The CFI is one of the most widely used indices, given its relative insensitivity to
model complexity (Hair et al., 2014). The CFI examines the discrepancy between the
data and the hypothesised model, while adjusting for sample size issues. According
to Hair et al. (2014), the CFI is normed so that values range between 0 and 1, with
higher values indicating better fit. In fact, CFI values above .90 are usually associated
with a model that fits well as commonly viewed by many scholars.

194
SRMR - The SRMR is an absolute measure of fit and useful for comparing fit across
models. It can assess the practical significance of the magnitude of the SRMR value
considering the research objectives, observed or actual covariances or correlations,
with lower SRMR values representing better fit models (Hair et al., 2014). As a rule of
thumb, an SRMR value of over .10 suggests a problem with model fit.
To avoid any bias in the evaluation of the model, the above four assessments were
conducted consistently for all the variables subjected to CFA.
3.4.8.5 Structural Equation Modelling
According to Rigdon (1998), Structural Equation Modelling (“SEM”) is “a methodology
for representing, estimating, and testing a theoretical network of (mostly) linear
relations between variables”. The objective of SEM is to provide a powerful and
comprehensive technique for assessing relationships between measured variables
and latent constructs in a flexible way (Marcoulides, 1998). SEM, which accounts for
variation and covariation of the measured variables, has become a widely used
technique in research work as it enables the testing of theories and concepts (Babin
et al., 2008; Hair et al., 2012).
The key strengths and characteristics of SEM are as follows (Suhr, 2006):
(a) It is a highly flexible and comprehensive methodology appropriate for
investigating social, economic and health related issues including social,
behavioural, cultural, family and peer dynamics, self-concepts and other
phenomena;
(b) It relies on a formal specification of a model which needs to be assessed and
tested with hypotheses supported by theory and relations specified a priori;
(c) It is a multivariate technique that incorporates, and analyses observed
(measured/dependent) variables and unobserved (latent) constructs through
the simultaneous solving of multiple related equations.
Maximum Likelihood Estimates (“MLE”), which is a commonly employed estimation
method in structural equation modelling was used. According to Hair et al. (2014,
p.544), it is “a procedure that iteratively improves parameter estimates to minimize a

195
specified fit function”. In other words, the MLE “method determines values for the
parameters of a model such that they maximise the likelihood that the process
described by the model produced the data that were actually observed” (Brooks-
Bartlett, 2018).
Moreover, for the purpose of examining construct reliability, the variance-extracted
measures were also computed and examined using reference threshold values (Hair
et al., 2014, p.632).
In the current context of the study, SEM was used to establish a convenient and
powerful graphical representation of complex relations of constructs within the
Conceptual Research Model that could test the adequacy of the model and the set
parameters through CFA. For the predictive part and to test for mediation, path
analysis was used. In other words, the scores for each construct’s measures were
calculated before conducting the path analysis.
3.4.8.6 Path Analysis
According to Hair et al. (2014, p.546), Path Analysis is the “general term for an
approach that employs simple bivariate correlations to estimate relationships in a SEM
model.” In the context of this study, the path analysis determined the mediating effects
within the Conceptual Research Model. In other words, the respective direct and
mediating effects of the independent and mediating variables on the dependent
variables were computed, assessed and discussed.
3.4.8.7 Supporting Statistical Techniques
Other supporting statistical techniques included:
Harman’s Single Factor Test – This test allowed identification of common method
variance. In other words, it determined whether there was a single factor that
accounted for the majority of covariance amongst the measures or not.
Kaiser Meyer Olkin (KMO) and Bartlett’s Test – This statistic indicated the
proportion of variance in the variables that might be caused by underlying factors.

196
Cronbach’s Alpha – This measured the internal consistency of the instrument, i.e.,
how well the set of items put forward were closely related as a group such that the
scale reliability could be established.
ANOVA (Analysis of Variance) - With a view to test the empirical aims of whether
the mediating effects remained constant across different industry contexts and groups
of individuals, ANOVA was used to test the differences between the identified groups.
Games-Howell Post Hoc Test – The test performed multiple comparisons for two or
more groups. For example, it established whether different groups (age, socio-
economic and industry group) responded differently to a particular item or set of items.
3.4.8.8 Other considerations
It is recognised that alternative statistical techniques exist for adoption as compared
to the ones chosen above. For instances, bi-factor and higher order modelling
techniques could also be valid options for consideration as alternatives to uni-
dimensional and multi-dimensional CFA modelling. For the purpose of this study, a
consistent process to examine and confirm the underlying latent factors through CFA
was adopted, given the underlying originally validated instruments (holding sound
validity and reliability attributes) used to measure each variable with the Conceptual
Research Model. Where discriminant validity issues were noted post the CFA, the
process of EFA was adopted to examine the resulting and emerging factors, which
was again subjected to the CFA process. It is also acknowledged that mediation
studies are commonly used for longitudinal studies, it can nevertheless be relied upon
to study the indirect effects within a macro-meso-micro framework via statistical criteria
in cross-sectional studies as the present study is not aiming to establish causation
(Winer et al., 2016).
3.4.9 Use of Statistical Tools
For the purpose of data preparation, statistical analysis and interpretation, the
following tools were used given the breadth and appropriateness of statistical features
they provide for computation, analysis and reporting to respond to the multi-faceted
requirements and specificities of this study:

197
IBM SPSS Software Package, version 24
IBM SPSS Amos Software Package, version 24
Hayes’ PROCESS Procedures for SPSS, version 3.4.1
Microsoft Excel, version 2013
3.4.10 Limitations to the Survey Methodology
The identified limitations to the survey methodology were typical ones inherent to the
use of questionnaire design where closed-ended questions with a 5-point Likert scale
could restrict possible answers (Rosnow & Rosenthal, 1996). The self-administered
questionnaires could also be subject to vulnerabilities of diverse response styles.
Furthermore, the response rate and quality of responses were uncertain at the time of
design. The instruments also did not offer the researcher the possibilities to clarify and
validate responses being provided by the participants. (Beiske, 2002; McLeaod, 2018)

198
3.5 ETHICAL CONSIDERATIONS
Given the nature of exercise and data being collected, due care and diligence was
given to observe all such requirements of legislation, ethical standards, factors in
relation to rights over the data and how it would be used, shared and protected.
Some of the key ethical considerations for the present study were:
(a) The required clearances for the use of the relevant underlying instruments in
the overall scope of this study;
(b) Appropriate measures were taken in the development of the instrument to avoid
collection of sensitive personal data, and also explain the purpose so that
participation could be made voluntarily, informed consent could be obtained
and rights of the respondents to withdraw their responses from the data set
should the need arise;
(c) Ensuring the questionnaire was prepared in an appropriate format and
language for potential participants to read easily, understand and respond.
Should any respondent face any difficulty to complete the questionnaire,
appropriate disclosures were made to inform them of no adverse consequences
of a decision for not participating and withdrawing;
(d) Appropriate agreement was entered for the data collection exercise by the
appointed service provider. This ensured a fair, ethical and legally compliant
process to access the target group, gather the required relevant data. It was
determined how data would be collected, validated and submitted for onward
analysis and study. The agreement also restricted the use of the collected data
by any third party, for any other purposes other than the current research study,
with commitments for confidentiality and non-disclosure formalised;
(e) A query-feedback process was also implemented with the data collectors to
ensure that any queries from participants were responded to timeously and also
that appropriate feedback was collected for any future use.

199
3.6 SUMMARY OF THE CHAPTER
This chapter played a crucial preparatory phase prior to initiating the research work on
the ground. Formulating an appropriate research strategy that would fulfil the research
objectives was central to this chapter. This served as a steppingstone to progress
towards the next phase with the empirical study of the key constructs of the Conceptual
Research Model. This chapter has enabled to:
(a) Evaluate the various research approaches and take an ontological and
epistemological stance best suited for this study;
(b) In light of the chosen positivist research approach and considering the nature
of the research questions and empirical aims, quantitative research methods
have been chosen to undertake the next phase of the research work;
(c) Undertake a review of 41 relevant potential instruments that have been used in
other research across the world to measure the underlying constructs within the
Conceptual Research Model. Select the most appropriate ones (8) based on
their respective characteristics and merits to best suit and measure the key
constructs. Where documented critics or limitations were noted, these were
taken into consideration in the process.
(d) Devise the final master instrument to be used whereby the underlying
instruments (originally validated and holding sound validity and reliability
attributes) were borrowed from well-established researchers. Few of them were
marginally adapted to respond to specific research questions without affecting
the underlying instruments’ validities and reliabilities. The set of established and
originally validated instruments was integrated as a collective master
instrument to best suit the requirements and scope of this study;
(e) Document the strategy for testing and fine tuning the instrument such that
validity and reliability could be established. The data collection strategies were
specified to shed light on how the survey was administered. The proposed
statistical analysis techniques required to achieve the research questions and
empirical aims of this study were also specified.

200
CHAPTER 4: RESEARCH RESULTS & INTERPRETATION
4.1 INTRODUCTION
The preceding chapter on research design and methodology laid the required
foundation to guide the field study. The formulation of the research strategy in line with
the research objectives and the empirical study being envisaged was a key enabler to
embracing the field study in a reliable manner.
Prior to commencing the proposed field work, the consideration and approval of the
Research Ethics Review Committee of the Unisa School of Business Leadership was
sought and obtained in respect of the application that was made for ethics clearance.
The said approval was received on 20 August 2019.
The hiring of the services of Kantar for data collection was formalised in September
2019, and the field research work was undertaken between November 2019 and
February 2020.
This chapter thus focuses on two main aspects namely:
(a) Explaining the approach and process undertaken for data collection including
the challenges faced during the process, and the quality control measures
applied for reliability checks; and
(b) Univariate, bivariate and multivariate statistical analysis employing amongst
other advanced techniques such as confirmatory factor analysis (“CFA”),
exploratory factor analysis (“EFA”), path analysis and testing for mediation, and
the interpretation of results to better understand the underlying dynamics
between the data and the model.
On the basis of the analysis and interpretation of the research results conducted in
this chapter, insights and findings were drawn and discussed in respect of the research
objectives, research questions and empirical aims in the final chapter.

201
4.2 THE SURVEY PROCESS, CHALLENGES & QUALITY CONTROLS
4.2.1 The Survey Process
The first stage of the field work process involved holding briefing sessions with the
appointed service provider (Kantar) to ensure the field work was properly undertaken
as per the established methodologies, standards and ethical requirements. This
information was also documented and formalised so that due diligence was applied
throughout the process.
The instrument was then digitised using the Computer Aided Personal Interviews
(“CAPI”) tool, a technique to ease data collection, quality controls and subsequent
analysis. The digital version of the instrument was subject to quality controls to ensure
all sections and items were properly covered. Controls were also set on consent of
participants, age groups, employment status, and number of employees in the
organisation as key pre-conditions to participating to the survey.
Prior to effecting full scale face-to-face surveys through CAPI, a small pilot exercise
was undertaken to gauge the effectiveness of the instrument and to identify any
possible hurdles encountered with a view to take appropriate measures proactively
and enhance the effectiveness of the field survey. The pilot revealed a few issues
which were then addressed so as to enhance reliability, namely:
Some terminologies used within certain items in the questionnaire required
clarification to ensure a consistent understanding of the meaning. Certain items
were thus refined, and where required, the support of French and Creole was
considered in a structured way for certain cases to enhance reliability without
compromising the underlying objectives of the questions and instrument;
Certain participants during the pilot stage felt that the instrument was long and
time consuming to respond. Apart from rendering the user interface of CAPI
appealing, efficient and simple to use, there was little that could have been done
in this respect. This was because any changes would have constrained the
scope, limited the response to the research questions, and potentially affected
the reliability of the instrument. It was felt that this issue could impact the
202
response rate during the fieldwork. However, the initial scope of the instrument
(as proposed) was maintained for data collection, given the significance of the
relevant sections in assessing the Conceptual Research Model and research
questions set out.
To obtain a sound basis for data representativeness and to enable further
analysis on the profile of the respondents, a few additional questions were
suggested by Kantar. Three items were added to also capture District, Ethnic
Group and Occupation. The latter was included so that it could be mapped on
Socio-economic group and enable a broader analysis of the profiles whilst
ensuring assessment of data representativeness on more attributes (i.e.
gender, age group, industry, socio-economic group, ethnic group and district).
This extension was regarded as value-adding as it enabled further analysis and
evaluation of the ethical behavioural patterns in the local context across such
groups.
In total, 526 face-to-face home surveys were conducted by Kantar using the CAPI
technique by a team of 20 interviewers, working under the supervision of two field
assistants and five supervisors. The responses were subject to quality controls prior
to their retention for subsequent data analysis. Though the fieldwork was planned to
be undertaken from October 2019, it was slightly delayed due to a decision taken to
initiate the process post the Mauritius general elections. The field work was thus
conducted between 15 November 2019 and 07 February 2020, with the initial days
experiencing a low participation rate but with a gradual increase in the latter periods.
The field work had to be put on hold during the end of year festive season, between
the 20 December 2019 and 10 January 2020, with a view to obtaining participants’
availabilities and reliable responses. Interviews were conducted in the afternoons
during weekdays, and between 09:00 to 18:00 during weekends. These arrangements
were required to ensure an effective data collection exercise.
As per the initial design, Municipal Council Areas (“MCA”) and Village Council Areas
(“VCA”) were randomly selected in each District. The number of MCA and VCA chosen
by Districts varied according to the demographics of the District. Starting points were
defined for each MCA and VCA selected, and a total of 100 starting points were
chosen to achieve a sample size of 526 interviewees. The enumerators were required
203
to conduct conducted random walks and to select a maximum of eight
homes/interviews per sampling point.
4.2.2 Challenges faced during field work
The following challenges were faced during the survey:
(a) Drop outs - Due to the length of the instrument, a considerable number of the
respondents did not complete their questionnaires. Sixty-seven (67)
respondents ended the face-to-face survey after 30 minutes due to time
constraints and other personal priorities. These partial responses were not
considered suitable for inclusion in the study and removed from the remainder
of the survey exercise. This was found to be a potential challenge during the
pilot run.
(b) Reluctance in providing the signed Consent Form – 526 participants provided
their consents after having gone through the Participant Information Sheet and
relevant clauses including the confidentiality. They provided their consent
during the interview process by selecting the “Yes” option in the CAPI tool for
the question “I hereby provide my consent to use my responses for research
work purposes”. Some respondents were reluctant to provide the signed
Consent Form (paper version) due to apprehension of getting some form of
challenges with their organisations. However, these respondents were eager to
participate, provided their consents electronically, remained fully engaged
during the survey, and did not wish to be removed from the survey as they
wanted to voluntarily contribute towards this study.
4.2.3 Quality Controls during Field Work
With the aim to ensure reliability of the survey process and the collected data by the
interviewers, a diligent quality control mechanism was implemented. An independent
team of quality controllers effected call checks to the participants (20% selected
randomly per interviewer) to ensure the reliability of data collected. The responses
from the call checks were compared with the responses collected by the interviewers
through CAPI.

204
When effecting call checks, 70% of the respondents out of the 20% of questionnaires
randomly selected per interviewer were reached over the phone, and responses to the
quality control questions were found to match those provided earlier through the CAPI.
The remaining 30% of questionnaires account for ‘non-reachables’ or ‘respondents
being too busy’.
The responses which did not pass 70% of the quality control checks were discarded.
A total of 43 questionnaires were rejected in particular for two interviewers. The 43
questionnaires were subsequently re-allocated to other interviewers working on the
field work so as achieve total sample of 526 with enhanced data reliability. The call
checks also confirmed that the participants effectively provided their consent and were
willing to participate.
According to the internal quality control systems and based on the successful
outcomes of the call checks undertaken with the participants, the data collected for the
survey from the 526 participants were found to be reliable and could be used for
subsequent research and statistical assessment.

205
4.3 SURVEY DATA ASSESSMENT
4.3.1 Case & Variable Screening
With the aim to create a reliable database for analysis, the 526 baseline surveyed
cases (with Participation=Yes; Consent=Yes; Working=Yes; Age=20-69) were
subjected to an initial screening. This involved cases being assessed for missing
values, followed by an assessment and identification of unengaged responses. Finally,
the variation per item was assessed using descriptive statistical techniques including
mean, standard deviation, skewness and kurtosis.
Despite a rigorous in-field quality control process adhered to by Kantar, this was done
as an additional quality control step to confirm that no missing values were observed.
With regard to ‘unengaged responses’, the in-field quality control process did include
identification (‘flagging’) of respondents that might have been considered as
‘unengaged’. However, in-field exclusion of these respondents was not enforced due
to the subjective nature of judgement on the part of the interviewer. It was therefore
rather made a quality control process that was more statistically driven, hence
checking for cases where SD < 0.40.
The process adopted and findings were as follows:
4.3.1.1 Data Preparation for Statistical Computation & Analysis
The items were categorised and coded using a nomenclature {prefix.suffix} whereby
the prefix represents an abbreviation of the respective construct within the Conceptual
Research Model (i.e. “OC” for Organisational Culture, “EOC” for Ethical Organisational
Climate, “ELDM” for Ethical Leadership and Decision Making”, “IEWP” for Internal &
External Workplace Pressure, “OCB” for Organisational Citizenship Behaviour,
“EEBC” for Employee Ethical Behaviour & Conduct, and “PEP” for Perceived
Employee Performance). The suffix is basically a sequential number representing the
item number such that OCB.5 would be the fifth item in the instrument set for
measuring the Organisational Citizenship Behaviour. The letter “r” was used behind
the suffix to denote any negatively worded items and that were reversed scored as
proposed by the developers.

206
The responses of the participants under each item were coded with a sequentially
increasing number (1, 2, 3, 4, 5,…). For example, Male was given a code of ‘1’ and
Female ‘2’. Likewise, Likert items with responses for Strongly Disagree, Disagree,
Neutral, Agree and Strongly agree were coded with numbers 1, 2, 3, 4 and 5
respectively.
4.3.1.2 Missing Value Analysis
The number of observed cases with missing values was nil, hence no cases were
excluded at this stage.
4.3.1.3 Identifying Unengaged Responses
The standard deviations for each of the 526 baseline cases were computed with a
view to determine the possibility of unengaged responses. Cases with low standard
deviations (< 0.40) were screened and inspected. Three cases were identified as
having low standard deviations of less than 0.40. These cases were spotted as
potential cases of unengaged responses given the very low variability in responses.
For reliability purposes, these three cases were excluded from the data set. The
sample was thus revised from n = 526 to n = 523, the latter being the data set which
underwent further analysis.
4.3.1.4 Assessing Variation per Item
The respective Means, Standard Deviations, Skewness, Kurtosis and
Kurtosis/Standard Error (“SE”) ratio of all items being used to measure the underlying
constructs of the Conceptual Research Model were computed and examined and will
be discussed in further details in the context of the statistical analysis and tests being
applied in this chapter.
4.3.1.5 Assessing Normality
The responses to items measuring the seven underlying constructs and the prevailing
ethical standards and practices were plotted and their respective distributions were
assessed through histograms. Based on these assessments, no significant deviations
were identified that warranted any further exclusion of items.

207
4.3.2 Sample Representation
An assessment of the sample representativeness of the population was affected on
several key attributes namely:
Gender
Age
Industry
Socio-economic group
Ethnic group
District
The sample was found to be representative of the population, though some deviations
were evident as depicted in Table 4.1. Even if certain deviation from the population
existed, the data could still be useful in the context of the study. The “Sample” columns
comprise the numbers and percentages of the respondents by gender, and they have
been compared with the corresponding population at the national level, column
“Population” (Statistics Mauritius, 2018).
4.3.2.1 Gender Representativeness
Table 4.1 indicates the gender distribution of the participants in the sample (n = 523)
compared to the national population. This tendency is driven by the fact that there is
a larger segment of Males (60%) in the working class at the national level.
Table 4.1
Gender Representativeness
Sample Population
Gender Frequency Percent Percent
Male 277 53.0% 49.5%
Female 246 47.0% 50.5%
Total 523 100.0% 100.0%

208
4.3.2.2 Age Group Representativeness
Table 4.2 indicates the age distribution (in groups) of the participants in the sample (n
= 523) compared to the national population. The sample representativeness is fairly
close to the national population for all age groups, except for the 60 to 69 years of age.
This can be explained by the fact that the survey focused on the people in employment,
whilst the 60 to 69 age group would hold a large number of retirees. Hence a relatively
lower percentage of participants lay in this age band.
Table 4.2
Age Group Representativeness (as surveyed)
Sample Population
Age Group Frequency Percent Percent
20-29 159 30.4% 26.2%
30-39 141 27.0% 23.9%
40-49 112 21.4% 24.3%
50-59 89 17.0% 17.2%
60-69 22 4.2% 8.4%
Total 523 100.0% 100.0%
For the purpose of subsequently conducting “statistically meaningful” group
differences, the aim was to have a least 30 respondents by group to meet a large
enough sample condition for statistical tests (Corder & Foreman, 2009; Glen, 2020;
Salkind, 2004). Therefore, age groups “50-59” (n = 89) and “60-69” (n = 22) were
grouped into ages '50-69' (n = 111).

209
4.3.2.3 Industry Representativeness
Table 4.3 indicates the industry distribution of the participants in the sample (n = 523)
compared to the national population as surveyed.
Table 4.3
Industry Representativeness (as surveyed)
Sample Population
Industry Frequency Percent Frequency Percent
Agriculture, forestry and fishing 23 4.4% 110 4.3%
Mining and quarrying 0 0.0% 23 0.9%
Manufacturing 63 12.0% 585 23.1%
Electricity, gas, steam and air conditioning supply 8 1.5% 7 0.3%
Water supply, sewerage, waste management and remediation activities
16 3.1% 10 0.4%
Construction 31 5.9% 111 4.4%
Information and communication 24 4.6% 92 3.6%
Financial and insurance activities 37 7.1% 145 5.7%
Real estate activities 3 0.6% 33 1.3%
Professional, scientific, and technical activities 6 1.1% 178 7.0%
Administrative and support service activities 22 4.2% 118 4.7%
Public administration and defence, compulsory social security
43 8.2% 40 1.6%
Wholesale and retail trade, repair of motor vehicles and motorcycles
73 14.0% 457 18.0%
Transportation and storage 27 5.2% 90 3.6%
Accommodation and food service activities 34 6.5% 196 7.7%
Education 44 8.4% 176 6.9%
Human health and social work activities 37 7.1% 58 2.3%
Arts, entertainment, and recreation 12 2.3% 74 2.9%
Other services 20 3.8% 31 1.2%
Total 523 100.0% 2534 100.0%
With a view to be able to conduct “statistically meaningful” group differences, the
industries were regrouped such that they held a minimum of 30 respondents per
group. For grouping purposes, the Global Industry Classification Standard (GICS) &
Industry Classification Benchmark (ICB) were first considered whereby the “Electricity,
gas…” and “Water supply, sewerage, waste management…” were regrouped and
reclassified as “Utilities” (FTSE Russell, 2019; S&P Global & MSCI, 2018). However,
it was noted that the terminologies and classifications used by the earlier referenced
benchmarks did not perfectly match the understanding of the industries in the local
context. Thus, most of the existing categories were maintained as surveyed, and the

210
others were merged were on the basis of their nature and relatedness to the activities.
As such, 19 industries were regrouped into 12 for further analysis as follows:
Table 4.4
Industry Representativeness (partially regrouped)
Sample Population
Industry Group Frequency Percent Frequency Percent
Agriculture, forestry, fishing and Utilities (Regrouped)a 47
9.0% 150
5.9%
Manufacturing 63 12.0% 585 23.1%
Construction & real estate activities (Regrouped) b 34
6.5% 144
5.7%
ICT, professional, scientific & technical activities (Regrouped)
c 30
5.7% 270
10.7%
Financial and insurance activities 37 7.1% 145 5.7%
Public administration and defence, compulsory social security
43 8.2% 40 1.6%
Wholesale and retail trade, repair of motor vehicles and motorcycle
73 14.0% 457 18.0%
Transportation, storage, administrative and support service (Regrouped) d
49
9.4% 208
8.2%
Accommodation and food service activities 34 6.5% 196 7.7%
Education 44 8.4% 176 6.9%
Human health and social work activities 37 7.1% 58 2.3%
Other services (Regrouped) e 32
6.1% 105 4.1%
TOTAL 523 100.0% 2,534 100.0%
Note. The regrouping is based on the numbers reported in Table 4.3
a Agriculture, forestry, fishing (n = 23), mining & quarrying (n = 0) and Utilities (n = 8) and (n = 16) were regrouped b Construction (n = 31) and real estate activities (n = 3) were regrouped c ICT (n = 24) and professional, scientific & technical activities (n = 6) were regrouped d Transportation, storage (n = 27) and administrative & support service (n = 22) were regrouped e Other services (n = 12) and (n = 20) were regrouped

211
4.3.2.4 Socio-economic Group Representativeness
Table 4.5 indicates the socio-economic distribution (in groups) of the participants in
the sample (n = 523) compared to the national population based on ESOMAR
standards (ESOMAR, 2020). The sample representativeness is fairly close to the
national population for all socio-economic groups, except for the DE segment. This
can be explained by the fact that this particular survey may have been relatively
advanced for respondents in this segment to participate in, given their academic
profiles (i.e. holding skills for elementary occupation such as plant & machine
operators, etc.). Hence a there is a relatively lower percentage of participants in this
segment.
Table 4.5
Socio-economic Group Representativeness
Sample Population
Socio-economic Group Frequency Percent Percent
AB - High Class 72 13.8% 12.0%
C1 - Upper Middle Class 221 42.3% 38.0%
C2 - Lower Middle Class 184 35.2% 30.0%
DE - Lower Class 46 8.8% 20.0%
Total 523 100.0% 100.0%
4.3.3 Ethnic Group Representativeness
Table 4.6 indicates the ethnic group distribution of the participants in the sample (n =
523) compared to the national population. The sample is representative for most of
the ethnic groups.
Table 4.6
Ethnic Group Representativeness
Sample Population
Ethnic Groups (as classified in Mauritius) Frequency Percent Percent
Hindus 265 50.7% 51.0%
Muslims 94 18.0% 18.0%
General Population (Christians) 161 30.8% 28.0%
Chinese 3 0.6% 3.0%
Total 523 100.0% 100.0%

212
4.3.3.1 District Representativeness
Table 4.7 indicates the distribution of the participants by district in the sample (n = 523)
compared to the national population. Most of the districts are well represented except
for Rodrigues which is an outer island where the survey was not conducted specifically
in that region. Plaines Wilhems drew a larger response base given that it holds a larger
segment of the working population in that area.
Table 4.7
District Representativeness
Sample Population
Districts Frequency Percent Percent
Port Louis 41 7.8% 9.6%
Pamplemousses 27 5.2% 11.0%
Riviere du Rempart 51 9.8% 8.6%
Flacq 52 9.9% 10.9%
Grand Port 53 10.1% 9.0%
Savanne 16 3.1% 5.5%
Plaines Wilhems 220 42.1% 29.3%
Moka 36 6.9% 6.7%
Black River 27 5.2% 6.2%
Rodrigues 0
0.0% 3.3%
Total 523 100.0% 100.0%

213
4.4 HIGH LEVEL INSIGHTS
Prior to embarking on the model fit assessment exercise, a preliminary evaluation was
done on the survey results to gather some high level insights on the state of ethics
and compliance standards and practices in the local context. Table 4.8 provides an
indication on the extent to which organisations (classified as large establishments)
promoted ethics and compliance.
Table 4.8
Ethics & Compliance Standards and Practice by Industry
To what extent does your organisation promote Ethics & Compliance?
Industry n Never Rarely Sometimes Often Always TOTAL
Accommodation and food service activities 34 6% 3% 9% 38% 44% 100%
Administrative and support service activities 22 23% 9% 9% 27% 32% 100%
Agriculture, forestry and fishing 23 9% 4% 13% 48% 26% 100%
Arts, entertainment, and recreation 12 17% 8% 25% 33% 17% 100%
Construction 31 19% 16% 3% 26% 35% 100%
Education 44 5% 7% 14% 39% 36% 100%
Electricity, gas, steam and air conditioning supply 8 0% 0% 0% 75% 25% 100%
Financial and insurance activities 37 3% 5% 11% 30% 51% 100%
Human health and social work activities 37 8% 3% 11% 27% 51% 100%
Information and communication 24 13% 13% 17% 25% 33% 100%
Manufacturing 63 10% 16% 6% 32% 37% 100%
Other services 20 20% 0% 15% 25% 40% 100%
Professional, scientific and technical activities 6 33% 17% 33% 0% 17% 100%
Public Administration and defence, compulsory social security 43 12% 12% 12% 16% 49% 100%
Real estate activities 3 33% 0% 0% 33% 33% 100%
Transportation and storage 27 19% 7% 11% 37% 26% 100%
Water supply, sewerage, waste management and remediation activities 16 6% 13% 0% 44% 38% 100%
Wholesale and retail trade, repair of motor vehicles and motorcycle 73 15% 11% 12% 23% 38% 100%
All Industries 523 12% 9% 11% 30% 38% 100%
Note. n = 523; As surveyed, alphabetically sorted, no. of respondents by Industry represented in %; “Other services”
comprise activities of membership organisations, other personal service activities (e.g. hairdressing and beauty
parlour) and services in respect of washing and dry cleaning of textiles and fur products

214
It was noted that out of the retained sample (n = 523), a large majority of organisations
(79%) are promoting ethics and compliance standards in Mauritius across industries
to varying extents, from sometimes, often to always. However, the survey indicates
that 12% never promote and 9% rarely do so, across industries even if some of
industry players are operating within regulated environment.
Another aspect of interest was to gauge the nature and prevalence of ethics and
compliance related actions, tools and systems in the local context as reported in Table
4.9 on page 215 of the thesis.
It is noted that “Written Ethics Policies & Standards” and “Code of Ethics” were the top
two tools in place in organisations governing their ethics practices, albeit both of these
are relatively low in prevalence (35% and 19% respectively) across industries. The
level of training in ethics standards and codes seems to be relatively low with only
12% of the respondents having confirmed the same. It was revealing to further note
that ethical standards and practices as promoted globally in developed or developing
countries, for e.g. means to report violations, systems to discipline ethics violators, etc.
are “quasi absent” in the local context with very low prevalence. This is evidenced by
the following key measures which were used in setting the right ethical environment in
the workplace:
Performance evaluations of ethical conduct (4%)
Organisation resources that provide advice about ethics issues (4%)
Systems to discipline violators (3%)
A means to report potential violations confidentially or anonymously (2%)

215
Table 4.9
Prevalence of Ethics & Compliance Standards and Practice by Industry
Which of the following is/are present in your organisation?
Industry n Written
Ethics Policies & Standards
Code of
Ethics
Training on Standards
& Code
Performance evaluations of ethical conduct
Organisation resources
that provide advice about ethics issues
System to discipline violators
A means to report
potential violations
confidentially or
anonymously
None of
these
Accommodation and food service activities 34 53% 12% 9% 3% 3% 3% 6% 12%
Administrative and support service activities 22 27% 18% 14% 0% 5% 5% 0% 32%
Agriculture, forestry and fishing 23 43% 13% 13% 4% 0% 4% 4% 17%
Arts, entertainment and recreation 12 17% 17% 17% 0% 8% 0% 0% 42%
Construction 31 39% 6% 6% 3% 0% 3% 6% 35%
Education 44 30% 30% 11% 7% 5% 0% 0% 18%
Electricity, gas, steam and air conditioning supply 8 0% 25% 38% 13% 13% 0% 0% 13%
Financial and insurance activities 37 49% 14% 14% 3% 5% 0% 3% 14%
Human health and social work activities 37 54% 5% 11% 3% 11% 5% 0% 11%
Information and communication 24 38% 0% 21% 8% 4% 4% 0% 25%
Manufacturing 63 21% 32% 11% 5% 8% 5% 0% 19%
Other services 20 35% 35% 10% 0% 5% 0% 5% 10%
Professional, scientific and technical activities 6 33% 17% 0% 0% 0% 17% 0% 33%
Public Administration and defence, compulsory social security 43 40% 19% 16% 2% 0% 0% 5% 19%
Real estate activities 3 0% 33% 0% 0% 0% 0% 33% 33%
Transportation and storage 27 30% 26% 11% 0% 0% 4% 4% 26%
Water supply, sewerage, waste management and remediation activities 16 44% 13% 13% 0% 0% 6% 6% 19%
Wholesale and retail trade, repair of motor vehicles and motorcycle 73 32% 19% 8% 5% 3% 5% 1% 26%
All Industries 523 35% 19% 12% 4% 4% 3% 2% 21%
Note:n = 523; As surveyed, alphabetically sorted, no. of respondents by Industry represented in %; “Other services” comprise activities of membership organisations, other personal service activities
(e.g. hairdressing and beauty parlour) and services in respect of washing and dry cleaning of textiles and fur products

216
From the Table 4.9 on page 215, it was also noted that a considerable number of
respondents (21%) reported not having any of these ethics measures, practices and
systems in their organisations.
It also appears, from Table 4.10 on page 217, that the prevalence of “Written Ethics
Policies & Standards” is higher in larger organisations compared to smaller
establishments. The emphasis on training on ethics standards and codes was not that
much higher in these large establishments. Another important revelation was that
respondents from small to mid-sized establishments confirmed the prevalence of more
advanced ethics practices in place (albeit low) compared to larger organisations, with
measures in place such as advice on ethics issues, systems to discipline violators and
means to report potential violations anonymously.

217
Table 4.10
Prevalence of Ethics & Compliance Standards & Practice by Establishment Size
Which of the following is/are present in your organisation?
Establishment Size (No. of Employees)
n Written Ethics
Policies & Standards
Code of Ethics
Training on Standards
& Code
Performance evaluations of
ethical conduct
Organisation resources that provide advice about ethics
issues
Systems to discipline violators
A means to report potential
violations confidentially or
anonymously
None of
these
TOTAL
11-50 233 31% 19% 10% 4% 4% 3% 2% 27% 100%
51-100 100 28% 21% 16% 3% 5% 5% 4% 18% 100%
101-250 56 45% 9% 16% 4% 4% 2% 4% 18% 100%
251-500 52 44% 19% 8% 2% 2% 4% 6% 15% 100%
501-1000 29 38% 28% 21% 3% 7% 0% 0% 3% 100%
1001-1500 11 55% 9% 9% 9% 0% 0% 0% 18% 100%
1501-2500 8 63% 13% 13% 0% 0% 0% 0% 13% 100%
>2500 19 63% 5% 5% 11% 0% 5% 0% 11% 100%
Don't know 15 20% 40% 7% 0% 7% 0% 0% 27% 100%
All Establishments 523 35% 19% 12% 4% 4% 3% 2% 21% 100%
Note. n = 523; As surveyed, alphabetically sorted, no. of respondents by Establishment Size represented in %

218
Another area of interest in the context of this research was to gather the pulse of ethical
deviances or malpractices observed by the respondents over the last 12 months in
their workplace. Whilst 55% of the respondents had not witnessed any such form of
issues, 45% of the respondents nevertheless observed ethical issues or malpractices
to varying extents, with 12% seeing a frequent omnipresence of such deviances over
the last 12 months.
Table 4.11
Observed Ethical Deviances and Malpractices over the last 12-mths in the Workplace
To what extent have you observed any form of ethical deviances or malpractices in your workplace over the last 12 months?
Measures Never Rarely Sometimes Often Always TOTAL
n 286 109 66 41 21 523
% 55% 21% 13% 8% 4% 100%
Note. n = 523; No. of respondents in %
Among the reported ethical deviances or malpractices prevailing in the organisations,
the top five deviances rated by the respondents are provided below in descending
order of frequency:
“Abusive or intimating behaviour towards employees” (21%);
“Decisions made to benefit employee’s self-interests or own family/friends’
interests” (6%);
“Lying to employees, customers, vendors or the public” (5%);
“Unreasonable business targets” (4%); and
“Abusive use of company facilities” (4%).
A considerable number of respondents (53%) observed other forms of ethical
deviances or malpractices. The survey also gathered insights on ethical behaviour and
conduct through a specific set of questions that were also used in global studies and
which were rated on a 5-point Likert scale (one being “Strongly Disagree” and five
being “Strongly Agree” to the respective items) by the local participants. The key
behaviours were measured through descriptive statistics and bar graphs as shown in

219
Table 4.12 below, Figure 4.1 on page 220, Figure 4.2 on page 221 and Figure 4.3 on
page 222 of the thesis:
Table 4.12
Set of Items Measuring Ethical Behaviour & Conduct (as per global surveys)
Note. n = 523; Based on No. of respondents and M ranked highest to lowest
The pattern indicates a mean ranging between a low of 2.12 and a high of 2.69, i.e.,
suggesting disagreement by a large majority of the prevalence of such ethical issues.
However, the survey does highlight that there is also a sizeable portion of people
(around 15 to 20% of respondents) having witnessed ethical deviances in their
workplaces, as can be gathered from the bar graphs provided below
Mean
(M)
Std.
Deviation
(SD)
Items measuring Ethical Behaviour & Conduct Statistic Statistic
…people are engaged in anti-competitive behaviour. 2.69 1.057
…decisions made or actions taken benefit the employee (or friends/family) over the
interest of your organisation (conflict of interest). 2.50 1.069
…there is abusive and intimidating behaviour towards employees. 2.43 1.092
…people hide (potential) violations before on-site inspections. 2.36 1.018
…there is retaliation against someone who has reported misconduct. 2.29 1.006
…there are human rights violations. 2.25 1.011
…there is delivery of goods or services that fail to meet specification or clients’
requirements. 2.22 0.989
…one may lie to employees, customers, vendors or the public. 2.22 0.972
…there are violations of health and/or safety regulations. 2.19 0.961
…there is practice of improper contracting or violations of contract terms with customers
or suppliers. 2.16 0.972
…stealing or theft occurs. 2.16 0.934
…there is inappropriate alteration, falsification and/or misrepresentation of your
organisation's documents or records. 2.15 0.953
…there are violations of environment regulations. 2.15 0.949
…there is improper access to, disclosure of and/or use of computers or employees'
personal or private information. 2.14 0.970
…people accept bribes, kickbacks and/or appropriate gift. 2.12 0.987

220
n = 523µ = 2.43σ = 1.09
n = 523µ = 2.12σ = 0.99
n = 523µ = 2.50σ = 1.07
n = 523µ = 2.69σ = 1.06
Figure 4.1: Ethical behaviour and conduct at the workplace(a)

221
n = 523µ = 2.25σ = 1.01
n = 523µ = 2.22σ = 0.97
n = 523µ = 2.29σ = 1.00
n = 523µ = 2.29σ = 1.00
n = 523µ = 2.16σ = 0.97
Figure 4.2: Ethical behaviour and conduct at the workplace(b)

222
Note. The above analysis is based on observations over a relatively longer period, that is, for the period beyond the last 12 months horizon.
When considering the analysis specifically over last 12 months period, the Pressure to Compromise Ethical Standards stood at 11%, Observed Misconduct stood at 25%,
Experienced Retaliation for Reporting Misconduct stood at 7%, compared to 32%, 20% and 17% respectively for the period beyond the 12 months horizon.
Figure 4.3: Analysis of pressure to compromise ethical standards, observed misconduct and experienced retaliation in the workplace in Mauritius compared to
the global findings of ECI.

223
Table 4.13
Analysis of responses who "agreed” or “strongly agreed” in respect of pressures
Pressure Agree /
Strongly Agree % …to protect the company's image. 270 52%
…to continually innovate to gain efficiency. 253 48%
…stress (time pressure) in making managerial decisions is felt. 248 47%
…to ensure financial success of the company. 246 47%
…to compromise ethical standards to win business deals. 230 44%
…shareholders/owners are interested only in profits. 226 43%
…critical economic situation is felt. 217 41%
…from powerful groups of employees to abide to their demands. 214 41%
…to progress your career for better pay and living. 211 40%
…to protect your personal/family reputation. 211 40%
…pressures from business partners are aimed to gain advantage. 198 38%
…to meet your personal financial obligations. 195 37%
…to meet the monthly business targets. 194 37%
…superiors are interested only in results and not in the way how they were achieved. 187 36%
…from clients for favourable terms otherwise there is risk to lose the business. 181 35%
…to increase profit and value for shareholders. 179 34%
…to follow and execute orders from the boss(es), at all costs, for their own self interests. 169 32%
…to keep your job. 164 31%
…unfair human resource management policies prevail. 153 29%
…it is unclear which behaviours are ethical/unethical. 153 29%
…unethical behaviour of superiors is felt. 138 26%
…to accept unethical practices to protect your job / source of income / career prospect. 137 26%
…to undertake action that may not be ethical and/or in the best interests of everybody. 135 26%
…bad (ineffective) organisation of workflow is prevalent. 123 24%
…to fulfil disproportionate demands from shareholders, board member or bosses. 111 21%
…to accept unethical practices for one's own job security. 95 18%
…to fulfil disproportionate demands from external parties such as politicians, socio-ethnic groups, related parties of company owners. 91 17%
…to discriminate employees on grounds of gender, ethnic groups or other affinities. 75 14%

224
The Key Ethical Related Actions (KERAs) were suggested by the respondents as
critical for implementation to improve the ethical behaviour, standards and practices
of the organisations in general. These KERAs are provided in the Table 4.14 below in
order of rank (highest to lowest), with KERAs being part of Performance Appraisal
standing as the topmost measures suggested by the respondents. Despite variances
in ratings amongst the 13 KERAs, on average 40% of the respondents found these
KERAs to be critical for implementation to improve ethical behaviour and performance
at work.
Table 4.14
Evaluation of Suggested Key Ethical Related Actions (KERAs)
What would you suggest as critical measures for implementation to promote ethical behaviour and performance at the workplace?
Rank Ethical Related Actions Critical to have Total Critical to Have
n n %
1 Promote as part Performance Appraisal 237 523 45%
2 Promote Training on Standards 221 523 42%
3 Promote Formal Process to discipline Conduct 220 523 42%
4 Culture of Virtues & Transparency 218 523 42%
5 Promote through Leaders 215 523 41%
6 Promote Writing Standards 212 523 41%
7 Promote Confidential Reporting 211 523 40%
8 Promote Ethics & Compliance 207 523 40%
9 Implement National Ethics Framework 204 523 39%
10 Promote System to Report 196 523 37%
11 Promote Ability to seek Feedback 195 523 37%
12 Promote Formal Ethics Indicator 193 523 37%
13 Promote Institutionalisation for Ethical Decision Making 191 523 37%

225
4.5 MODEL FIT – ASSESSMENT & ADJUSTMENT
Considering the Conceptual Research Model put forward, as depicted in Figure 4.4
below, the questionnaire was developed. It consisted of several existing scales that
were previously developed and largely validated for many of the underlying constructs
in previous research undertaken on the global front. The details of the scales used
and the consolidated, adapted instruments were provided in Chapter 3 including the
methodology that was adopted for undertaking the field work.
Given that the adopted underlying scales were already tested and validated by
researchers and subject matter experts, it was deemed appropriate to undertake CFA
to confirm the model fit using the collected data as an initial step.
Each construct of the macro, meso and micro layers were subject to a model fit
assessment through well-defined statistical procedures. The underlying models
supporting the measurement of the respective constructs (referred to as the Baseline
Model in this section) were obtained and studied from a theoretical perspective. The
data from the survey, post statistical screening, have been used as the basis to assess
the Baseline Model fit of each macro-meso-micro construct.
Ethical Leadership
& Decision Making
Internal & External
Workplace
Pressures
Ethical
Organisational
ClimatePerceived
Employee
Performance
Employee Ethical
Behaviour &
Conduct
Organisational
Citizenship
BehaviourOrganisational
Culture
macro meso micro
Figure 4.4: Conceptual research model for the present study

226
While documenting the findings in this chapter, an approach was adopted whereby the
statistical strategy, procedures and tests were depicted in detail for the first construct,
Organisational Culture. The set of statistical procedures applied for most of the
remaining constructs are similar in nature; thus, an attempt has been made to be
concise in reporting the key findings for these remaining constructs, without being
repetitive in nature. However, their specificities have been presented and discussed
where required. Furthermore, when reviewing the literature, it was noted that the
reporting practices for CFA have been diverse, with varying approaches, levels of
disclosures and bases for selection of model fit indices. This was also highlighted by
various scholars and researchers, where an increased tendency in the reporting of
some values of incremental fit statistics were found. Researchers furthermore
selectively reporting measures of fit that support their desired model in spite of there
being little or no supporting statistical evidence (Jackson, Gillaspy & Purc-Stephenson,
2009). Therefore, to embrace an unbiased approach in reporting standards, a strategy
was also adopted for the selection and application of a consistent methodology and fit
indices from the start to the end, irrespective of the outcomes of the findings from the
data set (Matsunaga, 2011).
4.5.1 CFA – Baseline Model (Construct: Organisational Culture)
The first construct of the macro layer of the Conceptual Research Model,
Organisational Culture (“OC”), referred to under this section as the Baseline Model,
was assessed through a structured statistical process as follows:
4.5.1.1 Step 1 – Assessing the Baseline Model Fit through CFA
A CFA was undertaken on the Baseline Model to assess the model fit for the OC
construct. OC was measured through 30 items grouped under the following five factors
as established from the literature review in the underlying source instrument (Sashkin
& Rosenbach, 2013):
Managing Change (“OC_MC”)
Achieving Goals (“OC_AG”)
Coordinated Teamwork (“OC_CT”)
Customer Orientation (“OC_CO”)

227
Culture Strength (“OC_CS”)
Maximum Likelihood Estimates (“MLE”) was used, which is a commonly employed
estimation method in structural equation modelling.
Standardized loadings were computed as they are needed for the computation of
discriminant validity and reliability estimates. Furthermore, standardised regression
weights (the individual standardised factor loadings) were also computed for
assessment of the construct validity between the latent factors and items against
reference threshold values (Hair et al., 2014, p.632).
Factor correlations were computed for the latent factors and assessed accordingly.
Implied correlations, residual covariances and standardized residual covariances
matrices were also produced and examined for the OC construct. The main objective
of this was to use these statistical outputs when examining the validity, reliability and
model fit aspects through CFA.
Various model fit indices exist to evaluate a model, each having its own merits and
limitations, however, researchers seem to agree that multiple criteria should be used
to comprehensively test the model. This will enable one to confidently claim that the
model represents the latent factor structure underlying the data (Hu and Bentler,
1999).
The computed results of the various indicators that could be used to assess the model
fit under CFA are provided in Table 4.15 on page 228. However, for consistent
assessment of model fit, a combination of indices were applied using CMIN/df,
RMSEA, CFI and SRM (Matsunaga, 2011).

228
Table 4.15
CFA Model Fit Indicators
CMIN a Df b CMIN/df c GFI d NFI e TLI f CFI g RMSEA h SRMR i
2304.77 395 5.835 0.702 0.686 0.695 0.723 0.096 0.095
Note.p < .001
a CMIN : Chi-square equivalent in Confirmatory Factor Analysis b Df : Degree of Freedom c CMIN/df: Chi-square/Degree of Freedom d GFI : Goodness of Fit Index e NFI : Normed Fit Index f TLI : Tucker-Lewis Index g CFI : Comparative Fit Index h RMSEA: Root Mean Square Error of Approximation i SRMR : Standardized Root Mean Square Residual
The initial results indicate a poor fit as characterised by the following indicators:
CMIN/df: The CMIN/df, being the Chi-square equivalent in CFA, shows the
measure of association between the row and column categories. The CMIN/df
for the given degrees of freedom was > 5.00. Awang (2012) suggests that
CMIN/df should be < 5.00 to indicate a level of acceptance.
RMSEA: RMSEA estimates the amount of error of approximation per model
degree of freedom and considering the sample size. The RMSEA was .096
(moderate). Hu and Bentler (1999) suggest that the RMSEA should be < .08 to
indicate an acceptable fit.
CFI: The CFI, analyses the model fit by examining the discrepancy between the
data and the hypothesized model. The CFI was .723. For an acceptable fit, the
CFI should be > .90 (Awang, 2012; Hair et al., 2014). The same also applies for
the TLI.
SRMR: The SRMR is one of the most widely used residual-based index
showing the average value of the standardised residuals between observed
and predicted covariances. The SRMR was .095. Hu and Bentler (1999)
suggests that the SRMR should be < .10 to indicate an acceptable threshold.
The computed indicators for the assessment of the construct reliability and
discriminant validity are shown in Table 4.16 on page 229:

229
Table 4.16
CFA Model – Reliability & Validity
CR a AVE b MSV c MaxR(H) d OC_CO OC_MC OC_AG OC_CT OC_CS
OC_CO 0.642 0.332 1.109 0.776 0.576
OC_MC 0.456 0.234 1.232 0.849 0.974 0.483
OC_AG 0.511 0.284 1.232 0.895 1.020 1.110 0.533
OC_CT 0.677 0.316 1.115 0.924 0.982 1.000 1.025 0.562
OC_CS 0.705 0.363 1.175 0.941 1.053 1.084 1.075 1.056 0.602
Note. a CR : Construct Reliability b AVE : Average Variance Extracted c MSV : Maximum Shared Variance d MaxR(H) : McDonald Construct Reliability
The initial results also indicate a lack of reliability and discriminant validity as
characterised below:
Discriminant validity issues were observed for all the five factors with their
corresponding AVEs. AVE is commonly used to assess convergent validity
where AVE should be > .50. The AVEs were less than the MSVs. To ensure
discriminant validity, Hair (2014) suggests that the MSV should be less than the
AVE, and the SQRT(AVE) should be greater than the inter-construct
correlations. Whilst the AVE measures the amount of variance captured by the
OC construct in relation to the amount of variance due to measurement error,
the MSV measures the maximum amount of variance of the two variables that
tend to overlap.
As regards reliability, the CRs for OC_CO, OC_MC, OC_AG and OC_CT were
less than .70. Hair (2014) suggests that the CR should be > .70 to confirm
construct reliability.
In light of these results it was deemed appropriate to use Harman’s Single Factor test
to ascertain whether the model is a single-factor model.
4.5.1.2 Step 2 – Identifying Common Method Variance
Harman’s Single Factor test is regarded as the commonly used technique by
researchers to address the issue of common method variance. As opposed to the
original factor structure of five sub-structures, this test is used to identify common
method variance and determine whether a single factor emerges from the factor

230
analysis or one general factor which can account for the majority of the covariance
among the measures (Podsakoff et al., 2003). The general rule is that if a substantial
amount of common method variance is present, then either a single factor will come
out or a general factor will account for most of the covariance.
The Harman’s Single Factor test was conducted on the 30 items measuring OC, and
a correlation matrix was generated containing the correlation coefficients of the 30
items. The Kaiser-Meyer-Olkin (“KMO”) Measure of Sampling Adequacy determines if
responses given with the sample are adequate or not for factor analysis while Bartlett’s
Test of Sphericity is another indication of the strength of the relationship among the
variables. Both of these were computed:
Table 4.17
KMO & Bartlett’s Results
Kaiser-Meyer-Olkin Measure of Sampling Adequacy. 0.931
Bartlett's Test of Sphericity Approx. Chi-Square 7184.544
df 435
Sig. 0.000
Note. p < .001
According to Kaiser (1974), the KMO recommends .50 as the minimum (barely
accepted), values between .70 and .80 as acceptable, and values above .90 as
excellent. Looking at the Table 4.17, the KMO measure is .931 reflecting a strong
adequacy level of the sample for factor analysis.
The Bartlett’s Test of Sphericity tests the null hypothesis that the correlation matrix is
an identity matrix. From Table 4.17, it is noted that the significance of Bartlett’s Test
of Sphericity is less than .05, which is small enough to reject the null hypothesis. This
means that the correlation matrix is not considered to be an identity matrix. In other
words, the statistical significance indicates that there is a structure within the observed
correlation matrix and therefore would be appropriate for an assessment using
Principal Component Analysis.
Next, a table of Communalities is generated showing how much of variance in the 30
OC variables has been accounted for by the extracted factors, using Principal
Component Analysis as extraction method.

231
The Extraction Sums of Squared Loadings % of Variance is next computed to show
the percent of variance attributable to each factor after extraction. This value is of
significance at this stage as it indicates whether there is a single or multi-factor model.
A result of 33.5% (Extraction Sums of Squared Loadings % of Variance) is obtained
for one component extracted, indicating that there would be other factor(s) accounting
for the remaining variances.
The results from the Harman’s Single Factor test conducted on OC variables suggest
a multi-factor model, hence the process of effecting the model fit adjustments was
progressed.
4.5.1.3 Step 3 – Adjusting the Baseline Model (CFA Adjusted Model)
It was thus established through the assessment fit indicators that the initial Baseline
Model for OC demonstrates a poor fit, and that the subsequent Harman’s test result
suggests a multi-factor model. It was thus deemed appropriate to adjust the Baseline
Model with a view to obtain an acceptable model fit.
Modification indices were thus considered as they suggest that some remedial
measures can be applied to address discrepancies between the Baseline Model and
the estimated model. This is provided there is a theoretical justification underpinning
such modifications, rather than it being applied as a rule. The modification indices for
covariances between items shall be considered, where they can be substantiated by
theory. The literature suggests that one should not covary error terms with latent
variables, or with other error terms not forming part of the same factor (Hair et al.,
2014). The sequence is to also address the largest modification indices first.
The following model modification procedure was thus undertaken:
Covary error terms that are part of the same factor (where modification indices
> 50). A large modification index suggests that model fit would be improved if
an item is allowed to load on additional factors. In other words, it shows that the
item in question represents the influence of multiple factors and is therefore a
poor indicator of its intended factor (Dewe et al., 2003).

232
Assess and remove items with significant standardised residual covariances
(where > 2.58) as a large value would indicate that the covariance is not well
explained by the model (Schumacker & Lomax, 2004); and
Assess and remove items with low loadings, i.e., retain only such items
considered as having an important influence on the variable under study.
It was noted that the above process led to an improved fit. CMIN/df improved from
5.835 to 5.458, CFI from .723 to .893, RMSEA from .096 to .092, SRMR from .095 to
.048. However, this was still not acceptable as is shown in Table 4.18 below. The lack
of discriminant validity remained problematic despite the selective model fit
adjustments whereby the AVEs of the five latest constructs were less than their
corresponding MSVs.
Table 4.18
Fit Indicators of adjusted model and reliability & validity
CMIN df CMIN/df GFI AGFI NFI TLI CFI RMSEA PCLOSE SRMR AIC BIC
594.97 109 5.458 0.873 0.821 0.873 0.867 0.893 0.092 0.000 0.048 683.0 870.4
CR AVE MSV MaxR(H) OC_CO OC_MC OC_AG OC_CT OC_CS
OC_CO 0.744 0.492 1.075 0.746 0.701
OC_MC 0.568 0.398 1.186 0.811 0.976 0.631
OC_AG 0.706 0.446 1.098 0.872 0.954 1.047 0.668
OC_CT 0.774 0.464 1.124 0.913 0.995 1.034 1.017 0.681
OC_CS 0.788 0.426 1.186 0.934 1.037 1.089 1.048 1.060 0.653

233
Confirmatory Factor Analysis of Base Model
[Organisational Culture]
Confirmatory Factor Analysis of Adjusted Base Model
[Organisational Culture]
Figure 4.4(a) – Comparison of the CFA base model and the CFA adjusted base model for OC
construct
In light of the above outcomes, it was thus deemed appropriate to conduct an
Exploratory Factor Analysis (“EFA”) so as to propose a new measurement model that
can be defended on theoretical grounds.
4.5.1.4 Step 4 – Conducting EFA for New Theory Building
The use of the EFA in particular is crucial at this stage. This will help to identify the set
of latent or unobserved factors that reconstruct the complexity of the underlying
observed data into a model that retains the essential information from the underlying
data whilst discarding the redundant items. In particular, individual item validity and
the covariances between constructs under study or related constructs will be retained
whilst information affected by sampling and measurement errors will be removed
(Matsunaga, 2011). In other words, the main underlying objective is to explore the

234
latent factors that best represent the variations and interrelationships of the underlying
observed items with a view to potentially generate a new theory that will be subject to
another round of theory testing using CFA (Henson & Roberts, 2006).
The following procedure was thus undertaken to conduct the EFA:
(a) A factor extraction process was effected using Principal Axis Factoring as an
extraction method and Promax as a rotation method. The preliminary runs
suggested a multi-factor model (five constructs holding eigenvalues > 1 and
with cumulated Extraction Sums of Squared Loadings of 47.8%). The
corresponding factor matrix (five factors generated through 11 iterations), the
pattern matrix (rotation converged in six iterations) and the structure matrix and
factor correlation matrix were generated and assessed.
(b) Four items emerged with low communalities (< .30) namely OC.3r, OC.7r,
OC.13r and OC.16r. These items were excluded.
(c) Another four items with high cross-loadings (diff < .20) were excluded namely
OC.5, OC.23, OC.29 OC.30
(d) Seven items with low loadings (< .50) were removed to obtain an improved
average loading of > .6. As such, items OC.8, OC.17, OC.18, OC.19, OC.20
OC.21 and OC.22 were removed.
The key resulting outputs of the factor analysis following the required procedures of
being run recursively, and are presented in Table 4.19 on page 235 of the thesis:

235
Table 4.19
Communalities (EFA – OC Construct)
Initial Extraction
OC.1 …people are flexible and adaptable when changes are necessary.
0.419 0.371
OC.2 …individuals and teams have clearly defined goals that relate to the goals and mission of the business.
0.515 0.528
OC.4 …highest priority and support are given to meeting the needs of clients and customers and to solving their problems.
0.311 0.323
OC.6r …people feel that most change is the result of pressures imposed from higher up in the organisation. [R]
0.233 0.290
OC.9 …the policies and procedures help providing the service the customers want and need.
0.497 0.522
OC.10 …everyone knows and understands the business objectives and priorities.
0.610 0.606
OC.11 …people have a clear idea of why and how to proceed throughout the process of change.
0.562 0.562
OC.12 …individuals and teams are measured and rewarded according to how well goals are achieved.
0.474 0.475
OC.14r …people often see customer and client problems as someone else's responsibility. [R]
0.377 0.435
OC.15r …people sometimes compromise company policies or principles to reach operational goals. [R]
0.413 0.607
OC.24 …employees who do the best job of serving customers are more likely than other employees to be recognised or rewarded.
0.358 0.393
OC.25 …people have access to timely and accurate information about what's really happening in the organisation and why.
0.485 0.545
OC.26 …people believe that their concerns and anxieties during periods of change are heard and taken into consideration.
0.430 0.459
OC.27r …individuals, teams, and functional areas often have incompatible goals. [R]
0.396 0.510
OC.28 …managers at all levels work together as a team to achieve results for the organisation.
0.495 0.568
Note. Extraction Method: Principal Axis Factoring.
Table 4.19 presents the extracted communalities showing the extent to which an item
correlates with all items. Most of the items with low communalities (< .30) were
removed. There is one border line case (OC.6r) which will be further examined in light
of the pattern matrix prior to any action on this item as it may still load well onto a
properly defined factor.

236
Table 4.20
Total Variance Explained (EFA – OC Construct)
Factor
Initial Eigenvalues
Extraction Sums of Squared Loadings
Rotation Sums of Squared
Loadings
Total % of
Variance Cumulative % Total % of
Variance Cumulative
% Total
1 5.401 36.005 36.005 4.901 32.670 32.670 4.144
2 2.049 13.659 49.665 1.546 10.309 42.979 3.947
3 1.287 8.579 58.244 0.746 4.975 47.954 2.304
4 0.884 5.891 64.135
5 0.736 4.904 69.039
6 0.707 4.714 73.753
7 0.669 4.457 78.210
8 0.551 3.673 81.883
9 0.518 3.456 85.339
10 0.443 2.952 88.291
11 0.432 2.878 91.169
12 0.377 2.517 93.685
13 0.352 2.344 96.029
14 0.332 2.214 98.244
15 0.263 1.756 100.000
Note. Extraction Method: Principal Axis Factoring.
Principal Axis Factoring was used as the Extraction Method. Three factors have been
identified with eigenvalues > 1.0, accounting for 47.9% of the total variances as shown
in the Table above.

237
Table 4.21
Pattern Matrixa (EFA – OC Construct)
Factor
1 2 3 Average
OC.2 …individuals and teams have clearly defined goals that relate to the goals and mission of the business.
0.782
OC.9 …the policies and procedures help providing the service the customers want and need.
0.687
OC.10 …everyone knows and understands the business objectives and priorities.
0.671
OC.1 …people are flexible and adaptable when changes are necessary.
0.647
OC.11 …people have a clear idea of why and how to proceed throughout the process of change.
0.624
OC.4 …highest priority and support are given to meeting the needs of clients and customers and to solving their problems.
0.575
0.66
OC.25 …people have access to timely and accurate information about what's really happening in the organisation and why.
0.727
OC.26 …people believe that their concerns and anxieties during periods of change are heard and taken into consideration.
0.686
OC.24 …employees who do the best job of serving customers are more likely than other employees to be recognised or rewarded.
0.624
OC.28 …managers at all levels work together as a team to achieve results for the organisation.
0.311 0.560
OC.12 …individuals and teams are measured and rewarded according to how well goals are achieved.
0.524
0.62
OC.15r …people sometimes compromise company policies or principles to reach operational goals. [R]
0.803
OC.27r …individuals, teams, and functional areas often have incompatible goals. [R]
0.209 -0.290 0.608
OC.14r …people often see customer and client problems as someone else's responsibility. [R]
0.591
OC.6r …people feel that most change is the result of pressures imposed from higher up in the organisation. [R]
0.525
0.63
Note. Extraction Method: Principal Axis Factoring. Rotation Method: Promax with Kaiser Normalization. Values > .20 being reported a. Rotation converged in 6 iterations.
Using Promax with the Kaiser Normalisation as the rotation method, the above pattern
matrix table was generated, with coefficients for the linear combination of the
variables. Basically, each row of the pattern matrix represents a regression equation,
where the standardized observed variable/item is expressed as a function of
the factors. In other words, it contains partial standardised regression coefficients of
each item with a particular factor. It enables identification of the patterns of the items
with their most suitably factors, based on their loadings. The square of the loadings
represents the contribution of the factor to the variance of the item by excluding the
overlap between correlated factors. An average loading was also computed for the

238
respective clusters and found to be > .60, thereby proving acceptable support for the
underlying pattern structure.
A structure matrix, representing the simple correlations (zero-order) between the
respective items and the factors was also generated as shown below:
Table 4.22
Structure Matrix (EFA – OC Construct)
Factor
1 2 3
OC.10 …everyone knows and understands the business objectives and priorities.
0.767 0.564
OC.11 …people have a clear idea of why and how to proceed throughout the process of change.
0.735 0.569 -0.220
OC.2 …individuals and teams have clearly defined goals that relate to the goals and mission of the business.
0.722 0.390
OC.9 …the policies and procedures help providing the service the customers want and need.
0.721 0.481
OC.1 …people are flexible and adaptable when changes are necessary. 0.601 0.334
OC.4 …highest priority and support are given to meeting the needs of clients and customers and to solving their problems.
0.562 0.343
OC.25 …people have access to timely and accurate information about what's really happening in the organisation and why.
0.486 0.736 -0.243
OC.28 …managers at all levels work together as a team to achieve results for the organisation.
0.631 0.699
OC.26 …people believe that their concerns and anxieties during periods of change are heard and taken into consideration.
0.416 0.678 -0.256
OC.12 …individuals and teams are measured and rewarded according to how well goals are achieved.
0.528 0.670 -0.316
OC.24 …employees who do the best job of serving customers are more likely than other employees to be recognised or rewarded.
0.259 0.591 -0.383
OC.15r …people sometimes compromise company policies or principles to reach operational goals. [R]
-0.249 0.773
OC.27r …individuals, teams, and functional areas often have incompatible goals. [R]
-0.397 0.680
OC.14r …people often see customer and client problems as someone else's responsibility. [R]
-0.237 -0.375 0.645
OC.6r …people feel that most change is the result of pressures imposed from higher up in the organisation. [R]
-0.221 -0.210 0.518
Note. Extraction Method: Principal Axis Factoring. Rotation Method: Promax with Kaiser Normalization.
Whilst examining the structure matrix, it was noted that some items are strongly
correlated with certain specific factors, while others are not. For instance, items OC.1,
OC.2, OC.4, OC.9, OC.10 and OC.11 load highly on Factor 1 compared to Factor 2.
The above structure also enables to identification of cross-loadings of certain items
onto more than one factor.

239
A factor correlation matrix was then generated for the OC construct to determine the
strength of relationships between the extracted latent factors as shown below.
Table 4.23
Factor Correlation Matrix (EFA – OC Construct)
Factor 1 2 3
1 1.000 0.620 -0.193
2 0.620 1.000 -0.390
3 -0.193 -0.390 1.000
Note. Extraction Method: Principal Axis Factoring. Rotation Method: Promax with Kaiser Normalization.
A three-factor model has been identified through the EFA process which will be subject
to an assessment on theoretical grounds. The model derived from the EFA was
assessed for model fit through CFA, and the results indicated a reasonable fit (though
some modifications can further improve the model) as shown below:
Table 4.24
Model Fit Indicators, Reliability & Validity (EFA Baseline Model – OC Construct)
CMIN df CMIN/df GFI AGFI NFI TLI CFI RMSEA PCLOSE SRMR AIC BIC
462.09 87 5.311 0.894 0.854 0.850 0.847 0.874 0.091 0.000 0.063 528.1 668.7
Note. P < .001
CR AVE MSV MaxR(H) OC_FacB OC_FacA OC_FacC
OC_FacB 0.804 0.454 0.579 0.814 0.674
OC_FacA 0.839 0.471 0.579 0.913 0.761 0.686
OC_FacC 0.751 0.434 0.196 0.933 -0.443 -0.298 0.659

240
4.5.1.5 Step 5 – CFA Adjusted Model
To improve the three factor model generated through the EFA, further adjustments
were done, and the revised model was subjected to a final assessment through CFA
to determine the adjusted model fit.
The same process was followed of covarying error terms that are part of the same
factor, where modification indices are greater than 50. An assessment and removal of
items with significant standardised residual variances greater than 2.58 and those
items with low loadings were effected.
These adjustments improved the three-factor model from a reasonable to an
acceptable fit, as shown and discussed below:
Confirmatory Factor Analysis of the EFA Base Model
[Organisational Culture]
Confirmatory Factor Analysis of EFA Base Model (Final Model)
[Organisational Culture]
Figure 4.5. Comparison of CFA of the EFA base model and CFA of adjusted EFA base model for OC
construct.

241
Table 4.25
Evolution of Model Fit Indicators and Validity & Reliability Indicators & Factor Structure of Final Model [OC - Construct]
Model Fit Comparison CMIN df P-value CMIN/df GFI AGFI NFI TLI CFI RMSEA PCLOSE SRMR AIC BIC
CFA of the EFA Base Model 462.09 87 0.000 5.311 0.894 0.854 0.850 0.847 0.874 0.091 0.000 0.063 528.1 668.7
CFA of Adjusted EFA Base Model 93.29 32 0.000 2.915 0.966 0.942 0.940 0.943 0.960 0.061 0.105 0.042 139.3 237.3
CFA of the EFA Base Model (Validity & Reliability Indicators) CFA of Adjusted EFA Base Model (Validity & Reliability Indicators) CR AVE MSV MaxR(H) OC_FacB OC_FacA OC_FacC CR AVE MSV MaxR(H) OC_FacB OC_FacA OC_FacC
OC_FacB 0.804 0.454 0.579 0.814 0.674 OC_FacB 0.773 0.533 0.558 0.776 0.730
OC_FacA 0.839 0.471 0.579 0.913 0.761 0.686 OC_FacA 0.773 0.462 0.558 0.876 0.747 0.679
OC_FacC 0.751 0.434 0.196 0.933 -0.443 -0.298 0.659 OC_FacC 0.694 0.437 0.127 0.906 -0.340 -0.356 0.661
Final CFA Adjusted EFA Base Model: Items & Factors for the OC Construct Factor 1
Factor 2
Factor 3
OC.2 …individuals and teams have clearly defined goals that relate to the goals and mission of the business. Achieving Business
Goals (OC_FacA)
OC.4 …highest priority and support are given to meeting the needs of clients and customers and to solving their problems.
OC.9 …the policies and procedures help providing the service the customers want and need.
OC.11 …people have a clear idea of why and how to proceed throughout the process of change.
OC.25 …people have access to timely and accurate information about what's really happening in the organisation and why. People
Consideration (OC_FacB)
OC.26 …people believe that their concerns and anxieties during periods of change are heard and taken into consideration.
OC.28 …managers at all levels work together as a team to achieve results for the organisation.
OC.6r …people feel that most change is the result of pressures imposed from higher up in the organisation. [R] Work Ethics (OC_FacC)
OC.15r …people sometimes compromise company policies or principles to reach operational goals. [R]
OC.14r …people often see customer and client problems as someone else's responsibility. [R]

242
4.5.1.6 Step 6 - Key observations on the assessment of the OC Construct
(a) 15 items initially emerged as having acceptable loadings (between .51 and .81)
under a three-factor model generated through the EFA process. The CMIN/df
remained > 3.00, RMSEA > .05, CFI slightly below .90 and SRMR < .09.
(b) Following the model adjustments, the 3-factor model was refined with 10 items
holding acceptable loadings (between .51 and .79), but with much improved model
fit indicators. CMIN/df reduced to 2.915 (threshold: < 5.00), RMSEA improved from
.091 to .061 (threshold: < .08), CFI improved to above .90 threshold (result: .960),
SRMR improved to .042 (threshold: < .10). TLI was above the .90 threshold (result:
.943) and GFI was also above the .90 threshold (result: .966).
The CFA of the Adjusted EFA Base Model shows an acceptable to excellent fit (the
final results have been mapped in the respective cells as highlighted in the table
below):
Table 4.26
Model Fit Indices
CMIN/df GFI NFI TLI CFI RMSEA SRMR
Poor >5 <0.90 <0.90 <0.90 <0.90 >0.08 >0.10
Acceptable 3-5 >0.90 >0,90 >0,90 0.90-0.95 0.06-0.08 0.08-0.10
Excellent <3 >0.95 >0.95 >0.95 >0.95 <0.06 <0.08
Fit type Absolute Absolute Incremental Incremental Incremental Absolute Absolute
Note. Sources: Hair et al. (2014), Awang (2012), Hu & Bentler (1999), Schumacker & Lomax (2010)
(c) The factor structure emerging from the present study was assessed from a
theoretical perspective with the studies and factor structures of Sashkin and
Rosenbach (2013), Denison (1990) and Cameron and Quinn (1999, 2006). Table
4.27 on page 243 of the thesis shows how the various latent components of the
respective studies have been mapped and compared. Whilst examining the items
loaded in the factor structure of the present study and considering the
aforementioned theoretical perspectives, the three factors that emerged from the
present study have been labelled as follows:
Factor 1: OC_FacA Achieving Business Goals
Factor 2: OC_FacB People Consideration
Factor 3: OC_FacC Work Ethics

243
Table 4.27
Mapping of Confirmed Factors – A theoretical perspective (OC)
(d) Out of the three factors extracted from the present study, two of them (Achieving
Business Goals and People Consideration) were common to the studies
undertaken by the other researchers. However, the set of items loaded onto
OC.FacC seem to be very particular to the local context. Examining the items
(OC.6r, OC.14r and OC.15r) through face validity, reveals that they tend to point
towards an all-encompassing latent factor with ethical, compliance and dutiful traits
exemplified through the attributes of Work Ethics. In other words, it characterises
the employees’ perceptions of the organisation climate, how they respond to and
treat ethical related work issues and their participation in addressing business
issues (Bahcecik & Oztürk, 2003).
(e) Though the model has materially improved from the initial baseline model to an
acceptable fit, there are still some discriminant validity issues in the final CFA
Component Sashkin &
Rosenbach
(2013)
Denison
(1990)
Cameron & Quinn
(1999, 2006)
The Present
Study
1 Managing
Change
Adaptability
(Creating
Change)
2 Achieving
Goals
Mission
(Goals &
Objective)
Market
(Results Oriented)
Achieving
Business Goals
3 Coordinated
Teamwork
Involvement
(Team
Orientation)
Clan
(Collaborative)
People
Consideration
4 Customer
Orientation
Adaptability
(Customer focus)
Market
(External focus)
5 Culture
Strength
6 Consistency
(Core Values)
7 Hierarchy
(Structured)
8 Adhocracy
(Dynamic)
9 Work
Ethics

244
model between OC_FacA and OC_FacB. In this particular context, it is deemed
appropriate to choose one factor as a proxy of the OC construct measure. Based
on the theoretical assessment and the above results, the use of OC_FacA has
been selected as a proxy of the construct measure and for computation of the
score. OC_FacA loads with four items and represents “Achieving Business Goals”
from a theoretical perspective. The use of the proxy is not meant to generalise an
observation on a particular construct but rather for specifically measuring the
indirect effects in the mediation model.
4.5.2 CFA – Baseline Model (Construct: Ethical Organisational
Climate)
The second construct of the macro layer of the Conceptual Research Model, Ethical
Organisational Climate (“EOC”), referred to here under this section as the Baseline
Model, was also subject to a comprehensive and structured statistical process and
strategy, similar to that undertaken for the earlier construct. The objective of this
section is to present the results of the CFA conducted on the EOC in a concise format
whilst highlighting the critical findings that emerged from the statistical procedures and
tests.
4.5.2.1 Assessing the Baseline Model Fit through CFA
A CFA was undertaken on the Baseline Model to assess the model fit for the EOC
construct using the data gathered through the survey. EOC was measured through
the 36 items of Victor and Cullen (1988) grouped under nine factors namely:
Benevolence-Cosmopolitan: Social Responsibility (“EOC_BC_SR”)
Benevolence-Individual: Friendship (“EOC_BI_F”)
Benevolence-Local: Team Interest (“EOC_BL_TI”)
Egoism-Cosmopolitan: Efficiency (“EOC_EC_E”)
Egoism-Individual: Self Interest (“EOC_EI_SI”)
Egoism-Local: Company Profit (“EOC_EL_CP”)
Principle-Cosmopolitan: Laws, Professional Codes (“EOC_PC_LPC”)
Principle-Individual: Personal Morality (“EOC_PI_PM”)
Principle-Local: Rules, Standards, Operating Procedures (“EOC_PL_RSOP”)

245
The initial results of the CFA indicate a poor fit. The CMIN/df was 6.073 (threshold limit
being < 5.00 to indicate as acceptable level), RMSEA was .099 (threshold limit being
< .08 to indicate a good fit), CFI was .785 and TLI was .757 (both indicators should be
> .90 to demonstrate as acceptable fit), and SRMR was .088 within the threshold limit
of < .10.
Furthermore, discriminant validity issues were noted for all the factors of the Baseline
Model of EOC, whereby the respective AVEs were less than their corresponding
MSVs. Convergent validity issues were also noted for EOC_PI_PM, EOC_EL_CP and
EOC_EL_SI whereby their respective AVEs were less than .50. The CRs for
EOC_PI_PM and EOC_EL_SI were less than .70.
4.5.2.2 Identifying Common Method Variance
The Harman’s Single Factor test was conducted to identify common method variance
on the 36 items measuring EOC.
Correlations were computed and a correlated matrix was generated with the
correlation coefficients of the 36 items. The KMO Measure of Sampling Adequacy and
Bartlett’s Test of Sphericity were computed as follows:
Table 4.28
KMO & Bartlett’s Results
Kaiser-Meyer-Olkin Measure of Sampling Adequacy. 0.964
Bartlett's Test of Sphericity Approx. Chi-Square 13461.418
df 630
Sig. 0.000
Note. p < .001
The KMO measure is .964 reflecting a strong adequacy level of the sample for factor
analysis. From the result of the Bartlett’s Test of Sphericity, it can be seen that the
significance is less than .05.
A table of Communalities was generated showing how much of variance in the 36
EOC variables has been accounted for by the extracted factors, using Principal
Component Analysis as the extraction method. The Extraction Sums of Squared
Loadings % of Variance was also computed and a result of 45.2% was obtained for
Extraction Sums of Squared Loadings % of Variance for one component extracted,

246
suggesting a multi-factor model for EOC, and, hence rejecting the null hypothesis. The
proposed next step was to continue with model fit adjustments.
4.5.2.3 Adjusting the Baseline Model (CFA Adjusted Model)
In light of the above model fit results and a multi-factor structure being suggested, the
next course of action was to adjust the Baseline Model with a view to obtain an
acceptable model fit. Using the same theory-based approach as earlier, modification
indices and remedial measures were considered with a view to address discrepancies
between the Baseline Model and the estimated model. This included the covarying of
error terms that are part of the same factor (where modification indices > 50), An
assessment and removal of items with significant standardised residual covariances
(where > 2.58) and those items with low loadings were also conducted.
Though the above process led to an improvement of certain model fit indicators (e.g.
CFI from .785 to .832 and SRMR from .088 to .064), it was still not acceptable and
continued to demonstrate a lack of discriminant validity despite the selective model fit
adjustments. On the basis of these results, an EFA was required to propose a new
measurement model that can be defended on theoretical grounds.
4.5.2.4 Conducting EFA
An EFA was conducted to explore the latent factors that best represent the variations
and interrelationships of the underlying observed items with a view to generate a new
theory that can be further assessed and confirmed through a CFA.
A factor extraction process was effected using Principal Axis Factoring as the
extraction method and Promax as the rotation method. The preliminary runs
suggested a multi-factor model (five constructs holding eigenvalues of > 1 and with
cumulated Extraction Sums of Squared Loadings of 58.7%). The corresponding factor
matrix (five factors generated through 16 iterations), pattern matrix (rotation converged
in eight iterations), structure matrix and factor correlation matrix were generated and
assessed.
As there were no items with low communalities (< 0.30), the original set of items were
maintained. A total of 11 items were removed (namely EOC.6r, EOC.4, EOC.18,
EOC.3, EOC.23, EOC.24, EOC.11, EOC.12, EOC.22, EOC.28 and EOC.36) due to
high cross-loadings (diff. < 0.20).

247
Three items with low loadings (< 0.50), EOC.9, EOC.29 and EOC.8, were removed
with an aim to obtain an average loading of > 0.60.
The statistical procedures undertaken under the EFA led to a 4-factor model emerging
as depicted below:
Table 4.29
Pattern Matrixa (EFA)
Factor
1 2 3 4
EOC.26 …it is expected that you will always do what is right for the customer and public.
0.912
EOC.25 …each person is expected, above all, to work efficiently. 0.796
EOC.20 …people are expected to strictly follow legal or professional standards.
0.712
EOC.15 …everyone is expected to stick by the company rules and procedures.
0.709
EOC.27 …people view team spirit as important. 0.699
EOC.21 …the major consideration is what is best for everyone in the company.
0.666
EOC.19 …the most efficient way is always the right way. 0.642
EOC.14 …people are expected to comply with the law and professional standards over and above other considerations.
0.622 0.343
EOC.7 …it is very important to follow strictly the company’s rules and procedures.
0.553
EOC.32 …what is best for each individual is a primary concern. 0.785
EOC.31 …people are very concerned about what is generally best for employees.
0.760
EOC.34 …the effect of decisions on the customer and the public are a primary concern.
0.689
EOC.30 …people are actively concerned about the customer’s and the public’s interest.
0.618
EOC.33 …people are very concerned about what is best for themselves.
0.602 0.385
EOC.35 …it is expected that each individual is cared for when making decisions.
0.540
EOC.5 …people look out for each other’s good. 0.646
EOC.17 …people are concerned with the company’s interests. 0.625
EOC.16 …the major concern is always what is best for the other person.
0.576
EOC.13 …the first consideration is whether a decision violates any law.
0.573
EOC.2 …the major responsibility for people is to consider efficiency first.
0.503
EOC.10 …people protect their own interest above other considerations.
0.687
EOC.1 …people are mostly out for themselves. 0.630
Note. Extraction Method: Principal Axis Factoring.
Rotation Method: Promax with Kaiser Normalization. a. Rotation converged in six iterations.

248
4.5.2.5 CFA Adjusted Model
The 4-factor model generated through the EFA was assessed and adjusted through
CFA. With a view to improve the model fit, the same process of covarying error terms
that are part of the same factor where modification indices is greater than 50,
assessment and removal of items with significant standardised residual variances
greater than 2.58 and those items with low loadings were undertaken. These
adjustments improved the 4-factor into a 3-factor model from reasonable to acceptable
fit as shown and discussed below:
Confirmatory Factor Analysis of the EFA Base Model
[Ethical Organisational Climate]
Confirmatory Factor Analysis of EFA Base Model (Final Model)
[Ethical Organisational Climate]
Figure 4.6 – Comparison of CFA of the EFA base model and CFA of adjusted EFA base model for
EOC construct.

249
Table 4.30
Evolution of Model Fit Indicators and Validity & Reliability Indicators & Factor Structure of Final Model [EOC Construct]
Model Fit Process CMIN df P-
value CMIN/df GFI AGFI NFI TLI CFI RMSEA PCLOSE SRMR AIC BIC
EOC EFA Base CFA 1007.43 204 0.000 4.938 0.846 0.808 0.877 0.885 0.899 0.087 0.000 0.059 1,105.4 1,314.1
EOC EFA Base CFA (Final) 328.29 86 0.000 3.817 0.923 0.893 0.941 0.946 0.955 0.073 0.000 0.034 396.3 541.1
CFA of the EFA Base Model (Validity & Reliability Indicators) CR AVE MSV MaxR(H) EOC_FacC EOC_FacA EOC_FacB EOC_FacD
EOC_FacC 0.868 0.568 0.721 0.872 0.754 EOC_FacA 0.934 0.614 0.697 0.956 0.835 0.783 EOC_FacB 0.906 0.617 0.721 0.970 0.849 0.773 0.785
EOC_FacD 0.613 0.442 0.132 0.971 0.351 0.230 0.363 0.665
CFA of the EFA Base Model (Validity & Reliability Indicators) - Final CR AVE MSV MaxR(H) EOC_FacB EOC_FacA EOC_FacC EOC_FacB 0.898 0.687 0.717 0.902 0.829 EOC_FacA 0.905 0.615 0.716 0.951 0.780 0.784 EOC_FacC 0.868 0.568 0.717 0.963 0.847 0.846 0.754

250
Table 4.31
Items & Factors of EOC
Final CFA Adjusted EFA Base Model: Items & Factors for the EOC Construct Factor 1
Factor 2
Factor 3
EOC.14 …people are expected to comply with the law and professional standards over and above other considerations.
Principle-Oriented (EOC_FacA)
EOC.15 …everyone is expected to stick by the company rules and procedures.
EOC.19 …the most efficient way is always the right way.
EOC.21 …the major consideration is what is best for everyone in the company.
EOC.25 …each person is expected, above all, to work efficiently.
EOC.27 …people view team spirit as important.
EOC.30 …people are actively concerned about the customer’s and the public’s interest.
Benevolence (EOC_FacB)
EOC.31 …people are very concerned about what is generally best for employees.
EOC.32 …what is best for each individual is a primary concern.
EOC.34 …the effect of decisions on the customer and the public are a primary concern.
EOC.2 …the major responsibility for people is to consider efficiency first.
Altruism EOC_FacC
EOC.5 …people look out for each other’s good.
EOC.13 …the first consideration is whether a decision violates any law.
EOC.16 …the major concern is always what is best for the other person.
EOC.17 …people are concerned with the company’s interests.

251
According to Organ (1988), altruism is defined as behaviour or actions “directed
towards other individuals, but contributes to group efficiency by enhancing, individual's
performance; participants help new colleagues and give freely of their time”.
Furthermore, Sharma and Jain (2014) provided a broader spectrum of altruism
covering behaviour or actions “creating a healthy and cheerful atmosphere at
workplace, listening to co-workers problems and providing solutions, trying to improve
working conditions, volunteering to take additional tasks, spreading goodwill in the
organisation, giving constructive suggestions for improvement, being enthusiastic
about my job and about co-workers welfare, helping subordinates to develop required
skills, providing suggestions to co-workers related to their work, consulting colleagues
whenever possible, following organisation's rules even when not watched, taking
initiative for new assignments, helping new employees adjust in new working
environment, protecting organisational resources”.
4.5.2.6 Key observations on the assessment of the EOC Construct
(a) 22 items initially emerged as having acceptable loadings (between .61 and .84)
under a 4-factor model generated through the EFA process.
(b) Following the model adjustments, a 3-factor model emerged with 15 items holding
improved acceptable loadings (between .62 and .87) alongside enhanced model
fit indicators. CMIN/df improved from 4.938 to 3.817, RMSEA improved from .087
to .073, CFI improved to above the .90 threshold from .899 to .955, SRMR also
improved from .059 to .034 (< .10 threshold). TLI was above the .90 threshold
(result: .946) and GFI was also above the .90 threshold (result: .923).
The CFA of the Adjusted EFA Base Model shows an acceptable fit (the final results
have mapped in the respective cells as highlighted in Table 4.32 on page 252)

252
Table 4.32
Model Fit Indices
CMIN/df GFI NFI TLI CFI RMSEA SRMR
Poor >5 <0.90 <0.90 <0.90 <0.90 >0.08 >0.10
Acceptable 3-5 >0.90 >0,90 >0,90 0.90-0.95 0.06-0.08 0.08-0.10
Excellent <3 >0.95 >0.95 >0.95 >0.95 <0.06 <0.08
Fit type Absolute Absolute Incremental Incremental Incremental Absolute Absolute
Note. Sources: Hair et al. (2014), Awang (2012), Hu & Bentler (1999), Schumacker & Lomax (2010)
(c) The factor structure emerging from the present study was compared from a
theoretical perspective with factor structures established by Victor and Cullen
(1988), Vidaver-Cohen (1995), Brower and Shrader (2000) and Barnett and
Schubert (2002). Table 4.31 shows how the various latent components of the
respective studies have been mapped and compared. Whilst examining the items
loaded in the factor structure of the present study and considering the
aforementioned theoretical perspectives, the three factors that emerged from the
present study have been labelled as follows:
Factor 1: EOC_FacA Principle-Oriented
Factor 2: EOC_FacB Benevolence
Factor 3: EOC_FacC Altruism
The emerging factors were compared to the theories underpinning EOC as shown
in Table 4.33 on page 253.

253
Table 4.33
Mapping of Confirmed Factors – A theoretical perspective (EOC)
Note. Goal emphasis: prevailing norms for selecting organisational goals
Means emphasis: prevailing norms for determining how organisation goals should be attained
Reward orientation: prevailing norms regarding how performance is rewarded
Task support: prevailing norms regarding how resources are allocated to perform specific tasks
Socio-emotional support: prevailing norms regarding the type of relationships expected in the firm
Component Victor and Cullen
(1988)
(Victor & Cullen, 1988b)
Vidaver-Cohen
(1995)
(Vidaver-Cohen,
1995)
2 different
studies: (Barnett & Schubert, 2002; Brower &
Shrader, 2000)
Brower and
Shrader (2000)
Barnett and
Schubert (2002)
The Present Study
1 Benevolence-Cosmopolitan: Social Responsibility
Benevolence
Benevolence
2 Benevolence-Individual: Friendship
3 Benevolence-Local: Team Interest
4 Egoism-Cosmopolitan: Efficiency
Egoism
5 Egoism-Individual: Self Interest
6 Egoism-Local: Company Profit
7 Principle-Cosmopolitan: Laws, Professional Codes
Principled
Principle-Orientated 8 Principle-Individual:
Personal Morality
9 Principle-Local: Rules, Standards, Operating Procedures
10 Social Emotional
Support
Altruism
11 Means
Emphasis
12 Task
Support
13 Goal
Emphasis
14 Reward
Orientation

254
(d) Out of the 3 factors extracted from the present studies and confirmed through CFA,
two of them (Principle-oriented and Benevolence) are similar to those found from
the studies undertaken by the above referenced scholars and researchers. It also
appears that respondents in the local context seem to be influenced by principal-
orientation and benevolence traits as two macro-level latent factors as opposed to
a granular perspective characterised by the model of Victor and Cullen (1988). This
phenomenon seems similar to what Brower and Shrader (2000) and Barnett and
Schubert (2002) found in their respective studies. As regards the three extractor
factors, EOC.FacC, the set of loaded items again seems to be very particular to
the local context. Whilst examining the 5 loaded items (EOC.2, EOC.5, EOC.13,
EOC.16 and EOC.17) through face validity, they appear to represent a combination
of egoism, benevolence and principle traits. However, when assessing their
specificities, it appears to project the attributes of “Altruism” in a broader sense of
its meaning and definition (Organ, 1988; Sharma & Jain, 2014).
(e) As regards the model, it has materially improved from the initial baseline model to
an acceptable fit. Nevertheless, as noted for the previous construct, there are still
some discriminant validity issues between the three factors in the final CFA model.
In this particular context, it is deemed appropriate to choose one factor as a proxy
of the EOC construct measure. Based on the theoretical assessment and the
above results, the use of EOC_FacA has been selected as a proxy construct
measure and for computation of the score. EOC_FacA loads with 6 items and
represents “Principle-oriented” from a theoretical perspective.

255
4.5.3 CFA – Baseline Model (Construct: Ethical Leadership &
Decision Making)
The third construct of Ethical Leadership & Decision Making (“ELDM”) resides within
the meso layer of the Conceptual Research Model, referred to under this section as
the Baseline Model. The ELDM construct was assessed comprehensively through a
structured statistical process and strategy, similar to that undertaken for the previous
OC & EOC constructs. The objective of this section is to present the results in a
summarised format to highlight the critical elements that emerged from the statistical
procedures without being repetitive in explaining the detailed process as undertaken
under OC. A consistent reporting approach was also maintained by focusing on the
main fit indices selected since the start.
4.5.3.1 Assessing the Baseline Model Fit through CFA
A CFA was undertaken on the Baseline Model to assess the model fit for the ELDM
construct using the data gathered through the survey. ELDM was measured through
the 38 items of Kalshoven, Den Hartog and De Hoogh (2011) grouped under seven
factors namely:
People Dimension (“ELDM_PD”)
Fairness (“ELDM_F”)
Power Sharing (“ELDM_PS”)
Concern for Sustainability (“ELDM_CS”)
Ethical Guidance (“ELDM_EG”)
Role Clarification (“ELDM_RC”)
Integrity (“ELDM_I”)
Standardized regression weights, correlations and covariances were computed for the
underlying Baseline Model and items. Furthermore, the implied covariances,
correlations and standardised residual covariance matrices were generated for
assessment and statistical computations for model fit. The model fit, construct validity
and reliability indices were computed and examined through CFA.
The initial results of the CFA indicate a poor fit. The CMIN/df was 4.071, RMSEA was
.077, CFI was .880, TLI was .869 and SRMR was .129.

256
Furthermore, discriminant validity issues were noted for two factors of the Baseline
Model of ELDM (ELDM_CS and ELDM_EG) whereby the respective AVEs were less
than their corresponding MSVs. Convergent validity issue was also noted for
ELDM_PS with an AVE of less than .50. The CR for ELDM_PS was less than .70.
4.5.3.2 Adjusting the Baseline Model Fit through CFA
In light of the above model fit results, the Baseline Model was adjusted with a view to
obtain an acceptable model fit. Modification indices and remedial measures were
considered with a view to address discrepancies as considered earlier on the basis of
theoretical grounds. This included the covarying of error terms that were part of the
same factor (where modification indices > 50), assessment and removal of items with
significant standardised residual covariances (where > 2.58), and those items with low
loadings. Eight items were excluded through this process namely ELDM.11, ELDM.12,
ELDM.13, ELDM.14, ELDM.15, ELDM.18, ELDM.19 and ELDM.39.
The above process led to an improved fit which was reasonable to acceptable
(CMIN/df improved from 4.071 to 2.830, CFI from .880 to .948, RMSEA from .077 to
.059, SRMR from .129 to .041). However, some discriminant validity issues between
ELDM_CS and ELDM_EG were still present.
An attempt was made to come up with an alternative CFA model whereby ELDM_CS
and ELDM_EG are represented as a single second order factor model. Standardised
factor loadings for both factors were > 0.90 and it can therefore calculate a single
construct measure, similar to the research approach followed by Marsh and Hocewar
(1986). This approach resulted in an acceptable fit with no discriminant and
convergent issues as depicted in Figure 4.7 on page 257 and in Table 4.34 on page
258.

257
Figure 4.7. The alternative CFA model for ELDM construct.

258
Table 4.34
Model Fit Indicators including Validity and Reliability Indicators, and Factor Structure of CFA Alternative
Model [ELDM Construct]
CMIN df CMIN/df GFI AGFI NFI TLI CFI RMSEA PCLOSE SRMR AIC BIC
1174.27 417 2.816 0.872 0.848 0.922 0.942 0.948 0.059 0.000 0.042 1,332.3 1,668.8
Note. p < .001
CR AVE MSV MaxR(H) ELDM_RC ELDM_F ELDM_I ELDM_PD ELDM_PS ELDM_CS_EG
ELDM_RC 0.940 0.757 0.748 0.945 0.870
ELDM_F 0.910 0.773 0.028 0.969 -0.159 0.879
ELDM_I 0.941 0.798 0.650 0.979 0.803 -0.101 0.893
ELDM_PD 0.948 0.721 0.549 0.985 0.645 -0.006 0.723 0.849
ELDM_PS 0.802 0.670 0.220 0.986 0.343 0.088 0.356 0.426 0.819
ELDM_CS_EG 0.937 0.881 0.748 0.988 0.865 -0.167 0.806 0.741 0.469 0.939

259
Table 4.35
List of retained Items & Factors
Final CFA Adjusted EFA Base Model: Items & Factors for the ELDM Construct Factor
Ref. Factor Labels
In the organisation I work, the leader
ELDM.1 is interested in how you feel and how you are doing.
ELDM_PD People Orientation
ELDM.2 takes time for personal contact.
ELDM.3 pays attention to your personal needs.
ELDM.4 takes time to talk about work-related emotions.
ELDM.5 is genuinely concerned about your personal development.
ELDM.6 sympathizes with you when you have problems.
ELDM.7 cares about their followers.
ELDM.8 holds you accountable for problems over which you have no control. ELDM_F Fairness
ELDM.9 holds you responsible for work that you gave no control over.
ELDM.10 holds you responsible for things that are not your fault.
ELDM.16 seeks advice from subordinates concerning organisational strategy. ELDM_PS Power
Sharing
ELDM.17 will reconsider decisions on the basis of recommendations by those who report to him/her.
ELDM.20 would like to work in an environmentally friendly manner. ELDM_CS (2nd order)
Concern for sustainability
(2nd order)
ELDM.21 shows concern for sustainability issues.
ELDM.22 stimulates recycling of items and materials in your department.
ELDM.23 clearly explains integrity related codes of conduct.
ELDM_EG
(2nd Order) Ethical Guidance (2nd order)
ELDM.24 explains what is expected from employees in terms of behaving with integrity.
ELDM.25 clarifies integrity guidelines.
ELDM.26 ensures that employees follow codes of integrity.
ELDM.27 clarifies the likely consequences of possible unethical behaviour by yourself and your colleagues.
ELDM.28 stimulates the discussion of integrity issues among employees.
ELDM.29 compliments employees who behave according to the integrity guidelines.
ELDM.30 indicates what the performance expectations of each group member are.
ELDM_RC Role
clarification
ELDM.31 explains what is expected of each group member.
ELDM.32 explains what is expected of you and your colleagues.
ELDM.33 clarifies priorities.
ELDM.34 clarifies who is responsible for what.
ELDM.35 keeps their promises. ELDM_I
Integrity ELDM.36 can be trusted to do the things they say.
ELDM.37 can be relied on to honour their commitments.
ELDM.38 always keeps their words.
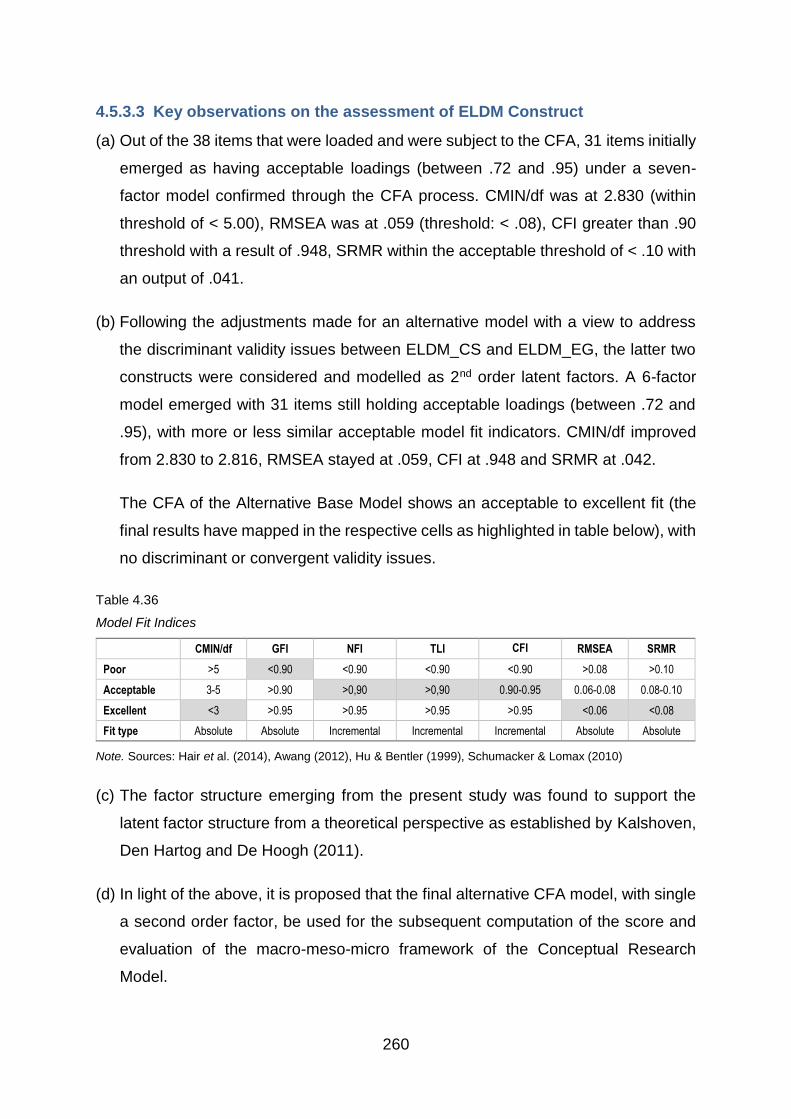
260
4.5.3.3 Key observations on the assessment of ELDM Construct
(a) Out of the 38 items that were loaded and were subject to the CFA, 31 items initially
emerged as having acceptable loadings (between .72 and .95) under a seven-
factor model confirmed through the CFA process. CMIN/df was at 2.830 (within
threshold of < 5.00), RMSEA was at .059 (threshold: < .08), CFI greater than .90
threshold with a result of .948, SRMR within the acceptable threshold of < .10 with
an output of .041.
(b) Following the adjustments made for an alternative model with a view to address
the discriminant validity issues between ELDM_CS and ELDM_EG, the latter two
constructs were considered and modelled as 2nd order latent factors. A 6-factor
model emerged with 31 items still holding acceptable loadings (between .72 and
.95), with more or less similar acceptable model fit indicators. CMIN/df improved
from 2.830 to 2.816, RMSEA stayed at .059, CFI at .948 and SRMR at .042.
The CFA of the Alternative Base Model shows an acceptable to excellent fit (the
final results have mapped in the respective cells as highlighted in table below), with
no discriminant or convergent validity issues.
Table 4.36
Model Fit Indices
CMIN/df GFI NFI TLI CFI RMSEA SRMR
Poor >5 <0.90 <0.90 <0.90 <0.90 >0.08 >0.10
Acceptable 3-5 >0.90 >0,90 >0,90 0.90-0.95 0.06-0.08 0.08-0.10
Excellent <3 >0.95 >0.95 >0.95 >0.95 <0.06 <0.08
Fit type Absolute Absolute Incremental Incremental Incremental Absolute Absolute
Note. Sources: Hair et al. (2014), Awang (2012), Hu & Bentler (1999), Schumacker & Lomax (2010)
(c) The factor structure emerging from the present study was found to support the
latent factor structure from a theoretical perspective as established by Kalshoven,
Den Hartog and De Hoogh (2011).
(d) In light of the above, it is proposed that the final alternative CFA model, with single
a second order factor, be used for the subsequent computation of the score and
evaluation of the macro-meso-micro framework of the Conceptual Research
Model.

261
4.5.4 CFA – Baseline Model (Construct: Internal & External
Workplace Pressures)
The fourth construct that lies within the meso layer of the Conceptual Research Model
is referred to as Internal & External Workplace Pressures (“IEWP”), or Baseline Model
under this section. The IEWP construct was assessed through a similar structured
statistical process and strategy, as undertaken for the previous construct, ELDM. The
objective of this section is to present the results in a concise format highlighting the
main outcomes from the applied statistical procedures and tests.
Standardized regression weights, correlations and covariances were computed for the
underlying Baseline Model and items, including the implied covariances, correlations
and standardised residual covariance matrices. The model fit, construct validity and
reliability indices were also computed and examined.
4.5.4.1 Assessing the Baseline Model Fit through CFA
A CFA was undertaken on the Baseline Model to assess the model fit for the IEWP
construct using the data gathered through the survey. IEWP was measured through
an adapted instrument basing on the research work on factors eliciting managerial
unethical decision making (Lasakova & Remisova, 2017). Nine items were drawn from
the scales used by Lasakova and Remisova (2017). Given the limited scales available
to specifically measure this construct, the earlier scale of nine items were adapted and
supplemented by another set of 19 items drawn from literature reviews with an
objective to measure workplace pressure in the local context and respond to the
research questions of the present study. This led to a total of 28 items grouped under
4 factors namely:
Prioritisation of Economic Results (“IEWP_PER”)
Violation of Internal Ethical Guidelines (“IEWP_VIEG”)
Situational Tensions (“IEWP_ST”)
Personal Situational Stress (“IEWP_PSS”)
The first three factors were identified in the research work of Lasakova and Remisova
(2017). The new set of items that were added to supplement the measurement of the
IEWP construct in the context of this present research was mapped on these three

262
factors based on face validity of these supplementary items. Out of the 19
supplementary items, six of these had to be classified under a new and more specific
factor “Personal Situational Stress” given the nature of these items and their specific
connection with the personal situation of an individual in the workplace.
The initial results of the CFA indicated a poor fit. The CMIN/df was 13.102 (threshold
limit being < 5.00 to indicate an acceptable level), RMSEA was .152 (threshold limit
being < .08 to indicate an acceptable fit), CFI was .650 and TLI was .615 (both
indicators should be > .90 to demonstrate an acceptable fit), and SRMR was .199
(threshold limit being < .10 for acceptable fit).
Furthermore, discriminant validity issues were noted for three factors of the Baseline
Model of IEWP whereby the respective AVEs were less than their corresponding
MSVs mainly for IEWP_PSS and IEWP_PER. Convergent validity issues were also
noted for IEWP_PSS, IEWP_VIEG and IEWP_ST whereby their respective AVEs
were less than .50.
4.5.4.2 Adjusting the Baseline Model Fit through CFA
Given the initial results suggested a poor fit, the Baseline Model was adjusted with a
view to obtain an acceptable model fit through modification indices and remedial
measures to address potential discrepancies. This included the covarying of error
terms that are part of the same factor (where modification indices > 50), assessment
and removal of items with significant standardised residual covariances (where > 2.58,
indicating that a particular variance is not well explained by the Baseline Model), and
those items with low loadings. A total of 15 items were excluded through this process.
The above process led to a reasonable to acceptable fit (CMIN/df improved from
13.102 to 4.819, CFI from .650 to .958, RMSEA from .152 to .086 and SRMR from
.199 to .038. However, some discriminant validity issues between IEWP_PER,
IEWP_ST and IEWP_PSS were noted as shown in the Figure 4.8 on page 263 and
Table 4.37 on page 264 of the thesis.

263
Figure 4.8. The adjusted CFA model for IEWP construct.

264
Table 4.37
Model Fit Indicators, Validity & Reliability Indicators and Factor Structure of CFA Models [IEWP Construct]
Model Fit Process CMIN df CMIN/df
P-value
GFI AGFI NFI TLI CFI RMSEA PCLOSE SRMR AIC BIC
1. IEWP Base CFA 4507.02 344 13.102 0.000 0.560 0.480 0.633 0.615 0.650 0.152 0.000 0.199 4,631.0 4,895.1
2. IEWP Base (Adjusted) CFA 274.71 57 4.819 0.000 0.922 0.875 0.948 0.943 0.958 0.086 0.000 0.038 342.7 487.5
CFA of the IEWP Base Model (Validity & Reliability Indicators)
CR AVE MSV
MaxR(H) IEWP_PSS IEWP_PER IEWP_VIEG IEWP_ST
IEWP_PSS 0.842 0.491 0.947
0.894 0.700
IEWP_PER 0.864 0.537 1.018
0.950 0.960 0.733
IEWP_VIEG 0.859 0.457 0.176
0.965 0.364 0.273 0.676
IEWP_ST 0.846 0.424 1.018
0.973 0.973 1.009 0.419 0.652
CFA of the IEWP (Adjusted) Base Model (Validity & Reliability Indicators)
CR AVE MSV
MaxR(H) IEWP_PSS IEWP_PER IEWP_VIEG IEWP_ST
IEWP_PSS 0.872 0.630 0.966
0.884 0.794
IEWP_PER 0.858 0.751 1.077
0.932 0.948 0.867
IEWP_VIEG 0.861 0.609 0.034
0.953 0.184 0.069 0.780
IEWP_ST 0.875 0.700 1.077
0.965 0.983 1.038 0.135 0.837

265
Final CFA Adjusted Model: Items & Factors for the IEWP Construct Factor 1
Factor 2
Factor 3
Factor 4
IEWP.22 to ensure financial success of the company Prioritisation of Economic Results
(IEWP _PER)
IEWP.26 to continually innovate to gain efficiency
IEWP.2 unfair human resource management policies prevail
Violations of
Ethical Guidelines
(IEWP _VIEG)
IEWP.3 unethical behaviour of superiors is felt
IEWP.6 it is unclear which behaviours are ethical/unethical
IEWP.9 bad (ineffective) organisation of workflow is prevalent
IEWP.20
from clients for favourable terms otherwise there is risk to lose the
business
Situational Stress
(IEWP _ST)
IEWP.23 to protect the company's image
IEWP.25 from powerful groups of employees to abide to their demands
IEWP.16 to keep your job
Personal
Situational
Stress
(IEWP_PSS)
IEWP.17 to meet your personal financial obligations
IEWP.21 to progress your career for better pay and living
IEWP.24 to protect your personal/family reputation

266
4.5.4.3 Key observations on the assessment of the IEWP Construct
(a) An examination of the retained items post CFA was conducted. It was noted that
out of the original 28 items, 15 items were properly loaded onto the four latent
constructs. In particular, the items originating from Lasakova and Remisova (2017)
study were loaded consistently as per their original confirmed factor structure.
(b) The 15 items held acceptable loadings (between .72 and .88) along with
reasonable to acceptable model fit indicators. Following model adjustments,
CMIN/df improved from 13.102 to 4.818, RMSEA reduced from .152 to .086, CFI
increased from .650 to .958 and SRMR reduced from .199 to .038.
The CFA of Alternative Base Model shows a reasonable to acceptable fit (the final
results have mapped in the respective cells as highlighted in table below).
Table 4.38
Model Fit Indices
CMIN/df GFI NFI TLI CFI RMSEA SRMR
Poor >5 <0.90 <0.90 <0.90 <0.90 >0.08 >0.10
Acceptable 3-5 >0.90 >0,90 >0,90 0.90-0.95 0.06-0.08 0.08-0.10
Excellent <3 >0.95 >0.95 >0.95 >0.95 <0.06 <0.08
Fit type Absolute Absolute Incremental Incremental Incremental Absolute Absolute
Note. Sources: Hair et al. (2014), Awang (2012), Hu & Bentler (1999), Schumacker & Lomax (2010)
(c) Though the model has considerably improved from the initial baseline model to a
reasonable and acceptable fit, there are still some discriminant validity issues in
the final CFA model between the three factors IEWP_PER, IEWP_ST and
IEWP_PSS. In this particular context and with a view to embrace a consistent
approach, it was deemed appropriate to choose one factor as a proxy of the IEWP
as was done for the OC & EOC constructs. Based on the theoretical assessment
and the above results, the use of IEWP_VIEG was selected as a proxy of a
construct measure and for computation of the score. IEWP_VIEG loads with 4
items and represents “Violations of Internal Ethical Guidelines” from a theoretical
perspective. This selection was also motivated by the fact that IEWP, being a meso
construct, leans more towards the organisational processes and aligns well with
the underlying organisational ethical imperatives, objectives and scope of the
overall study.

267
4.5.5 CFA – Baseline Model (Construct: Organisational Citizenship
Behaviour)
The fifth construct, Organisational Citizenship Behaviour (“OCB”), resides in the micro
layer of the Conceptual Research Model. OCB, or the Baseline Model under this
section, is the first micro level construct (dependent variable) and has been assessed
through a similar structured statistical strategy and process as was undertaken for the
macro layer OC and EOC constructs (independent) with a statistical assessment
journey necessitating both EFA and CFA. The objective of this section is to present
the results concisely highlighting the key findings that emerged from the statistical
procedures.
4.5.5.1 Assessing the Baseline Model Fit through CFA
A CFA was undertaken on the Baseline Model to assess the model fit for the OCB
construct using the data gathered through the survey. OCB was measured through 24
items of Podsakoff et al.(1990), (Argentero et al., 2008). The 24 items measuring OCB
were grouped under 5 factors as established by Podsakoff et al. (1990) namely:
Altruism (“OCB_A”)
Conscientiousness (“OCB_CON”)
Sportsmanship (“OCB_S”)
Courtesy (“OCB_COU”)
Civic Virtue (“OCB_CV”)
Prior to the computation of model fit indices, standardized regression weights,
correlations and covariances were computed for the underlying Baseline Model and
its corresponding items. The implied covariances, correlations and standardised
residual covariance matrices were also generated.
The model fit, construct validity and reliability indices were also computed and
examined to ascertain the degree of model fit, validity and reliability of the underlying
construct. The initial results of the CFA indicated a poor fit. The CMIN/df was 7.602
(threshold limit being < 5.00 to indicate an acceptable level), RMSEA was .112
(threshold limit being < .08 to indicate an acceptable fit), CFI was .743 and TLI was

268
.706 (both indicators should be > .90 to demonstrate an acceptable fit), and SRMR
was .099 marginally below the threshold limit of .10.
Furthermore, discriminant validity issues were noted for all the factors of the Baseline
Model of OCB, where the respective AVEs were less than their corresponding MSVs.
Convergent validity issues were also noted for OCB_S, OCB_CV, OCB_CON and
OCB_COU, where their respective AVEs were less than .50. The CRs for OCB_S,
OCB_CON and OCB_COU were less than .70. On the basis of the preliminary
outcomes, it was deemed appropriate to conduct a single factor test to determine if
the underlying construct is a single or multi-factor baseline model.
4.5.5.2 Identifying Common Method Variance
The Harman’s Single Factor test was conducted to identify common method variance
of the 24 items measuring OCB.
A correlation matrix was generated with the correlation coefficients of the 24 items.
The KMO Measure of Sampling Adequacy and Bartlett’s Test of Sphericity were
computed as follows:
Table 4.39
KMO & Bartlett’s Results
Kaiser-Meyer-Olkin Measure of Sampling Adequacy. 0.929
Bartlett's Test of Sphericity Approx. Chi-Square 6371.937
df 276
Sig. 0.000
Note. p < .001
The KMO measure, which generally indicates whether or not the variables are able to
be grouped into a smaller number of underlying factors, resulted in a figure of .929
reflecting a strong adequacy level of the sample for factor analysis. From the result of
the Bartlett’s Test of Sphericity, it is noted that p < .05 thereby indicating that there is
a structure within the observed correlation matrix and hence would be appropriate for
a Principal Component Analysis (“PCA”).
A table of Communalities was generated showing how much of variance in the 24
OCB variables has been accounted for by the extracted factors, using PCA as
extraction method. The Extraction Sums of Squared Loadings % of Variance was also
computed and a result of 37.7% was obtained for one component extracted,
269
suggesting a multi-factor model for OCB, hence rejecting the null hypothesis. The
proposed next step was to continue with model fit adjustments.
4.5.5.3 Adjusting the Baseline Model (CFA Adjusted Model)
In light of the above model fit results and a multi-factor structure being suggested, the
next course of action was to adjust the Baseline Model with a view to obtain an
acceptable model fit. Modification indices and remedial measures were considered
with a view to address discrepancies between the Baseline Model and the estimated
model. This included the covarying of error terms that were part of the same factor
(where modification indices > 50 and considering the theory), assessment and
removal of items with significant standardised residual covariances (where > 2.58 to
address any particular covariance not well explained by the model), and those items
with low loadings.
Though the above process led to an improved fit (CMIN/df improved from 7.602 to
6.187, CFI from .743 to .867, RMSEA from .112 to .100, SRMR from .099 to .065), it
was still not acceptable and continued to demonstrate a lack of discriminant validity
despite the selective model fit adjustments. On the basis of these results, the conduct
of an EFA was required to propose a new measurement model that could be defended
on theoretical grounds.
4.5.5.4 Conducting EFA
An EFA was conducted to explore the latent factors that best represent the variations
and interrelationships of the underlying observed items and to potentially generate a
new theory that could be further assessed and confirmed through a CFA.
A factor extraction process was effected using Principal Axis Factoring as the
extraction method and Promax as the rotation method. The preliminary runs
suggested a multi-factor model (five constructs holding eigenvalues of > 1 and with
cumulated Extraction Sums of Squared Loadings of 54.5%).
The corresponding factor matrix (five factors generated through 15 iterations), pattern
matrix (rotation converged in eight iterations), structure matrix and factor correlation
matrix were generated and assessed.

270
As there were no items with low communalities (< 0.30), the original set of items were
maintained. However, five items were removed (namely OCB.7r, OCB.6, OCB.1,
OCB.18 and OCB.10) due to high cross-loadings (< .20).
Three items with low loadings (<0.5), OCB.21, OCB.12 and OCB.20, were removed
with an aim to obtain an average loading of > 0.6. The resulting output tables providing
the communalities, factor matrix, pattern matrix, structure matrix and factor correlation
matrix are provided below:
Table 4.40
Communalities (EFA) – OCB Construct
Initial Extraction
OCB.2 …you do your job without constant requests from your boss. 0.486 0.501
OCB.3 …you believe in giving an honest day’s work for an honest day’s pay. 0.515 0.519
OCB.4 …you do not waste time complaining about trivial matters. 0.544 0.823
OCB.5 …you try to avoid creating problems for co-workers. 0.491 0.495
OCB.8r …you do not consider the impact of your actions on co-workers. [8R] 0.335 0.448
OCB.9 …you attend meetings that are not mandatory, but important. 0.411 0.389
OCB.11 …you attend functions that are not required but help the company image. 0.468 0.508
OCB.13 …you help others who have been absent. 0.514 0.529
OCB.14 …you respect the rights of people that work with you. 0.605 0.628
OCB.15 …you willingly help others who have work related problems. 0.649 0.662
OCB.16 …you always focus on what is right, rather than what is wrong. 0.616 0.673
OCB.17 …you take steps to try to avoid problems with other workers. 0.393 0.429
OCB.19r …you always find fault with what the organisation is doing. [R] 0.287 0.362
OCB.22 …you respect company rules and policies even when no one is watching you. 0.497 0.508
OCB.23 …you guide new people even though it is not required. 0.496 0.514
OCB.24 …you are one of the most conscientious employees. 0.519 0.530

271
Table 4.41
Total Variance Explained (EFA) – OCB Construct
Factor
Initial Eigenvalues
Extraction Sums of Squared Loadings
Rotation Sums of Squared Loadingsa
Total % of
Variance Cumulative
% Total % of
Variance Cumulative
% Total
1 6.389 39.929 39.929 5.948 37.178 37.178 5.579
2 2.227 13.921 53.850 1.713 10.708 47.885 3.053
3 1.235 7.721 61.571 0.856 5.349 53.234 3.533
4 0.790 4.940 66.511
5 0.691 4.322 70.832
6 0.660 4.128 74.961
7 0.591 3.693 78.654
8 0.542 3.387 82.040
9 0.492 3.076 85.116
10 0.417 2.606 87.722
11 0.396 2.476 90.199
12 0.366 2.285 92.484
13 0.354 2.210 94.693
14 0.317 1.980 96.673
15 0.280 1.753 98.426
16 0.252 1.574 100.000
Note. Extraction Method: Principal Axis Factoring. a. When factors are correlated, sums of squared loadings cannot be added to obtain a total variance.
Table 4.42
Factor Matrixa (EFA) – OCB Construct
Factor
1 2 3
OCB.15 …you willingly help others who have work related problems. 0.783
OCB.16 …you always focus on what is right, rather than what is wrong. 0.779
OCB.14 …you respect the rights of people that work with you. 0.768
OCB.13 …you help others who have been absent. 0.700
OCB.24 …you are one of the most conscientious employees. 0.688
OCB.23 …you guide new people even though it is not required. 0.678
OCB.22 …you respect company rules and policies even when no one is watching you.
0.667
OCB.2 …you do your job without constant requests from your boss. 0.622 0.321
OCB.3 …you believe in giving an honest day’s work for an honest day’s pay. 0.609 0.355
OCB.5 …you try to avoid creating problems for co-workers. 0.562 0.332
OCB.11 …you attend functions that are not required but help the company image.
0.543 -0.454
OCB.9 …you attend meetings that are not mandatory, but important. 0.509 -0.335
OCB.8r …you do not consider the impact of your actions on co-workers. [8R] 0.526
OCB.19r …you always find fault with what the organisation is doing. [R] 0.511
OCB.17 …you take steps to try to avoid problems with other workers. 0.443 -0.465
OCB.4 …you do not waste time complaining about trivial matters. 0.545 0.427 -0.586
Note. Extraction Method: Principal Axis Factoring. a. Three factors extracted. 20 iterations required.

272
Table 4.43
Pattern Matrixa (EFA) – OCB Construct
Factor
1 2 3
OCB.15 …you willingly help others who have work related problems. 0.807
OCB.16 …you always focus on what is right, rather than what is wrong. 0.793
OCB.23 …you guide new people even though it is not required. 0.751
OCB.14 …you respect the rights of people that work with you. 0.747
OCB.22 …you respect company rules and policies even when no one is watching you.
0.734
OCB.13 …you help others who have been absent. 0.687
OCB.24 …you are one of the most conscientious employees. 0.591
OCB.8r …you do not consider the impact of your actions on co-workers. [8R] -0.726
OCB.19r …you always find fault with what the organisation is doing. [R] -0.643
OCB.17 …you take steps to try to avoid problems with other workers. 0.600
OCB.11 …you attend functions that are not required but help the company image.
0.583
OCB.9 …you attend meetings that are not mandatory, but important. 0.501
OCB.4 …you do not waste time complaining about trivial matters. 1.001
OCB.5 …you try to avoid creating problems for co-workers. 0.614
OCB.3 …you believe in giving an honest day’s work for an honest day’s pay. 0.311 0.520
OCB.2 …you do your job without constant requests from your boss. 0.360 0.463
Note. Extraction Method: Principal Axis Factoring.
Rotation Method: Promax with Kaiser Normalization. a. Rotation converged in six iterations.
Table 4.44
Structure Matrix (EFA) – OCB Construct
Factor
1 2 3
OCB.15 …you willingly help others who have work related problems. 0.811 0.416 0.417
OCB.16 …you always focus on what is right, rather than what is wrong. 0.807 0.542
OCB.14 …you respect the rights of people that work with you. 0.787 0.312 0.512
OCB.13 …you help others who have been absent. 0.716 0.431 0.347
OCB.23 …you guide new people even though it is not required. 0.715 0.331 0.352
OCB.22 …you respect company rules and policies even when no one is watching you.
0.704 0.431
OCB.24 …you are one of the most conscientious employees. 0.683 0.530 0.310
OCB.11 …you attend functions that are not required but help the company image.
0.482 0.685
OCB.8r …you do not consider the impact of your actions on co-workers. [8R] -0.656
OCB.17 …you take steps to try to avoid problems with other workers. 0.373 0.649
OCB.19r …you always find fault with what the organisation is doing. [R] -0.591
OCB.9 …you attend meetings that are not mandatory, but important. 0.440 0.588
OCB.4 …you do not waste time complaining about trivial matters. 0.387 0.891
OCB.5 …you try to avoid creating problems for co-workers. 0.485 0.693
OCB.3 …you believe in giving an honest day’s work for an honest day’s pay. 0.561 0.682
OCB.2 …you do your job without constant requests from your boss. 0.583 0.654
Note. Extraction Method: Principal Axis Factoring.
Rotation Method: Promax with Kaiser Normalization.

273
Table 4.45
Factor Correlation Matrix (EFA) – OCB Construct
Factor 1 2 3
1 1.000 0.449 0.557
2 0.449 1.000 0.129
3 0.557 0.129 1.000
Note. Extraction Method: Principal Axis Factoring. Rotation Method: Promax with Kaiser Normalization.
4.5.6 CFA Adjusted Model
The 3-factor model generated through the EFA was assessed and adjusted through
CFA. With a view to improve the model fit, the same process of covarying error terms
that were part of the same factor where modification indices is greater than .50,
assessment and removal of items with significant standardised residual variances
greater than 2.58 and those items with low loadings were undertaken. These
adjustments improved the 3-factor model from a reasonable to acceptable fit as shown
and discussed below:
Confirmatory Factor Analysis of the EFA Base Model
[Organisational Citizenship Behaviour]
Confirmatory Factor Analysis of EFA Base Model (Final Model)
[Organisational Citizenship Behaviour]
Figure 4.9. Comparison of CFA of the EFA base model and CFA of adjusted EFA base model for
OCB construct

274
Table 4.46
Evolution of Model Fit Indicators and Validity & Reliability Indicators & Factor Structure of Final Model [OCB Construct]
Model Fit Process CMIN df P-value CMIN/df GFI AGFI NFI TLI CFI RMSEA PCLOSE SRMR AIC BIC
1. OCB EFA Base CFA 514.71 101 0.000 5.096 0.889 0.851 0.871 0.873 0.893 0.089 0.000 0.069 584.7 733.8
2. OCB EFA Base CFA (Final) 173.59 50 0.000 3.472 0.947 0.917 0.944 0.946 0.959 0.069 0.003 0.042 229.6 348.9
CFA of the IEWP Base Model (Validity & Reliability Indicators)
CR AVE MSV MaxR(H) OCB_FacB OCB_FacC OCB_FacA
OCB_FacB 0.235 0.397 0.328 0.784 0.630
OCB_FacC 0.822 0.536 0.484 0.892 -0.292 0.732
OCB_FacA 0.898 0.557 0.484 0.947 -0.573 0.696 0.747
CFA of the EFA Base Model (Validity & Reliability Indicators) - Final
CR AVE MSV MaxR(H) OCB_FacB OCB_FacC OCB_FacA
OCB_FacB 0.712 0.554 0.352 0.716 0.744
OCB_FacC 0.801 0.504 0.518 0.875 0.363 0.710
OCB_FacA 0.891 0.577 0.518 0.941 0.593 0.720 0.760
Final CFA Adjusted EFA Model: Items & Factors for the OCB Construct Factor
1 Factor
2 Factor
3
OCB.13 …you help others who have been absent
Altruism
(OCB_FacA)
OCB.14 …you respect the rights of people that work with you.
OCB.15 …you willingly help others who have work related problems.
OCB.16 …you always focus on what is right, rather than what is wrong.
OCB.22 …you respect company rules and policies even when no one is watching you.
OCB.23 …you guide new people even though it is not required
OCB.9 …you attend meetings that are not mandatory, but important. Civic Virtue
(OCB_FacB)
OCB.11 …you attend functions that are not required but help the company image.
OCB.2 …you do your job without constant requests from your boss
Sportsmanship
(OCB_FacC)
OCB.3 …you believe in giving an honest day’s work for an honest day’s pay
OCB.4 …you do not waste time complaining about trivial matters.
OCB.5 …you try to avoid creating problems for co-workers.

275
Some discriminant validity issues between OCB_FacA and OCB_FacC were noted.
They were assessed on theoretical grounds, as shown above, so as to select one
factor as a proxy of construct measure for subsequent analysis.
4.5.6.1 Key observations on the assessment of the OCB Construct
(a) Out of the 24 items under a five-factor structure originally, 16 items initially
emerged with loadings (between .51 and .83) but under a three-factor model
generated through the EFA process
(b) Following the model adjustments and CFA, the 3-factor model was confirmed, with
12 items emerging with improved acceptable loadings (between .61 and .83) along
with enhanced model fit indicators. CMIN/df improved from 5.096 to 3.472, RMSEA
improved from .089 to .069, CFI improved to above the .90 threshold, i.e. from .893
to .959, SRMR also improved within the acceptable range from .069 to .042
(threshold: < .10).
The CFA of the Adjusted EFA Base Model shows an acceptable fit (the final results
have mapped in the respective cells as highlighted in table below):
Table 4.47
Model Fit Indices
CMIN/df GFI NFI TLI CFI RMSEA SRMR
Poor >5 <0.90 <0.90 <0.90 <0.90 >0.08 >0.10
Acceptable 3-5 >0.90 >0,90 >0,90 0.90-0.95 0.06-0.08 0.08-0.10
Excellent <3 >0.95 >0.95 >0.95 >0.95 <0.06 <0.08
Fit type Absolute Absolute Incremental Incremental Incremental Absolute Absolute
Note. Sources: Hair et al. (2014), Awang (2012), Hu & Bentler (1999), Schumacker & Lomax (2010)
(c) The factor structure emerging from the present study was assessed from a
theoretical perspective with factor structures established from the studies of Smith,
Organ and Near (1983), Organ (1988, 1990), Podsakoff et al. (1990) and Sharma
and Jain (2014). Table 4.48 on page 276 of the thesis shows how the various latent
components of the respective studies have been mapped and compared. Whilst
examining the items loaded in the factor structure of the present study and
considering the aforementioned theoretical perspectives, the three factors that
emerged from the present study have been labelled as follows:

276
Factor 1: OCB_FacA Altruism
Factor 2: OCB_FacB Civic Virtue
Factor 3: OCB_FacC Sportsmanship
Table 4.48
Mapping of Confirmed Factors – A theoretical perspective (OCB)
Component Smith et. al (1983)
(C. A. Smith et al., 1983)
Organ (1988, 1990)
(Dennis W. Organ, 1988)
Podsakoff et al. (1990)
(P. M. Podsakoff et al., 1990)
Sharma & Jain (2014
(Sharma & Jain, 2014)
Present Study
1 Altruism Altruism Altruism Altruism Altruism
2 Conscientiousness Conscientiousness Conscientiousness
3 Sportsmanship Sportsmanship Sportsmanship Sportsmanship
4 Courtesy Courtesy
5 Civic Virtue Civic Virtue Civic Virtue
6 Cheerleading
7 Peace making
8 Org.
Compliance
9 Loyalty
(d) The three factors extracted from the present studies and confirmed through CFA
were found to be similar to those found from the studies undertaken by the above
referenced scholars and researchers. Three items from the scale of Podsakoff et.
al (1990), earlier classified under courtesy, conscientiousness, and sportsmanship
loaded strongly on factor OCB_FacA in the present study. An examination of these
items revealed them to be closely related to “Altruism”, considering the broader
definition put forward by Sharma and Jain (2014) and Organ (1988). A similar
pattern was noted for OCB_FacC, where two items of the original scale (courtesy
and consciousness) loaded better on OCB_FacC (labelled as “Sportsmanship”
when examining the nature of the loaded items against the broader theoretical
definitions. It thus appears that respondents in the local context seem to hold a
broader view and understanding of altruism and sportsmanship as opposed to
being able to identify specific nuances which might categorise some items, say
under courtesy or conscientiousness.

277
(e) The model materially improved from the initial baseline model to an acceptable fit
following the EFA and CFA procedures. Nevertheless, as noted for certain of the
previous constructs, there are still some discriminant validity issues in the final CFA
model between OCB_FacA and OCB_FacC. In this particular context, it was
deemed appropriate to choose one factor as a proxy of the OCB construct
measure. Based on the theoretical assessment and the above results, the
OCB_FacA has been selected as a proxy of a construct measure and for
computation of the score. OCB_FacA loads with six items and represents
“Altruism” from a broader theoretical perspective.
4.5.7 CFA – Baseline Model (Construct: Ethical Employee
Behaviour and Conduct)
The sixth construct that lies within the micro layer of the Conceptual Research Model
is referred to as Ethical Employee Behaviour and Conduct (“EEBC”), or Baseline
Model under this section. As per the adopted strategy and statistical procedures
undertaken for the earlier constructs, the EEBC construct was also subject to similar
statistical tests and assessment. The objective of this section is to present the results
in a concise manner highlighting the main outcomes from the applied statistical tests.
4.5.7.1 Assessing the Baseline Model Fit through CFA
A CFA was undertaken on the Baseline Model to assess the model fit for the EEBC
construct using the data gathered through the survey. Like the IEWP, the EEBC was
also measured through an adapted instrument based on the scale of measurement of
questionable behaviour of Maesschalck (2004) and the Global Business Ethics
Surveys (Ethics & Compliance Initiative, 2016, 2018c, 2018a, 2018b).
The EEBC construct was measured using 46 items. A total of 31 items were drawn
from the scales used by Maesschalck (2004) and 15 supplementary items were drawn
from the Ethics & Compliance Initiative (2018). These were marginally adapted to
create a broader base of items, without affecting the validity and reliability of the
originally validated instrument, that could help to study and compare the local ethical
practices and standards with those reported globally as well as respond to the

278
research question put forward in this regard. The 46 items grouped under 10 factors
namely:
Self Interest (“EEBC_SI”)
Organisational Interest (“EEBC_OI”)
Efficiency (“EEBC_E”)
Friendship (“EEBC_F”)
Team Interest (“EEBC_TI”)
Stakeholder Orientation (“EEBC_SO”)
Personal Morality (“EEBC_PM”)
Rules & Law (“EEBC_R&L”)
Public Interest (“EEBC_PI”)
Global Perspective (“EEBC_GP”)
The first nine factors were identified in the research work of Maesschalck (2004). The
new set of items that supplemented the measurement of the EEBC was mapped onto
a new factor Global Perspective EEBC_GP. Based on statistical assessments, the
Harman's single factor tests support the notion of a single factor, EEBC_GP for items
EEBC.32 to EEBC.46. A Cronbach alpha of .953 is reported accordingly.
Standardized regression weights, correlations and covariances were computed for the
EEBC construct and its corresponding items. The implied covariances, correlations
and standardised residual covariance matrices were also generated.
The initial results of the CFA indicated a poor fit. The CMIN/df was 3.320 (threshold
limit needs to be < 5.00 to indicate an acceptable level), the RMSEA was .067
(threshold limit needs to be < .08 to indicate an acceptable fit), The CFI was .877 and
the TLI was .866 (both indicators should be > .90 to demonstrate an acceptable fit),
and the SRMR was .078 and within the threshold limit of < .10.
Furthermore, discriminant validity issues were noted for two factors of the Baseline
Model of EEBC, where the respective AVEs were less than their corresponding MSVs
mainly for EEBC_PM and EEBC_OI. A convergent validity issue was also noted for
EEBC_PM, where the reported AVE was less than .50.

279
4.5.7.2 Adjusting the Baseline Model Fit through CFA
Given the initial results suggesting a poor fit, the Baseline Model was adjusted to
obtain an acceptable model fit through modification indices and remedial measures to
address potential discrepancies. This included the covarying of error terms that are
part of the same factor (where modification indices > 50), assessment and removal of
items with significant standardised residual covariances (where >2.58), and those
items with low loadings. A total of 11 items were excluded through this process
resulting in a revised factor structure with 35 retained items.
The above process led to a reasonable to acceptable fit (CMIN/df improved from 3.320
to 2.586, CFI from .877 to .942, RMSEA from .067 to .055, SRMR from .078 to .045.
No validity issues were noted following these statistical adjustments as shown in
Figure 4.10 on page 280 and Table 4.49 on page 281:

280
Figure 4.10. The adjusted CFA model of EEBC construct.
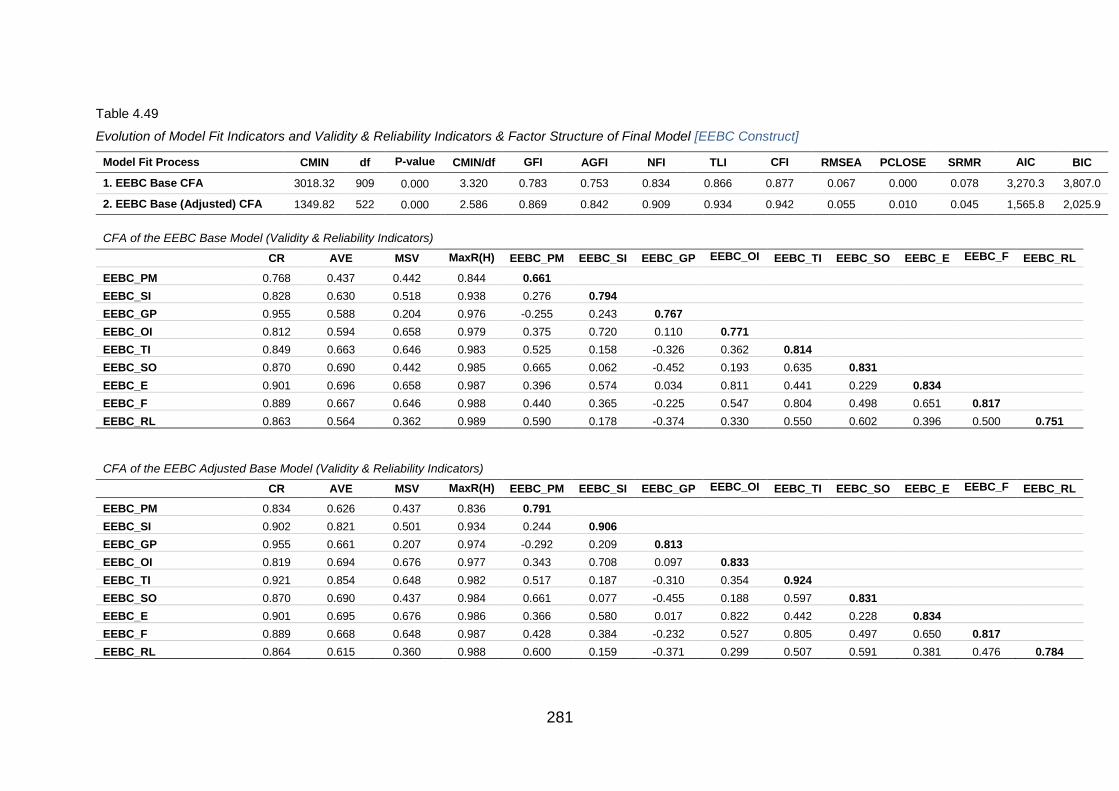
281
Table 4.49
Evolution of Model Fit Indicators and Validity & Reliability Indicators & Factor Structure of Final Model [EEBC Construct]
Model Fit Process CMIN df P-value CMIN/df GFI AGFI NFI TLI CFI RMSEA PCLOSE SRMR AIC BIC
1. EEBC Base CFA 3018.32 909 0.000 3.320 0.783 0.753 0.834 0.866 0.877 0.067 0.000 0.078 3,270.3 3,807.0
2. EEBC Base (Adjusted) CFA 1349.82 522 0.000 2.586 0.869 0.842 0.909 0.934 0.942 0.055 0.010 0.045 1,565.8 2,025.9
CFA of the EEBC Base Model (Validity & Reliability Indicators)
CR AVE MSV MaxR(H) EEBC_PM EEBC_SI EEBC_GP EEBC_OI EEBC_TI EEBC_SO EEBC_E EEBC_F EEBC_RL
EEBC_PM 0.768 0.437 0.442 0.844 0.661
EEBC_SI 0.828 0.630 0.518 0.938 0.276 0.794
EEBC_GP 0.955 0.588 0.204 0.976 -0.255 0.243 0.767
EEBC_OI 0.812 0.594 0.658 0.979 0.375 0.720 0.110 0.771
EEBC_TI 0.849 0.663 0.646 0.983 0.525 0.158 -0.326 0.362 0.814
EEBC_SO 0.870 0.690 0.442 0.985 0.665 0.062 -0.452 0.193 0.635 0.831
EEBC_E 0.901 0.696 0.658 0.987 0.396 0.574 0.034 0.811 0.441 0.229 0.834
EEBC_F 0.889 0.667 0.646 0.988 0.440 0.365 -0.225 0.547 0.804 0.498 0.651 0.817
EEBC_RL 0.863 0.564 0.362 0.989 0.590 0.178 -0.374 0.330 0.550 0.602 0.396 0.500 0.751
CFA of the EEBC Adjusted Base Model (Validity & Reliability Indicators)
CR AVE MSV MaxR(H) EEBC_PM EEBC_SI EEBC_GP EEBC_OI EEBC_TI EEBC_SO EEBC_E EEBC_F EEBC_RL
EEBC_PM 0.834 0.626 0.437 0.836 0.791
EEBC_SI 0.902 0.821 0.501 0.934 0.244 0.906
EEBC_GP 0.955 0.661 0.207 0.974 -0.292 0.209 0.813
EEBC_OI 0.819 0.694 0.676 0.977 0.343 0.708 0.097 0.833
EEBC_TI 0.921 0.854 0.648 0.982 0.517 0.187 -0.310 0.354 0.924
EEBC_SO 0.870 0.690 0.437 0.984 0.661 0.077 -0.455 0.188 0.597 0.831
EEBC_E 0.901 0.695 0.676 0.986 0.366 0.580 0.017 0.822 0.442 0.228 0.834
EEBC_F 0.889 0.668 0.648 0.987 0.428 0.384 -0.232 0.527 0.805 0.497 0.650 0.817
EEBC_RL 0.864 0.615 0.360 0.988 0.600 0.159 -0.371 0.299 0.507 0.591 0.381 0.476 0.784
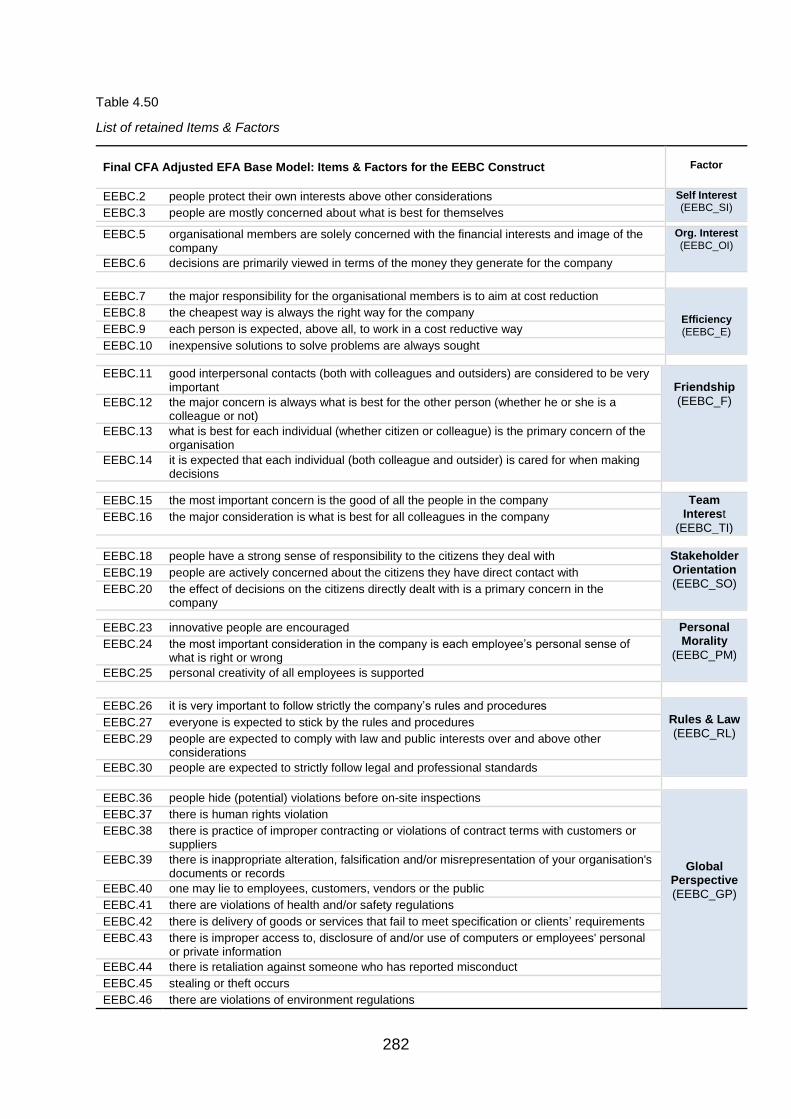
282
Table 4.50
List of retained Items & Factors
Final CFA Adjusted EFA Base Model: Items & Factors for the EEBC Construct
Factor
EEBC.2 people protect their own interests above other considerations Self Interest (EEBC_SI)
EEBC.3 people are mostly concerned about what is best for themselves
EEBC.5 organisational members are solely concerned with the financial interests and image of the company
Org. Interest (EEBC_OI)
EEBC.6 decisions are primarily viewed in terms of the money they generate for the company
EEBC.7 the major responsibility for the organisational members is to aim at cost reduction
Efficiency (EEBC_E)
EEBC.8 the cheapest way is always the right way for the company
EEBC.9 each person is expected, above all, to work in a cost reductive way
EEBC.10 inexpensive solutions to solve problems are always sought
EEBC.11 good interpersonal contacts (both with colleagues and outsiders) are considered to be very important
Friendship
(EEBC_F) EEBC.12 the major concern is always what is best for the other person (whether he or she is a colleague or not)
EEBC.13 what is best for each individual (whether citizen or colleague) is the primary concern of the organisation
EEBC.14 it is expected that each individual (both colleague and outsider) is cared for when making decisions
EEBC.15 the most important concern is the good of all the people in the company Team Interest
(EEBC_TI) EEBC.16 the major consideration is what is best for all colleagues in the company
EEBC.18 people have a strong sense of responsibility to the citizens they deal with Stakeholder Orientation
(EEBC_SO) EEBC.19 people are actively concerned about the citizens they have direct contact with
EEBC.20 the effect of decisions on the citizens directly dealt with is a primary concern in the company
EEBC.23 innovative people are encouraged Personal Morality
(EEBC_PM) EEBC.24 the most important consideration in the company is each employee’s personal sense of
what is right or wrong
EEBC.25 personal creativity of all employees is supported
EEBC.26 it is very important to follow strictly the company’s rules and procedures Rules & Law
(EEBC_RL) EEBC.27 everyone is expected to stick by the rules and procedures
EEBC.29 people are expected to comply with law and public interests over and above other considerations
EEBC.30 people are expected to strictly follow legal and professional standards
EEBC.36 people hide (potential) violations before on-site inspections
Global Perspective
(EEBC_GP)
EEBC.37 there is human rights violation
EEBC.38 there is practice of improper contracting or violations of contract terms with customers or suppliers
EEBC.39 there is inappropriate alteration, falsification and/or misrepresentation of your organisation's documents or records
EEBC.40 one may lie to employees, customers, vendors or the public
EEBC.41 there are violations of health and/or safety regulations
EEBC.42 there is delivery of goods or services that fail to meet specification or clients’ requirements
EEBC.43 there is improper access to, disclosure of and/or use of computers or employees' personal or private information
EEBC.44 there is retaliation against someone who has reported misconduct
EEBC.45 stealing or theft occurs
EEBC.46 there are violations of environment regulations

283
4.5.7.3 Key observations on the assessment of the EEBC Construct
(a) Out of the 46 items that were loaded and were subject to the CFA, 35 items
emerged as having acceptable loadings (between .71 and .91) under a nine-factor
model confirmed through the CFA process. CMIN/df was at 3.320 (should be <
5.00 threshold), RMSEA was at .067 (threshold: < .08), CFI was less than .90
threshold with a result of .877, SRMR within the acceptable threshold of < .10 with
an output of .078.
(b) Following the adjustments made, the model improved to an acceptable fit with
CMIN/df coming down from 3.320 to 2.586, RMSEA improved further to .055, CFI
increased from .877 at .942 and SRMR reduced from .078 to .045.
The CFA of the Baseline Model shows an acceptable to excellent fit with no
discriminant or convergent validity issues. The final results have mapped in the
respective cells as highlighted below.
Table 4.51
Model Fit Indices
CMIN/df GFI NFI TLI CFI RMSEA SRMR
Poor >5 <0.90 <0.90 <0.90 <0.90 >0.08 >0.10
Acceptable 3-5 >0.90 >0,90 >0,90 0.90-0.95 0.06-0.08 0.08-0.10
Excellent <3 >0.95 >0.95 >0.95 >0.95 <0.06 <0.08
Fit type Absolute Absolute Incremental Incremental Incremental Absolute Absolute
Note. Sources: Hair et al. (2014), Awang (2012), Hu & Bentler (1999), Schumacker & Lomax (2010)
(c) The factor structure emerging from the present study was largely found to support
the latent factor structure as established by Maesschalck (2004) from a theoretical
perspective.
(d) In light of the above, it is proposed that the final CFA model be used for the
subsequent computation of the score and evaluation of the macro-meso-micro
framework of the Conceptual Research Model.

284
4.5.8 Assessment of the Baseline Model (Construct: Perceived
Employee Performance)
The seventh and final construct lies within the micro layer of the Conceptual Research
Model, referred to as Perceived Employee Performance (“PEP”), or the Baseline
Model under this section.
The PEP construct, being the third dependent or outcome variable, was measured
through an adapted instrument of 19 items. Seven items originated from the scale
developed to measure perceived organisational performance (Delaney & Huselid,
1996). An additional set of 12 items were considered to create a broader base needed
for assessment in line with the scope of the present research and which also assisted
in responding to the research questions. The 19 items measuring PEP were
consolidated under a single group and were tested using the Harman’s Single Factor
test.
Correlations were computed and a correlation matrix was generated with the
correlation coefficients for the 19 items.
The results of the KMO Measure of Sampling Adequacy and Bartlett’s Test of
Sphericity were as follows:
Table 4.52
KMO & Bartlett’s Results
Kaiser-Meyer-Olkin Measure of Sampling Adequacy. 0.924
Bartlett's Test of Sphericity Approx. Chi-Square 6233.726
df 171
Sig. 0.000
Note. p < .001
The KMO measure stands at .924 reflecting a strong adequacy level of the sample for
factor analysis. From the result of the Bartlett’s Test of Sphericity, it can be seen that
the significance is less than .05.
Using Principal Component Analysis as an extraction method, a table of
Communalities was generated showing the extent of variance that the respective 19
PEP items accounted for through the extracted factors. The Extraction Sums of
Squared Loadings % of Variance was computed and a result of 44.2% was obtained

285
for one component extracted, thereby suggesting a potential multi-factor model. An
attempt was made to recompute the Extraction Sums of Squared Loadings % after
having removed the items with low communalities.
Four items with low communalities (< 0.30) were excluded from the set, namely
PEP.12r, PEP.13r, PEP.14r and PEP.16r. The statistical procedures of computing the
correlation matrix, KMO, Bartlett’s test and extraction of communalities were
conducted anew, and the outcomes were as follows:
Table 4.53
KMO & Bartlett’s Results
Kaiser-Meyer-Olkin Measure of Sampling Adequacy. 0.934
Bartlett's Test of Sphericity Approx. Chi-Square 5525.868
df 105
Sig. 0.000
Note. p < .001
The KMO measure improved to .934 and reflecting a strong adequacy level of the
sample for factor analysis coupled with a significance of less than .05 for the Bartlett’s
Test of Sphericity.
Table 4.54
Communalities for PEP Items
Initial Extraction
PEP.1 …improved the quality of products, services, culture and programs comparatively.
1.000 0.459
PEP.2 …developed products, services, culture and programs better than the competition.
1.000 0.546
PEP.3 …been more able to attract the new skill and talents required for the business to stay ahead of the curve.
1.000 0.579
PEP.4 …been more able to retain top employees and talents required for the business to stay ahead of the curve.
1.000 0.557
PEP.5 …been more able to attract new clients and satisfy existing customers. 1.000 0.534
PEP.6 …witnessed strong relations prevailing between management and employees. 1.000 0.599
PEP.7 …witnessed strong relations prevailing amongst employees in general. 1.000 0.586
PEP.8 …the prevailing culture helps you to work well and deliver beyond what is expected.
1.000 0.582
PEP.9 …the prevailing ethical climate helps you to maintain your ethical stance and moral values unviolated and perform better.
1.000 0.542
PEP.10 …the prevailing ethical climate creates an environment for reporting ethical issues openly without any fear of retaliation or inaction.
1.000 0.543
PEP.11 …the leaders, managers or supervisors create the right ethical work environment for employees to perform well.
1.000 0.593
PEP.15 …the ethic programs are relevant, comprehensive, living and supportive to improve work climate and performance.
1.000 0.497
PEP.17 …employees are encouraged to use Ethics & Compliance standards and improve overall work performance.
1.000 0.481
PEP.18 …you feel the organisational climate and working environment is better than the prevailing market / external work environment.
1.000 0.439
PEP.19 …it better manages its business strategies, performance and corporate image compared to others in the market.
1.000 0.536
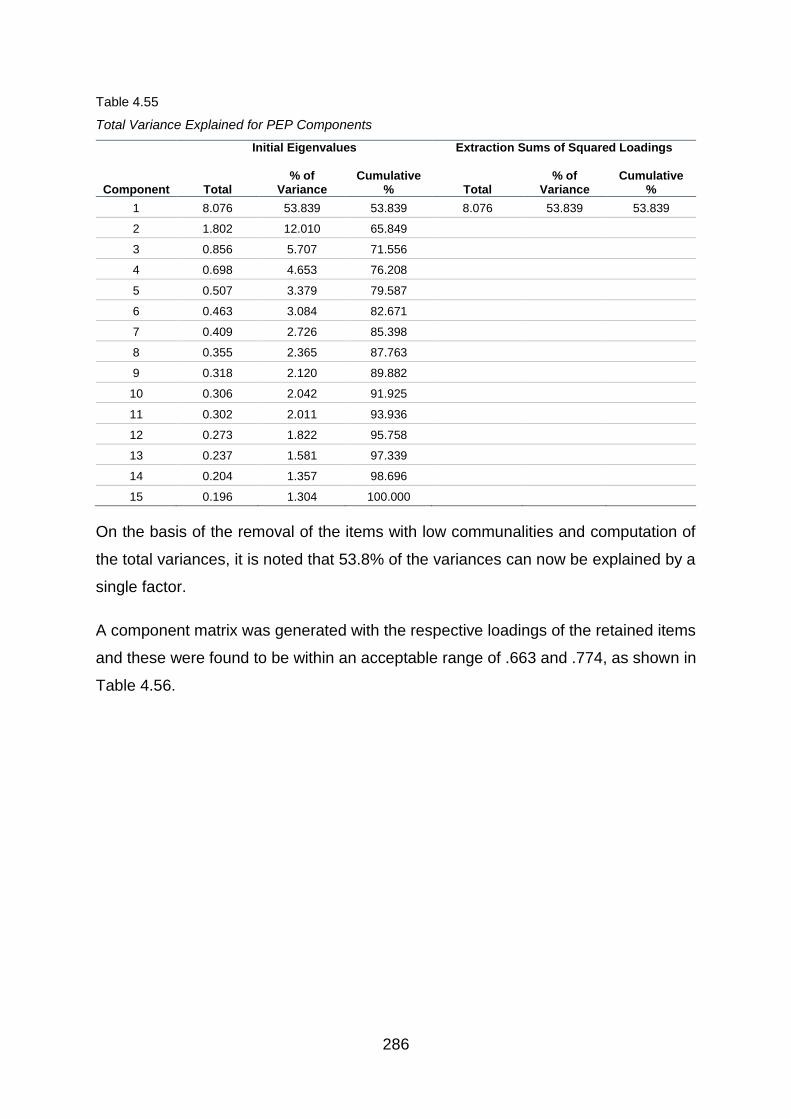
286
Table 4.55
Total Variance Explained for PEP Components
Component
Initial Eigenvalues
Extraction Sums of Squared Loadings
Total % of
Variance Cumulative
% Total % of
Variance Cumulative
%
1 8.076 53.839 53.839 8.076 53.839 53.839
2 1.802 12.010 65.849
3 0.856 5.707 71.556
4 0.698 4.653 76.208
5 0.507 3.379 79.587
6 0.463 3.084 82.671
7 0.409 2.726 85.398
8 0.355 2.365 87.763
9 0.318 2.120 89.882
10 0.306 2.042 91.925
11 0.302 2.011 93.936
12 0.273 1.822 95.758
13 0.237 1.581 97.339
14 0.204 1.357 98.696
15 0.196 1.304 100.000
On the basis of the removal of the items with low communalities and computation of
the total variances, it is noted that 53.8% of the variances can now be explained by a
single factor.
A component matrix was generated with the respective loadings of the retained items
and these were found to be within an acceptable range of .663 and .774, as shown in
Table 4.56.

287
Table 4.56
Component Matrixa of PEP Items – Single Component
Component
1
PEP.1 …improved the quality of products, services, culture and programs comparatively. 0.678
PEP.2 …developed products, services, culture and programs better than the competition. 0.739
PEP.3 …been more able to attract the new skill and talents required for the business to stay ahead of the curve.
0.761
PEP.4 …been more able to retain top employees and talents required for the business to stay ahead of the curve.
0.746
PEP.5 …been more able to attract new clients and satisfy existing customers. 0.731
PEP.6 …witnessed strong relations prevailing between management and employees. 0.774
PEP.7 …witnessed strong relations prevailing amongst employees in general. 0.766
PEP.8 …the prevailing culture helps you to work well and deliver beyond what is expected. 0.763
PEP.9 …the prevailing ethical climate helps you to maintain your ethical stance and moral values unviolated and perform better.
0.737
PEP.10 …the prevailing ethical climate creates an environment for reporting ethical issues openly without any fear of retaliation or inaction.
0.737
PEP.11 …the leaders, managers or supervisors create the right ethical work environment for employees to perform well.
0.770
PEP.15 …the ethic programs are relevant, comprehensive, living and supportive to improve work climate and performance.
0.705
PEP.17 …employees are encouraged to use Ethics & Compliance standards and improve overall work performance.
0.694
PEP.18 …you feel the organisational climate and working environment is better than the prevailing market / external work environment.
0.663
PEP.19 …it better manages its business strategies, performance and corporate image compared to others in the market.
0.732
Note. Extraction Method: Principal Component Analysis. a. One component extracted.
The final results now suggested a single-factor model. To assess the internal reliability
of the construct, Cronbach alpha tests were conducted for the 15 retained items, the
results of which are shown below:
Table 4.57
Reliability Statistics – PEP Scale
Cronbach's Alpha
Cronbach's Alpha Based on Standardized Items
No. of Items
0.938 0.939 15
According to Hair et. al (2014 p.123), the generally accepted lower limit for Cronbach’s
alpha is .70. Anything above this threshold demonstrates satisfactory to high reliability
of the entire scale. The coefficient score generated for the 15 retained items of the
PEP construct is .938 confirming a high reliability. Further assessment was undertaken
through the Item-Total Statistics as per Table 4.58

288
Table 4.58
Item-Total Statistics – PEP Scale
Scale Mean if
Item Deleted
Scale Variance
if Item Deleted
Corrected Item-Total
Correlation
Squared Multiple
Correlation
Cronbach's Alpha if
Item Deleted
PEP.1 …improved the quality of products, services, culture and programs comparatively.
53.32 59.624 0.625 0.597 0.936
PEP.2 …developed products, services, culture and programs better than the competition.
53.35 58.810 0.692 0.668 0.934
PEP.3 …been more able to attract the new skill and talents required for the business to stay ahead of the curve.
53.34 59.071 0.718 0.687 0.933
PEP.4 …been more able to retain top employees and talents required for the business to stay ahead of the curve.
53.36 58.799 0.698 0.679 0.934
PEP.5 …been more able to attract new clients and satisfy existing customers.
53.25 59.648 0.683 0.597 0.934
PEP.6 …witnessed strong relations prevailing between management and employees.
53.32 58.470 0.727 0.681 0.933
PEP.7 …witnessed strong relations prevailing amongst employees in general.
53.27 59.158 0.721 0.656 0.933
PEP.8 …the prevailing culture helps you to work well and deliver beyond what is expected.
53.28 59.452 0.717 0.586 0.933
PEP.9 …the prevailing ethical climate helps you to maintain your ethical stance and moral values unviolated and perform better.
53.22 59.370 0.688 0.615 0.934
PEP.10 …the prevailing ethical climate creates an environment for reporting ethical issues openly without any fear of retaliation or inaction.
53.33 59.069 0.690 0.600 0.934
PEP.11 …the leaders, managers or supervisors create the right ethical work environment for employees to perform well.
53.27 58.724 0.727 0.644 0.933
PEP.15 …the ethic programs are relevant, comprehensive, living and supportive to improve work climate and performance.
53.32 59.615 0.660 0.581 0.935
PEP.17 …employees are encouraged to use Ethics & Compliance standards and improve overall work performance.
53.28 59.737 0.646 0.575 0.935
PEP.18 …you feel the organisational climate and working environment is better than the prevailing market / external work environment.
53.42 59.635 0.613 0.575 0.936
PEP.19 …it better manages its business strategies, performance and corporate image compared to others in the market.
53.35 59.436 0.691 0.610 0.934
In above table of consistency measures, the “Corrected Item to Total Correlation”
values were examined and found to be acceptable as they are greater than .20.
Furthermore, the “Cronbach's Alpha if Item Deleted” values for each item were also
evaluated. If they were found to be greater than the calculated reliability value of .938,
then the concerned item would have been dropped from the set and not considered

289
for further study. From the table above, there were no such items requiring to be
dropped.
4.5.9 Underlying Structure of the Conceptual Research Model
The model fit of the respective constructs of the macro-meso-micro layer of the
Conceptual Research Model was ascertained through established exploratory and
confirmatory factor analysis processes (as and where applicable as explained in the
foregoing sections). The underlying structure supporting the measurement of the
relevant constructs and the Conceptual Research Model has been subsequently
refined based on the statistical outcomes as shown in Figure 4.11 on page 290 of the
thesis:

290
Ethical Leadership
& Decision Making
Internal & External
Workplace
Pressures
Ethical
Organisational
Climate Perceived
Employee
Performance
Employee Ethical
Behaviour &
Conduct
Organisational
Citizenship
BehaviourOrganisational
Culture
macro meso micro
Conceptual Research Model (macro-meso-micro framework)
Source Instrument: Organisational Culture Assessment Questionnaire
(Sashkin & Rosenbach, 2013)----------------------------------------------
Post EFA, CFA & Model FitFactor (Achieving Business Goal) loaded with 4 items being used as
proxy for construct measure
Source Instrument: Ethical Climate Questionnaire (Victor & Cullen, 1988)---------------------------------------------------
Post EFA, CFA & Model FitFactor (Principle-oriented) loaded with
6 items being used as proxy for construct measure
Source Instrument: Adapted from Factors Eliciting Managerial Unethical Decision
Making (Lasakova and Remisova, 2017)-------------------------------------------------------
Post CFA & Model FitFactor (Violation of Internal Ethical
Guidelines) loaded with 4 items being used as proxy for construct measure
Source Instrument: Ethical Leadership at Work (Kalshoven, De
Hoogh & Hartog, 2011)------------------------------------------
Post CFA & Model Fit:31 items loaded on a 6-factor model with a single 2nd order factor model
for construct measure
Source Instrument: Organisational Citizenship Behaviour Scale
(Podsakoff, MacKenzie, Moorman & Fetter, 1990)
---------------------------------------------Post EFA, CFA & Model Fit:Factor (Altruism) loaded with 6 items being used as proxy for
construct measure
Instrument: Adapted Perceived Organisational Performance (Delaney & Huselid, 1996)
--------------------------------------------Post Harman Single Factor Test &
Cronbach Assessment:15 items loaded on a single factor
model for construct measure (Perceived Employee Performance)
Source Instrument: Adapted from Scale for Measurement of Questionable Behaviour (Maesschalck, 2004)
Source Instrument: Adapted from 2018 Global Business Ethics Survey
(Ethics & Compliance Initiative, 2018)----------------------------------------------------
Post CFA & Model Fit:35 items loaded on a 9-factor model
being used as construct measure
Figure 4.11.Underlying factor structure for measurement of constructs and Conceptual Research Model.

291
The supporting items presented by main and sub-constructs have been provided
holistically in the Table 4.59, for the overall Conceptual Research Model, for ease of
reference.
Table 4.59
Underlying details of retained items by main & sub constructs
Main Construct
Proxy for Measurement of Construct
Sub-Construct
Latent Factor Label
Items
OC OC_FacA Achieving Business Goals OC.2 OC.4 OC.9 OC.11
EOC EOC_FacA Principle-orientation EOC.14 EOC.15 EOC.19 EOC.21 EOC.25 EOC.27
ELDM
ELDM_PD People Dimension ELDM.1 ELDM.2 ELDM.3 ELDM.4 ELDM.5 ELDM.6 ELDM.7
ELDM_F Fairness ELDM.8 ELDM.9 ELDM.10
ELDM_PS Power Sharing ELDM.16 ELDM.17
ELDM_CS_EG
ELDM_CS Concern for Sustainability ELDM.20 ELDM.21 ELDM.22
ELDM_EG Ethical Guidance ELDM.23 ELDM.24 ELDM.25 ELDM.26 ELDM.27 ELDM.28 ELDM.29
ELDM_RC Role Clarification ELDM.30 ELDM.31 ELDM.32 ELDM.33 ELDM.34
ELDM_I Integrity ELDM.35 ELDM.36 ELDM.37 ELDM.38
IEWP IEWP_VIEG Violations of Internal Ethical Guidance
IEWP.2 IEWP.3 IEWP.6 IEWP.9
OCB OCB_FacA Altruism OCB.13 OCB.14 OCB.15 OCB.16 OCB.22 OCB.23
EEBC
EEBC_SI Self Interest EEBC.2 EEBC.3
EEBC_OI Organisational Interest EEBC.5 EEBC.6
EEBC_E Efficiency EEBC.7 EEBC.8 EEBC.9 EEBC.10
EEBC_F Friendship EEBC.11 EEBC.12 EEBC.13 EEBC.14
EEBC_TI Team Interest EEBC.15 EEBC.16
EEBC_SO Stakeholder Orientation EEBC.18 EEBC.19 EEBC.20
EEBC_PM Personal Morality EEBC.23 EEBC.24 EEBC.25
EEBC_RL Rules & Law EEBC.26 EEBC.27 EEBC.29 EEBC.30
EEBC_GP Global Perspective EEBC.36 – EEBC.46
PEP Perceived Employee Performance
PEP.1 - PEP.11 PEP.15 PEP.17 PEP.18 PEP.19

292
4.5.10 Constructs Descriptive Statistics
Prior to undertaking further statistical assessment to make appropriate inferences
about the Conceptual Research Model and the inter-relationships of the underlying
constructs that have been validated through factor analysis, it is vital to ascertain that
the entire statistical framework is grounded on appropriate assumptions of normality
(Das & Imon, 2016). A combination of graphical and analytical approaches has been
considered to test the normality of the underlying data set being measured through the
retained items and validated constructs. Model fit assessments were done earlier,
where a set of predefined measures were used to assess all constructs. A similar
approach has again been used to assess normality through a consistent examination
of histograms, normal and detrended quantile-quantile (“Q-Q”) plots and boxplots
(Chambers et al., 1983). The respective constructs’ data, means and standard
deviations have been analysed graphically as shown in Figure 4.12 on page 293,
Figure 4.13 on page 294. Figure 4.14 on page 295 and Figure 4.15 on page 296 of
the thesis with the following key highlights on outcomes:
(a) The data sets (n = 523) measuring the respective constructs appear to be normally
distributed;
(b) The plotted histograms show normality in distribution with different degrees of
standard deviations for the various constructs. The central tendency measured
through the means indicate the convergence for each construct. The computed
scores were based on the outcomes of the earlier CFA exercise and retained
factors.
(c) The Q-Q plots, which show the distribution of the data against the
expected normal distribution have equally been examined for each construct. The
observations of the measured constructs lie approximately on a straight line
thereby confirming normally distributed data.
(d) Detrended Q-Q plots focussed on deviations from the normal distribution instead
of examining the overall picture. The observed scores’ cluster in a horizontal band
close to zero thereby showing an approximately normal distribution.
(e) The plotted boxplots provide a good indication of how the values in the data are
spread out for the various constructs and appear to be symmetrical in most cases.

293
Construct: Organisation Culture (OC)
Mean = 3.93; Standard Deviation = 0.553; N = 523
Construct: Ethical Organisation Culture (EOC)
Mean = 3.71; Standard Deviation = 0.724; N = 523
Histogram (EOC)Histogram (OC)
Normal Q-Q Plot (OC)
Detrended Normal Q-Q Plot (OC) Detrended Normal Q-Q Plot (EOC)
Box Plot (OC) Box Plot (EOC)
Normal Q-Q Plot (EOC)
Figure 4.12. Normality assessment of measured OC and EOC constructs.

294
Construct:
Ethical Leadership & Decision Making (ELDM)
Mean = 3.57; Standard Deviation = 0.509; N = 523
Construct:
Internal & External Workplace Pressure (IEWP)
Mean = 2.71; Standard Deviation = 0.888; N = 523
Histogram (IEWP)Histogram (ELDM)
Normal Q-Q Plot (ELDM)
Detrended Normal Q-Q Plot (ELDM) Detrended Normal Q-Q Plot (IEWP)
Box Plot (ELDM) Box Plot (IEWP)
Normal Q-Q Plot (IEWP)
Figure 4.13. Normality assessment of measured ELDM and IEWP constructs.

295
Construct:
Organisation Citizenship Behaviour (OCB)
Mean = 4.14; Standard Deviation = 0.472; N = 523
Construct:
Ethical Employee Behaviour & Conduct (EEBC)
Mean = 3.61; Standard Deviation = 0.434; N = 523
Histogram (EEBC)Histogram (OCB)
Normal Q-Q Plot (OCB)
Detrended Normal Q-Q Plot (OCB) Detrended Normal Q-Q Plot (EEBC)
Box Plot (OCB) Box Plot (EEBC)
Normal Q-Q Plot (EEBC)
Figure 4.14. Normality assessment of measured OCB and EEBC constructs.

296
Construct:
Perceived Employee Performance (PEP)
Mean = 3.81; Standard Deviation = 0.549; N = 523
Histogram (PEP)
Normal Q-Q Plot (PEP)
Detrended Normal Q-Q Plot (PEP)
Box Plot (PEP)
Figure 4.15. Normality assessment of measured PEP construct

297
Table 4.60 provides a summary of the descriptive statistics for the seven constructs
including their respective sample means, standard deviations and standard error
means, to ease the computation of the one-sample t test.
Table 4.60
One Sample Statistics of the Seven Constructs
Constructs n Mean Std. Deviation
Organisational Culture (OC) 523 3.93 0.55288
Ethical Organisational Climate (EOC) 523 3.71 0.72411
Ethical Leadership & Decision Making (ELDM) 523 3.57 0.50863
Internal & External Workplace Pressure (IEWP) 523 2.71 0.88768
Organisational Citizenship Behaviour (OCB) 523 4.14 0.47151
Ethical Employee Behaviour & Conduct (EEBC) 523 3.61 0.43429
Perceived Employee Performance (PEP) 523 3.81 0.54856
A one sample t-test is being used to compare the mean of the sample to a known
value of three (three being the hypothetical mean of the population).
H0 = sample mean is not equal to hypothesised mean
Ha = sample mean is equal to hypothesised mean
Table 4.61
One Sample T-Tests of the Seven Constructs
Constructs
Test Value = 3
t df Sig. (2-tailed)
Mean Difference
95% Confidence Interval of the
Difference
Lower Upper
Organisational Culture (OC) 38.398 522 0.000 0.92830 0.8808 0.9758
Ethical Organisational Climate (EOC) 22.524 522 0.000 0.71319 0.6510 0.7754
Ethical Leadership & Decision Making (ELDM)
25.663 522 0.000 0.57077 0.5271 0.6145
Internal & External Workplace Pressure (IEWP)
-7.487 522 0.000 -0.29063 -0.3669 -0.2144
Organisational Citizenship Behaviour (OCB) 55.519 522 0.000 1.14468 1.1042 1.1852
Ethical Employee Behaviour & Conduct (EEBC)
32.143 522 0.000 0.61040 0.5731 0.6477
Perceived Employee Performance (PEP) 33.686 522 0.000 0.80803 0.7609 0.8552
Note. “Sig.” represents the p-value
Given p < .05 for all the respective constructs, H0 is rejected in favour of Ha

298
4.5.11 Group Differences
The respondents to the survey have been classified into various independent groups
namely:
Age Group
Socio-Economic Group
Industry Sector
An analysis of group differences will ascertain whether the outcomes of the study of
OC, EOC, ELDM, IEWP, OCB, EEBC and PEP are similar in patterns across the
above three groups. This will help to answer questions such as:
- Is the organisational culture in the local context different across age groups?
- Is the ethical organisational climate similar across socio-economic groups?
- Is the pattern of internal and external work pressure felt differently across
industries?
- Is organisational citizenship behaviour similar across age groups? etc.
To respond to such questions and obtain the insights on behavioural patterns across
groups, Analysis of Variance (ANOVA) and Post Hoc Tests has been used to assess
whether the means are different across groups and are statistically significant.
ANOVA determines whether the means of two or more groups (gender, age, socio-
economic and industry) are statistically significantly different from each other.
However, ANOVA does not specifically tell which group is different from each other.
To determine which specific group(s) differ, Post Hoc tests has been used (Hair et al.,
2014).
In the Table 4.62 on page 299, an ANOVA has first been used to determine whether
any significant differences can be identified. Following this, the output tables of Post
Hoc tests has been analysed to identify the specific group with statistically significant
mean differences to enable further interpretation.

299
Examination of Means of Age Groups
To examine group differences, the homogeneity of variance was assessed amongst
groups. Table 4.62 provides ANOVA results for the Age Groups. It shows that
differences between groups are statistically significant for the following variables:
OC: F(3, 519) = 2.968, p < .05
IEWP: F(3, 519) = 3.254, p < .05
OCB: F(3, 519) = 3.318, p < .05
Table 4.62
ANOVA (Age Groups)
Sum of
Squares df Mean
Square F Sig.
OC Between Groups 2.691 3 0.897 2.968 0.032
Within Groups 156.870 519 0.302
Total 159.561 522
EOC Between Groups 2.217 3 0.739 1.413 0.238
Within Groups 271.484 519 0.523
Total 273.701 522
ELDM Between Groups 1.110 3 0.370 1.434 0.232
Within Groups 133.933 519 0.258
Total 135.043 522
IEWP Between Groups 7.594 3 2.531 3.254 0.021
Within Groups 403.730 519 0.778
Total 411.324 522
OCB Between Groups 2.184 3 0.728 3.318 0.020
Within Groups 113.868 519 0.219
Total 116.053 522
EEBC Between Groups 0.626 3 0.209 1.107 0.346
Within Groups 97.826 519 0.188
Total 98.452 522
PEP Between Groups 2.135 3 0.712 2.384 0.068
Within Groups 154.947 519 0.299
Total 157.082 522
Considering that p < .05 for OC, IEWP and OCB, the Post Hoc Tests of Multiple
Comparison were conducted on the variables using the Games-Howell test. The
specificities of the group mean differences, the output results of OC, IEWP and OCB
were extracted and reproduced in Table 4.63 on page 300.

300
Table 4.63
Post Hoc Tests (Age Groups) – Multiple Comparisons
Variables Tests Age groups
Mean Difference
(I-J) Std.
Error Sig.
95% Confidence Interval
Lower Bound
Upper Bound
OC Games-Howell 50-69 20-29 -.18167* 0.06892 0.044 -0.3602 -0.0032
IEWP Games-Howell 40-49 20-29 .31221* 0.10694 0.020 0.0354 0.5890
OCB Games-Howell 40-49 20-29 -.16801* 0.06045 0.030 -0.3244 -0.0116
Note. *. The mean difference is significant at the 0.05 level.
The results show that respondents of age groups 50-59 and 40-49 (regarded as
mature and experienced persons) rated their perceptions in respect of OC, IEWP and
OCB differently as compared to the younger generation of age group 20-29. A granular
interpretation is provided below:
OC – The means of age groups of 50-59 (X̅ = 3.85, SD = .59) and 20-29 (X̅ =
4.03, SD = .50) are significantly different statistically (p < .05). This indicates
that the perception of the relatively younger generation towards the prevailing
organisational culture is different from those of the older group. The younger
generation sees the organisation as being more inclined towards achieving
business goals, having people’s consideration and work ethics as compared to
the older generation. The lower rating of the perceptions of the older generation
may be explained due to their longer exposure to the organisational culture and
their appreciation over time.
IEWP – A similar pattern is noted between the relatively younger generations
compared to the older ones. The means of age groups of 40-49 (X̅= 2.86, SD
= .90) and 20-29 (X̅ = 2.55, SD = .82) are significantly different statistically
(p<0.05). The younger group sees internal and external workplace pressure to
deviate from ethical guidelines as being relatively lower than their older peers.
OCB – As regards organisation citizenship behaviour, the younger generation
(X̅ = 4.24, SD = .50) is relatively more inclined towards advocating for altruism,
civic virtue and sportsmanship in the organisation compared to their older peers
(X̅ = 4.07, SD = .48). This is characterised by the statistically significantly
different means (p < .05).

301
Examination of Means of Socio-Economic Groups
Table 4.64 provides ANOVA results for the Socio-Economic Groups. It shows that the
mean of ELDM construct is significant, i.e., F(3, 519) = 1.132, p < .05
Table 4.64
ANOVA (Socio-Economic Groups)
Variables Sum of
Squares df Mean Square F Sig.
OC Between Groups 0.111 3 0.037 0.120 0.948
Within Groups 159.451 519 0.307
Total 159.561 522
EOC Between Groups 0.378 3 0.126 0.239 0.869
Within Groups 273.323 519 0.527
Total 273.701 522
ELDM Between Groups 3.397 3 1.132 4.464 0.004
Within Groups 131.646 519 0.254
Total 135.043 522
IEWP Between Groups 2.110 3 0.703 0.892 0.445
Within Groups 409.214 519 0.788
Total 411.324 522
OCB Between Groups 0.713 3 0.238 1.070 0.362
Within Groups 115.340 519 0.222
Total 116.053 522
EEBC Between Groups 0.356 3 0.119 0.628 0.597
Within Groups 98.096 519 0.189
Total 98.452 522
PEP Between Groups 0.465 3 0.155 0.514 0.673
Within Groups 156.617 519 0.302
Total 157.082 522

302
Table 4.65
Post Hoc Tests (Socio-Economic Groups) – Multiple Comparisons
Mean Difference
(I-J) Std. Error Sig.
95% Confidence Interval
Variable Tests Socio Economic
Groups Lower Bound
Upper Bound
ELDM Games-Howell AB C1 .19006* 0.06664 0.026 0.0162 0.3639
AB C2 0.18420 0.07143 0.053 -0.0016 0.3700
AB DE .33150* 0.10645 0.013 0.0525 0.6105
Note. *. The mean difference is significant at the 0.05 level.
The results show that respondents of socio-economic groups AB (High Class) rated
their perceptions in respect of ELDM differently as compared to the other socio-
economic groups C1 (Upper Middle Class) and DE (Lower Class). A granular
interpretation is provided below:
ELDM – The means of socio-economic groups of AB (X̅ = 3.75, SD = .50),
C2 (X̅ = 3.56, SD = 0.54) and DE (X̅ = 3.41, SD = .60) are significantly different
statistically (p < .05). This indicates that the perception of the people forming
part of the High Class socio economic group compared to the lower groups
have a relatively stronger perception towards and inclination for ethical
leadership and decision making best practices and behaviour in the
organisation. This may be explained by the fact that the lower groups are also
below in the hierarchical order as compared to AB class, i.e., they are more on
the “receiving end” of instructions, guidelines and consideration. This therefore
suggests that the low groups may see things differently from their superiors or
those who are in profession or important positions.

303
Examination of Means of Industry Groups
Table 4.66 provides ANOVA results for the Industry Groups. It shows that mean of the
following constructs as being significant:
OC: F(11, 511) = 3.189, p < .05
ELDM: F(11, 511) = 2.537, p < .05
IEWP: F(11, 511) = 2.085, p < .05
Table 4.66
ANOVA (Industry Groups)
Variable Sum of Squares df Mean Square F Sig.
OC Between Groups 10.249 11 0.932 3.189 0.000
Within Groups 149.312 511 0.292
Total 159.561 522
EOC Between Groups 7.765 11 0.706 1.356 0.190
Within Groups 265.936 511 0.520
Total 273.701 522
ELDM Between Groups 6.993 11 0.636 2.537 0.004
Within Groups 128.049 511 0.251
Total 135.043 522
IEWP Between Groups 17.667 11 1.606 2.085 0.020
Within Groups 393.657 511 0.770
Total 411.324 522
OCB Between Groups 4.275 11 0.389 1.777 0.055
Within Groups 111.778 511 0.219
Total 116.053 522
EEBC Between Groups 3.382 11 0.307 1.652 0.081
Within Groups 95.070 511 0.186
Total 98.452 522
PEP Between Groups 5.501 11 0.500 1.686 0.073
Within Groups 151.581 511 0.297
Total 157.082 522

304
Table 4.67
Post Hoc Tests (Industry Groups) – Multiple Comparison
95% Confidence Interval
Variable Test Industry Groups
Mean Difference
(I-J) Std.
Error Sig. Lower Bound
Upper Bound
OC Games-Howell
Manufacturing Accommodation and food service activities
-.45296* 0.11032 0.005 -0.8242 -0.0817
Accommodation and food service activities
Manufacturing .45296* 0.11032 0.005 0.0817 0.8242
Accommodation and food service activities
Education .41878* 0.11082 0.016 0.0446 0.7930
Accommodation and food service activities
Other services .56296* 0.12840 0.003 0.1266 0.9993
Education Accommodation and food service activities
-.41878* 0.11082 0.016 -0.7930 -0.0446
Human health and social work activities
Other services .46896* 0.12943 0.026 0.0297 0.9082
Other services Accommodation and food service activities
-.56296* 0.12840 0.003 -0.9993 -0.1266
Other services Human health and social work activities
-.46896* 0.12943 0.026 -0.9082 -0.0297
ELDM Games-Howell
Agriculture, forestry, fishing & utilities
Accommodation and food service activities
-.34716* 0.10147 0.044 -0.6892 -0.0051
Manufacturing Accommodation and food service activities
-.42975* 0.09042 0.001 -0.7355 -0.1240
Public administration and defence, compulsory social security
Accommodation and food service activities
-.42979* 0.10028 0.003 -0.7683 -0.0913
IEWP Games-Howell
Manufacturing Financial and insurance activities
.57229* 0.14976 0.013 0.0672 1.0774
Accommodation and food service activities
Manufacturing -.61998* 0.17832 0.042 -1.2277 -0.0123
Note. *. The mean difference is significant at the 0.05 level
Table 4.67 above shows that the perceptions on OC, ELDM and IEWP vary
considerably amongst the different industry sectors. For instance, when assessing

305
IEWP, the means of Manufacturing industry (X̅ = 3.03, SD = .72), the Accommodation
and Food Services Activities (X̅ = 2.41, SD = .89), and the Financial and Insurance
Activities (X̅ = 2.46, SD = .72) are significantly different statistically (p < .05). This
indicates that the people forming part of the Manufacturing industry are almost neutral
on their perceptions on internal and external pressure at their workplace. This is
compared to the Accommodation, Food and Financial sectors which are more inclined
towards disagreeing on the prevalence of unethical behaviour in the organisation.
4.5.12 Correlation Analysis
The computed Pearson correlation coefficients (r or R) between the corresponding
variables have been provided below for assessment of the strength of association.
The correlations were statistically significant at the .01 level (n = 523, 2-tailed).
Table 4.68
Pearson Correlations of Seven Key Variables OC EOC ELDM IEWP OCB EEBC PEP
OC Pearson Correlation 1 .537** .528** -.475** .428** .356** .597**
Sig. (2-tailed) 0.000 0.000 0.000 0.000 0.000 0.000
EOC Pearson Correlation .537** 1 .464** -.429** .531** .467** .588**
Sig. (2-tailed) 0.000 0.000 0.000 0.000 0.000 0.000
ELDM Pearson Correlation .528** .464** 1 -.341** .396** .385** .606**
Sig. (2-tailed) 0.000 0.000 0.000 0.000 0.000 0.000
IEWP Pearson Correlation -.475** -.429** -.341** 1 -.312** -0.061 -.411**
Sig. (2-tailed) 0.000 0.000 0.000 0.000 0.164 0.000
OCB Pearson Correlation .428** .531** .396** -.312** 1 .443** .514**
Sig. (2-tailed) 0.000 0.000 0.000 0.000 0.000 0.000
EEBC Pearson Correlation .356** .467** .385** -0.061 .443** 1 .531**
Sig. (2-tailed) 0.000 0.000 0.000 0.164 0.000 0.000
PEP Pearson Correlation .597** .588** .606** -.411** .514** .531** 1
Sig. (2-tailed) 0.000 0.000 0.000 0.000 0.000 0.000
Note. n = 523 **. Correlation is significant at the 0.01 level (2-tailed).

306
4.6 MODEL, PATH ANALYSIS & MEDIATION
4.6.1 Approach
To assess the overall Conceptual Research Model, there is a need to deconstruct the
whole model into sub-models for a granular evaluation. This will enable the
assessment of the effects between the predictor and outcome variables. This
approach will also enable the mediating effects of ELDM and IEWP between the
independent or predictor (OC & EOC) and dependent or outcome variables to be
gauged (OCB, EEBC and PEP).
The Total Effect Model and the corresponding results for assessment of Total, Direct
and Indirect Effects, are produced by the Hayes PROCESS Procedure for IBM SPSS
Version 3.4.1 (Hayes, 2018). A 95% confidence level for all intervals was used in
output. The number of bootstrap samples for percentile bootstrap confidence intervals
was 5,000.
The output effect results from the Hayes PROCESS Procedure were reported both in
unstandardised (B) and standardised (β) formats. To assess the effect size between
the predictor and outcome variables, Cohen (1988, p.83), reference guidelines were
used. According to Cohen (1988, 1992), the effect size is considered low if the value
of r varies around .10, medium if r varies around .30, and large if r varies more than
.50. (J. Cohen, 1992)
Furthermore, for the purpose of discussion and evaluation of effect size, r values in
the range of .40 to .50 have been referred to as a “medium to high” effect.
The following abbreviations were used in the output tables:
R Correlation Coefficient R coeff Regression Coefficient (Unstandardised) R-sq R Squared SE Standard Error MSE Mean Squared Error t t-value F F-test LLCI Lower Level Confidence Interval df1 Degree of Freedom 1 ULCI Upper Level Confidence Interval df2 Degree of Freedom 2 B Unstandardised Beta Coefficient p p-value β Standardised Beta Coefficient H0 Null Hypothesis H1 Alternative Hypothesis

307
PATH ANALYSIS: MODEL 1
IEWP
OC OCB
ELDM
a1
c
b1
a2 b2
TOTAL EFFECT MODEL
OUTCOME VARIABLE: OCB
MODEL SUMMARY (OC-OCB)
R R-sq MSE F df1 df2 p
0.428 0.184 0.182 117.113 1.000 521.000 0.000
MODEL (OC-OCB)
coeff se t p LLCI ULCI
Constant 2.709 0.134 20.230 0.000 2.446 2.972
OC 0.365 0.034 10.823 0.000 0.299 0.432
STANDARDISED COEFFICIENT (OC-OCB)
OC: 0.428
OUTCOME VARIABLE: ELDM
MODEL SUMMARY (OC-ELDM)
R R-sq MSE F df1 df2 p
0.528 0.279 0.187 201.552 1.000 521.000 0.000
MODEL (OC-ELDM)
coeff se t p LLCI ULCI
Constant 1.662 0.136 12.243 0.000 1.395 1.929
OC 0.486 0.034 14.196 0.000 0.419 0.553
STANDARDISED COEFFICIENT (OC-ELDM)
OC: 0.528
Figure 4.16. Path analysis of model 1.

308
OUTCOME VARIABLE: IEWP
MODEL SUMMARY (OC-IEWP)
R R-sq MSE F df1 df2 p
0.475 0.225 0.611 151.673 1.000 521.000 0.000
MODEL (OC-IEWP)
coeff se t p LLCI ULCI
Constant 5.704 0.246 23.228 0.000 5.222 6.187
OC -0.762 0.062 -12.316 0.000 -0.884 -0.641
STANDARDISED COEFFICIENT (OC-IEWP)
OC: -0.476
OUTCOME VARIABLE: OCB
MODEL SUMMARY (OC-ELDM-IEWP-OCB)
R R-sq MSE F df1 df2 p
0.483 0.234 0.171 52.709 3.000 519.000 0.000
MODEL (OC-ELDM-IEWP-OCB)
coeff se t p LLCI ULCI
Constant 2.713 0.205 13.263 0.000 2.312 3.115
OC 0.219 0.042 5.285 0.000 0.138 0.301
ELDM 0.205 0.042 4.858 0.000 0.122 0.288
IEWP -0.061 0.023 -2.591 0.010 -0.106 -0.015
STANDARDISED COEFFICIENTS (OC-ELDM-IEWP-OCB)
OC : 0.257
ELDM: 0.221
IEWP: -0.114
TOTAL, DIRECT AND INDIRECT EFFECTS OF OC ON OCB
Effect se t p LLCI ULCI
Total effect 0.365 0.034 10.823 0.000 0.299 0.432
Direct effect 0.219 0.042 5.285 0.000 0.138 0.301
Indirect effects 0.146 0.028 0.092 0.204
Figure 4.17 Path analysis of model 1(b)

309
PATH ANALYSIS: MODEL 1.1
OC OCB[0.428]
c
0.365
The coefficient figures along the path, between the corresponding variables, are provided in both
unstandardised and standardised formats. The standardised figure is presented in square brackets
underneath the unstandardised coefficient.
HYPOTHESIS
H0: There is no direct positive linear relationship between OC and OCB
H1: There is a direct positive linear relationship between OC and OCB
RESULTS
The output results are shown in the Model Summary (OC-OCB) table in the Total Effect Model
(Figure 4.16). When assessing the relationships between OC and OCB, it shows that the correlation
coefficient (R), which is also the standardised Beta (β) in a simple regression model, is .428. As the
p-value is less than .01, H0 is rejected in favour of H1.
Hence, the results show a significant positive correlation between OC and OCB (R = .428, p < .01).
Furthermore, the result as indicated by path c shows a Total Effect of .365 (β = .428) between OC
and OCB (B = .365, SE = .034, p < .05, LLCI = .299, ULCI = .432). As the 95% confidence interval
represented by the ranges between LLCI and ULCI does not include zero, it can infer a significant
Total Effect of OC on OCB.
Furthermore, the Total Effect size of .428 between OC and OCB is considered to be of a medium to
high effect, being relatively closer to the .50 (high threshold). This implies that OC has a relatively
medium to high positive effect on OCB.
Figure 4.18. Path analysis of model 1.1.

310
PATH ANALYSIS: MODEL 1.2
ELDM
OC OCB
0.486
a1
c
b1
0.205
0.2190.219
[0.528] [0.221]
[0.257]
The coefficient figures along the paths, between the corresponding variables, are provided in both
unstandardised and standardised formats. The standardised figures are presented in square brackets
underneath the unstandardised coefficient figures.
HYPOTHESIS
H0: ELDM does not significantly mediate the relationship between OC and OCB
H1: ELDM significantly mediates the relationship between OC and OCB
RESULTS
To understand the underlying dynamics of the above model, it is being deconstructed, and the effect
between the corresponding variables along each path is assessed.
ELDM=f(OC): OC has a positive high effect on ELDM (β = .528) along path a1. ELDM has a
relatively smaller effect on OCB (β = .221) along path b1.
Now that ELDM has been added, the Direct Effect of OC onto OCB along path c’ is relatively
smaller, indicating that mediation might be evident.
It can further be determined whether mediation exists by interpreting the Indirect Effect of
OC on OCB through ELDM as depicted by path a1.b1. The lower and upper limits (LLCI =
.419, ULCI = .553) of the bootstrap sample distribution from the Model (OC-ELDM) table
(Figure 4.16) does not include zero therefore, the Indirect Effect of OC on ELDM is significant
(path a1). Furthermore, the Indirect Effect of ELDM on OCB represented by path b1 is also
significant (LLCI = .122, ULCI = .288).
In light of the above, the result is considered to be significant and hence H0 is rejected in favour of
H1.
Furthermore, when examining the Total, Direct and Indirect Effects of OC on OCB table (Figure
4.17), it is noted that the Indirect Effect through ELDM (a1 x b1) is .100 (standardised coefficient of
.117) with a Direct Effect of OC on OCB being .219 (standardised coefficient of .257) as depicted by
path c’ (B = .219, SE = .042, p < .05, LLCI = .138, ULCI = .301). The Total Effect (.365) minus Direct
Effect (.219) indicates the Indirect Effects of OC on OCB through the mediating variables (0.146).
The Indirect Effects are statistically significant (LLCI = .092, ULCI = .204) and represents 40% of the
Total Effect. However, when assessing the constituent parts of the Indirect Effects, it is noted that
ELDM accounts for 68.2% of the total Indirect Effects (a1xb1 as a percentage of Indirect Effects).
Hence it can be ascertained that ELDM significantly mediates the relationship between OC and OCB.
It further implies that the prevalence of ELDM in an organisation has an influence on OCB as a
mediating variable between OC and OCB.
Figure 4.19. Path analysis of model 1.2.

311
PATH ANALYSIS: MODEL 1.3
IEWP
OC OCBc
a2 b2
0.219
-0.762 -0.061
[0.257]
[-0.476] [-0.114]
The coefficient figures along the paths, between the corresponding variables, are provided in both unstandardised and standardised formats. The standardised figures are presented in square brackets
underneath the unstandardised coefficient figures.
HYPOTHESIS
H0: IEWP does not significantly mediate the relationship between OC and OCB
H1: IEWP significantly mediates the relationship between OC and OCB
RESULTS
OC is negatively correlated with IEWP (R = -.475, p < .01) and IEWP is also negatively correlated
with OCB (R = -.312, p < .01). To determine whether mediation exists between OC and OCB through
IEWP, the model is being deconstructed and the effect and statistical significance assessed
accordingly:
IEWL=f(OC): OC has a relatively medium to high negative effect on IEWP (β = -.476) along
path a2 whilst IEWP has a relatively small effect on OCB (β = -.114)
Having added IEWP in the model as a mediator, the Direct Effect of OC onto OCB is relatively
smaller, indicating that mediation might be evident.
It can further be determined whether mediation exists by interpreting the Indirect Effect of
OC on OCB through IEWP as depicted by path a2.b2. Considering that the lower and upper
limits (LLCI = -.884, ULCI = -.641) of the bootstrap sample distribution from the Model (OC-
IEWP) table (Figure 4.17) do not include zero, the Indirect Effect of OC on IEWP is significant
(path a2). Furthermore, the Indirect Effect of IEWP on OCB represented by path b2 is also
significant (LLCI = -.106, ULCI = -.015).
In light of the above, the result is considered to be significant and hence H0 is rejected in favour of
H1. Furthermore, when examining the Total, Direct and Indirect Effects of OC on OCB table
(Figure 4.17), it is noted that the Indirect Effect through (a2 x b2) IEWP is .047 (standardised
coefficient of .054) with a Direct Effect of OC on OCB being .219 (standardised coefficient of .257)
as depicted by path c’ (B = .219, se = .042, p < .05, LLCI = .138, ULCI = .301). The Total Effect (.365)
minus Direct Effect (.219) indicates the Indirect Effects of OC on OCB through the mediating variables
(0.146). The Indirect Effects are statistically significant (LLCI = .092, ULCI = .204) and represents
40% of the Total Effect. However, when assessing the constituent parts of the Indirect Effects, it is
noted that IEWP accounts for 31.8% of the total Indirect Effects (a2xb2 as a percentage of Indirect
Effects). In other words, it has a lower mediating effect as compared to ELDM.
Hence it can be ascertained that IEWP mediates the relationship between OC and OCB. It further
implies that the prevalence of IEWP in an organisation has an influence on OCB as a mediating
variable between OC and OCB.
Figure 4.20. Path analysis of model 1.3.

312
PATH ANALYSIS: MODEL 1.4
IEWP
OC OCB
ELDM0.486
a1
c
b1
0.205
0.219
a2 b2-0.762 -0.061
[0.528] [0.221]
[0.257]
[-0.476] [-0.114]
The coefficient figures along the paths, between the corresponding variables, are provided in both unstandardised and standardised formats. The standardised figures are presented in square brackets underneath the unstandardised coefficient figures.
HYPOTHESIS
H0: ELDM and IEWP do not significantly mediate the relationship between OC and OCB
H1: ELDM and IEWP significantly mediate the relationship between OC and OCB
RESULTS
Considering the results from Total, Direct and Indirect Effects of OC on OCB table (Figure
4.17), it is noted that the Indirect Effects through ELDM and IEWP are significant, as the 95%
confidence interval does not include zero (LLCI = .092, ULCI = .204). It can thus be inferred that
significant mediation effects exist of ELDM and IEWP between OC and OCB.
The Total Effect between OC and OCB is represented by the aggregate value of the Direct Effect of
OC on OCB and the Indirect Effects of ELDM and IEWP between OC and OCB as represented by
c’ + (a1 x b1) + (a2 x b2).
When examining a breakdown of the constituting components of the Total Effect of OC on OCB,
the following is to be notes:
The Indirect Effect of ELDM between OC and OCB represented by path a1.b1 is .100
(standardised coefficient of .117). This represents 68.2% of the total Indirect Effects of .146
between OC and OCB.
The Indirect Effect of IEWP between OC and OCB represented by path a2.b2 is .047
(standardised coefficient of .054). This represents 32.2% of the total Indirect Effects of .146
between OC and OCB.
The combined Indirect Effects of ELDM & IEWP (β =.146, se = .028, LLCI = .092, ULCI =
.204)) represent 40% of the Total Effects between OC and OCB.
The Direct Effect of OC on OCB is .219, represented by path c’, accounts for 60% of the
Total Effect of .365 between OC and OCB.
The standardised Total Effect result of the model, i.e. (c’ + (a1 x b1) + (a2 x b2)), is .428 as
per the correlation coefficient (R) between OC and OCB.
On the basis of the above, it can be inferred that both ELDM and IEWP constitute have a
statistically significant combined mediating effect between OC and OCB. However, ELDM has a
relatively bigger mediating effect as compared to IEWP on OCB.
Figure 4.21. Path analysis of model 1.4.

313
PATH ANALYSIS: MODEL 2
IEWP
EOC OCB
ELDM
a1
c
b1
a2 b2
TOTAL EFFECT MODEL
OUTCOME VARIABLE: OCB
MODEL SUMMARY (EOC-OCB)
R R-sq MSE F df1 df2 p
0.531 0.282 0.160 204.643 1.000 521.000 0.000
MODEL (EOC-OCB)
coeff se t p LLCI ULCI
Constant 2.861 0.091 31.282 0.000 2.681 3.040
EOC 0.346 0.024 14.305 0.000 0.298 0.393
STANDARDISED COEFFICIENT (EOC-OCB)
EOC: 0.531
OUTCOME VARIABLE: ELDM
MODEL SUMMARY (EOC-ELDM)
R R-sq MSE F df1 df2 p
0.464 0.215 0.203 142.946 1.000 521.000 0.000
MODEL (EOC-ELDM)
coeff se t p LLCI ULCI
Constant 2.361 0.103 22.890 0.000 2.158 2.563
EOC 0.326 0.027 11.956 0.000 0.272 0.379
STANDARDISED COEFFICIENT (EOC-ELDM)
EOC: 0.464
Figure 4.22. Path analysis of model 2

314
OUTCOME VARIABLE: IEWP
MODEL SUMMARY (EOC-IEWP)
R R-sq MSE F df1 df2 p
0.429 0.184 0.644 117.401 1.000 521.000 0.000
MODEL (EOC-IEWP)
coeff se t p LLCI ULCI
Constant 4.661 0.184 25.397 0.000 4.301 5.022
EOC -0.526 0.049 -10.835 0.000 -0.621 -0.430
STANDARDISED COEFFICIENT (EOC-IEWP)
EOC: -0.429
OUTCOME VARIABLE: OCB
MODEL SUMMARY (EOC-ELDM-IEWP-OCB)
R R-sq MSE F df1 df2 p
0.561 0.315 0.153 79.446 3.000 519.000 0.000
MODEL (EOC-ELDM-IEWP-OCB)
coeff se t p LLCI ULCI
Constant 2.649 0.173 15.336 0.000 2.310 2.989
EOC 0.272 0.028 9.629 0.000 0.216 0.327
ELDM 0.165 0.039 4.269 0.000 0.089 0.241
IEWP -0.038 0.022 -1.759 0.079 -0.081 0.004
STANDARDISED COEFFICIENTS (EOC-ELDM-IEWP-OCB)
EOC : 0.418
ELDM: 0.178
IEWP: -0.072
TOTAL, DIRECT AND INDIRECT EFFECTS OF EOC ON OCB
Effect se t p LLCI ULCI
Total effect 0.346 0.024 14.305 0.000 0.298 0.393
Direct effect 0.272 0.028 9.629 0.000 0.216 0.327
Indirect effects 0.074 0.018 0.040 0.111
Figure 4.23. Path analysis of model 2.

315
PATH ANALYSIS: MODEL 2.1
EOC OCB[0.531]
c
0.346
The coefficient figures along the path, between the corresponding variables, are provided in both
unstandardised and standardised formats. The standardised figure is presented in square brackets
underneath the unstandardised coefficient.
HYPOTHESIS
H0: There is no direct positive linear relationship between EOC and OCB
H1: There is a direct positive linear relationship between EOC and OCB
RESULTS
Based on the output results in the Model Summary (EOC-OCB) table in the Total Effect Model
(Figure 4.22) and the assessment of the relationships between EOC and OCB, the correlation
coefficient (R), which is also the standardised Beta (β) in simple regression model, is .531. As the p-
value is less than .01, H0 is rejected in favour of H1.
Hence, the results show a significant positive correlation between EOC and OCB (R = .531, p < .01).
Furthermore, the result as indicated by path c shows a Total Effect of .346 (β = .531) between EOC
and OCB (B = .346, se = .024, p < .05, LLCI = .298, ULCI = .393). As the 95% confidence interval
represented by the ranges between LLCI and ULCI does not include zero, it can be inferred that
there is a statistically significant Total Effect of EOC on OCB.
Additionally, the Total Effect size of .531 between EOC-OCB is considered to be of a high effect
(above .50). This implies that EOC has a high positive effect on OCB.
Figure 4.24. Path analysis of model 2.1

316
PATH ANALYSIS: MODEL 2.2
EOC OCB
ELDM
a1
c
b1
0.326 0.165
0.272
[0.464] [0.178]
[0.418]
The coefficient figures along the paths, between the corresponding variables, are provided in both
unstandardised and standardised formats. The standardised figures are presented in square
brackets underneath the unstandardised coefficient figures.
HYPOTHESIS
H0: ELDM does not significantly mediate the relationship between EOC and OCB
H1: ELDM significantly mediates the relationship between EOC and OCB
RESULTS
To assess and understand the above model, the model is being deconstructed and evaluated as
follows:
ELDM=f(EOC): EOC has a positive medium to high effect on ELDM (β = .464) along path
a1. ELDM has relatively small effect on OCB (β = .178) along path b1.
Having added ELDM to the model, the Direct Effect on OCB along path c’ is relatively smaller
(β = .418), indicating that mediation effect might be evident.
It can further be determined whether mediation exists by interpreting the Indirect Effect of
EOC on OCB through ELDM as depicted by path a1.b1. Considering the lower and upper
limits (LLCI = .272, ULCI = .379) of the bootstrap sample distribution from the Model (EOC-
ELDM) table (Figure 4.22) do not include zero, the Indirect Effect of EOC on ELDM is
significant (path a1). Furthermore, the Indirect Effect of ELDM on OCB represented by path
b1 is also significant (LLCI = .089, ULCI = .241).
In light of the above, the result is considered to be significant and hence H0 is rejected in favour of
H1.
Furthermore, when examining the Total, Direct and Indirect Effects of EOC on OCB table (Figure
4.23), it is noted that the Indirect Effect through ELDM (a1 x b1) is .054 (standardised coefficient of
.083) with a Direct Effect of EOC on OCB being .272 (standardised coefficient of .418) as depicted
by path c’ (B = .272, se = .028, p < .05, LLCI = .216, ULCI = .327). The Total Effect (.346) minus the
Direct Effect (.217) indicates the Indirect Effects of EOC on OCB through the mediating variables
(.074). The Indirect Effects are statistically significant (LLCI = .040, ULCI = .111) and represents
21.4% of the Total Effect. When assessing the contribution of ELDM to the total Indirect Effects, it
accounts for 112% of the total Indirect Effects (a1xb1 as a percentage of Indirect Effects) and has
thus to be evaluated in conjunction with the other mediating variable of IEWP so to understand the
combined effect.
Hence it can be ascertained that ELDM mediates the relationship between EOC and OCB. It further
implies that the prevalence of ELDM in an organisation has an influence on OCB as a mediating
variable between EOC and OCB.
Figure 4.25. Path analysis of model 2.2.
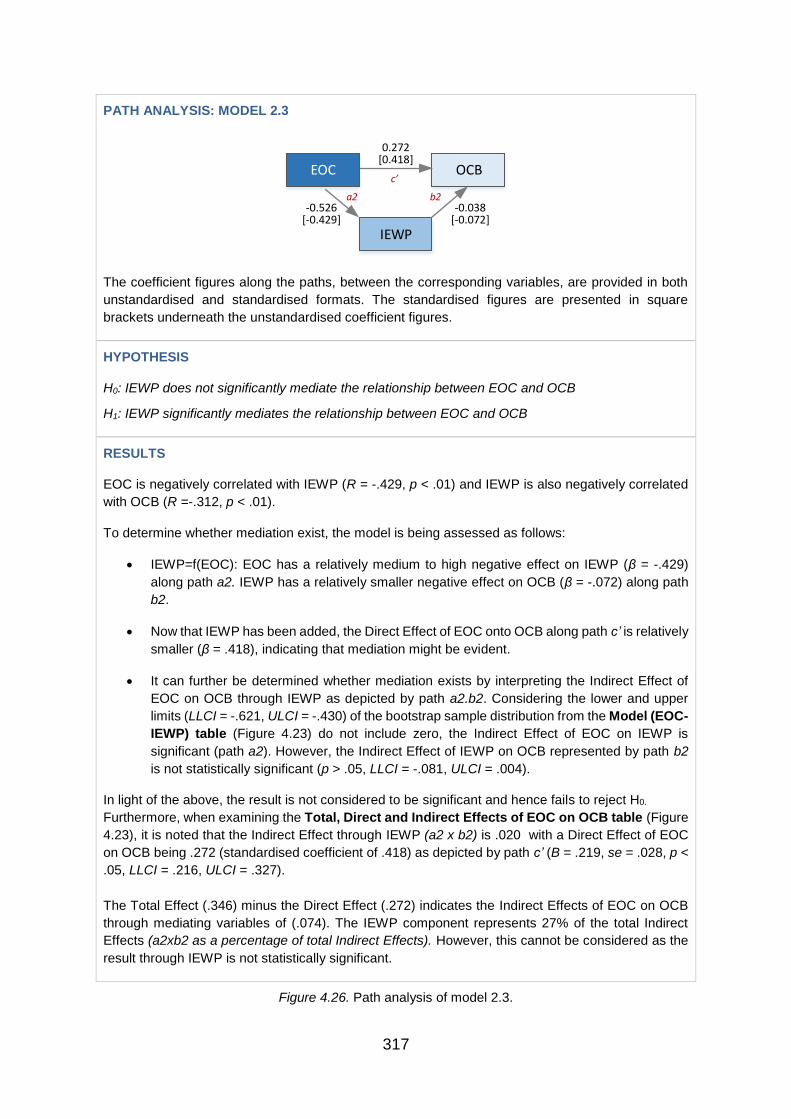
317
PATH ANALYSIS: MODEL 2.3
IEWP
EOC OCBc
a2 b2
0.272
-0.526 -0.038
[0.418]
[-0.072][-0.429]
The coefficient figures along the paths, between the corresponding variables, are provided in both
unstandardised and standardised formats. The standardised figures are presented in square
brackets underneath the unstandardised coefficient figures.
HYPOTHESIS
H0: IEWP does not significantly mediate the relationship between EOC and OCB
H1: IEWP significantly mediates the relationship between EOC and OCB
RESULTS
EOC is negatively correlated with IEWP (R = -.429, p < .01) and IEWP is also negatively correlated
with OCB (R =-.312, p < .01).
To determine whether mediation exist, the model is being assessed as follows:
IEWP=f(EOC): EOC has a relatively medium to high negative effect on IEWP (β = -.429)
along path a2. IEWP has a relatively smaller negative effect on OCB (β = -.072) along path
b2.
Now that IEWP has been added, the Direct Effect of EOC onto OCB along path c’ is relatively
smaller (β = .418), indicating that mediation might be evident.
It can further be determined whether mediation exists by interpreting the Indirect Effect of
EOC on OCB through IEWP as depicted by path a2.b2. Considering the lower and upper
limits (LLCI = -.621, ULCI = -.430) of the bootstrap sample distribution from the Model (EOC-
IEWP) table (Figure 4.23) do not include zero, the Indirect Effect of EOC on IEWP is
significant (path a2). However, the Indirect Effect of IEWP on OCB represented by path b2
is not statistically significant (p > .05, LLCI = -.081, ULCI = .004).
In light of the above, the result is not considered to be significant and hence fails to reject H0.
Furthermore, when examining the Total, Direct and Indirect Effects of EOC on OCB table (Figure
4.23), it is noted that the Indirect Effect through IEWP (a2 x b2) is .020 with a Direct Effect of EOC
on OCB being .272 (standardised coefficient of .418) as depicted by path c’ (B = .219, se = .028, p <
.05, LLCI = .216, ULCI = .327).
The Total Effect (.346) minus the Direct Effect (.272) indicates the Indirect Effects of EOC on OCB
through mediating variables of (.074). The IEWP component represents 27% of the total Indirect
Effects (a2xb2 as a percentage of total Indirect Effects). However, this cannot be considered as the
result through IEWP is not statistically significant.
Figure 4.26. Path analysis of model 2.3.

318
PATH ANALYSIS: MODEL 2.4
IEWP
EOC OCB
ELDM
a1
c
b1
a2 b2
0.272
-0.526 -0.038
0.326 0.165
[-0.072][-0.429]
[0.418]
[0.464] [0.178]
The coefficient figures along the paths, between the corresponding variables, are provided in both
unstandardised and standardised formats. The standardised figures are presented in square brackets
underneath the unstandardised coefficient figures.
HYPOTHESIS
H0: ELDM and IEWP do not significantly mediate the relationship between EOC and OCB
H1: ELDM and IEWP significantly mediate the relationship between EOC and OCB
RESULTS
Considering the results from Total, Direct and Indirect Effects of EOC on OCB table (Figure
4.23), it is noted that the Indirect Effects through ELDM and IEWP are significant as the 95%
confidence interval does not include zero (LLCI = .040, ULCI = .111). It can thus infer significant
mediation effects of ELDM and IEWP between OC and OCB.
The Total Effect between EOC and OCB is represented by the aggregate value of the Direct Effect
of EOC on OCB and the Indirect Effects of ELDM and IEWP between EOC and OCB as
represented by c’ + (a1 x b1) + (a2 x b2). When examining a breakdown of the constituting
components of the Total Effect of EOC on OCB, the following is noted:
The Indirect Effect of ELDM between EOC and OCB represented by path a1.b1 is .054
(standardised coefficient of .83).
The Indirect Effect of IEWP between EOC and OCB represented by path a2.b2 is .020 (a2
x b2). However, as a standalone basis, this is not statistically significant.
The combined Indirect Effects of ELDM & IEWP are however statistically significant,
(β = .074, se = .018, LLCI = .040, ULCI = .111) and represent 21.4% of the Total Effects
between EOC and OCB.
The Direct Effect of EOC on OCB is .272 represented by path c’. This represents 78.6% of
the Total Effect of .346 between EOC and OCB.
The standardised Total Effect result of the model, i.e. c’ + (a1 x b1) + (a2 x b2), is .531 as
per the correlation coefficient (R) between EOC and OCB.
On the basis of the above, it can be inferred that both ELDM and IEWP constitute having a
significant combined mediating effect between EOC and OCB. As observed in the earlier the
analysis of mediating effects between OC and OCB, it was again found that in this particular model
too that ELDM has a relatively bigger mediating effect as compared to IEWP on OCB.
Figure 4.27. Path analysis of model 2.4.

319
PATH ANALYSIS: MODEL 3
IEWP
OC EEBC
ELDM
a1
c
b1
a2 b2
TOTAL EFFECT MODEL
OUTCOME VARIABLE: EEBC
MODEL SUMMARY (OC-EEBC)
R R-sq MSE F df1 df2 p
0.356 0.127 0.165 75.499 1.000 521.000 0.000
MODEL (OC-EEBC)
coeff se t p LLCI ULCI
Constant 2.513 0.128 19.694 0.000 2.262 2.763
OC 0.279 0.032 8.689 0.000 0.216 0.343
STANDARDISED COEFFICIENT (OC-EEBC)
OC: 0.356
OUTCOME VARIABLE: ELDM
MODEL SUMMARY (OC-ELDM)
R R-sq MSE F df1 df2 p
0.528 0.279 0.187 201.522 1.000 521.000 0.000
MODEL (OC-ELDM)
coeff se t p LLCI ULCI
Constant 1.662 0.136 12.243 0.000 1.395 1.929
OC 0.486 0.034 14.196 0.000 0.419 0.553
STANDARDISED COEFFICIENT (OC-ELDM)
OC: 0.528
Figure 4.28. Path analysis of model 3.

320
OUTCOME VARIABLE: IEWP
MODEL SUMMARY (OC-IEWP)
R R-sq MSE F df1 df2 p
0.475 0.225 0.611 151.673 1.000 521.000 0.000
MODEL (OC-IEWP)
coeff se t p LLCI ULCI
Constant 5.704 0.246 23.228 0.000 5.222 6.187
OC -0.762 0.062 -12.316 0.000 -0.884 -0.641
STANDARDISED COEFFICIENT (OC-IEWP)
OC: -0.475
OUTCOME VARIABLE: EEBC
MODEL SUMMARY (OC-ELDM-IEWP-EEBC)
R R-sq MSE F df1 df2 p
0.451 0.203 0.151 44.132 3.000 519.000 0.000
MODEL (OC-ELDM-IEWP-EEBC)
coeff Se t p LLCI ULCI
Constant 1.610 0.192 8.380 0.000 1.233 1.987
OC 0.222 0.039 5.694 0.000 0.145 0.299
ELDM 0.251 0.040 6.336 0.000 0.173 0.329
IEWP 0.085 0.022 3.872 0.000 0.042 0.128
STANDARDISED COEFFICIENTS (OC-ELDM-IEWP-EEBC)
OC : 0.283
ELDM: 0.294
IEWP : 0.174
TOTAL, DIRECT AND INDIRECT EFFECTS OF OC ON EEBC
Effect se t p LLCI ULCI
Total effect 0.279 0.032 8.689 0.000 0.216 0.343
Direct effect 0.222 0.039 5.694 0.000 0.145 0.299
Indirect effects 0.057 0.027 0.004 0.112
Figure 4.29. Path analysis of model 3.

321
PATH ANALYSIS: MODEL 3.1
OC EEBC[0.356]
c
0.279
The coefficient figures along the path, between the corresponding variables, are provided in both
unstandardised and standardised formats. The standardised figure is presented in square brackets
underneath the unstandardised coefficient.
HYPOTHESIS
H0: There is no direct positive linear relationship between OC and EEBC
H1: There is a direct positive linear relationship between OC and EEBC
RESULTS
Based on the output results in the Model Summary (OC-EEBC) table in the Total Effect Model
(Figure 4.28) and the assessment of the relationships between OC and EEBC, the correlation
coefficient (R), which is also the standardised Beta (β) in simple regression model, is .356. As the p-
value is less than .01, H0 is rejected in favour of H1.
Hence, the results show a significant positive correlation between OC and EEBC (R = .356, p < .01).
Furthermore, the result as indicated by path c shows a Total Effect of .279 (β = .356) between OC
and EEBC (B = .279, se = .032, p < .05, LLCI = .216, ULCI = .343). As the 95% confidence interval
represented by the ranges between LLCI and ULCI does not include zero, it can be inferred
significant Total Effect of OC on EEBC.
Additionally, the Total Effect size of 0.356 between OC and EEBC is considered to be of a medium
effect. This implies that OC has a medium positive effect on EEBC.
Figure 4.30. Path analysis of model 3.1.

322
PATH ANALYSIS: MODEL 3.2
OC EEBC
ELDM
a1
c
b1
0.486 0.251
0.222
[0.528] [0.294]
[0.283]
The coefficient figures along the paths, between the corresponding variables, are provided in both
unstandardised and standardised formats. The standardised figures are presented in square brackets
underneath the unstandardised coefficient figures.
HYPOTHESIS
H0: ELDM does not significantly mediate the relationship between OC and EEBC
H1: ELDM significantly mediates the relationship between OC and EEBC
RESULTS
To assess and understand the above model, the corresponding variables are being evaluated as
follows:
ELDM=f(OC): EOC has a positive high effect on ELDM (β = .528) along path a1. ELDM has
relatively small effect on EEBC (β = .294) along path b1.
Having added ELDM to the model, the Direct Effect on EEBC along path c’ is relatively
smaller (β = .283), indicating that mediation effect might be evident.
It can be determined whether mediation exists by interpreting the Indirect Effect of OC on
EEBC through ELDM as depicted by path a1.b1. Considering the lower and upper limits
(LLCI = .419, ULCI = .553) of the bootstrap sample distribution from the Model (OC-ELDM)
table (Figure 4.28) do not include zero, the Indirect Effect of OC on ELDM is significant (path
a1). Furthermore, the Indirect Effect of ELDM on EEBC represented by path b1 is also
significant (LLCI = .173, ULCI = .329).
In light of the above, the result is considered to be significant and hence H0 is rejected in favour of
H1.
Furthermore, when examining the Total, Direct and Indirect Effects of OC on EEBC table (Figure
4.29), it is noted that the Indirect Effect through ELDM (a1 x b1) is .123 (standardised coefficient of
.155) with a Direct Effect of OC on EEBC being .222 (standardised coefficient of .283) as depicted
by path c’ (B = .222, se = .039, p < .05, LLCI = .145, ULCI = .229).
The Total Effect (.279) minus the Direct Effect (.222) indicates the Indirect Effects of OC on EEBC
through mediating variables (.057). The Indirect Effects are statistically significant (LLCI = .004, ULCI
= .112) and accounts for 20.4% of the Total Effects.
Figure 4.31. Path analysis of model 3.2.

323
PATH ANALYSIS: MODEL 3.3
IEWP
OC EEBCc
a2 b2
[0.283]
-0.762 0.085
0.222
[0.174][-0.475]
The coefficient figures along the paths, between the corresponding variables, are provided in both
unstandardised and standardised formats. The standardised figures are presented in square brackets
underneath the unstandardised coefficient figures.
HYPOTHESIS
H0: IEWP does not significantly mediate the relationship between OC and EEBC
H1: IEWP significantly mediates the relationship between OC and EEBC
RESULTS
OC is negatively correlated with IEWP (R = -.475, p < .01) and IEWP has a small insignificant
negative correlation with EEBC (R = -.061, p > .01).
To determine whether mediation exist, the model is being assessed as follows:
IEWP=f(OC): OC has a relatively medium to high negative effect on IEWP (β = -.475) along
path a2. IEWP has a relatively smaller negative effect on EEBC (β = -.174) along path b2.
Now that IEWP has been added, the Direct Effect of OC onto EEBC along path c’ is relatively
smaller (β = .283), indicating that mediation might be evident.
It can further be determined whether mediation exists by interpreting the Indirect Effect of
OC on EEBC through IEWP as depicted by path a2.b2. Considering the lower and upper
limits (LLCI = -.884, ULCI = -.641) of the bootstrap sample distribution from the Model (OC-
IEWP) table (Figure 4.29) do not include zero, the Indirect Effect of OC on IEWP is significant
(path a2). The Indirect Effect of IEWP on EEBC represented by path b2 is also significant (p
< .05, LLCI = -.042, ULCI = .128).
In light of the above, the result is considered to be significant and hence H0 is rejected in favour of
H1. Furthermore, when examining the Total, Direct and Indirect Effects of OC on EEBC table
(Figure 4.29), it is noted that the Indirect Effect through IEWP (a2 x b2) is -.065 (standardised
coefficient of -.083) with a Direct Effect of OC on EEBC being .222 (standardised coefficient of .283)
as depicted by path c’ (B = .222, se = .039, p < .05, LLCI = .145, ULCI = .299).
The Total Effect (.279) minus the Direct Effect (.222) indicates that Indirect Effects of OC on EEBC
through the mediating variables (.057). The Indirect Effects are statistically significant (LLCI = .004,
ULCI = .112) and represents 20.4% of the Total Effect.
Hence it can be ascertained that IEWP has a negative mediation effect on EEBC indicating that a
growing prevalence of IEWP in the organisation would have a counterproductive mediating effect on
EEBC.
Figure 4.32. Path analysis of model 3.3.

324
PATH ANALYSIS: MODEL 3.4
IEWP
OC EEBC
ELDM
a1
c
b1
a2 b2
[0.283]
-0.762 0.085
0.486 0.251
[0.174][-0.475]
0.222
[0.528] [0.294]
The coefficient figures along the paths, between the corresponding variables, are provided in both
unstandardised and standardised formats. The standardised figures are presented in square brackets
underneath the unstandardised coefficient figures.
HYPOTHESIS
H0: ELDM and IEWP do not significantly mediate the relationship between OC and EEBC
H1: ELDM and IEWP significantly mediate the relationship between OC and EEBC
RESULTS
Considering the results from Total, Direct and Indirect Effects of OC on EEBC table (Figure
4.29), it is noted that the Indirect Effects through ELDM and IEWP are significant as the 95%
confidence interval does not include zero (LLCI = .004, ULCI = .112). It can thus be inferred that
there are statistically significant mediation effects of ELDM and IEWP between OC and EEBC.
The Total Effect between OC and EEBC is represented by the aggregate value of the Direct Effect
of OC on EEBC and the Indirect Effects of ELDM and IEWP between OC and EEBC as
represented by c’ + (a1 x b1) + (a2 x b2).
When examining a breakdown of the constituting components of the Total Effect of OC on EEBC,
the following is noted:
The Indirect Effect of ELDM between OC and EEBC represented by path a1.b1 is .122
(standardised coefficient of .155).
The Indirect Effect of IEWP between OC and EEBC represented by path a2.b2 is -.065
(standardised coefficient of -.083).
The combined Indirect Effects of ELDM & IEWP (β = .057, se = .027, LLCI = .004, ULCI =
.112) represent 20.4% of the Total Effects between OC and EEBC.
The Direct Effect of OC on EEBC is .222 represented by path c’. This represents 79.6% of
the Total Effect of .279 between OC and EEBC.
The standardised Total Effect result of the model, i.e. (c’ + (a1 x b1) + (a2 x b2)), is .356 as
per the correlation coefficient (R) between OC and EEBC.
On the basis of the above, it can be inferred that both ELDM and IEWP constitute having a
statistically significant combined mediating effect between OC and EEBC. However, ELDM has a
relatively bigger mediating effect as compared to IEWP on EEBC.
Figure 4.33. Path analysis of model 3.4.

325
PATH ANALYSIS: MODEL 4
IEWP
EOC EEBC
ELDM
a1
c
b1
a2 b2
TOTAL EFFECT MODEL
OUTCOME VARIABLE: EEBC
MODEL SUMMARY (EOC-EEBC)
R R-sq MSE F df1 df2 p
0.467 0.218 0.148 145.484 1.000 521.000 0.000
MODEL (EOC-OCB)
coeff se t p LLCI ULCI
Constant 2.570 0.088 29.242 0.000 2.397 2.743
EOC 0.280 0.023 12.062 0.000 0.235 0.326
STANDARDISED COEFFICIENT (EOC-OCB)
EOC: 0.467
OUTCOME VARIABLE: ELDM
MODEL SUMMARY (EOC-ELDM)
R R-sq MSE F df1 df2 p
0.464 0.215 0.203 142.946 1.000 521.000 0.000
MODEL (EOC-ELDM)
coeff se t p LLCI ULCI
Constant 2.361 0.103 22.890 0.000 2.158 2.563
EOC 0.326 0.027 11.956 0.000 0.272 0.379
STANDARDISED COEFFICIENT (EOC-ELDM)
EOC: 0.464
Figure 4.34. Path analysis of model 4.

326
OUTCOME VARIABLE: IEWP
MODEL SUMMARY (EOC-IEWP)
R R-sq MSE F df1 df2 p
0.429 0.184 0.644 117.401 1.000 521.000 0.000
MODEL (EOC-IEWP)
coeff se t p LLCI ULCI
Constant 4.661 0.184 25.397 0.000 4.301 5.022
EOC -0.526 0.049 -10.835 0.000 -0.621 -0.430
STANDARDISED COEFFICIENT (EOC-IEWP)
EOC: -0.429
OUTCOME VARIABLE: EEBC
MODEL SUMMARY (EOC-ELDM-IEWP-EEBC)
R R-sq MSE F df1 df2 p
0.539 0.291 0.135 70.875 3.000 519.000 0.000
MODEL (EOC-ELDM-IEWP-EEBC)
coeff se t p LLCI ULCI
Constant 1.571 0.162 9.704 0.000 1.253 1.889
EOC 0.265 0.026 10.017 0.000 0.213 0.317
ELDM 0.216 0.036 5.958 0.000 0.145 0.287
IEWP 0.105 0.020 5.164 0.000 0.065 0.145
STANDARDISED COEFFICIENTS (EOC-ELDM-IEWP-EEBC)
EOC : 0.442
ELDM: 0.253
IEWP : 0.215
TOTAL, DIRECT AND INDIRECT EFFECTS OF EOC ON EEBC
Effect se t p LLCI ULCI
Total effect 0.280 0.023 12.062 0.000 0.235 0.326
Direct effect 0.265 0.026 10.017 0.000 0.213 0.317
Indirect effects 0.015 0.017 -0.017 0.048
Figure 4.35. Path analysis of model 4.

327
PATH ANALYSIS: MODEL 4.1
EOC EEBC[0.467]
c
0.280
The coefficient figures along the path, between the corresponding variables, are provided in both
unstandardised and standardised formats. The standardised figure is presented in square brackets
underneath the unstandardised coefficient.
HYPOTHESIS
H0: There is no direct positive linear relationship between EOC and EEBC
H1: There is a direct positive linear relationship between EOC and EEBC
RESULTS
Based on the output results in the Model Summary (EOC-EEBC) table in the Total Effect Model
(Figure 4.34), an assessment of the relationships between EOC and EEBC was conducted. The
correlation coefficient (R), which is also standardised Beta (β) in simple regression model, is .467.
As the p-value is less than .01, H0 is rejected in favour of H1.
Hence, the results show a significant positive correlation between EOC and EEBC (R = .467, p <
.01).
Furthermore, the result as indicated by path c shows a Total Effect of .280 (β = .467) between EOC
and EEBC (B = .280, se = .023, p < .05, LLCI = .235, ULCI = .326). As the 95% confidence interval
represented by the range between LLCI and ULCI does not include zero, it infers statistically
significant Total Effect of EOC on EEBC.
Additionally, the Total Effect size of .467 between EOC and EEBC is considered to be a medium to
high effect being relatively closer to the .50 (high threshold). This implies that EOC has a relatively
medium to high positive effect of EEBC.
Figure 4.36. Path analysis of model 4.1.

328
PATH ANALYSIS: MODEL 4.2
EOC EEBC
ELDM
a1
c
b1
0.326 0.216
0.265[0.442]
[0.464] [0.253]
The coefficient figures along the paths, between the corresponding variables, are provided in both
unstandardised and standardised formats. The standardised figures are presented in square brackets
underneath the unstandardised coefficient figures.
HYPOTHESIS
H0: ELDM does not significantly mediate the relationship between EOC and EEBC
H1: ELDM significantly mediates the relationship between EOC and EEBC
RESULTS
To assess and understand the above model, the corresponding variables are being assessed as
follows:
ELDM=f(EOC): EOC has a positive high effect on ELDM (β =.464) along path a1. ELDM has
relatively small effect on EEBC (β = .253) along path b1.
Having added ELDM to the model, the Direct Effect on EEBC along path c’ (β = .442) is
relatively close to the Total Effect of EOC on EEBC, indicating that mediation effect might
not be evident.
It can further be determined whether mediation exists by interpreting the Indirect Effect of
EOC on EEBC through ELDM as depicted by path a1.b1. Considering the lower and upper
limits (LLCI = .272, ULCI = .379) of the bootstrap sample distribution from the Model (EOC-
ELDM) table (Figure 4.34) do not include zero, the Indirect Effect of EOC on ELDM is
significant (path a1). Furthermore, the Indirect Effect of ELDM on EEBC represented by path
b1 is also significant (LLCI = .145, ULCI = .287).
In light of the above, the result is considered to be significant and hence H0 is rejected in favour of
H1.
Furthermore, when examining the Total, Direct and Indirect Effects of EOC on EEBC table (Figure
4.35) it is noted that the Indirect Effect through ELDM (a1 x b1) is .070 (standardised coefficient of
.117) with a Direct Effect of EOC on EEBC being .265 (standardised coefficient of .442) as depicted
by path c’ (B = .265, se = .026, p < .05, LLCI = .213, ULCI = .317).
The Total Effect (.280) minus the Direct Effect (.265) indicates the Indirect Effects of EOC on EEBC
through the mediating variables (.015). However, the Indirect Effects are not statistically significant
(LLCI = -.017, ULCI = .048) despite ELDM is statistically mediating significantly on EEBC.
Figure 4.37. Path analysis of model 4.

329
PATH ANALYSIS: MODEL 4.3
IEWP
EOC EEBCc
a2 b2
0.265
-0.526 0.105
[0.442]
[-0.429] [0.215]
The coefficient figures along the paths, between the corresponding variables, are provided in both
unstandardised and standardised formats. The standardised figures are presented in square brackets
underneath the unstandardised coefficient figures.
HYPOTHESIS
H0: IEWP does not significantly mediate the relationship between EOC and EEBC
H1: IEWP significantly mediates the relationship between EOC and EEBC
RESULTS
EOC is negatively correlated with IEWP (R = -.429, p < .01) and IEWP has a small statistically
insignificant negative correlation with EEBC (R = -.061, p > .01).
To determine whether mediation exist, the model is being assessed as follows:
IEWP=f(EOC): EOC has a relatively medium to high negative effect on IEWP (β = -.429)
along path a2. IEWP has a relatively smaller positive effect on EEBC (β = .215), on a
standalone basis, along path b2.
Now that IEWP has been added, the Direct Effect of EOC onto EEBC along path c’ (β = .442)
is relatively close to the Total Effect of EOC on EEBC, indicating that mediation effect might
not be evident.
It can be determined whether mediation exists by interpreting the Indirect Effect of EOC on
EEBC through IEWP as depicted by path a2.b2. Considering the lower and upper limits (LLCI
= -.621, ULCI = -.430) of the bootstrap sample distribution from the Model (EOC-IEWP) table
(Figure 4.35) do not include zero, the Indirect Effect of EOC on IEWP is significant (path a2).
The Indirect Effect of IEWP on EEBC represented by path b2 is also significant (p < .05, LLCI
= -.065, ULCI =.145).
In light of the above, the result is considered to be significant and hence H0 is rejected in favour of H1
Furthermore, when examining the Total, Direct and Indirect Effects of EOC on EEBC table (Figure
4.35), it is noted that the Indirect Effect through IEWP (a2 x b2) is -.055 (standardised coefficient of
-.092) with a Direct Effect of EOC on EEBC being .265 (standardised coefficient of .442) as depicted
by path c’ (B = .265, se = .026, p < .05, LLCI = .213, ULCI = .317).
The Total Effect (.280) minus the Direct Effect (.265) indicates the Indirect Effects of EOC on EEBC
through the mediating variables (.015). However, the Indirect Effects are not statistically significant
(LLCI = -.017, ULCI = .048) despite IEWP is statistically mediating significantly on EEBC.
Figure 4.38. Path analysis of model 4.3.
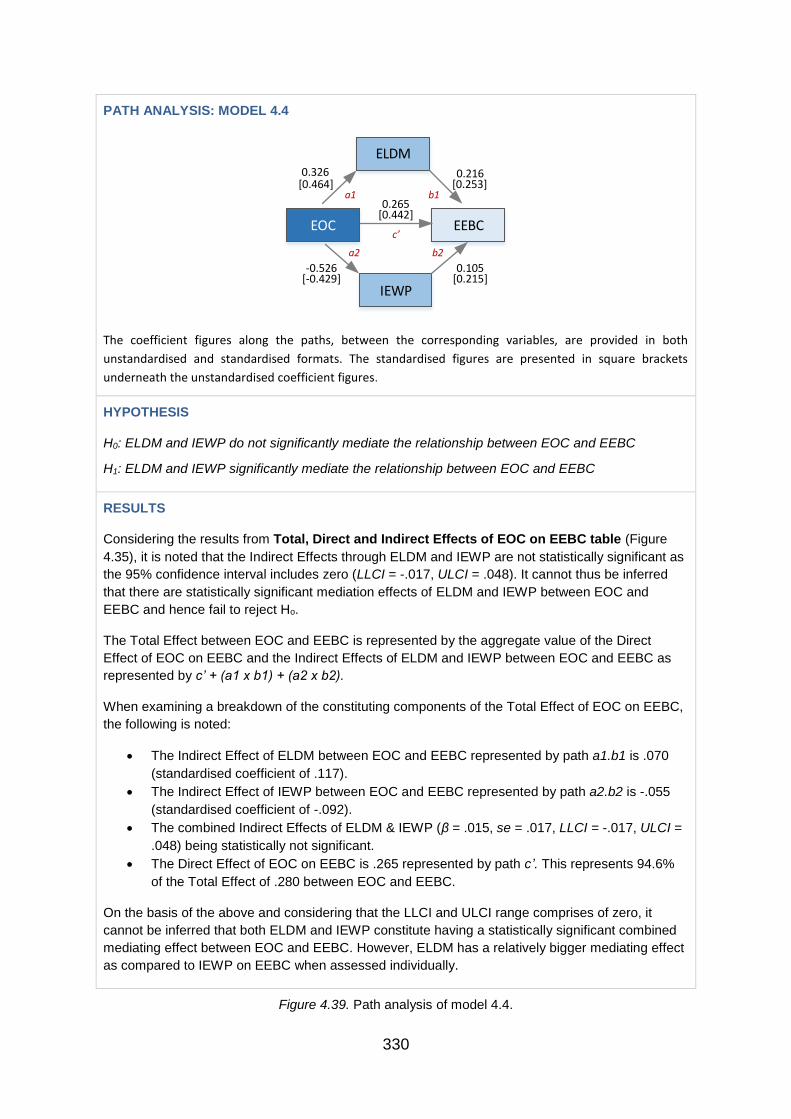
330
PATH ANALYSIS: MODEL 4.4
IEWP
EOC EEBC
ELDM
a1
c
b1
a2 b2
[0.442]
-0.526 0.105
0.326 0.216
[-0.429] [0.215]
[0.464] [0.253]
0.265
The coefficient figures along the paths, between the corresponding variables, are provided in both
unstandardised and standardised formats. The standardised figures are presented in square brackets
underneath the unstandardised coefficient figures.
HYPOTHESIS
H0: ELDM and IEWP do not significantly mediate the relationship between EOC and EEBC
H1: ELDM and IEWP significantly mediate the relationship between EOC and EEBC
RESULTS
Considering the results from Total, Direct and Indirect Effects of EOC on EEBC table (Figure
4.35), it is noted that the Indirect Effects through ELDM and IEWP are not statistically significant as
the 95% confidence interval includes zero (LLCI = -.017, ULCI = .048). It cannot thus be inferred
that there are statistically significant mediation effects of ELDM and IEWP between EOC and
EEBC and hence fail to reject Ho.
The Total Effect between EOC and EEBC is represented by the aggregate value of the Direct
Effect of EOC on EEBC and the Indirect Effects of ELDM and IEWP between EOC and EEBC as
represented by c’ + (a1 x b1) + (a2 x b2).
When examining a breakdown of the constituting components of the Total Effect of EOC on EEBC,
the following is noted:
The Indirect Effect of ELDM between EOC and EEBC represented by path a1.b1 is .070
(standardised coefficient of .117).
The Indirect Effect of IEWP between EOC and EEBC represented by path a2.b2 is -.055
(standardised coefficient of -.092).
The combined Indirect Effects of ELDM & IEWP (β = .015, se = .017, LLCI = -.017, ULCI =
.048) being statistically not significant.
The Direct Effect of EOC on EEBC is .265 represented by path c’. This represents 94.6%
of the Total Effect of .280 between EOC and EEBC.
On the basis of the above and considering that the LLCI and ULCI range comprises of zero, it
cannot be inferred that both ELDM and IEWP constitute having a statistically significant combined
mediating effect between EOC and EEBC. However, ELDM has a relatively bigger mediating effect
as compared to IEWP on EEBC when assessed individually.
Figure 4.39. Path analysis of model 4.4.

331
PATH ANALYSIS: MODEL 5
IEWP
OC PEP
ELDM
a1
c
b1
a2 b2
TOTAL EFFECT MODEL
OUTCOME VARIABLE: PEP
MODEL SUMMARY (OC-PEP)
R R-sq MSE F df1 df2 p
0.597 0.356 0.194 288.073 1.000 521.000 0.000
MODEL (OC-PEP)
coeff se t p LLCI ULCI
Constant 1.482 0.138 10.712 0.000 1.210 1.754
OC 0.592 0.035 16.973 0.000 0.524 0.661
STANDARDISED COEFFICIENT (OC-PEP)
OC: 0.597
OUTCOME VARIABLE: ELDM
MODEL SUMMARY (OC-ELDM)
R R-sq MSE F df1 df2 p
0.528 0.279 0.187 201.522 1.000 521.000 0.000
MODEL (OC-ELDM)
coeff se t p LLCI ULCI
Constant 1.662 0.136 12.243 0.000 1.395 1.929
OC 0.486 0.034 14.196 0.000 0.419 0.553
STANDARDISED COEFFICIENT (OC-ELDM)
OC: 0.528
Figure 4.40. Path analysis of model 5.
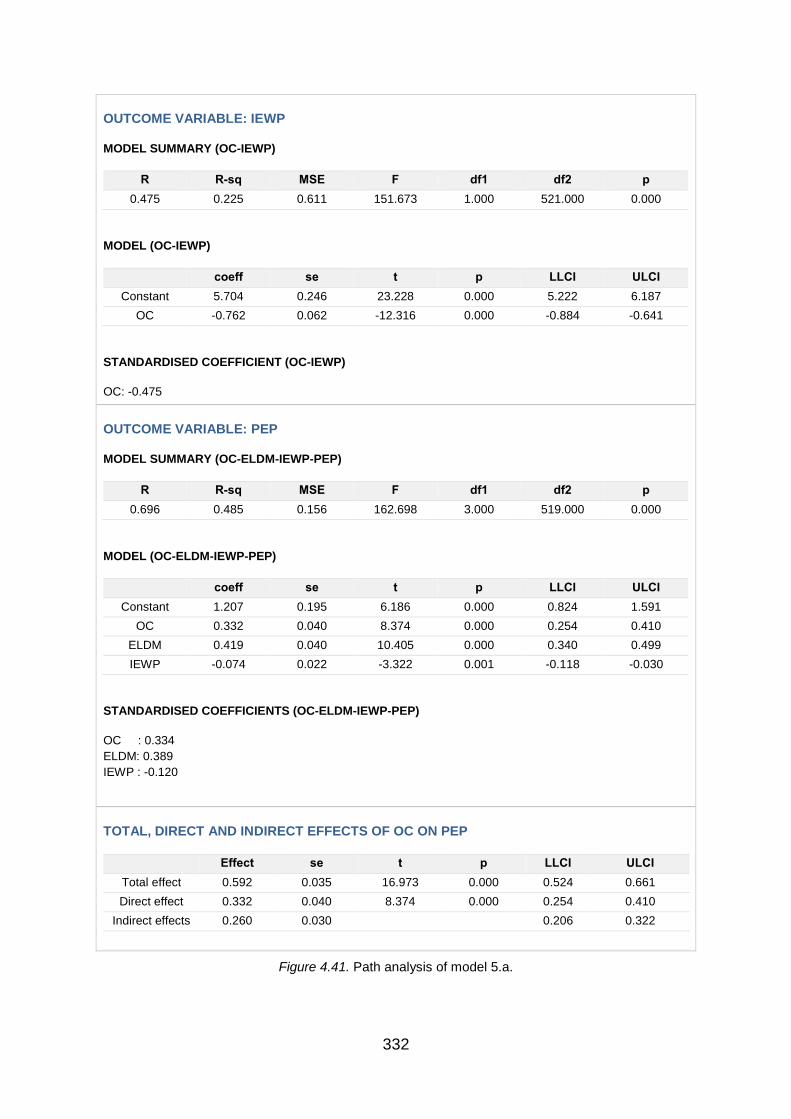
332
OUTCOME VARIABLE: IEWP
MODEL SUMMARY (OC-IEWP)
R R-sq MSE F df1 df2 p
0.475 0.225 0.611 151.673 1.000 521.000 0.000
MODEL (OC-IEWP)
coeff se t p LLCI ULCI
Constant 5.704 0.246 23.228 0.000 5.222 6.187
OC -0.762 0.062 -12.316 0.000 -0.884 -0.641
STANDARDISED COEFFICIENT (OC-IEWP)
OC: -0.475
OUTCOME VARIABLE: PEP
MODEL SUMMARY (OC-ELDM-IEWP-PEP)
R R-sq MSE F df1 df2 p
0.696 0.485 0.156 162.698 3.000 519.000 0.000
MODEL (OC-ELDM-IEWP-PEP)
coeff se t p LLCI ULCI
Constant 1.207 0.195 6.186 0.000 0.824 1.591
OC 0.332 0.040 8.374 0.000 0.254 0.410
ELDM 0.419 0.040 10.405 0.000 0.340 0.499
IEWP -0.074 0.022 -3.322 0.001 -0.118 -0.030
STANDARDISED COEFFICIENTS (OC-ELDM-IEWP-PEP)
OC : 0.334
ELDM: 0.389
IEWP : -0.120
TOTAL, DIRECT AND INDIRECT EFFECTS OF OC ON PEP
Effect se t p LLCI ULCI
Total effect 0.592 0.035 16.973 0.000 0.524 0.661
Direct effect 0.332 0.040 8.374 0.000 0.254 0.410
Indirect effects 0.260 0.030 0.206 0.322
Figure 4.41. Path analysis of model 5.a.

333
PATH ANALYSIS: MODEL 5.1
OC PEP[0.597]
c
0.592
The coefficient figures along the path, between the corresponding variables, are provided in both
unstandardised and standardised formats. The standardised figure is presented in square brackets
underneath the unstandardised coefficient.
HYPOTHESIS
H0: There is no direct positive linear relationship between OC and PEP
H1: There is a direct positive linear relationship between OC and PEP
RESULTS
Based on the output results in the Model Summary (OC-PEP) table in the Total Effect Model
(Figure 4.40), an assessment of the relationships between OC and PEP was conducted. The
correlation coefficient (R), which is also the standardised Beta (β) in simple regression model, is .597.
As the p-value is less than .01, H0 is rejected in favour of H1.
Hence, the results show a statistically significant positive correlation between OC and PEP (R = .597,
p < .01).
Furthermore, the result as indicated by path c shows a Total Effect of .592 (β = .597) between OC
and PEP (B = .592, se = .035, p < .05, LLCI = .524, ULCI = .661). As the 95% confidence interval
represented by the range between LLCI and ULCI does not include zero, it can be inferred that
there is statistically significant Total Effect of OC on PEP.
Additionally, the Total Effect size of .597 between OC and PEP is considered to be of high effect. In
other words, OC has a high positive effect on PEP.
Figure 4.42. Path analysis of model 5.1

334
PATH ANALYSIS: MODEL 5.2
OC PEP
ELDM
a1
c
b1
0.486 0.419
0.332[0.334]
[0.389][0.528]
The coefficient figures along the paths, between the corresponding variables, are provided in both
unstandardised and standardised formats. The standardised figures are presented in square brackets
underneath the unstandardised coefficient figures.
HYPOTHESIS
H0: ELDM does not significantly mediate the relationship between OC and PEP
H1: ELDM significantly mediates the relationship between OC and PEP
RESULTS
To assess and understand the above model, the corresponding variables are assessed as follows:
ELDM=f(OC): OC has a positive high effect on ELDM (β = .528) along path a1. ELDM has a
medium effect on EEBC (β = .389) along path b1.
Having added ELDM to the model, the Direct Effect on EEBC along path c’ (β = .344) is
relatively smaller, indicating that mediation might be evident.
It can be determined whether mediation exists by interpreting the Indirect Effect of OC on
PEP through ELDM as depicted by path a1.b1. Considering the lower and upper limits (LLCI
= .419, ULCI = .533) of the bootstrap sample distribution from the Model (OC-ELDM) table
(Figure 4.40) do not include zero, the Indirect Effect of OC on ELDM is significant (path a1).
Furthermore, the Indirect Effect of ELDM on PEP represented by path b1 is also significant
(LLCI = .340, ULCI = .499).
In light of the above, the result is considered to be significant and hence H0 is rejected in favour of
H1. Furthermore, when examining the Total, Direct and Indirect Effects of OC on PEP table (Figure
4.41), it is noted that the Indirect Effect through ELDM (a1 x b1) is 0.204 (standardised coefficient of
.205) with a Direct Effect of OC on PEP being .332 (standardised coefficient of .334) as depicted by
path c’ (B = .322, se = .040, p < .05, LLCI = .254, ULCI = 0.410).
The Total Effect (.592) minus the Direct Effect (.332) indicates that the Indirect Effects of OC on PEP
through mediating variables (.260). The Indirect Effects are statistically significant (LLCI = .206, ULCI
= .322) and represents 43.9% of the Total Effects. When assessing the contribution of ELDM in this
process, it is noted that ELDM accounts for around 78.5% of the total Indirect Effects (a1xb1 as a
percentage of Indirect Effects).
Hence it can be ascertained that ELDM significantly mediates the relationship between OC and PEP.
It further indicates that the prevalence of ELDM in the workplace has a bearing as a mediator on
PEP.
Figure 4.43. Path analysis of model 5.2.

335
PATH ANALYSIS: MODEL 5.3
IEWP
OC PEPc
a2 b2
[0.334]
-0.762 -0.074
0.332
[-0.120][-0.475]
The coefficient figures along the paths, between the corresponding variables, are provided in both
unstandardised and standardised formats. The standardised figures are presented in square brackets
underneath the unstandardised coefficient figures.
HYPOTHESIS
H0: IEWP does not significantly mediate the relationship between OC and PEP
H1: IEWP significantly mediates the relationship between OC and PEP
RESULTS
OC is negatively correlated with IEWP (R = -.475, p < .01) and IEWP has a statistically significant
negative correlation with PEP (R = -.411, p < .01).
To determine whether mediation exist, the model is being assessed as follows:
IEWP=f(OC): OC has a relatively medium to high negative effect on IEWP (β = -.475) along
path a2. IEWP has a relatively smaller negative effect on EEBC (β = -.120), on a standalone
basis, along path b2.
Now that IEWP has been added, the Direct Effect of EOC onto EEBC along path c’ (β = .334)
is relatively smaller, indicating that mediation effect might be evident.
It can be determined whether mediation exists by interpreting the Indirect Effect of OC on
PEP through IEWP as depicted by path a2.b2. Considering the lower and upper limits (LLCI
= -.884, ULCI = -.641) of the bootstrap sample distribution from the Model (OC-IEWP) table
(Figure 4.41) do not include zero, the Indirect Effect of OC on IEWP is significant (path a2).
The Indirect Effect of IEWP on PEP represented by path b2 is also statistically significant (p
< .05, LLCI = -.118, ULCI = -.030).
In light of the above, the result is considered to be significant and hence H0 is rejected in favour of H1
Furthermore, when examining the Total, Direct and Indirect Effects of OC on PEP table (Figure
4.41), it is noted that the Indirect Effect through IEWP is .056 (a2 x b2) with a Direct Effect of OC on
PEP being .332 as depicted by path c’ (β = .332, se = .040, p < .05, LLCI = .254, ULCI = .410).
The Total Effect (.592) minus the Direct Effect (.332) indicates that Indirect Effects of OC on PEP
through the mediating variables (.260). The Indirect Effects are statistically significant (LLCI = .206,
ULCI = .332) and represents 43.9% of the Total Effect.
Hence it can be ascertained that IEWP has a mediation effect on PEP indicating that a prevalence
of IEWP in the organisation would have mediating effect on PEP.
Figure 4.44. Path analysis of model 5.3.

336
PATH ANALYSIS: MODEL 5.4
IEWP
OC PEP
ELDM
a1
c
b1
a2 b2
0.332
-0.762 -0.074
0.486 0.419
[-0.120][-0.475]
[0.334]
[0.389][0.528]
The coefficient figures along the paths, between the corresponding variables, are provided in both
unstandardised and standardised formats. The standardised figures are presented in square brackets
underneath the unstandardised coefficient figures.
HYPOTHESIS
H0: ELDM and IEWP do not significantly mediate the relationship between OC and PEP
H1: ELDM and IEWP significantly mediate the relationship between OC and PEP
RESULTS
Considering the results from Total, Direct and Indirect Effects of OC on PEP table (Figure 4.41),
it is noted that the Indirect Effects through ELDM and IEWP are statistically significant as the 95%
confidence interval does not include zero (LLCI = .206, ULCI = .322). It can thus be inferred that
there is statistically significant mediation effect of ELDM and IEWP between OC and PEP and
hence Ho is rejected in favour of H1.
The Total Effect between OC and PEP is represented by the aggregate value of the Direct Effect of
OC on PEP and the Indirect Effects of ELDM and IEWP between OC and PEP as represented by c’
+ (a1 x b1) + (a2 x b2). When examining a breakdown of the constituting components of the Total
Effect of OC on PEP, the following is noted:
The Indirect Effect of ELDM between OC and PEP represented by path a1.b1 is .204
(standardised coefficient of .205). This represents 78.8% of the total Indirect Effects of .260
between OC and PEP.
The Indirect Effect of IEWP between OC and PEP represented by path a2.b2 is .056
(standardised coefficient of .057). This represents 21.9% of the total Indirect Effects of.260
between OC and PEP.
The combined Indirect Effects of ELDM & IEWP (β = .260, se =.030, LLCI = -.206, ULCI =
.322) represent 43.9% of the Total Effects between OC and PEP
The Direct Effect of OC on PEP is .332 represented by path c’. This represents 56.1% of
the Total Effect of .592 between OC and PEP.
The standardised Total Effect result of the model, i.e. (c’ + (a1 x b1) + (a2 x b2)), is .592 as
per the correlation coefficient (R) between OC and PEP.
On the basis of the above, it can be inferred that both ELDM and IEWP constitute having a
statistically significant combined mediating effect between OC and PEP. However, ELDM has a
relatively bigger mediating effect as compared to IEWP on PEP.
Figure 4.45. Path analysis of model 5.4.

337
PATH ANALYSIS: MODEL 6
IEWP
EOC PEP
ELDM
a1
c
b1
a2 b2
TOTAL EFFECT MODEL
OUTCOME VARIABLE: PEP
MODEL SUMMARY (EOC-PEP)
R R-sq MSE F df1 df2 p
0.588 0.345 0.197 274.981 1.000 521.000 0.000
MODEL (EOC-PEP)
coeff se t p LLCI ULCI
Constant 2.155 0.102 21.211 0.000 1.955 2.354
EOC 0.445 0.027 16.583 0.000 0.393 0.498
STANDARDISED COEFFICIENT (EOC-PEP)
EOC: 0.588
OUTCOME VARIABLE: ELDM
MODEL SUMMARY (EOC-ELDM)
R R-sq MSE F df1 df2 p
0.464 0.215 0.203 142.946 1.000 521.000 0.000
MODEL (EOC-ELDM)
coeff se t p LLCI ULCI
Constant 2.361 0.103 22.890 0.000 2.158 2.563
EOC 0.326 0.027 11.956 0.000 0.272 0.379
STANDARDISED COEFFICIENT (OC-ELDM)
EOC: 0.464
Figure 4.46. Path analysis of model 6.

338
OUTCOME VARIABLE: IEWP
MODEL SUMMARY (EOC-IEWP)
R R-sq MSE F df1 df2 p
0.429 0.184 0.644 117.401 1.000 521.000 0.000
MODEL (EOC-IEWP)
coeff se t p LLCI ULCI
Constant 4.661 0.184 25.397 0.000 4.301 5.022
EOC -0.526 0.049 -10.835 0.000 -0.621 -0.430
STANDARDISED COEFFICIENT (EOC-IEWP)
EOC: -0.429
OUTCOME VARIABLE: PEP
MODEL SUMMARY (EOC-ELDM-IEWP-PEP)
R R-sq MSE F df1 df2 p
0.707 0.500 0.151 172.788 3.000 519.000 0.000
MODEL (EOC-ELDM-IEWP-PEP)
coeff se t p LLCI ULCI
Constant 1.490 0.172 8.674 0.000 1.152 1.827
EOC 0.263 0.028 9.372 0.000 0.208 0.318
ELDM 0.434 0.038 11.305 0.000 0.359 0.510
IEWP -0.077 0.022 -3.579 0.000 -0.120 -0.035
STANDARDISED COEFFICIENTS (EOC-ELDM-IEWP-PEP)
EOC : 0.347
ELDM: 0.403
IEWP : -0.125
TOTAL, DIRECT AND INDIRECT EFFECTS OF EOC ON PEP
Effect se t p LLCI ULCI
Total effect 0.445 0.027 16.583 0.000 0.393 0.498
Direct effect 0.263 0.028 9.372 0.000 0.208 0.318
Indirect effects 0.182 0.022 0.141 0.228
Figure 4.47. Path analysis of model 6.

339
PATH ANALYSIS: MODEL 6.1
EOC PEP[0.588]
c
0.445
The coefficient figures along the path, between the corresponding variables, are provided in both
unstandardised and standardised formats. The standardised figure is presented in square brackets
underneath the unstandardised coefficient.
HYPOTHESIS
H0: There is no direct positive linear relationship between EOC and PEP
H1: There is a direct positive linear relationship between EOC and PEP
RESULTS
Based on the output results in the Model Summary (EOC-PEP) table in the Total Effect Model
(Figure 4.46), an assessment of the relationships between EOC and PEP was conducted. The
correlation coefficient (R), which is also the standardised Beta (β) in simple regression model, is .588.
As the p-value is less than .01, H0 is rejected in favour of H1.
Hence, the results show a significant positive correlation between EOC and PEP (R = .588, p < .01).
Furthermore, the result as indicated by path c shows a Total Effect of 0.445 (β = .588] between
EOC and PEP (B = .445, se = .027, p < .05, LLCI = .393, ULCI = .498). As the 95% confidence
interval represented by the range between LLCI and ULCI does not include zero, it can be inferred
that there is statistically significant Total Effect of EOC on PEP.
Additionally, the Total Effect size of .588 between OC and PEP is considered to be of high effect. In
other words, EOC has a high positive effect on PEP.
Figure 4.48. Path analysis of model 6.1.

340
PATH ANALYSIS: MODEL 6.2
EOC PEP
ELDM
a1
c
b1
0.326 0.434
0.263[0.347]
[0.403][0.464]
The coefficient figures along the paths, between the corresponding variables, are provided in both
unstandardised and standardised formats. The standardised figures are presented in square brackets
underneath the unstandardised coefficient figures.
HYPOTHESIS
H0: ELDM does not significantly mediate the relationship between EOC and PEP
H1: ELDM significantly mediates the relationship between EOC and PEP
RESULTS
To assess and understand the above model, the corresponding variables are being assessed as
follows:
ELDM=f(EOC): EOC has a positive medium to high effect on ELDM (β = .464) along path
a1. ELDM has a medium effect on EEBC (β = .403) along path b1.
Having added ELDM to the model, the Direct Effect on EEBC along path c’ (β = .347) is
relatively smaller, indicating that mediation might be evident.
It can be determined whether mediation exists by interpreting the Indirect Effect of EOC on
PEP through ELDM as depicted by path a1.b1. Considering the lower and upper limits (LLCI
= .272, ULCI = .379) of the bootstrap sample distribution from the Model (EOC-ELDM) table
(Figure 4.46) do not include zero, the Indirect Effect of EOC on ELDM is significant (path a1).
Furthermore, the Indirect Effect of ELDM on PEP represented by path b1 is also significant
(LLCI = .359, ULCI = .510).
In light of the above, the result is considered to be significant and hence H0 is rejected in favour of
H1. Furthermore, when examining the Total, Direct and Indirect Effects of EOC on PEP table
(Figure 4.47), it is noted that the Indirect Effect through ELDM (a1 x b1) is .142 (standardised
coefficient of .187) with a Direct Effect of EOC on PEP being .263 (standardised coefficient of .347)
as depicted by path c’ (B = .263, se = .028, p < .05, LLCI = .208, ULCI = .318).
The Total Effect (.445) minus the Direct Effect (.263) indicates that the Indirect Effects of OC on PEP
through mediating variables (.182). The Indirect Effects are statistically significant (LLCI = .141, ULCI
= .228) and represents 40.9% of the Total Effects. When assessing the contribution of ELDM in this
process, it is noted that ELDM accounts for around 78% of the total Indirect Effects (a1xb1 as a
percentage of Indirect Effects).
Hence it can be ascertained that ELDM significantly mediates the relationship between EOC and
PEP. It further indicates that the prevalence of ELDM in the workplace has a bearing as a mediator
on PEP.
Figure 4.49. Path analysis of model 6.2.

341
PATH ANALYSIS: MODEL 6.3
IEWP
EOC PEPc
a2 b2
-0.526 -0.077[-0.429] [-0.125]
[0.347]0.263
The coefficient figures along the paths, between the corresponding variables, are provided in both
unstandardised and standardised formats. The standardised figures are presented in square brackets
underneath the unstandardised coefficient figures.
HYPOTHESIS
H0: IEWP does not significantly mediate the relationship between EOC and PEP
H1: IEWP significantly mediates the relationship between EOC and PEP
RESULTS
EOC is negatively correlated with IEWP (R = -.429, p < .01) and IEWP has a statistically significant
negative correlation with PEP (R = -.411, p < .01).
To determine whether mediation exist, the model is being assessed as follows:
IEWP=f(EOC): EOC has a relatively medium to high negative effect on IEWP (β = -.429)
along path a2. IEWP has a relatively smaller negative effect on EEBC (β = -.125), on a
standalone basis, along path b2.
Now that IEWP has been added, the Direct Effect of EOC onto EEBC along path c’ (β = .347)
is relatively smaller, indicating that mediation effect might be evident.
It can be determined whether mediation exists by interpreting the Indirect Effect of EOC on
PEP through IEWP as depicted by path a2.b2. Considering the lower and upper limits
(LLCI = -.621, ULCI = -.430) of the bootstrap sample distribution from the Model (EOC-
IEWP) table (Figure 4.47) do not include zero, the Indirect Effect of EOC on IEWP is
statistically significant (path a2). The Indirect Effect of IEWP on PEP represented by path b2
is also statistically significant (p < .05, LLCI = -.120, ULCI = -.035).
In light of the above, the result is considered to be statistically significant and hence H0 is rejected in
favour of H1 Furthermore, when examining the Total, Direct and Indirect Effects of EOC on PEP
table (Figure 4.47), it is noted that the Indirect Effect through IEWP (a2 x b2) is 0.041 (standardised
coefficient of .054) with a Direct Effect of EOC on PEP being .263 (standardised coefficient of .347)
as depicted by path c’ (B = .263, se = .028, p < .05, LLCI = .208, ULCI = .318).
The Total Effect (.445) minus the Direct Effect (.263) indicates that Indirect Effects of EOC on PEP
through the mediating variables (.182). The Indirect Effects are statistically significant (LLCI = .141,
ULCI = .228) and represents 40.9% of the Total Effect.
Hence it can be ascertained that IEWP has a mediation effect on PEP indicating that a prevalence
of IEWP in the organisation would have mediating effect on PEP.
Figure 4.50. Path analysis of model 6.3.

342
PATH ANALYSIS: MODEL 6.4
IEWP
EOC PEP
ELDM
a1
c
b1
a2 b2-0.526 -0.077
0.326 0.434
[0.347]0.263
[-0.429] [-0.125]
[0.403][0.464]
The coefficient figures along the paths, between the corresponding variables, are provided in both
unstandardised and standardised formats. The standardised figures are presented in square brackets
underneath the unstandardised coefficient figures.
HYPOTHESIS
H0: ELDM and IEWP do not significantly mediate the relationship between EOC and PEP
H1: ELDM and IEWP significantly mediate the relationship between EOC and PEP
RESULTS
Considering the results from Total, Direct and Indirect Effects of EOC on PEP table (Figure
4.47), it is noted that the Indirect Effects through ELDM and IEWP are statistically significant as the
95% confidence interval does not include zero (LLCI = .141, ULCI = .228). It can thus be inferred
that there are statistically significant mediation effects of ELDM and IEWP between EOC and PEP
and hence Ho is rejected in favour of H1. The Total Effect between EOC and PEP is represented by
the aggregate value of the Direct Effect of EOC on PEP and the Indirect Effects of ELDM and
IEWP between EOC and PEP as represented by c’ + (a1 x b1) + (a2 x b2).
When examining a breakdown of the constituting components of the Total Effect of EOC on PEP,
the following is noted:
The Indirect Effect of ELDM between EOC and PEP represented by path a1.b1 is .141
(standardised coefficient of .187). This represents 77.5% of the total Indirect Effects of .182
between EOC and PEP.
The Indirect Effect of IEWP between EOC and PEP represented by path a2.b2 is .041
(standardised coefficient of .054). This represents 22.5% of the total Indirect Effects of
0.182 between EOC and PEP.
The combined Indirect Effects of ELDM & IEWP (β = .182, se = .022, LLCI = .141, ULCI =
.228) represent 40.9% of the Total Effects between EOC and PEP.
The Direct Effect of EOC on PEP is .263 (standardised coefficient of .347) represented by
path c’. This represents 59.1% of the Total Effect of .445 between EOC and PEP.
The standardised Total Effect result of the model, i.e. (c’ + (a1 x b1) + (a2 x b2)), is .588 as
per the correlation coefficient (R) between EOC and PEP.
On the basis of the above, it can be inferred that both ELDM and IEWP constitute having a
statistically significant combined mediating effect between EOC and PEP. However, ELDM has a
relatively bigger mediating effect as compared to IEWP on PEP.
Figure 4.51. Path analysis of model 6.4

343
4.6.2 Summary of Statistical Outcomes on Mediation of
Deconstructed Models
Based on the granular assessment of the underlying sub models supporting the
Conceptual Research Model, the statistical significance of the mediating effects as
well as the magnitude of the direct and indirect effect sizes are summarised in Tables
4.69 and 4.70 respectively and discussed below.
Table 4.69
Summary of Statistical Significance of Mediating Effects
Model
(Sub-Models)
Independent
Variables
(Macro
Layer)
Mediating
Variables
(Meso Layer)
Dependent
Variables
(Micro
Layer)
Significance of Mediating
Effects
(Statistical Outcomes)
Model 1.4 OC ELDM & IEWP OCB Statistically Significant
Model 2.4 EOC ELDM & IEWP OCB Statistically Significant
Model 3.4 OC ELDM & IEWP EEBC Statistically Significant
Model 4.4 EOC ELDM & IEWP EEBC Not Statistically Significant
Model 5.4 OC ELDM & IEWP PEP Statistically Significant
Model 6.4 EOC ELDM & IEWP PEP Statistically Significant
Table 4.70
Summary Assessment of Effect Sizes of Sub Models
Standardised Beta Coefficients
% of
Total Effect
Model Sub-Constructs Direct Effect
Indirect Effects
Total Effect
Direct Effect
Indirect Effects
Total Effect
Model 1.4 OC-ELDM-IEWP-OCB 0.257 0.171 0.428 60% 40% 100%
Model 2.4 EOC-ELDM-IEWP-OCB 0.418 0.113 0.531 79% 21% 100%
Model 3.4 OC-ELDM-IEWP-EEBC 0.283 0.073 0.356 79% 21% 100%
Model 4.4 EOC-ELDM-IEWP-EEBC 0.442 0.025 0.467 95% 5% 100%
Model 5.4 OC-ELDM-IEWP-PEP 0.334 0.262 0.596 56% 44% 100%
Model 6.4 EOC-ELDM-IEWP-PEP 0.347 0.241 0.588 59% 41% 100%

344
Table 4.70 on page 344 indicates that Direct Effect sizes of EOC on OCB, EOC on
EEBC, OC on PEP and EOC on PEP are medium to high (.30 to .50). Furthermore,
the contribution of the Indirect Effects of ELDM and IEWP as mediating variables
between OC & PEP, EOC & PEP, and OC & OCB represents around 40% of the Total
Effect, thereby indicating relatively sizeable mediating effects on the dependent
variables. However, the mediating effects of ELDM and IEWP specifically between
EOC and EEBC are very small and statistically insignificant compared to their
corresponding effects in the other sub-constructs.
4.6.3 Holistic View & Analysis of the Path Diagram of the Conceptual
Research Model
The deconstructed Conceptual Research Model has been assessed in a structured
and comprehensive manner using both the unstandardised and standardised results
from the Total Effect Model generated from Hayes (2018) PROCESS Procedure. The
hypotheses to establish mediation relationships within the overall model has also been
tested. Thus, the path diagram of the overall model will now be evaluated.
A holistic view of the path diagram of the Conceptual Research Model with all the
observed variables has been provided in Figure 4.52 on page 346 of the thesis. The
holistic path diagram is comprised of:
The observed or measured variables of the macro-meso-micro framework
within the Conceptual Research Model with their corresponding relationships,
correlation coefficients (in between the independent variables of OC and EOC),
and the standardised beta weights or coefficients (in between the measured
variables) so as to enable a like-for-like comparison amongst the different
variables across the whole model.
Furthermore, the coefficients of multiple determination (R2) have also been
computed and reported to reveal the proportion of variances shared between
the independent and mediating variables with the dependent variables.
On the basis of these standardised results, a critical evaluative approach is adopted
to explain the effects of the independent and mediating variables on the dependent

345
variables. This will further help to ascertain the underlying associations, mediation and
effects within the model from a holistic approach. This will also form the basis for
discussion and conclusion of the subsequent chapter.
Reference values of correlation coefficients, beta weights and coefficients of
determination have been used to gauge and evaluate the model and the effects within
it (Cohen, 1988, 1992; Ellis, 2010). Figure 4.52 on page 346 of the thesis shows a
holistic representation of the path diagram supporting the Conceptual Research Model
with corresponding interrelationships and effect sizes between the variables, as well
as the culminating coefficients of determinations for the dependent variables.

346
Observed Independent Variables
(Macro Layer)
ObservedMediating Variables
(Meso Layer)
ObservedDependent Variables
(Micro Layer)
PEP
EEBC
OCB
IEWP
ELDM
EOC
OC
Legend
e#
Error associated with Measured Variable
Dependence Relationship (from Predictor to Outcome Variable)
with standardized beta coefficients
Correlation Relationship between Independent Variables
with Correlation Coefficient
R2 ValueR2 Value
Figure 4.52. Path diagram of the Conceptual Research Model.

347
4.6.3.1 Key Findings
An examination of the resulting path diagram of the Conceptual Research Model
shows the following key findings:
(a) OC and EOC are independent variables that are positively interrelated (r = .54)
and are jointly influencing the outcome variables by varying degrees;
(b) Amongst the five outcome variables which OC is directly related to (i.e. ELDM,
IEWP, OCB, EEBC and PEP), the biggest effect is between OC and ELDM
(β = .39) followed by IEWP (β = -.34), both of moderate effect. This implies that
OC influences ELDM (positively) and IEWP (negatively) as compared to the
other outcome variables. Amongst the dependent variables, OC affects PEP to
a higher degree (β = .24) as compared to OCB and EEBC.
(c) As with the other macro level independent variable in the model, EOC impacts
EEBC and OCB the most (β = .40 and β = .38 respectively) compared to the
other outcome variables. EOC also affects IEWP negatively (β = -.24). The
effect sizes of EOC on the dependent variables are relatively higher than OC’s
effects.
(d) As a predictor mediating variable, ELDM affects PEP the most with an effect
size of .33 as compared to the other dependent variables of OCB and EEBC.
ELDM nevertheless has a sizeable positive effect of .20 on EEBC. As regards
IEWP, it influences EEBC (β = .25) more than the other two outcomes variables
of OCB and PEP, where IEWP has a relatively small negative effect.
(e) Analysing the coefficient of determination of ELDM indicates that 32% of the
variation in ELDM is explained by the variation in OC and EOC as joint
predictors in the regression model (R2 = .32). Likewise, 27% of the total
variance in IEWP is shared between OC and EOC (R2 = .27).
(f) OC and EOC as direct predictors, and ELDM & IEWP as mediating variables
account for 53% of the total variance in PEP (R2 = .53). This indicates that they
collectively explain a relatively high degree of variance in PEP compared to the
other outcome variables of EEBC (R2 = .31) and OCB (R2 = .32).
(g) OC and EOC as direct predictors, and ELDM & IEWP as mediating variables,
account for 32% of the total variance in OCB (R2 = .32).

348
(h) When assessing the variance in EEBC, it must be noted that ELDM and IEWP
have a statistically insignificant mediating effect on EEBC when EOC is the
independent variable (as evidenced in Model 4.4 in Table 4.69). This implies
that 31% of the variance in EEBC is explained by the collective effect of OC,
EOC, and the mediating effect of ELDM and IEWP when using OC as the only
independent variable.

349
4.7 CHAPTER SUMMARY
As outlined in the earlier methodology chapter, an analysis and study of the collected
data was fundamental to:
(a) Gauge the pattern underpinning the ethical culture, climate and practices in the
local context;
(b) Assess how the data fits the Conceptual Research Model;
(c) Evaluate the statistical significance of the research results so as to draw
appropriate interpretations in respect of the data distribution, relationships
between the data items and the latent factors supporting the key constructs,
mediation and path analysis within the macro-meso-micro level constructs of
the Conceptual Research Model;
(d) Determining group variances such that appropriate conclusions can be drawn
on ethical and behavioural patterns across age, socio-economic and industry
groups;
(e) Analyse and assess the data and model in such a way that the research
questions can be responded to from an empirical perspective;
(f) Evaluate the effects of the predictor variables on the outcome variables with
the model; and
(g) Lay down a strong foundation for the discussion, conclusions and
recommendations in relation to the dynamics of ethical climate and the
mediating effects of ELDM and IEWP.
The processes and methodologies adopted in this chapter have been instrumental in
enabling the set objectives to be attained in a structured approach. The reliance on a
rigorous statistical foundation and tests was equally critical, such that the research
results could be interpreted properly, and inferences be made about the broader
population.
The use of Confirmatory Factor Analysis was considered to assess the model fit of the
main constructs of OC, EOC, ELDM, IEWP, OCB, EEBC and PEP. Where necessary,
the application of Exploratory Factor Analysis was also considered to potentially
generate new theories and findings. The study of the mediation effects of ELDM and

350
IEWP on the outcomes variables were also revealing in nature as it enabled
explanation of the underlying behaviour relating to organisational citizenship,
employee ethical behaviour and conduct, and perceived employee performance in the
context of this study.
The chapter has thus laid a statistically sound foundation of this multi-facetted study
such that the findings could be discussed and conclusions could be made in the next
chapter. The technical aspects of these findings will need to be formulated in such a
way that it can help the business community as well as contribute towards the body of
knowledge whilst evaluating the outcomes and specificities surrounding ethical
behaviours, standards and practices in the workplace.

351
CHAPTER 5: DISCUSSIONS, RECOMMENDATIONS & CONCLUSION
5.1 INTRODUCTION
This chapter is the culminating point of this thesis. A detailed discussion of the results,
and the formulation of appropriate recommendations and conclusions on the basis of
the scientific findings that emerged from the study are now warranted. The objective
of this chapter is multi-fold, namely:
(a) Formulate and substantiate the responses to the respective research questions
that were put forward on the back of the literature review, gaps identified and
research goals, on the basis of the research outcomes and interpretation of the
statistical analysis;
(b) Discuss the outcomes in light of the theoretical foundation and empirical
findings emerging from the study;
(c) Determine the actual state of ethics standards and practices in the multi-
cultural, cross-industry context of Mauritius on the basis of the research results;
(d) Compare and contrast these findings with the outcomes of other research
conducted, and obtain further insights that could help the business and
research communities at large;
(e) Conclude by firstly, recognising the positive aspects that emerged from the
research that should be upheld and promoted further. Secondly, drawing the
attention of key stakeholders towards ethics climate and culture in a
constructive manner. Thirdly, providing a practical approach to the business
community through recommendations to enhance ethical culture and climate at
the workplace. The objective is also to provide insights through an empirically
tested model and enablers that will foster organisational citizenship behaviour,
ethical employee behaviour, and perceived employee performance at the
workplace.
This chapter fulfils the above goals in a structured manner whilst attending to the
conceptual, theoretical and empirical imperatives of the present research. It considers
any limitations of this study to help future research.

352
5.2 RECAP OF THE RESEARCH PROBLEM
Despite continuous reinforcement of organisational governance and operating
standards through ethics related measures, codes and policies, ethical deviances
continue to prevail across organisations. Unethical conduct appears to be omnipresent
within organisations, irrespective of their size and geographical locations.
Furthermore, notwithstanding the existence of comprehensive legislation to combat
crime of varying types and scales, illegal actions are still occurring in business in large
numbers, as reported across the globe (OECD, 2016). Ethical organisational
behaviour has often been a subject for study, as ethics in the workplace is considered
to be a critical factor in promoting the right set of behaviours amongst employees.
Furthermore, in their quests to fulfil business and personal goals, business leaders
and employees face ever-growing workplace pressures thereby making it even more
challenging to maintain their ethical stance uncompromised. The research problem
surrounding business ethics still remains open for further studies due to its complexity
and the ever-mounting business challenges. Research gaps still exist for measuring
the mediating effects between organisational ethics components and the diverse
organisational and behavioural factors affecting ethical behaviour (Burns, 1978;
Deconinck, Deconinck and Moss, 2016; Huang and Paterson, 2017). These
complexities call for the study of organisational ethics components within a conceptual
macro-meso-micro framework. This is even more important in the absence of such
studies in the context of Mauritius characterised by its multi-cultural and cross-industry
society. On the basis of literature review, a Conceptual Research Model was put
forward to guide the theoretical and empirical assessment, the results of which are
summarised in this chapter. As part of the study, it was deemed opportune to measure
the state of ethics and compliance standards in Mauritius through a survey (n = 526).
This allowed existing research gaps to be bridged and insights on the prevailing state
of ethics standards in business to be obtained, evaluated and compared, for the first
time, with countries across the globe.

353
5.3 RESEARCH FINDINGS & DISCUSSIONS
5.3.1 Research Questions
On the basis of an in-depth literature review, gaps were identified, and research goals
determined to guide the study both from a theoretical and empirical perspective. The
following research questions were set for assessment in the context of Mauritius:
Research Question 1: How are the ethical context variables (organisational
culture and ethical organisational climate) conceptualised and explained by the
theoretical models in the literature?
This research question was central to the literature review and assessment of
the Conceptual Research Model. The outcomes were reported in Chapters 2 and
4 and also discussed in this chapter. The response to this question from a
conceptual perspective enabled meaningful insights to be derived when
examining the macro variables of organisational culture and ethical
organisational climate in the current context. The literature review laid the
required foundation to establish conceptual similarities, differences and gain in-
depth insights on these macro variables.
Research Question 2: How are the mediating variables (ethical leadership and
decision making, and internal and external workplace pressures) conceptualised
and explained by the theoretical models in the literature?
Similar to the earlier research question, this particular question was also studied
in detail in the literature review and played a crucial part in the assessment of the
meso layer variables of the Conceptual Research Model. The conceptual and
theoretical aspects in connection with this research question were laid out in
detail in Chapter 2, thereby also enabling the research findings to be assessed
and compared as reported in Chapter 4 and this chapter.
Research Question 3: What is the nature of the theoretical and observed
interrelationship between the ethical context (organisational culture and ethical
organisational climate as independent variables) and mediating variables (ethical
leadership and decision making, and internal and external workplace pressures),

354
and their effects on organisational citizenship behaviour, employee ethical
behaviour and conduct, and perceived employee performance?
The empirical findings, as conducted in Mauritius and reported in the earlier and
present chapters, are instrumental in understanding the overall dynamics within
the macro, meso and micro framework of the Conceptual Research Model. The
interrelationships amongst organisational culture, ethical organisation culture,
ethical leadership and decision making, internal and external workplace
pressures, organisational citizenship behaviour, ethical employee behaviour and
conduct, and perceived employee performance were established and assessed
as per the established research methodology. The corresponding effects of the
independent variables on the observed ones were examined through path
analysis both directly and through the mediating variables. The results have been
discussed in Chapter 4 in comparison with outcomes of previous studies and
supporting theories. The findings are highlighted in this chapter.
Research Question 4: Which of the key meso components (ethical leadership
and decision making, and internal and external workplace pressures) and ethical
related actions influence the organisational citizenship behaviour, employee
ethical behaviour and conduct, and perceived employee performance the most?
The results of the present study provide new insights for the country as well as
for the business and research communities. The outcomes on the assessment
of the key meso variables have been analysed in Chapter 4 and will be discussed
in the upcoming section when responding to the empirical objectives.
Research Question 5: Can a scientific theoretical model be constructed or
customised on the relationship between ethical context independent variables
(organisational culture and ethical organisational climate) and mediating
variables (ethical leadership and decision making, and internal and external
workplace pressures) to empower organisations and practitioners to develop
appropriate strategies and processes to promote positive employee citizenship
behaviour, conduct and performance at large?
The main research purpose and goals were centred on proposing a Conceptual
Research Model focussing on the dynamics of ethical climate at work and

355
comprehensively assessing the model using empirical data to establish whether
the data fits the model. The ultimate objective was to bring sound, meaningful
and practical contributions to the business and research communities on the
dynamics of ethical climate in a quest to enhance citizenship behaviour, ethical
conduct and performance in the workplace. The Conceptual Research Model has
been tested in Chapter 4 and found to hold an acceptable fit. It will, now, be
subject to further discussion in this chapter in the relevant sections.
Research Question 6: What are the key recommendations emanating from the
research findings for stakeholders, in the multi-cultural and cross-industry
context of Mauritius, to institutionalise through a framework or model that would
provide critical ethical levers influencing positive ethical behaviour and
performance for the success of organisations?
The outcomes of the study, evaluation and discussions of the empirical findings
in this final chapter will culminate into key recommendations for the important
stakeholders in the business community. Furthermore, this will enlighten
policymakers, captains of industries, owners and business leaders of
corporations, actors within the organisations and the research community on the
key measures to take to raise ethical standards and practices in Mauritius to the
next level. This chapter presents the tested model on the dynamics of ethical
climate in the corporate world of Mauritius. The model is built on empirical
findings considering the “voice of the actors” on the ground and culminating in
the formulation of sound and practical recommendations that can be
implemented effectively across industries. The ultimate goal is to curtail ethical
deviances and create a work environment that will influence positive citizenship
behaviour, ethical conduct and performance in the corporate world. An attempt
has also been made to advocate for a national call for raising ethical standards
in the workplace with the involvement, engagement and contribution of all key
stakeholders for the welfare of the country, its socio-economic players and
citizens at large. In this regard, recommendations bearing a national and
industry-wide consideration are being made.

356
5.3.2 Specific Research Aims from an Empirical Study Perspective
To ensure that the prime research questions guiding the overall research work were
responded to from an empirical study perspective, it was crucial to put forward
specifically devised research questions to bridge the identified gaps. These key
questions stood as the cornerstone of this present study and guided the whole
research process from an empirical perspective. The outcomes were examined and
assessed to respond to the research questions using empirical evidence. On the basis
of this evidence, appropriate conclusions can be drawn, and recommendations be
made to the benefit of the business and research communities. A question and answer
approach is being adopted to reveal, explain and discuss the findings from an empirical
standpoint in response to the corresponding research questions.
5.3.2.1 How do the ethical organisational culture, climate and standards in
Mauritius compare with the global perspective?
Previous research findings that can specifically compare Mauritius with countries
worldwide on ethical organisational culture, climate and standards are absent in the
local context, despite Mauritius benchmarks itself as a country of reference on several
fronts in the African and global economy. This question was thus of prime importance
to gauge and benchmark Mauritius on the global chart of ethics standards and
practices prevailing in the corporate world.
The findings of the Global Business Ethics Survey are regarded as the benchmark on
the state of ethics and compliance in business across the world. For the purpose of
responding to this particular research aim, it will be used to compare the ethical
organisational culture and standards prevailing in Mauritius with the rest of the world
(Ethics & Compliance Initiative, 2016, 2018c, 2018b). In this context, the results will
be discussed from two perspectives, namely:
The perception of the respondents based on their last twelve months’
observations as well as beyond the 12-months horizon;
The insights that the respondents provided on the perceived ethical climate
prevailing in their organisations through the measurement of the macro, meso
and micro variables. The findings emerging from these multi-faceted

357
dimensions will give insights on the complex on-the-ground realities
characterising the ethical organisational climate in Mauritius.
5.3.2.1.1. Last 12 months observations
The results of the present study indicate that the rate of observed ethical deviances
and malpractices in the workplace over the last 12 months stands at 45% in Mauritius
as compared to 47% in the United States, as reported in Global Business Ethics
Survey of 2018 (Ethics & Compliance Initiative, 2018c). The “observed lying to
employees and external stakeholders” indicator stood as the most prominent form of
observed misconduct in the United States at a rate of 28% (of those who observed
abusive behaviour). It was noted however, that the comparable measure of “lying to
employees, customers, vendors or the public” was rated at only 4% of those who
observed ethical deviances in Mauritius over the last 12 months. The results also show
that the most observed ethical malpractice in the workplace in Mauritius is the “abusive
or intimidating behaviour towards employees” as rated by nearly 21% of the
participants. Furthermore, the other two most critical ethical issues that emerge as
commonly observed over the last 12 months in Mauritian organisations are the
“decisions made to benefit employee’s self-interests or own family/friends interests”
and the “Unreasonable business targets”.
The study further indicates that, out of those who observed ethical issues in the
workplace over the last 12 months, the indicators measuring “Pressure to compromise
ethical standards”, “Observed misconduct”, and “Experienced retaliation for reporting
misconduct” are amongst the lowest compared to the other 18 countries across
continents. Such ethical pulses were measured through the Global Business Ethics
Survey to gauge risk and promotion of workplace integrity (Ethics & Compliance
Initiative, 2016). The following observations could be made:
(a) Pressure to comprise ethical standards – On the lowest side of the
spectrum, Mauritius finds itself with a reported rate of pressure to compromise
ethical standards at 11%, over the last 12 months (Spain at 10%, Mexico at
13% and Japan at 15%). On the other hand, one can find countries with much
higher exposure to such adverse forms of coercion, e.g. Brazil (47%), India
(40%) and Turkey (38%). Other developed countries such as the United States,

358
the United Kingdom and Germany are mid table, with reported pressure to
compromise ethical standards at 22% (being the average rate across reporting
countries). However, the perspective is materially different for Mauritius when it
comes to measuring the observations on ethical deviances beyond the last 12
months horizon. For instance, when measuring across a broader time span,
44% of the respondents confirmed having felt the pressure “to compromise
ethical standards to win business deals”. A total of 26% of the respondents felt
that they are “forced to undertake action that may not be ethical and/or in the
best interests of everybody”, and 26% felt pressure “to accept unethical
practices to protect their own job, source of income or career prospects”. These
results shift Mauritius from the bottom to the upper mid segment of the global
league when measuring pressure to compromising ethical standards in
businesses beyond the last 12-months horizon. It nevertheless remains to be
established whether the observed low rate of such pressures over the last 12-
months is a persistent declining trend, or just a dip that could restore itself to
higher indicator levels, or whether it is explained by some other unobserved
factors.
(b) Observed misconduct – Around 25% of the respondents observed
misconduct at the workplace in Mauritius, over the last 12 months. With this
observed misconduct rate, Mauritius is found to be amongst the group of
countries within the lowest segment of observed misconduct (Japan at 15%,
Spain at 21% and Germany at 26%). Countries such as Indonesia (48%),
Russia (45%) and Brazil (43%) reported the highest level of observed
misconduct. France and Mexico were rated in the mid table with an average
rating of 33% of reported observed misconduct in the latest global survey.
Whilst assessing the various forms of misconduct observed beyond the last 12
months, the results indicate a relatively higher rate of observed misconduct for
Mauritius. For instance, 32% of the respondents observed that “there is
pressure to follow and execute orders from the boss(es), at all costs, for their
own self interests.” Such adverse pressures could be due to misconduct from
senior officers when they should in fact be a role model in promoting ethical and
proper behaviour. Furthermore, 29% of the respondents observed “unfair
human resource management policies prevailing”; 26% of the respondents

359
observed “unethical behaviour of superiors”. These results confirm that
unethical climate and improper practices are prevailing within organisations
which are counter-productive. This can be substantiated by a high rate of
respondents (63%) confirming that the nature and intensity of pressure at work
adversely impacts the employees' health, morale and performance.
(c) Experienced retaliation for reporting misconduct – When measuring
whether people who are reporting ethical issues (e.g. any form of misconduct)
are faced with retaliation, the survey shows that only 7% of respondents
experienced such forms of reprisal in Mauritius over the last 12 months. This is
the lowest rate amongst all countries which were measured on this dimension
on the global landscape. Mauritius stands well far below India, the United
Kingdom and United Arab Emirates which reportedly topmost retaliation rates
of 74%, 63% and 59% respectively in their business enterprises. However, in
line with the earlier trends, when measuring such indicators beyond the 12
months period, the results indicate that higher rates of retaliation were
experienced when reporting misconduct. There were 17% of the respondents
who confirmed that there was retaliation against someone who had reported
misconduct.
On the basis of these outcomes, it would be enlightening to further identify any
common factors or traits that may explain the similarities in the results especially with
countries in close ranges with Mauritius in respect of “Pressure to comprise ethical
standards”, “Observed misconduct” and “Experienced retaliation for reporting
misconduct”. Such patterns may be due to country background, cultural traits,
leadership styles, governance approaches to business and other more specific factors.
Whilst further exploration into this matter would bring new insights, it has not been
explored as it would fall beyond the scope of this study.
5.3.2.1.2 Insights on ethical organisational culture, climate and standards in
Mauritius
A perception exists that the state of ethical behaviour and practices could be alarming
in Mauritius especially when considering diverse media reports on cases linked to
alleged bribery, corruption, fraud, lobbies, and pressures etc. The results from this

360
study in fact confirm to a considerable extent that ethical climate issues are prevalent
and influencing the organisational citizenship and ethical behaviours and performance
of employees within organisations. The level and nature of observed misconduct and
workplace pressures to accept unethical practices, or to fulfil disproportionate
demands of key stakeholders for their self-interests do not lay the right foundation to
curtail ethical deviances in the business environment of Mauritius.
On the positive side, the study, indicates that a large majority of organisations across
sectors are promoting ethics and compliance at varying degrees in Mauritius, as
confirmed by 79% of the respondents. The data suggests that industries such as
“electricity, gas, steam and air conditioning supply”, “financial and insurance activities”,
“accommodation and food service activities”, “education”, and “human health and
social work activities” are amongst the top most promoting ethics and compliance.
However, the results also indicate that organisations forming part of industries such
as “professional, scientific and technical activities”, “Real estate activities”,
“construction” and “administrative and support service activities” have a relatively
lower score regarding the promotion of ethics and compliance at the workplace. This
is in particular surprising for organisations classified as “professional, scientific and
technical activities” which one would have expected to be amongst those operating
with best norms. The underlying factors characterising the ethical culture in this
industry may need to be examined in future studies so as to determine any peculiarities
explaining this phenomenon.
Despite the above claim for promotion of ethics in organisations, there is nevertheless
around 21% of the respondents across industries who rated that their organisations
rarely or never promote ethics and compliance at work. This may be the main reason
why there have been several recurring media reports of deficiencies in ethical
standards and practices in organisations. Other manifested reasons stem from the
underlying dynamics of workplace pressure on employees to achieve business goals,
protect company image, and compromise ethical standards to win business deals.
Employees must follow and execute orders from the boss(es), at all costs, for their
own self-interests or fulfil the demands of powerful groups of people.
Amongst the ethics related actions or measures in place in organisations, “written
ethics policies and standards” and “code of ethics” are the two prevailing ones in the

361
Mauritius business community. The data also suggests that the level of training on
ethics standards and codes is relatively low, with only 12% of respondents having
confirmed of such programmes in place. The existence of systems to report violations
of ethical standards or to discipline ethics violators is seemingly very low and could
even be qualified as “quasi absent”. Results also indicate that the ethical culture in
organisations is characterised by a relatively low presence of performance evaluations
of ethical conduct and a very insignificant level of resources being assigned to
providing advice about ethics issues. These findings call for business leaders and
decision makers to review their standard implementation programmes for more
reinforcement measures to improve the ethical culture and climate in organisations.
When analysing the ethics related measures and actions in place in organisations, a
puzzling question was to determine whether these had a consistent pattern across
establishment sizes (measured in terms of number of employees) or not. The results
reveal some patterns which may not necessary be expected. Large institutions with
over 1,500 employees tend to demonstrate their engagement to ethical approaches
and tools through the implementation of “written ethics policies and standards” to a
considerable extent (63% of respondents confirming same). Such institutions
nevertheless have a relatively low level of implementation of codes, training on ethics
standards, etc. as compared to organisations smaller in scale. The larger sized
organisations do not seem to have in place means to report potential violations
anonymously or to advise on ethics matters, unlike smaller organisations which seem
to have such ethics related systems to some degree in place. The study further
indicates that 11% of the largest establishments (over 2,500 employees) have
performance evaluations of ethical conduct as part of their appraisal systems.
The above findings now add a new dimension for Mauritius in the context of global
studies in business ethics. The three indicators of measuring “compromise of ethical
standards”, “observed misconduct”, and “experienced retaliation for reporting
misconduct” greatly helps to measure the state of ethics in Mauritius. This enables its
comparison with other countries of different continents, cultures and development
stages that were subject to ethics studies and measurements through the global
business ethics surveys. This study thus lays a baseline for ongoing measurement of
the state of ethics in Mauritian organisations and against which trends can be
measured for remedial or reinforcement actions.

362
5.3.2.2 What are the key ethical climate types found, their characteristics,
specificities and how they are related to the variables under study?
To bridge research gaps in the areas of ethical climates, Sibiya, Makoni and Van Wyk
(2016) called for exploring the dynamics of ethical climate types and their possible
influences in business. This research question aims at responding specifically to this
research gap through the empirical study conducted in the multi-cultural cross industry
context of Mauritius. Ethical climate, which forms part of the broader scope of
organisational climate, guides employees’ attitudes and behaviours towards business
ethics and also indicates how people in the organisation generally respond to ethical
dilemmas (Cullen et al., 1993; Shafer, 2015). Several ethical types have emerged from
previous studies encompassing a broad array of behaviours and practices
characterising moral and ethical outcomes in enterprises (Victor & Cullen,1988;
Vidaver-Cohen, 1995; Barnett & Schubert, 2002; Arnaud, 2006; Ulrich et al., 2007;
Weber & Arnaud, 2014; Grobler, 2016; Newman et al., 2017, Brower & Shrader, 2000).
The present study data does not support the initial 9-factor model of Victor and Cullen
(1988) but rather a 3-factor model following the exploratory and confirmatory factor
analysis and model fit assessment of Ethical Organisational Climate. A 3-factor model
emerged from the factor analysis with 15 items holding acceptable loadings (between
.62 and .87) together with an acceptable model fit. Whilst examining the nature of the
loaded items, it was noted that they could be mapped onto ethical climate types of
“Principle-oriented”, “Benevolence” and “Altruism”. The present study was assessed
on the theoretical perspectives of Victor and Cullen (1988), Vidaver-Cohen (1995),
Brower and Shrader (2000) and that of Barnett and Schubert (2002). Two of the ethical
climate types that emerged from this study (“Benevolence” and “Principle-Orientated”),
are common to the theoretical foundations presented by Victor and Cullen (1988),
Brower and Shrader (2000) and Barnett and Schubert (2002). However, the third
emerging ethical climate type reflects “altruism”, when assessing the face validity of
the loaded items and considering the theoretical definitions and scope of altruism put
forward by Organ (1988) and Sharma and Jain (2014).
The results suggest that there are three types of ethical organisational climates
prevailing in the Mauritian business environment, namely “principle-oriented”,
“benevolent” and “altruism”. They predict the ethical climates in the workplace. These

363
orientations support the general perception that Mauritians are often guided by their
principles, cultural values, norms, and laws on one hand, and are inclined towards
caring for the interests of other individuals, customers, companies or the society at
large. This is also supported by previous studies, where Mauritian managers appeared
to have a strong reliance on cultural norms with respect to their judgment and
intentions toward unethical practices (Ah-Kion & Bhowon, 2017).
Furthermore, the “altruism” factor established in the present study considers a broader
theoretical definition and scope as set out by Organ (1988) and Sharma and Jain
(2014). When assessing the items loaded onto “altruism”, they converge towards such
actions directed towards others’ interests namely:
Individuals (e.g. look out for each other’s good or what is best for the other
person)
Company (e.g. concerns about efficiency and company’s interests at large)
Society (e.g. respect to laws governing the society or working environment)
When examining the interrelationships within the model, it was found that Ethical
Organisational Climate (“EOC”) has a moderate positive correlation with
Organisational Culture (“OC”), (r = .54, p <.001). They both form the main independent
variables predicting the mediating and observed dependent variables in the model as
evidenced through regression and path analysis in the present study. While EOC has
a moderately positive correlation with Ethical Leadership and Decision Making
(“ELDM”), r(521) = .46, p < .001, it has, on the other hand, a moderately negative
relationship with the other mediating variable of Internal and External Workplace
Pressure (“IEWP”), r(521) = -.43, p < .001. Furthermore, the results indicate that EOC
is moderately positively correlated with the three dependent variables namely
Organisational Citizenship Behaviour, r(521) = .53, p < .001, Employee Ethical
Behaviour and Conduct, r(521) = .47, p < .001, and Perceived Employee Performance,
r(521) = .59, p < .001; the latter being the strongest reported association with EOC
amongst all observed variables. The study demonstrates that all the respective
correlations as reported above are significant at the .01 level (2-tailed).
The interrelationships show that the underlying constructs of the Conceptual Research
Model form a collective unit of associated variables that can be studied together to

364
explain the interplay within the model, the dynamics of ethical climate, as well as the
mediating effects of ELDM and IEWP.
5.3.2.3 What are the most common internal and external workplace pressures
faced by organisations which could compromise ethical behaviour and
standards?
The most common workplace pressures which could compromise ethical behaviour
and standards faced by employees within local organisations are ranked from the top
most frequency (f), of those who agreed and strongly agreed to be facing such
pressures, with the corresponding mean (X̅) on a 5-point Likert scale. They are listed
in descending order as follows:
(a) Pressure to protect the company's image (f = 52%, X̅ = 3.33, SD = 1.11)
(b) Pressure to continually innovate to gain efficiency (f = 48%, X̅ = 3.26,
SD = 1.08)
(c) Stress (time pressure) in making managerial decisions is felt (f = 47%, X̅ = 3.25,
SD = 1.05)
(d) Pressure to ensure financial success of the company (f = 47%, X̅ = 3.21,
SD = 1.09)
(e) Pressure to compromise ethical standards to win business deals (f = 44%,
X̅ = 3.16, SD = 1.10)
(f) Pressure from powerful groups of employees to abide to their demands
(f = 41%, X̅ = 3.09, SD = 1.10)
(g) Pressure to protect one’s own personal/family reputation (f = 40%, X̅ = 3.11,
SD = 1.12)
(h) Pressure to progress one’s own career for better pay and living (f = 40%,
X̅ = 3.05, SD = 1.13)
(i) Pressure from business partners are aimed to gain advantage (f = 38%,
X̅ = 3.05, SD = 1.04)
(j) Pressure to meet one’s own personal financial obligations (f = 37%, X̅ = 3.01,
SD = 1.11)

365
Amongst the other findings, it could be noted that a considerable number of
participants (43%) feel that the shareholders/owners are interested only in profits,
whilst around 41% feel that there is a critical economic condition prevailing in their
organisations. Thirty-two percent of the respondents further confirmed that there is
pressure to follow and execute orders from the boss(es), at all costs, for their own self-
interest. Demands, whether coming from the top hierarchy in the organisation (21%)
or from external parties (17%) are also viewed as disproportionate by the respondents
in many cases. These conditions are characterised by pressures to abide orders (even
at all costs). These create a dilemma for the employees to fulfil these instructions for
their own job’s security and are key causes for unethical behaviour and practices to
prevail. The study reveals that the nature and intensity of pressure at work adversely
impacts the employees' health, morale, and performance, as highlighted by 63% of
the respondents. This is a major cause for concern that the business community in
Mauritius must remedy as the combined impact of the deficiencies in ethical leadership
and the disproportionate adverse workplace pressures for achieving business goals
will simply fuel unethical conduct and anomie within the organisation. These critical
deficiencies would be counterproductive for maintaining sportsmanship, altruism, civic
virtue, ethical behaviour and performance amongst employees.
5.3.2.4 Which are the most influential / impactful workplace pressure factors?
Four factors emerged from the present study and were validated through confirmatory
factor analysis. Of these, “Prioritisation of Economic Results” carries the highest factor
loading in the model (.87 on average) followed by “Personal Situational Stress” with
the second highest factor loading (.84 on average). The results indicate that the
greatest pressures are directed towards two main stakeholders’ interests; first are, the
company’s own interests in achieving the expected results such as sales targets,
profitability, dividend yield, earnings, market share and the likes for the benefit of the
shareholder(s). Second are those of the employees’ personal interests surrounding
their own job security, financial situation, career development and reputation. These
pressures have been found to influence business leaders or employees to compromise
their ethical stance in the local context.

366
5.3.2.5 What is the statistical relationship between organisational culture and
ethical organisational climate?
Identifying correlations, patterns and effects among the data were central to the study
so as to enable sound empirical evaluation and interpretation of the underlying
variables supporting the Conceptual Research Model. OC and EOC are the two main
macro level independent variables in the macro-meso-micro framework guiding this
research work. The study confirms that OC has a moderate positive correlation with
EOC, r(521) = .54, p < .001, with the correlation being significant at the .01 level (2-
tailed). A host of studies have been undertaken on organisational culture and ethical
organisational climate; however, the literature reviews indicate that they were not
necessarily measured together in the same study but rather on a standalone basis.
Their orientation was towards measuring their outcomes on aspects such as work
engagement, job satisfaction, employee behaviour and commitment, and
organisational performance. The present study provides a new insight into the
interrelationship between OC and EOC, acting together as predictors. It has assessed
their effects on organisational citizenship behaviour, employee ethical behaviour and
conduct, and perceived employee performance either directly or through the mediating
variables. The study of the interrelationship and effects within the proposed model also
serves to better reinforce the existing theories and body of knowledge.
5.3.2.6 What is the statistical relationship between the mediating variables of
ethical leadership and decision making, and internal and external
workplace pressures?
The meso layer of the Conceptual Research Model is comprised of two key mediating
variables, namely, Ethical Leadership and Decision Making, and Internal and External
Workplace Pressures. Both ELDM and IEWP were statistically assessed considering
various perspectives. These included measuring the strength and significance of
relationships, the underlying factor structure influencing the measurement of these
variables, their predictive and mediating characteristics and the dynamics of their
interactions.

367
The literature reviews indicate that these two variables have not necessarily been
studied in tandem as predictors or mediators, but rather as individual predictors
influencing ethical behaviour and conduct, ethical climate, employee performance,
work engagement, job satisfaction, and stress. The findings of the study would thus
serve in adding new insights on the ethics and ethical climate at the workplace.
The study shows that ELDM and IEWP are negatively correlated to a relatively low to
moderate level, r(521) = -.34, p < .001, with the correlation being significant at the .01
level (2-tailed). This indicates that as the prevalence of ethical leadership and decision
making in the workplace increases, the internal and external workplace pressures
decrease to some extent, and vice versa. It should be pointed out that this relationship
does not necessarily imply causation but does indicate a pattern.
5.3.2.7 What is the nature of the theoretical and observed interrelationship
between the ethical context (organisational culture and ethical
organisational climate as independent variables) and mediating
variables (ethical leadership and decision making, and internal and
external workplace pressures), and their effects on organisational
citizenship behaviour, employee ethical behaviour and conduct, and
perceived employee performance?
At the very outset of this study, it was found that a new approach was required to study
the complex phenomenon of ethics in the workplace, as organisations continue to face
growing ethical challenges despite various control systems in place. To bridge
research gaps in business ethics and understand its underlying complexity and
dynamics, Engelbrecht, Wolmarans and Mahembe (2017) called for a new direction in
research to evaluate interrelationships and effects within a conceptual macro-meso-
micro framework of business ethics in future studies. This multi-layered methodology
could go a long way towards approaching the study of ethics at the workplace. It would
break down the complexities and enable a comprehensive examination of the
underlying components influencing citizenship and ethical practices at work. A
Conceptual Research Model, based on a macro-meso-micro framework, was thus
adopted in the context of this research to study the macro level (independent) variables

368
of OC and EOC, the meso level (mediating) variables of ELDM and IEWP and the
micro level (dependent) variables of OCB, EEBC and PEP. This multi-layered
approach has indeed been of tremendous help in studying the complex, dynamic and
interrelated nature of these variables for the benefit of business, academic and
research communities. The sections below discuss and explain the relevant findings
regarding the variables forming part of the Conceptual Research Model from an
empirical and theoretical perspective.
5.3.2.7.1 Macro Level Independent Variables
(a) OC
The study reveals that three latent factors emerged influencing the OC variable in the
local context namely, “Achieving Business Goals”, “People Consideration” and “Work
Ethics”. The study further confirms that two of these factors (“Achieving Business
Goals” and “People Consideration”) are consistent with the theoretical studies and
findings of Sashkin and Rosenbach (2013), Cameron and Quinn (2006), Denison
(1990) and Denison, Haaland and Goelzer (1991). Whilst these studies support a 5-
factor theoretical model characterising OC, the current data only revealed a 3-factor
model. The third factor which emerged in the present study is somewhat unique in the
sense that it encompasses a combination of ethical, compliance and dutiful traits as
characterised by the attributes of work ethics. The “Work Ethics” factor emerging from
this research reveals that though its underlying measuring indicators are common to
the other research studies, they are nevertheless converging with good regression
weights towards a common factor, coined as “Work Ethics”. A plausible explanation
for this specific finding could be explained by the fact that the respondents tend to see
‘ethical approaches at work’, ‘compliance to rules or principles to reach organisational
goals’ and ‘acting responsibly in the interests of the clients’, as one integral unit
characterising their culture of work ethics. The pattern appears to indicate that the
respondents do not demarcate ethics, compliance and duty as separate but as one
common macro trait characterising their understanding of how to properly fulfil their
duties at work. In other words, one who has the right work ethics would demonstrate
compliance to company policies, ethical standards, and uphold their personal duties
towards their customers and other stakeholders. The study also indicates that,
amongst the three factors that emerged to support the organisational culture in the

369
local context, the respondents perceived the factor of “Achieving Business Goals” as
being the most prominent (X̅ = 3.93, SD = 0.55, on a Likert scale of one to five, five
being strongly agreeable). The result indicates a general tendency of the respondents
to recognise that members of the organisations have clearly defined goals relating to
the mission of the business and that priorities to achieving such goals are known,
understood and actioned upon across the organisation through appropriate policies,
procedures and process changes. This is consistent with the outcomes of previous
studies establishing the interrelationship between organisational culture and
performance and the effects of the former variable on the latter (Magee, 2002; Kuo
and Tsai, 2017; Barney, 1986; Cameron and Quinn, 2006).
Considering these findings it can be inferred that the organisational culture in Mauritius
is characterised by:
Such behaviours and actions targeting to achieve business goals;
Such values and actions where people consideration is prime;
Such behaviours and actions that are in effect compromising work ethics in its
broad sense e.g. the priority of achieving goals at the expense of compromising
organisational policies and procedures, the lack of individual’s ownership and
responsibility in resolving customer issues, and the adverse pressure being
imposed to change and attain goals.
Sun (2009) advocates for organisational culture as a management tool to direct and
control employee behaviour and commitment. This study shows further that the
influence of organisational culture can span over a broader horizon covering not only
employee behaviour and commitment in general but also more specifically leadership
behaviour, workplace pressure, organisational citizenship behaviour, ethical conduct
and employee performance.
(b) EOC
To assess the ethical organisational climate in the local context, the Ethical Climate
Questionnaire as devised by Victor and Cullen (1988) was used as a base. Victor and
Cullen’s (1988) model classifies ethical climates in nine types. However, the present
study reveals only three main ethical types characterising “Principle-Oriented”,
“Benevolence” and “Altruism” in the local context. From a theoretical perspective, two

370
of these ethical types (Principle-Oriented and Benevolence) have also been
established in the studies of Victor and Cullen (1988), Brower and Shrader (2000) and
Barnett and Schubert (2002). Despite the fact that that some of these studies
suggesting a broader number of ethical types, the local study indicates that the ethical
climates as perceived by the respondents in Mauritius are characterised mainly by
“Principle-Oriented”, “Benevolence” and “Altruism” traits.
According to the results of the confirmatory factor analysis and regression weights of
the underlying items supporting this particular construct, the way these ethical climates
are viewed in local context is as follows:
“Principle-Oriented” ethical climate is characterised by a work environment:
- Where people comply with the law and professional standards over and
above other considerations;
- Where people strictly comply with company rules and procedures; and
- Where efficiency, team spirit and consideration for people’s best
interests prevail in the organisations.
The survey indicates a tendency of principle-oriented ethical climate prevailing
in organisations as perceived by the respondents (X̅ = 3.71, SD = 0.72, on a
Likert scale of one to five, five being strongly agreeable).
“Benevolence” ethical climate is characterised by a work environment:
- Where people have an active concern about customer’s and public’s
interests and any such decisions that may affect them; and
- Where people have a strong concern for what is generally best for
employees or for each individual.
An inclination towards an ethical climate characterised by benevolence also
appears to be prevailing at the workplace (X̅ = 3.46, SD = 0.75).
In the current context of this study, “Altruism” is seemingly covering a broader
spectrum of behaviour or actions which are directed mainly towards the welfare
of other individuals or co-workers, the company’s interests, and consideration
of law governing the society at large. This aligns with the theoretical foundation
put forward by Organ (1988) and Sharma and Jain (2014) in respect of altruism.
It was noted that the participants perceive these ethical intentions and

371
responsible behaviours towards others as an integral unit of ethical climate in
organisations. The findings indicate that the altruism factor also holds traits of
principle, egoism (individual, local and cosmopolitan) and benevolence from a
theoretical standpoint, but these are perceived as one integral unit
characterising an ethical climate of altruism in the local context, as rated by a
majority of respondents (X̅ = 3.46, SD = .71).
5.3.2.7.2 Meso Level Mediating Variables
(a) ELDM
The confirmatory factor analysis conducted on ELDM led to the emergence of a 6-
factor model compared to a 7-factor model (Kalshoven, Den Hartog and De Hoogh,
2011). The six factors comprise “People Orientation”, “Fairness”, “Power Sharing”,
“Role Clarification”, “Integrity”, and a second order factor encompassing “Concern for
Sustainability” and “Ethical Guidance”. The results also indicate that the 6-factor model
is loaded with 31 items, with regression weights falling between .72 and .95 and has
an acceptable fit.
“People Orientation” is characterised by the care and attention directed towards
others and the genuine concern shown in relation to the needs, interests and feelings
of other colleagues at work. The results indicate a tendency of people-oriented ethical
leadership traits in local organisations (X̅=3.55, SD = 0.82, on a Likert scale of one to
five, five being strongly agreeable).
As regards “Fairness”, characterised by properly situating the responsibilities and
accountabilities of a fault or problem in the workplace, the study reveals a tendency of
such attributes prevailing as part of the ethical leadership and decision making traits.
Generally, the score is inclined towards a disagreement, when conditions of unfairness
in the workplace were presented to the respondents for rating (X̅ = 2.91, SD = 0.99,
on a Likert scale of one to five, one being strongly disagreeable). For example,
respondents were inclined to disagree when presented with conditions where their
leaders or organisations would hold someone accountable unfairly.
“Power sharing” involves a culture of obtaining inputs, recommendations, and advice
from subordinates in the organisational strategy and decision making processes. This

372
has also emerged as an important component in the assessment of ethical leadership
and decision making in Mauritius. The results indicate that a majority of respondents
tend to agree that such traits of power sharing prevail in their organisations (X̅ = 3.39,
SD = 0.84).
“Concern for sustainability” and “Ethical Guidance” emerged as second order factors
of a common main factor in the exploratory and confirmatory factor analysis. “Concern
for sustainability” considers the importance of caring for the environment in general
and for such development goals that fulfil the present needs without compromising
those of the future generation. ”Ethical Guidance” involves behaviours and practices
promoting integrity at work such as adherence to codes of conduct, stimulating
discussions of integrity amongst employees, explaining consequences of unethical
behaviour and complimenting those who demonstrate good behaviour in line with the
integrity guidelines. These two underlying factors are associated and seem to be
perceived as one common factor by the respondents, given their interrelatedness.
They both emerged in the study with relatively stronger means tending towards an
agreement that such behaviours are prevailing in the organisations (X̅ = 3.91, SD =
0.67 and X̅ = 3.83, SD = 0.66 respectively). This outcome thus supports ethical
leadership and decision making approaches present in the workplace.
“Role clarification” emerged as a confirmed factor supporting ethical leadership and
decision similar to what Kalshoven, Den Hartog and De Hoogh (2011) established. It
explains what is expected from the incumbents, clarifies priorities, performance goals,
and who is responsible for what. This factor was rated with the highest mean inclined
towards respondents agreeing to its prevalence in the organisation (X̅ = 3.93, SD =
0.65). This is consistent to the culture of achieving goals which emerged in the
evaluation of organisational culture in the local context, where clarity on role,
responsibility, priorities and performance expectations are central.
The prevalence of “Integrity”, as one of the underlying influential factors of ethical
leadership and decision making in the workplace, also emerged from the study (X̅ =
3.78, SD = 0.77, on a Likert scale of one to five, five being strongly agreeable). In the
context of ethical leadership and decision making, integrity was particularly
characterised by the leaders keeping their promises, who could be trusted and relied
upon.

373
The study demonstrates that ELDM, as a predictor variable, has a relatively better
moderate positive correlation with Perceived Employee Performance, r(521) = .61,
p < .001, as compared to the other observed variables. The results further indicated
that ELDM has a relatively low to moderate positive correlation with both
Organisational Citizenship Behaviour, r(521) = .40, p < .001, and Ethical Employee
Behaviour and Conduct, r(521) = .39, p < .001. These correlations are significant at
the .01 level (2-tailed).
(b) IEWP
The study also demonstrates that out of the original 28 items used to measure IEWP,
15 items were loaded on a 4-factor model (“Prioritisation of Economic Results”,
“Violations of Ethical Guidelines”, “Situational Stress” and “Personal Situational
Stress”) with relatively good regression weights falling between .72 and .88.
“Prioritisation of Economic Results” emerged as a form of workplace pressure
characterised by the need to ensure financial success of the organisation and to also
continually innovate to gain efficiency. The results show that this pressure is present
in the business community in Mauritius (X̅ = 3.24, SD = 1.02, on a Likert scale of one
to five, five being strongly agreeable). This tendency is consistent with the other
findings observed when measuring pressures in the workplace. “Violations of Ethical
Guidelines” is characterised by unfair human resource policies and practices,
unethical behaviour of the superiors, bad workflow in the organisation and blurring of
what is ethical and what is not. This factor emerged with a lower mean score (X̅ = 2.71,
SD = 0.89) tending towards a disagreement of the respondents on its prevalence in
the organisation. On the other hand, the emergence and prevalence of “Situational
Stress” has also been observed (X̅ = 3.11, SD = 0.99) in the study encompassing such
pressures:
from clients for favourable terms at the risk of losing the business;
from powerful groups of employees to abide to their demands; and
for protection of company’s image.
The items originating from the study of Lasakova and Remisova (2017) were loaded
consistently as per their original 3-factor structure thereby indicating a similar pattern
in the local context too. A fourth factor emerged in the present study which was related

374
to “Personal Situation Stress”, characterising those pressures that directly impact the
person as an individual, compared to situational pressures which affect the business
or company in a broader sense. The study shows that there is a tendency for people
to compromise their work ethics when faced with pressure to achieve goals. However,
given limited research in this area, consideration should be given to further explore the
personal situational stress aspects in further depth. This could help in measuring how
individuals would react and the ethical stance they would take when they are directly
under a situational tension that impacts their own interests or self.
The study demonstrates that IEWP, as a predictor, has a moderately negative
correlation with Perceived Employee Performance, r(521) = -.41, p < .001, and a
relatively low negative correlation with Organisational Citizenship Behaviour,
r(521) = -.31, p < .001. Surprisingly, the correlation between IEWP and EEBC was
found to be insignificant, r(521) = -.06, p = .164.
5.3.2.7.3 Micro Level Dependent Variables
(a) OCB
OCB was measured through 24 items loaded on a 5-factor model as devised by
Podsakoff et al. (1990). The confirmatory factor analysis reveals a 3-factor model
loaded with 12 items holding acceptable weights ranging between .61 and .83. The
three emerging factors are comprised of “Altruism”, “Sportsmanship” and “Civic Virtue”
which have also been found by Organ (1988) and Podsakoff et al. (1990).
“Altruism” characterises the behaviours or actions to help other colleagues, respect
the rights of others in the organisation and respect company rules and policies. “Civic
Virtue” comprises of such behaviours of making the extra effort of helping the
organisation voluntarily even if it is not mandatory. As regards “Sportsmanship”, it
emerged with such behaviours characterising honesty at work, doing the job
responsibly without being reminded by the supervisors, avoiding issues that could
affect relationships with co-workers and avoiding complaining about trivial matters. All
the three factors emerged with means tending towards their confirmed prevalence in
the local business community (X̅ = 4.14, SD = 0.47 for Altruism; X̅ = 3.74, SD = 0.78
for Civic Virtue; and X̅ = 4.13, SD = 0.60 for Sportsmanship).

375
The “Altruism” factor also emerged as a common factor from research by Smith, Organ
and Near (1983), and Sharma and Jain (2014). Certain items from Podsakoff et al.
(1990) measuring courtesy, conscientiousness and sportsmanship have strongly
loaded on the “Altruism” factor in the present research. Similarly, two items of the
original scale measuring courtesy and conscientiousness loaded better on the
“Sportsmanship” factor. A closer examination of these items against theoretical
definitions as put forward by Sharma and Jain (2014) and Organ (1988) indicate that
they have been strongly loaded in the present study under “Altruism” and
“Sportsmanship” factors, given the broader nature and scope of these established
theoretical definitions. These patterns also indicate that the respondents have a
broader view and understanding of altruism and sportsmanship rather than nuances
which certain specific items may carry.
The results indicate that OCB emerged as the construct with this highest mean score
(X̅ = 4.00, SD = 0.49), compared to the other variables in the study. It appears that,
amongst all variables, there is a stronger tendency of witnessing organisational
citizenship behaviour prevailing across the business community in Mauritius. It
nevertheless remains to be confirmed, from an empirical perspective, whether this
pattern is intrinsically linked with the specificities of the multi-cultural aspects of
Mauritius.
(b) EEBC
The results indicate that the factor structure emerging from the present study is found
to strongly support the theoretical foundation established by Maesschalck (2004). Out
of the 46 original items adapted for measurement of EEBC in the context of this
research, 35 items had acceptable to high loadings ranging between .71 and .91 under
a 9-factor model. Whilst eight of the emerging factors are common to those of
Maesschalck (2004), as assessed through confirmatory factor analysis, the one
remaining factor is a result of the adaptation made to the instrument to measure and
obtain a comparable view with what was surveyed on the global fronts. The following
eight factors are thus theoretically relevant for the purpose of measurement and
discussions regarding ethical employee behaviour and conduct:

376
“Self Interest” characterises such behaviours, where the protection of one’s own
interests are put above other considerations. The survey indicates that the
concern for one's own interest or advantage tends to prevail in organisations (X̅
= 3.40, SD = 0.97).
“Organisational Interest” characterises such behaviours of organisational
members, where the financial interests and image of the company or such
decisions that generate value for the organisation are of prime concern. The
results confirm a tendency towards such a conduct being perceived by a
majority of respondents (X̅ = 3.47, SD = 0.87).
“Efficiency” basically concerns those employee actions of finding the cheapest
or optimal way to undertaking business, ultimately to reduce costs in the
organisations. The survey indicates a pattern inclined towards a culture of
efficiency prevailing in organisations (X̅ = 3.58, SD = 0.80).
“Friendship”, in the context of this study, concerns holding good interpersonal
and behavioural relationships both with colleagues and external stakeholders
of the organisation and the effects of any decisions or actions on them. Such a
behaviour appears to be felt by a majority of the respondents through their
confirmed ratings (X̅ = 3.86, SD = 0.66).
“Team Interest” considers such employee behaviours promoting the welfare of
the team members in the organisation. Consistent to the earlier findings, the
survey indicates an inclination towards people’s consideration, where the
interests of the team members are critical (X̅ = 3.96, SD = 0.71).
“Stakeholder Orientation” characterises such behaviours and conduct
demonstrating a strong sense of responsibility towards citizens. This orientation
is perceived amongst the most important factors characterising employee
behaviour in the local context (X̅ = 4.06, SD = 0.60). This is consistent with the
pattern of altruism, benevolence and civic virtue observed in the study.
“Personal Morality” concerns the personal conduct of the employees of
determining of what is right or wrong, as well as such behaviours encouraging
innovation or personal creativity of employees. The perception is generally
inclined towards the prevalence of such conducts in the corporate environment
(X̅ = 3.84, SD = 0.65).
377
“Rules and Law” encompasses such employee conduct, where company rules
and procedures are strictly followed including the compliance to law, public
interests and professional standards over and above other consideration. The
study demonstrates a strong tendency towards an adherence behaviour to
company rules, procedures and the law in general (X̅ = 4.12, SD = 0.50).
(c) PEP
The statistical assessment and outcomes suggest a single factor model for PEP with
15 items retained (X̅ = 3.71, SD = 0.49) with confirmed high internal reliabilities
(Cronbach’s Alpha of .94). The underlying retained items characterise the perception
employees have regarding their organisations’ abilities to:
Compete on strategy, brand, products, services, performance, culture and
work environment better than the competition;
Attract and retain talents for the business to stay ahead;
Attract new clients and satisfy existing ones;
Demonstrate strong relations between management and employees, and
amongst employees in general;
Infuse an organisational citizenship behaviour and a culture to deliver beyond
what is expected in the normal course of duties;
Permeate an ethical climate that enables one to maintain its ethical stance and
moral values unviolated;
Permeate an ethical climate that fosters reporting of ethical issues without any
fear of retaliation or inaction;
Enable its leaders and managers in creating the right ethical working
environment, including having the proper ethics program in place to improve
work climate and performance, and supporting employees to perform well; and
Encourage employees to use ethics and compliance standards and improve
overall work performance.
The study indicates that generally the employees perceive that their organisations are
faring better than their competitors regarding products, services, brand image, talents’
and clients’ attraction and retention (X̅ = 3.80, SD = 0.76, on a Likert scale of one to

378
five, five being strongly agreeable). There is also a general perception that the right
working environment and working relationships are prevailing amongst peers and
between managers and their subordinates (X̅ = 3.83, SD = 0.73). The analysis also
shows that the relationships amongst employees are relatively stronger at peer level
(X̅ = 3.85, SD = 0.72) compared to the relationships between managers and their
employees (X̅ = 3.80, SD = 0.78).
As regards the perception of employees on whether ethical climates prevail in their
workplaces, the results indicate a similar pattern as above. The majority of
respondents tend to agree that the prevailing ethical climates at their workplaces help
them to maintain unviolated ethical stances and moral values and perform better (X̅ =
3.90, SD = 0.74). Despite a general perception of prevailing ethical climates, it
nevertheless appears that work pressure to meet organisational objectives is
compelling employees to depart from their ethical paths (X̅ = 3.49, SD = 0.96). Such
pressures are flowing from the top down, and they appear to be considerably
impacting the employees' health, morale and performance at work, considering their
nature and intensities.
Based on the results of the confirmatory factor analysis and statistical means of the
underlying items measuring the latent factors, Figure 5.1 on page 379 of the thesis
provides a holistic view of the patterns that emerged for the key constructs of the
Conceptual Research Model. The model puts into perspective the latent factors
(underlying each variable) and shows their comparative tendencies or inclinations
through the assessment of their relative statistical means plotted on a radar chart.

379
Note: The underlying items supporting the emerging latent factors have been measured on a 5-point Likert scale (1: “Strongly Disagree”, 2: “Disagree”, 3: “Neutral”, 4: “Agree”
and 5: “Strongly Agree”). The respective mean scores have been plotted in the respective radar charts above. The third dependent variable, Perceived Employee Behaviour,
has not been shown pictorially given it emerged with a single factor with a statistical mean of 3.71 and standard deviation of 0.49.
Figure 5.1: Emerging factors and tendency characterising the respective variables of the Conceptual Research Model prevailing in the business community of
Mauritius

380
5.3.2.8 The effects of the independent and mediating variables on the
dependent OCB, EEBC and PEP variables
The research question put forward also calls for an empirical examination of the direct
and indirect effects that organisational culture and ethical organisational climate (as
macro level independent variables) have on organisational citizenship behaviour,
ethical employee behaviour and conduct, and perceived employee behaviour (as
dependent variables).
The empirical aim is to also establish whether the mediating variables (ethical
leadership and decision making, and internal and external workplace pressures) have
a bigger influence on the dependent variables when they intervene as mediators in the
business context of Mauritius.
The study has relied upon a broad methodology encompassing exploratory and
confirmatory factor analysis as well as a path analysis to support the empirical
assessment of the dynamics within the Conceptual Research Model.
The study confirms the following key findings:
(a) An overarching effect – As independent variables, organisation culture and
ethical organisational climate jointly influence the observed variables at the
meso and micro levels at varying degrees.
(b) The effects of organisational culture - Organisational culture, as characterised
by three factors of achieving business goals, people consideration and work
ethics in the local context, has a bigger effect on ethical leadership and decision
making (β = .39, p < .001) as compared to the other variables. It positively
influences ethical leadership and decision making behaviours in the business
context of Mauritius. A common pattern was found in previous studies, where
organisational culture is also linked with personal values of leaders (Schein
2010; Schein & Schein, 2017; Schwartz, 1992; Douglas, Davidson and
Schwartz, 2001). The organisation culture components play an important
predictor role, not only on ethical leadership and decision making but also on
internal and external workplace pressure. However, organisational culture has
a moderate negative influence on workplace pressures. For instance, work
environment that promotes care for people where their concerns are heard,
381
they are kept informed on a timely basis, and where team spirit and support are
permeating, it will experience lower levels of situational stress in both the
organisation and on the individual. In such conditions, people in the
organisation will be under less pressure to violate ethical guidelines. Similarly,
in an organisation where unclear business goals or lack of support to solve
problems prevail, such a culture will translate into an increase in stress on
individuals and teams. This will adversely be affecting their abilities to handle
situational challenges and maintain their ethical stances unviolated.
Furthermore, the study also shows that organisational culture influences
(statistically significant) organisational citizenship behaviour (β = .13, p < .001),
employee ethical behaviour and conduct (β = .15, p < .001) and perceived
employee performance (β = .24, p < .001) in the business context of Mauritius.
For instance, the prevalence of people consideration and team spirit in the
organisation will positively influence employees to perform beyond what is
expected, respect and support others, make an extra effort to help co-workers
even if it is not mandatory. All this characterises an organisational citizenship
behaviour. The prevailing culture of achieving business goals through clarity of
vision, clearly laid out processes, operating guidelines and priorities,
appropriate support, work ethics and consideration for people’s welfare, also
predicts the employees’ performance, ethical behaviour and conduct. This is
consistent to the findings of Kotter and Heskett (1992) and (Magee, 2002)
where it was established that organisational culture influences performance in
enterprises. Furthermore, Sun (2009) advocated for the effects of
organisational culture on employee behaviour, thereby directing the way
employees behave in the workplace and the level of commitment they would
show in the affairs of the business.
(c) The effects of ethical organisational climate – In the context of this study, ethical
organisational climate has emerged, with characteristics of principle-
orientation, benevolence and altruism prevailing to varying degrees in the
Mauritian workplace. The study confirms that ethical organisational climate
predicts ethical leadership and decision making (β = .25, p < .001). For instance
a climate of consideration for others (co-workers, people, organisation and
society) and for compliance (laws, rules, principles and procedures) influences

382
people’s ethical orientation and decision making. The study further confirms
that ethical organisational climate influences organisation citizenship behaviour
and employee ethical behaviour and conduct to a considerable extent as
compared to others (β = .38, p < .001 and β = .40, p < .001 respectively), with
the effects found to be statistically significant. These results build on existing
evidences of Huhtala et al. (2011) and Mitonga-Monga and Cilliers (2015), who
advocate that workplace ethics predicts work engagement behaviour and
commitment to the organisation. Mitonga-Monga and Cilliers (2015) found that
workplace ethics culture and climate had the most impactful contribution on
work engagement. A positive inclination towards an ethical organisational
climate is characterised by concerns of what is best for employees, clients,
public and a general tendency towards adhering to organisational rules and
policies. This has a corresponding impact on fostering civic virtues, altruism and
an attitude to do beyond what is expected in the best interests of the co-
workers, teams and the organisation at large. On the other hand, a climate
where ethical deviances prevail in the organisation has a counterproductive
effect on the employees with increasing stress and pressures to compromise
their ethical stances. The results show that the prevalence of ethical
organisational climate has a reverse and attenuating effect on workplace
pressures (β = -.24, p < .001). This can be of an internal nature (i.e. such
pressures personal to employee’s own survival, job security, career and
financial sustainability). It can also be of an external nature (i.e. such pressures
to meet business targets and goals, ensure financial success of the company,
and create value for the shareholders). The results on the effects of ethical
climate in organisations in Mauritius are also consistent to the findings of
Huhtala et al. (2011), who advocated that a work environment characterised by
ethical standards, systems and practices fosters the emotional engagement
and work commitment levels of employees.
(d) The combined effects of organisational culture and ethical organisational
climate – The study reveals that these two independent macro level variables
have a combined moderate effect (statistically significant) on ethical leadership
and decision making (R2 = .32, p < .001) and on internal and external workplace
pressures (R2 = .27, p < .001). The results suggest that these independent

383
variables jointly predict the ethical leadership behaviours, ethical orientation in
decision making and workplace pressures to a considerable extent. Thus,
amongst all variables or factors, measured in this study that may affect these
mediating variables, it was found that organisational culture and ethical
organisational climate jointly account for 32% and 27% of the effect respectively
on the two mediating variables, ELDM and IEWP.
(e) The meso variables and their mediating effects – The results show that, as a
predictor mediating variables, ethical leadership and decision making
influences perceived employee performance the most (β = .33, p < .001),
compared to the other two variables of organisational citizenship behaviour (β
= .14, p < .001) and employee ethical behaviour and conduct (β = .20, p < .001).
The study indicates that when fairness, sharing of power, concerns for work
ethics and environment, integrity, and people consideration prevail in an
organisation, they influence the way employees perform and their perception
on the work environment. The more ethical leadership behaviours and ethical-
oriented decision making are manifested, the more employees would perceive
their work environment as motivating, performing and conducive to support
team collaboration, productivity and ethical conduct. These results build on the
existing evidence of Mo et al. (2012), where ethical leadership was established
as a key predictor influencing employees’ moral attitude and behaviour. A
positive association of ethical leadership with employees’ job satisfaction and
motivational organisational commitment was also found in previous studies
(Brown, Trevino & Harrison, 2005b; Vitell & Singhapakdi, 2008). The results of
this study further strengthen the positions of the proponents of ethical
leadership and its positive impact on employees’ performance (Piccolo et al.,
2010; Walumbwa et al., 2011). On the other hand, an increase in internal and
external workplace pressures adversely impacts employees’ performance and
citizenship behaviour. Vidaver-Cohen (1993) suggests that such pressures also
lead towards behavioural challenges and moral regression amongst
employees.
To assess the effect that the mediating variables indirectly contribute to the
overall model, the direct effects were evaluated in the study and used as

384
comparatives to determine on whether ELDM and IEWP play an important role
in the total effect equation. The direct effect sizes of EOC on OCB, EOC on
EEBC, EOC on PEP and OC on PEP are of moderate to high effect (β between
.30 and .50, p < .001), with these effects being statistically significant.
Furthermore, the contribution of the indirect effects of ELDM and IEWP, as
mediating variables, between OC and OCB, EOC and PEP, and OC and PEP
represent between 40-44% of the total effects, thereby indicating relatively
sizeable mediating effects on the dependent variables. However, the mediating
effects of ELDM and IEWP specifically between EOC and EEBC are relatively
small and statistically insignificant compared to their corresponding effects on
the other sub-constructs. These results show that ethical leadership and
decision making, and workplace pressures play a crucial mediating role and
considerably influence organisational citizenship behaviour and perceived
employee performance in the business environment of Mauritius. The findings
of Vaughan (1983) and Passas (1990) on the study of anomie and corporate
deviances indicate that workplace pressure for meeting organisational
objectives compelled employees to leave the ethical path. A similar pattern
seems to appear, where shareholders tend to be interested in profits, not
necessarily in the way they are realised.
(f) The overall effect – The present study provides new insights in respect of the
dynamics of the multi-layered interconnected variables within the Conceptual
Research Model. Organisational culture and ethical organisational climate as
direct predictors, and ELDM and IEWP as mediating variables account for 53%
of the total variance in perceived employee performance (R2 = .53, p < .001).
This indicates that they collectively explain a relatively high degree of variance
in perceived employee performance compared to the other outcome variables
of OCB (R2 = .32, p < .001) and EEBC (R2 = .31, p < .001). Furthermore, the
study also shows that direct predictors (OC and EOC) and mediating variables
(ELDM and IEWP) account for 32% of the total variance in OCB (R2 = .32, p <
.001). The reported variances were found to be statistically significant. When
assessing the variance in EEBC, it must be noted that ELDM and IEWP jointly
have a statistically insignificant mediating effect exceptionally between EOC
and EEBC. This implies that 31% of the variance in EEBC is explained by the

385
combined effect of OC, EOC, and the mediating effects of ELDM and IEWP
when OC is the main predictor.
5.3.2.9 Do the employees’ perception and behaviour in relation to
organisational culture, ethical leadership and decision making, internal
and external workplace pressures, and organisational citizenship
behaviour remain constant across different groups (age, industry and
socio economic)?
An analysis was undertaken on the age, socio-economic and industry groups to
establish whether the patterns of the variables being measured are similar or different
across these groups.
Age group differences - The results show that respondents of age groups 50-59 and
40-49 (regarded as mature and experienced persons) rated their perceptions in
respect of organisational culture, internal and external workplace pressure, and
organisational citizenship behaviour differently compared to the younger generation
(20-29 age group). The younger generation sees the organisation as being more
inclined towards achieving business goals, having people’s consideration and work
ethics (underlying factors characterising OC). Furthermore, the results indicate that
the younger age group is relatively more inclined towards advocating for altruism, civic
virtue and sportsmanship (underlying factors characterising OCB) in the organisation.
Similar patterns were noted as the younger group feel that the workplace pressure is
lower. The latter may be related to limited exposure of the younger generation in the
working environment compared to the older group.
Socio-economic group differences - The results show that respondents of socio-
economic groups AB (High Class) rated their perceptions in respect of ethical
leadership and decision making differently compared to the other socio-economic
groups of C1 (Upper Middle Class), C2 (Lower Middle Class) and DE (Lower Class).
The High Class socio economic group has a relatively stronger perception towards
and inclination for ethical leadership and decision making best practices and behaviour
in the organisation.

386
Industry group differences – The results indicate that the perceptions of
organisational culture, ethical leadership and decision making, and workplace
pressure vary considerably amongst the different industry sectors. For instance, the
perception of the people forming part of the “Manufacturing” industry are most divided
on their perceptions regarding workplace pressure compared to the “Accommodation
and Food Activities” sector which are more inclined towards disagreeing on the
prevalence of unfair or unethical behaviour in the organisation.
5.3.2.10 Which of the key meso components (ethical leadership and
decision making, and internal and external workplaces pressures) and
ethical related actions influence the organisational citizenship
behaviour, employee ethical behaviour and conduct and perceived
employee performance the most?
The results indicate that, amongst the two main components of the meso layer, ethical
leadership and decision making influence two of the three dependent micro level
variables the most as follows (standardised beta coefficient of effect size being used
for comparison):
(a) Organisation citizenship behaviour – Ethical leadership and decision making
influences organisation citizenship behaviour the most (β = .14, p < .001)
compared to internal and external workplace pressures (β = -.04, p < .001).
Amongst the items measuring organisational citizenship behaviour, it is noted
that ethical related actions such as ‘willingness to help others who have work
related problems’, ‘focusing on the positive rather than the adverse aspects’,
and ‘respecting the rights of peers’ have the highest influence on organisational
citizenship behaviour (β between .81 and .83, p < .001). Consistent to the
results of the present study, Mayer et al. (2009) also found that the mediating
effect of the employees’ perception of their leaders’ ethical stance largely
influences the relationship between ethical leadership and organisational
citizenship behaviour. In their study, Mitonga-Monga and Cilliers (2005)
established that workplace ethical culture and climate had the most impactful
contribution on work engagement. The present result supports this position too,

387
as ethical organisational climate emerged as having a larger effect size (78.6%
of the total effect) as a direct predictor on organisational citizenship behaviour
(encompassing work engagement). This is compared to its indirect effect size
through the mediating variables (21.4% of the total effect).
(b) Employee ethical behaviour and conduct – Though being close together,
internal and external workplace pressures influence employee ethical
behaviour and conduct the most (β = .26, p < .001) compared to the ethical
leadership and decision making variable (β = .20, p < .001). The results show
that consideration of what is best for other people or colleagues in the
organisation is the most impactful ethical related action influencing employee
ethical behaviour and conduct (β = .94 p < .001). In line with the Vidaver-Cohen
(1993) findings, a climate of inordinate pressure to meet business targets, a
climate of non-adherence to legitimate practice or a climate of alienation tends
to affect employees’ behavioural and moral state. National surveys conducted
in the United States public traded companies have shown that employees felt
more pressure to compromise ethical standards, seemingly due to pressure in
achieving business results. It was found that 84% of those who felt pressure
also observed misconduct, thereby reinforcing the observations that workplace
pressure predicts ethical employee behaviour and conduct (Ethics Resource
Centre, 2012).
(c) Perceived employee performance - As a meso level variable, ethical leadership
and decision making influences perceived employee performance the most
(β = .33, p < .001). One may have thought that internal and external workplace
pressures would considerably influence perceived employee performance.
However, this was not the case in the present study, as the result shows that
workplace pressures have a very small negative influence on perceived
employee performance (β = -.06, p < .001). The results also indicate that the
fostering of strong relations between management and employees as well as
the leaders creating the right ethical work environment for employees to
perform well are the two top most influential ethical related actions impacting
perceived employee performance (β = .77, p < .001).
388
5.3.2.11 Is there a good fit between the elements of the empirically
manifested structural model and the theoretically hypothesised model?
Over time, various model fit indices have been used to evaluate a model. Each model
fit index has its own merits and limitations, nevertheless, researchers seem to agree
that multiple criteria should be used to comprehensively test a model. This is so that
one can confidently claim that the theoretically hypothesised model (e.g. the
Conceptual Research Model as per Figure 5.2 on page 389 of the thesis) actually
represents the empirically manifested structural model and that the data fits well the
hypothesised model (Hu and Bentler, 1999). The manifested factor structures for each
construct were subject to confirmatory factor analysis and model fit assessment. The
literature suggests that a confirmatory factor analysis should be evaluated in light of
the outcomes of a combination of indices (Matsunaga, 2011). These include the:
Exact fit index (e.g. Chi-square or CMIN being the Chi-square equivalent in
confirmatory factor analysis measured as a ratio to degrees of freedom,
“CMIN/df”)
Root Mean Square Error of Approximation (“RMSEA”)
Incremental fit index, such as Comparative Fit Index (“CFI”), Tucker-Lewis
Index (“TLI”) and Relative Non-centrality Index (“RNI”)
Residual-based index, such as Standardised Root Mean Square Residual
(“SRMR”)
A step by step approach was adopted to test each component of the Conceptual
Research Model. To avoid any biasness in model fit assessment, the same set of
model fit indices were consistently used and evaluated throughout the hypothesised
model.

389
Ethical Leadership
& Decision Making
Internal & External
Workplace
Pressures
Ethical
Organisational
ClimatePerceived
Employee
Performance
Employee Ethical
Behaviour &
Conduct
Organisational
Citizenship
BehaviourOrganisational
Culture
macro meso micro
Figure 5.2: Conceptual Research Model of the present study
Organisational Culture – The results show that a three-factor model emerged
(Achieving Business Goals, People Consideration and Work Ethics) with 10 items
holding acceptable loadings between .51 and .79 and with improved model fit
indicators following model adjustments that are permissible. The results of the model
fit indices are as follows: CMIN/df: 2.915 (excellent fit: < 3.00), RMSEA: .061
(acceptable fit: .06 to .08), CFI: .960 (excellent fit: > .95) and SRMR: .042 (excellent
fit: < .08). On the basis of the outcomes of the confirmatory factor analysis, the
adjusted baseline model for organisational culture shows an acceptable to excellent
model fit.
Ethical Organisational Climate – A three-factor model (Principle-oriented,
Benevolence and Altruism) emerged with 15 items holding improved acceptable
loadings between .62 and .87 along with enhanced model fit indicators following fine
tuning. The model fit outcomes are as follows: CMIN/df: 3.817 (acceptable fit: 3.00 to
5.00), RMSEA: .073 (acceptable fit: .06 to .08), CFI: .955 (excellent fit: > .95) and
SRMR: .034 (excellent fit: < .08). The confirmatory factor analysis of the adjusted
ethical organisational climate baseline model shows an acceptable fit.
Ethical Leadership and Decision Making – The results show that a six-factor model
(People Consideration, Fairness, Power Sharing, Consideration for Sustainability and
Ethical Guidance as second-order factor, Role Clarification and Integrity) manifested
with 31 items holding acceptable to high loadings between .72 and .95. The results
show the following model fit indicators: CMIN/df: 2.816 (excellent fit: < 3.00), RMSEA:

390
.059 (excellent fit: < .06), CFI: .948 (acceptable fit: .90 to .95) and SRMR: .042
(excellent fit: < .08). The confirmatory factor analysis of the adjusted ethical leadership
and decision making baseline model shows an acceptable to excellent fit.
Internal and External Workplace Pressures – The results show that 15 items properly
loaded onto a four-factor model (Prioritisation of Economic Results, Situational Stress,
Personal Situational Stress and Violation of Ethical Guidelines) which emerged for the
workplace pressure construct. The 15 items measuring internal and external
workplace pressure hold acceptable loadings between .72 and .88 along with
reasonable to acceptable model fit indicators: CMIN/df: 4.818 (acceptable fit: 3.00 to
5.00), RMSEA: .086 (poor fit: > .08), CFI: .958 (excellent fit: > .95) and SRMR: .038
(excellent fit: < .08). The confirmatory factor analysis of the alternative baseline model
of workplace pressures with two second-order factors shows a reasonable to
acceptable fit for the underlying construct.
Organisational Citizenship Behaviour – As a critical observed variable of the model,
organisational citizenship behaviour was accordingly measured and assessed. The
results of the confirmatory factor analysis show that a three-factor model (Altruism,
Civic Virtue and Sportsmanship) emerged with 12 items holding acceptable loadings
between .61 and .83. The results of the model fit indicators are as follows: CMIN/df:
3.472 (acceptable fit: 3.00 to 5.00), RMSEA: .069 (acceptable fit: .06 to .08), CFI: .959
(excellent fit: > .95) and SRMR: .042 (excellent fit: < .08). The results show an
acceptable fit of the adjusted baseline model for organisational citizenship behaviour.
Ethical Employee Behaviour and Conduct – A similar evaluation was conducted for
this particular construct as undertaken for the other earlier reported ones. The results
of the confirmatory factor analysis show that nine factors manifested with 35 items
having acceptable to high loadings between .71 and .91. One factor was purposely
grouped to support the measurement of the ethical and behavioural state in the local
context when compared to global perspectives. The other eight factors which emerged
from the study are Self Interest, Organisational Interest, Efficiency, Friendship, Team
Interest, Stakeholder Orientation, Personal Morality, and Rules and Law. The results
of the model fit indicators are as follows: CMIN/df: 2.586 (excellent fit: < 3.00),
RMSEA: .055 (excellent fit: < .06), CFI: .942 (acceptable fit: .90 to 0.95) and SRMR:

391
.045 (excellent fit: < .08). The confirmatory factor analysis of the adjusted ethical
employee behaviour and conduct baseline model shows an acceptable to excellent fit.
Perceived Employee Performance – The results show that a single factor emerged
with 15 items having high reliability Cronbach’s score (0.94) for the perceived
employee performance baseline model.
5.3.3 Insights on Key Ethics Related Actions: Critical for
Implementation
Every business would consider the “Voice of the Customer” as a fundamental input in
driving their actions to properly fulfil the customers’ requirements as advocated by
many authors and researchers. In the same spirit, a similar approach becomes
essential in listening to the “Voice of the Actors” in the quest of addressing the dynamic
challenges surrounding ethical practices and standards in organisations (Griffin and
Hauser, 1993). The turning of voices into actions is an excellent analogy used by
Burchill and Hepner Brodie (2005) in explaining how the feedback from the market can
lead to the development of strategic actions in the overall delivery process towards
fulfilment of customers’ demands. A similar application of the voice of the customer
approach has been applied by Edinger‐Schons et al. (2019) in the domain of corporate
social responsibility. In the same way, the listening of the key actors in business and
understanding their demands and perspectives as to how ethical practices can be
elevated is crucial in the journey of transforming the ethical organsiational culture and
climate. The term “Voice of the Actors” is being coined in this section to represent the
critical inputs being provided by the employees (actors) in the organisations. These
operate across hierarchical levels (strategic, mid-management/supervisory or
operational), on what they see as critical ethics measures or ethics related actions
required for implementation to promote ethical behaviour and performance in the
workplace. The voice of the actors of the industries, as key inputs from the ground, is
pivotal in the putting forward any form of recommendations for the implementation of
Key Ethics Related Actions (KERAs).
The present study provides new insights emanating from the actors across industries
and corporations in Mauritius. These should be taken into account when defining an

392
implementation roadmap and strategy for effective and impacful outcomes in
transforming ethical organisational climate and culture in the corporate environment in
Mauritius. The results suggest that 13 KERAs emerged as being critical for
implementation in the local context, based on what the actors perceive as being vital
for transforming and strengthening their ethical culture, work standards and
environment. The data contributes to a clearer understanding as to why these KERAs
were rated by 37-45% of the respondents as being critical especially when the
outcomes of other related dimensions of the study were evaluated, as explained
below:
(a) Ranked 1st – Forty-five percent of the respondents rated “Promote workplace
integrity as part of performance appraisal” as a critical measure for
implementation. Performance appraisal is regarded as a vital tool to measure
employee performance in organisations as it reinforces accountability between
the employees and the organisation. It sets a platform for evaluation of goals
achievements and behavioural display through adequate feedback. It also
equips managers to set continuous improvement plans and to judge future job
assignments as well as compensation for the incumbents (Levinson, 1976). The
result also indicates that only 4% of the respondents acknowledge the presence
of performance evaluations of ethical conduct in their organisations. This, in
turn, explains why the call for promoting workplace integrity as part of the
performance appraisal system is so critical to the actors. When workplace
integrity forms part of the factors being measured in performance appraisals,
employees see the importance that the organisation places on proper conduct
and practices. It further serves as a basis for modifying their behaviours towards
more effective working habits characterised by principle-orientation, work
ethics, fairness, ethical conduct, compliance and sportsmanship. These factors,
in turn, help in creating the right ethical climate for employees to perform.
(b) Ranked 2nd – Forty-two percent of the respondents rated the need for “Training
on standards of workplace integrity”, “Formal process to discipline violations of
code of conduct” and “a culture based on virtues of transparency, feasibility,
discussability and sanctionability” respectively as critical measures for
implementation. Considering the importance being placed on workplace

393
integrity, its effectiveness will depend on how well employees understand what
that means, what it entails as required conduct from the employees, and how it
enables an ethical work climate to prevail. The findings suggest that investment
in ethics training, ethical standards and practices, and workplace integrity
standards will need to be reinforced considerably, given that only 12% of the
respondents claimed having such programmes in place in their organisations.
The emergence of a “formal process to discipline violations of code of conduct”
and a “culture based on virtues of transparency, feasibility, discussability and
sanctionability” as critical KERAs are in sync to a large extent with Kaptein’s
Corporate Ethics Virtues Model and his subsequent studies. These brought
further insights through its eight critical dimensions of the ethical culture of
organisations (Kaptein, 2008a). A culture of giving full visibility on the actions
undertaken for ethical deviances (virtue of transparency) when they are
identified and reported reinforces the ethical climate and raises the level of trust
in organisational leaders and ethics related systems. Likewise, the roll out of
realistic, attainable goals (virtue of feasibility) supported with a healthy level of
pressure would further enhance the ethical work climate. This would open
discussions of ethical dilemmas being faced by managers or employees (virtue
of discussability) and formally disciplining or sanctioning those who deviated
ethically (virtue of sanctionability). The very low prevalence of systems to
discipline violators in the local context, where only 3% of respondents confirmed
such practices in place, is in itself a cause for concern necessitating a complete
turnaround. Otherwise, it will create a perception that ethical deviations are
permissible in the organisations and that deviants have nothing to worry in the
absence of such sanctioning mechanisms. Vidaver-Cohen (1993) coined this
as a climate of organisational deficiencies which leads towards behavioural
challenges and moral regression amongst employees. This is why the
implementation of the suggested KERAs in organisations are critical to
reinforcing ethical standards, behaviours, and practices across industries.
(c) Ranked 5th – Forty-one percent of the respondents advocated as critical, that
“Leaders to actively foster ethical standards and practice in the workplace” and
the need for “Written standards of workplace integrity”. The vital role business
leaders play in instilling the right ethical organisational climate has been central

394
to many studies including the present one. The results of the present study
confirm the evidence established in the existing literature where ethical
leadership influences employees’ moral attitude and behaviour, employees’
performance and organisational commitment. This study, as with those
conducted previously, indicates that ethical leadership and decision making
have a consistent outcome on employee behaviour, engagement and
performance, irrespective of the multi-cultural, multifaceted and transnational
context. Thus, business leaders have a crucial active role to play to
demonstrate ethical stewardship, through their actions and decisions, so as to
nurture the right ethical conduct in the organisation and for their subordinates
to follow. The rationale behind the call for “Written standards of workplace
integrity” can also be understood, as the findings demonstrate that only 35% on
average claim having written ethics policies and standards in place. The larger
institutions employing over 500 employees have, on average, a higher
presence of such written ethics standards (60% on average). The call for
“Written standards of workplace integrity” can further be substantiated by the
fact that 29% of the respondents claim to have difficulties in determining which
behaviours are ethical or unethical. This dilemma can effectively be addressed
through properly defined ethics standards and the use of an established Ethical
Check Model such as conceptualised by Blanchard and Peale (1988). This
gauges which actions are ethically correct and which are not. These will help in
bridging the gap expressed by the actors in the context of this study.
(d) Ranked 7th – Forty percent of the respondents rated “Confidential / Anonymous
reporting” and “Ethics & Compliance Office and Resources” as being critical
enablers required to promote ethical behaviour and performance at the
workplace. Only 2% of the respondents confirmed having a means to report
potential violations confidentially or anonymously, while only 4% claimed that
their organisations have resources that provide advice about ethics issues. This
indicates that the implementation of these KERAs is at a very infant stage in
the local context and it would not help in elevating ethical work approaches or
disciplining ethical deviants if the required set of ethical related actions are not
implemented across organisations. They are thus critical for consideration in
any implementation of ethical frameworks and programs in organisations.

395
Likewise, the establishment of an Ethics and Compliance Office will play a
crucial role in enlightening the actors in the organisation through an established
ethics framework, ethics related training and coaching programmes, resources
providing ethical guidance. Such an office could act as an independent
guardian, regulator, ambassador, and enabler for ethical standards and
practices within organisations. In its role as an internal ethics authority, the
Ethics and Compliance Office would provide ethical advice on matters
pertaining to workplace fairness and integrity, conflicts of interest, ethical
decision making, and compliance to norms. The institutionalisation of such a
function, with a direct reporting line to the Board’s Corporate Governance
Committee would, for instance, demonstrate the Board’s serious intent, agenda
and the importance that it placed in setting the required ethical foundation in
the organisation to nurture corporate ethical character, marketplace trust, and
business success.
(e) Ranked 9th – Thirty–nine percent of the respondents advocated for the critical
need to “Implement a National Ethics Framework to promote ethical practices
and standards in the country”. This is one of the boldest and constructive
demands that employees operating across industries have put forward. On the
international front, there is a rally for the implementation of Environmental,
Sustainable and Governance (“ESG”) standards. Therefore, the
implementation of a National Ethics Framework can be regarded as a collective
pioneering and nationwide move in the adoption of ethical practices and
standards. This drive should be regarded as supporting the ESG initiative in a
broader perspective rather than being potentially perceived as a competing
approach.
(f) Ranked 10th – Thirty-seven percent of the respondents rated the following as
critical measures for implementation to promote ethical behaviour and
performance in the workplace. These were “Formal and informal systems to
report and resolve ethical concerns”, “Ability to seek feedback/advice related to
workplace integrity”, “Implement a formal ethics indicator/framework to disclose
the state of ethical climate in organisations as part of corporate reporting to
public” and “Institutionalisation of a formal process for ethical decision making”.
Some of these KERAs would already be covered within the scope of the

396
previously discussed ones for implementation (e.g. a system to report ethical
concerns confidentially or anonymously, an Ethics and Compliance
Office/Resource providing ethical advice, and the processes supporting ethical
leadership and decision making). The call for the implementation of “a formal
ethics indicator/framework to disclose the state of ethical climate in
organisations as part of corporate reporting to public” is a vital KERA emerging
from the study. This is because it elevates the approach to and importance of
ethics standards and compliance in the corporate world to another level,
reinforcing a strong culture of openness. The disclosure of the ethical climate
in organisations through established ethics indicators as part of corporate
reporting would constitute a noteworthy demonstration of the ethical drive of the
business community. So far, corporate governance matters have been subject
to corporate disclosures in a rather descriptive approach, based on set
guidelines demonstrating the organisational systems in place to support good
governance practices (e.g. Corporate Governance Code for Mauritius 2016). It
can be further argued that the present disclosures do not clearly indicate the
state of ethical climate prevailing in the organisation. This is because it is not
necessarily being measured and reported due to the absence of a common
initiative, measurement indicator, framework and standards guiding such
disclosures.

397
5.4 LIMITATIONS
Before putting forward appropriate recommendations for the business and research
communities, it is paramount to recognise the limitations of the study such that any
recommendations being made can be put into context. The results of the study confirm
that the two examined meso layer variables (ELDM and IEWP) have an important
bearing, as mediators, on the observed micro level variables to varying degrees. The
contribution of the indirect effects of ELDM and IEWP, as mediating variables, in
particular between OC and PEP, EOC and PEP, and OC and OCB represent around
40% of the total effect, thereby indicating relatively sizeable mediating effects on the
dependent variables. However, the study cannot confirm whether ELDM and IEWP
are the only mediating variables that influence the OCB and PEP. The generalizability
of the results is thus limited by the fact that there may be other mediating variables
influencing the observed variables over and the above the two that have been
established. This limitation is due to the scope of the study focussing mainly on the
two mediators that emerged as pertinent from the literature review.
Amongst the variables that have been evaluated through the present study, it appears
that there is a stronger tendency for organisational citizenship behaviour prevailing
across the business community in Mauritius. It nevertheless remains to be confirmed,
from an empirical perspective, whether this pattern is intrinsically linked with the
specificities of the multi-cultural facet of Mauritius or to any other factors that could
explain this phenomenon.
The use of the underlying established instruments for the measurement of the
respective variables under study has been very effective at undertaking the overall
study. However, from the literature review, it was found that there are a limited number
of instruments for measuring internal and external workplace pressures that are
compromising ethical stance. This necessitated an adaptation of the selected
instrument to gauge workplace pressures appropriately in the context of this study.
Though the adaptation was comprehensive enough to enable study of this variable,
the findings on workplace pressures might still be limited to the extent of this
adaptation and might not explain all the underlying issues related to workplace
pressures.
398
Furthermore, the present study has gauged the dynamics of ethical climate across all
industries, for the first time, and through an overarching lens, the level of “Pressure to
compromise ethical standards”, “Observed misconduct” and “Experienced retaliation”
prevailing in Mauritian organisations as well as enabling the benchmarking with other
countries. The results, however, cannot confirm the underlying reasons explaining the
similarities and differences between organisations in Mauritius and those in its peer
countries having similar ratings on these three main dimensions. Due to the scope of
this study, it was not possible to establish whether there are any underlying factors
common to the countries that could explain these patterns or orientation in ethical
climate. It is yet to be determined whether these patterns are due to the countries’
background, cultural traits, socio-economic model, leadership styles in the business
community, governance approaches and system in place, underlying guiding values
and interests of the people, or any other phenomena.
These limitations are intrinsically linked to either the restricted scope of the study or
the underlying complexity of measuring ethical human behaviour and workplace
dynamics. Nevertheless, the findings are valid for the purpose of answering the
research questions put forward both from a theoretical and empirical perspective. On
the one hand, the findings have contributed to building on existing theories and
evidence from previous studies. On the other hand, they have also brought forward
new insights that would go a long way in understanding the dynamics of ethical climate
and how the mediators influence organisational citizenship behaviour, ethical conduct
and behaviour, and performance of employees.

399
5.5 RECOMMENDATIONS & CONCLUSION
5.5.1 Introduction
On the basis of the enlightening outcomes of this ethics study, and having discussed
the findings comprehensively from an empirical, theoretical and multi-dimensional
perspective, it is now appropriate to put forward key recommendations that will equip
the country, business community, research world and scholars with key insights to:
(a) Advance the understanding of the dynamics of ethical climate and how ethical
leadership, decision making, and workplace pressure affect employees in the
work environment in the multi-cultural and cross-industry context of Mauritius.
In other words, how these key factors influence organisational citizenship
behaviour, ethical employee behaviour and conduct, and employee perceived
performance at large.
(b) Empower the business community with a purposely developed and tested
ethical climate model that can be operationalised to enhance organisational
citizenship behaviour, ethical behaviour and performance in the workplace;
(c) Equip the actors in the business world with insights, as advocated by the
employee community, on Key Ethical Related Actions required to support the
ethical strategy and journey in businesses.
5.5.2 Recommendations
5.5.2.1 Application of an “Ethical Climate Model for Organisational Citizenship
Behaviour” by the Business Community
On the basis of the theoretical foundation and empirical evidence, the study enabled
the development of a sound multi-factor ethical climate model enabling organisational
citizenship behaviour. The model, which is henceforth referred to as the “Ethical
Climate Model for Organisational Citizenship Behaviour”, aims to support business
enterprises in setting the right foundation that will primarily promote organisational
citizenship behaviour as well as employee ethical behaviour, conduct and
performance in the workplace.

400
The Ethical Climate Model for Organisational Citizenship Behaviour is built on a
theoretical foundation and was successfully tested with empirical data in Mauritius,
covering a multi-industry perspective, whilst considering the voice of key actors
operating at different levels of the hierarchy in the organisations.
The main building blocks and the multi-factor structure of the Ethical Climate Model
for Organisational Citizenship Behaviour is provided schematically in Figure 5.3 below
and explained to support its application within the business community.
Ethical Leadership
& Decision Making
Internal & External
Workplace
Pressures
macro meso micro
Organisational
Culture
Ethical
Organisational
Climate
Organisational
Citizenship
Behaviour
Employee Ethical
Behaviour &
Conduct
Perceived
Employee
Performance
Figure 5.3: Ethical climate model for organisational citizenship behaviour.
To embrace a new direction in social science to bridge research gaps on ethics in the
workplace, the model is structured within a macro-meso-micro framework so as to
deconstruct its complexities. It facilitates studies of the dynamics of organisational
culture, ethical organisational climate, ethical leadership, workplace pressures and
their resulting effects on organisational citizenship behaviour, employee ethical
behaviour and conduct, and employee perceived performance. The model, which has
successfully been tested empirically and demonstrates a good fit, confirms the
interrelationships and effects that the macro level variables have on the observed
micro variables both directly and through the meso layer variables. In other words,

401
having the right ethical culture and climate within the organisation leads to employees
demonstrating civic virtue, sportsmanship, altruism, ethical conduct, compliance to
norms and performance at work. The model also confirms that ethical leadership and
decision making as well as workplace pressures have a considerable mediating effect
on organisational citizenship behaviour and perceived employee performance within
enterprises. This therefore necessitates proper attention when shaping the right ethical
culture and climate.
The main recommendations to the business community are as follows:
(a) Nurture the right organisational culture as a baseline empowering enabler
Organisational culture has an important influence in the way employees across
hierarchies orientate their perception and behaviour. Business leaders should
therefore ensure that they lay the right foundation in setting clear business goals
and priorities. They should provide the required support to solve business
problems, striking the right balance between achieving business goals, people’s
consideration and work ethics, and promote transparency.
(b) Foster ethics principles and fair practices as part of an overarching climate
Business organisations should sense, regulate, and promote the right climate,
orientated towards compliance to principles, rules and standards whilst
demonstrating concerns for others (people, organisation and society). Such
attributes directly influence people’s willingness to deliver beyond their normal
prescribed duties whilst also promoting ethical behaviour on their part in the best
interests of the organisation. Organisations should curtail all such actions that can
pollute the work climate and create conditions of anomie that would be
counterproductive for employee performance. The prevalence of ethical
organisational climate also helps in attenuating workplace pressures and any
detrimental effects on the employees. Organisational climate characterised by
ethical standards and ethical considerations ultimately fosters the emotional
engagement and work commitments of the employees.

402
(c) Demonstrate ethical leadership qualities to stimulate positive behaviour,
engagement and performance
Business leaders have a duty to create the right work environment for their
stakeholders. They must demonstrate ethical leadership behaviours (fairness,
integrity, people consideration, role clarification, power sharing, respect for ethical
and deontological duties, and concerns for sustainability) and also show that
decisions are made on the basis of ethical consideration and fairness. This will
create an environment that will stimulate employee motivation, engagement,
citizenship behaviour, ethical conduct and performance. People should see
fairness in treatment, high standards of ethical decisions and actions prevailing in
the organisation, and demonstration of ethical traits and stewardship of their
leaders. Employees should experience transparency in dealings and decision
making, feeling of no pressure to compromise their ethical stance, and their
participation to the economic success are being fairly recognised and rewarded. If
these can be achieved, their motives for promoting organisational ethical and
citizenship behaviours will only grow. This reinforces the philosophy that if civic
virtue, altruism and fairness in participation to economic success are being
fostered, this will influence the right ethical and citizenship behaviour to permeate
within organisations. Such conditions will also help in curtailing ethical deviances
or any forms of pressure or motivation inciting people to compromise their ethical
stance for economic benefit or self-interests. Thus, ethical leadership and decision
making play an influential mediating role in fostering organisational citizenship
behaviour, employee ethical conduct and performance at work. It should
imperatively be promoted as part of the overall organisational culture and operating
philosophy of business enterprises.
(d) Regulate workplace pressures to restrict anomie and unhealthy climate
An increase in improper workplace pressures has been found to adversely impact
the employees’ morale and supress their abilities and motivation to excel. To avoid
adverse behavioural challenges, moral regression and an unhealthy work climate
amongst employees, businesses have to review their approaches in achieving
business goals. They must regulate the nature and intensity of workplace
pressures for the welfare of their employees and success of the organisation.
Striking the right balance between achieving business targets and means of

403
achieving such goals are fundamental in creating a healthy and ethical work
climate.
Regulating workplace pressures and promoting ethical leadership plays a central role
in fostering organisation citizenship behaviour and perceived employee performance
in organisations. It should therefore be considering as part of the underlying operating
philosophies.
As supported empirically through the Ethical Climate Model for Organisational
Citizenship Behaviour, the implementation of the above four recommendations will
lead to a sizeable and enriching effect in permeating organisational citizenship
behaviour, employee ethical behaviour and conduct, and perceived employee
performance at large. Efforts should therefore be made by the business community in
adopting such recommendations for the welfare of the organisations.

404
5.5.2.2 Adoption of Key Ethics Related Actions (“KERAs”)
To strengthen the ethical climate and culture in the local environment, the study
suggests that the following KERAs should be considered as part of a broad ethics
philosophy, strategy and framework at both national and organisational levels as
shown below in Figure 5.4:
Strategic Initiatives
Implement a National Ethics Framework to
promote ethical practices and standards in
the country
Institutionalise a Corporate Ethics Office to
drive the implementation of ethics and
compliance standards and programmes
within organisations
Implement a formal ethics
indicator/framework to disclose the state of
ethical climate in organisations as part of
corporate reporting to public
Ethics Programs and Systems
Ensure written standards of workplace
integrity are in place
Ensure continuous training on standards of
workplace integrity
Implement formal process to discipline
violations of codes of conduct
Promote workplace integrity as part of
performance appraisal
Implement a mechanism for confidential /
anonymous reporting
Implement formal and informal systems to
report and resolve ethical concerns
Establish a platform or mechanism to provide
feedback/advice related to workplace integrity
when being sought
Provide an approach on how to sense and
respond to ethical climate issue
Ethics Leadership
Foster a culture based on virtues of
transparency, feasibility, discussability and
sanctionability
Leaders to actively foster ethical standards
and practice in the workplace
Institutionalise a formal process for ethical
decision making
Ethics Support Tools
Provide a mechanism for employees to
establish what is ethical and what is not
Provide an interactive tool to provide tailored
content to each user to help in ethical
judgement and response (e.g. chat bot,
scenario videos, eBook)
Figure 5.4: Classification of the nature of key ethics related actions.

405
5.5.2.3 Embracing a National Ethics Strategy
Like in many other countries, the implementation of ethics standards in Mauritius has
been made through an articulation of “Code of Ethics” that stakeholders are called to
consider and abide by within the economic, social and political bodies. Whilst on one
hand, the prevalence of Code of Ethics across industries is considered to be low (only
19% of the participants confirming the presence of Code of Ethics in their
organisations), the study also reveals that the level of training on ethics standards and
codes are even lower (only 12% confirming such training in place). Coupled to this
issue, the findings indicate that employees are facing another dilemma in determining
what is ethical and what is not. In other words, they are unable to properly differentiate
which particular action or behaviour is considered to be ethically correct and which
one is not. On the back of these findings, the results suggest fundamental deficiencies
in applying an effective approach, in a consistent manner across industries, in setting
ethical standards and codes, raising awareness, providing the necessary means of
properly understanding ethics related matters and making ethical decisions. The
issues also indicate that organisations in the local context are at an initial stage of
deployment of ethical standards and practices, and which may also explain why ethical
deviances have been observed to a considerable extent.
To turn around these challenges and set the right base for ethical culture, there is a
strong need to embrace a national drive in institutionalising ethics standards, by
policymakers, business community, public enterprises, parastatal bodies, and socio-
political groups. There are two ways to embrace this national drive, either by
developing a new foundation or by building on an existing one. Either approach has
its own merits and challenges. Mauritius has adopted the new National Code of
Corporate Governance (“NCCG”) in 2017 which is an enhanced version aiming at
improving and guiding the governance practices of organisations within Mauritius
through a set of Principles (National Committee on Corporate Governance, 2016). The
NCCG encompasses principles and guidelines covering governance structures,
appointments, performance evaluation and remuneration procedures, risk governance
and controls, reporting and disclosures, audit standards, stakeholder relationships,
compliance, and codes of ethics. It would be more effective to build on this existing
foundation, given the growing adoption rate of the NCCG amongst private and public
organisations. Through this approach, organisations would also have a central point

406
of reference for all matters concerning governance and ethics. It is thus recommended
that the policymakers, captains of industry and key players of socio-economic groups
drive another wave of enhancements to the NCCG. This should encompass Ethics
Standards and Practices in a more in-depth and prominent way (as a Principle in itself)
in light of the findings of this study. At the same time, it reinforces the measurement
and reporting of ethical climate as part of corporate reporting standards.
The adoption of a National Ethics Strategy and framework should also aim to address
present ethical dilemmas that are fundamental in shaping the right ethical culture and
climate in Mauritian organisations. For instance, the measurement and reporting of
Business Ethics Indicators (encompassing the measurement of the rate of observed
misconduct, pressure to compromise standards, experienced retaliation, and
implementation of ethics programs) will go a long way to elevate the corporate
reporting standards and ethical business practices across organisations. This will also
apply to determining an Organisational Ethics Score (as part of an ethics Principle in
the NCCG Scorecard), and the application of KERAs.
Public disclosures of the state of ethical climate through corporate reports would also
serve as a self-regulating mechanism for organisational leaders and stakeholders as
it would pave the way for ethical stewardship. Such an initiative will make ethical
leadership, ethical decision making, behaviour and conduct an integral part of
business life.
5.5.3 Imperatives for Future Research
The present study established the mediating effects of Ethical Leadership and
Decision Making, and Internal and External Workplace Pressures more specifically on
Organisational Citizenship Behaviour and Perceived Employee Performance. Though
they both account for a sizeable mediating effect on the dependent micro level
variables, future research should aim to explore and establish whether there could be
other key mediating variables that could have influential bearing on Organisational
Citizenship Behaviour and Perceived Employee Performance. If so, how would that
compare to the present findings.
The present study indicates that “Achieving Business Goals” is one of the key
underlying factors characterising the organisational culture in Mauritius. Furthermore,

407
it was also found that employees face pressure to attain business goals at all cost from
their bosses. Additionally, the pressure to protect the company’s reputation emerged
at the topmost workplace pressure. These findings appear to project a subtle climate
of “Unethical Pro-organisational Behaviour”, where unethical behaviour takes place
with the intention of benefiting the organisation. The aspect of Unethical Pro-
organisational Behaviour does not seem to have received enough research attention
in a multi-cultural context. This is also supported in the future research agenda put
forward by Newman et al. (2017). Further research is thus needed to establish whether
such climates exist, the extent to which they are prevailing, and their likely effects on
employee morale, ethical and citizenship behaviour in the organisations.
Whilst undertaking the literature review on Internal and External Workplace Pressures,
it was noted that there are very limited numbers of established instruments available
that could be used to measure and study this vital component in the business context.
Considering the importance, prevalence and effects of workplace pressures, it is high
time that further studies are conducted on this particular phenomenon to establish a
reliable instrument or scale to support the research and business communities.
This study has established ethical climate types in the current context as well as their
effects on observed variables, it would also be beneficial for future research to be
orientated towards establishing Ethical Climate Strength. An initiative has been
proposed to devise an adapted instrument for measuring the ethical components
emanating from the empirical tested model of the present study, and a
recommendation put forward to institutionalise Business Ethics Indicators as part of
corporate reporting standards. This will greatly advance the body of knowledge if
future scientific studies could bring further contribution and insights on practical
approaches and framework that could enable the measurement of Ethical Climate
Strength based on sound theoretical and empirical foundation.

408
5.5.4 Conclusion
5.5.4.1 Process Adopted for Attending to the Research Problems and Research
Objectives
In conclusion, based on the theoretical and empirical findings derived from the present
study, it is vital at this stage to review the underlying research problem and research
objectives that guided this whole study and also summarise how the respective
research problem was addressed and the research objectives met.
Scientific Orientation of the Research: The relationship between ethics and
leadership have been studied by many scholars for quite some time (Burns, 1978;
Deconinck, Deconinck and Moss, 2016). Despite numerous ethics related studies and
the implementation of several key ethics related measures including guiding codes
and principles (e.g. codes of conduct, codes of corporate governance and ESG
principles), the world continues to face major socio-economic challenges due to ethical
issues (Huang & Paterson, 2017). Undisputedly, the ethical dimension to leadership
has to receive further research attention in the midst of such mounting challenges
especially in areas of organisational ethical culture and climate. This is even more
urgent in a context characterised by a plurality of cultures and diverse socio-economic
dynamics.
This particular study was thus undertaken to address the research problems
surrounding ethical organisational climate in a multi-cultural and multi-industry context
of Mauritius such that the business and research communities can benefit from new
insights and findings of this research. The study aims to shed light on the state of
ethical climate in the local context and its dynamics and interrelationships with key
related variables that would shape organisational citizenship and ethical behaviour
and performance in business enterprises. Chapter 1 thus provided the scientific
orientation of the research setting out the background, problem statement, research
questions, research aims and how the study is proposed to be undertaken.
Literature Review: An extensive literature review was conducted in Chapter 2. This
covered organisational culture, ethical organisational climate, leadership and
behaviour, as key integrated building blocks of the study. Central to the literature
review was the study of ethical theories (philosophical egoism, utilitarianism,

409
deontology, virtue ethics, and ethics of responsibility) and their interrelationships with
leadership theories. In particular, Victor and Cullen’s (1988) Ethical Work Climate,
Vidaver-Cohen’s (1998) Moral Climate Continuum and Kaptein’s (2008) Corporate
Ethics Virtue Model were studied. The theories and empirical research findings
underpinning ethical leadership and decision making were also reviewed
comprehensively. This helped to establish the relationships between ethical
leadership and moral attitude, organisational behaviour, organisational commitment,
moral intensity and organisational culture. Rest (1986), Jones (1991) and Lincoln and
Holmes (2008) models and theories were reviewed in detail so as to determine how
ethical judgement takes place in the moral continuum. In a quest to evaluate the
influence of workplace pressures on ethical organisational climate and behaviour in
general, an in depth study was also done on internal and external workplace pressures
(“internal” being such pressures centred on the employee’s own survival, job security,
career and financial sustainability, and “external” being such pressures to meet
business targets and goals, ensure financial success of the company, and create value
for the shareholders). To understand the interplay between social structures, pressure
and anomie, the Merton’s (1957) theory was studied. This was complemented with the
study of global research conducted by Ethics and Compliance Initiatives, which
provided important insights on the state of ethical climate across countries, together
with the underlying challenges affecting ethical organisational climate. The Mauritian
context was also studied to set the scene on its inherent background, the diversities
of its culture, multi-industry business context, previous studies and research gaps
identified.
Research Gaps: The in-depth literature review enabled to establish precise
theoretical and empirical research gaps that needed to be bridged to further reinforce
ethical organisational climate and foster organisational citizenship behaviour, ethical
employee behaviour and conduct, and perceived employee performance. It was also
found that theoretical models have yet to determine whether mediation effects
between organisational ethics components within a conceptual macro-meso-micro
framework remain constant across different contexts, organisations and groups of
individuals (Grobler & Grobler, 2016).

410
Future research recommendations were put forward by Li (2012) and Engelbrecht et
al. (2017) who called for a new direction in the field of social science. To bridge these
research gaps, the study therefore focussed on decomposing the underlying
complexities of ethical climate and evaluating the interrelationships and effects
between the associated variables in a conceptual macro-meso-micro framework. The
overall study was thus structured in a 3-tier model as follows:
Macro Layer – Comprising of two independent variables (Organisational
Culture and Ethical Organisational Climate)
Meso Layer – Comprising of two mediating variables (Ethical Leadership and
Decision Making, and Internal and External Workplace Pressures)
Micro Layer – Comprising of three dependent variables (Organisational
Citizenship Behaviour, Employee Ethical Behaviour and Conduct, and
Perceived Employee Behaviour).
These sub-constructs laid the foundation for a more granular and yet focussed study
which would subsequently allow for precise assessment of the variables under study.
The study was further motivated by the fact that such a multi-layered ethics approach
has not been yet been undertaken in the multi-cultural and cross-industry context of
Mauritius. This study was thus specifically oriented towards bridging this gap and
providing new insights to the country, business, and research communities at large.
Research Design and Methodology: Considering the research aim, nature of this
study and research questions put forward, a more rigorous positivist approach to
measure behavioural aspects was adopted (Cohen, Manion and Morrison, 2011;
Neuman, 2015). The research design and methodologies were set out in detail in
Chapter 3. In the context of this study, the scope, relevance, merits and criticisms of
41 previously validated and established instruments were evaluated, resulting in eight
instruments being retained. Few of them were marginally adapted (where required to
bridge research gaps and respond to the research questions without affecting the
underlying instruments’ validity and reliability attributes) and integrated in a master
multi-factor instrument with 230 items assessed on 5-point Likert-type scales. Out of
a population of 2,534 establishments (classified as “large” by the Statistics Office)
operating across industries in Mauritius, a sample of 526 was devised. The survey led
to 523 suitable representative responses from participants working in these ‘large’

411
organisations (across industries) to be retained for in-depth quantitative analysis and
statistical assessment (correlation, multiple regression, exploratory and confirmatory
factor analysis and path analysis).
Analysis of Research Findings: The research data enabled a comprehensive
assessment of the dynamics of the interrelationships, direct and mediating effects of
organisational ethics components within the framework. The state of ethics standards
and practices in the local context was analysed and assessed. An evaluation of the
behavioural patterns across industries, organisations and groups of people was also
effected to assess any specific patterns with certain groups (e.g. age, socio-economic
and industry). The direct effects of the independent variables and the mediating effects
of the meso variables were comprehensively assessed and their corresponding
impacts were determined and interpreted through path analysis. The conceptual
macro-meso-micro research model, underpinning this study was subject to model fit
and empirical assessment. The statistical tests reveal that the Conceptual Research
Model holds a good fit and can be adopted as a model to guide businesses and the
research community within the extent of its scope, empirical merits and limitations.
Furthermore, there was also a need to identify and evaluate critical ethical related
actions that could help the business community to address ethical related challenges
and dilemmas. The survey led to the emergence of KERAs, identified as being critically
required by the employees across hierarchical levels that would reinforce ethical
climate, standards and practice in the corporate world. The potential contributions of
these KERAs were evaluated and found to be relevant if adopted as part of a broader
ethics strategy in elevating ethical and organisational citizenship behaviour within
organisations. These were attended to in Chapter 4.
Discussions and Recommendations: Chapter 5 was a culminating point built on the
empirical findings and their interpretations stemming from the previous chapter. The
prime goal of this chapter was to put the empirical findings into perspective, discuss
and formulate recommendations that will empower the business community to elevate
ethical organisational climate, culture, standards, practices, and behaviour. The ten
specific empirical aims were attained through the research findings highlighted and
discussed in Section 3 of this Chapter. A recommendation for a national drive is also
being put forward for policymakers and captains of the industries to pioneer the

412
implementation of a revitalised ethical philosophy, approach and benchmark for the
corporate world.
5.5.4.2 Key Research Findings
Global Benchmark – For the first time, it has become possible to rate and compare
the state of ethics prevailing in Mauritius with other countries, on a few comparable
dimensions, based on the empirical results of the present study. The results show that
the rate of observed ethical deviances and malpractices in the workplace over the last
12 months was considerable. Mauritius finds itself in the segment of countries with the
lowest reported rate of pressure to compromise ethical standards, observed
misconduct and experienced retaliation over the last 12 months, however, this pattern
is different when measuring the same indicators over a broader timescale. In fact,
Mauritius shifts from the bottom to the upper mid segment of the global league of ECI
when specifically measuring pressure to compromise ethical standards beyond the
12-months horizon. Due to the nature and intensity of such pressures at work, a high
rate of respondents felt that such pressures are adversely impacting the health, morale
and performance of employees. The results indicate that there is a necessity to
address workplace pressures as they lead to ethical deviances and unhealthy
behaviour in the work environment.
State of Ethics Standards and Practices – A large majority of the respondents
confirmed that their organisations are promoting ethics and compliance, albeit at
varying degrees, with written ethics policies and standards, and code of ethics being
the two top most ethics related measures in place. However, it was also noted that a
segment of participants rarely or never promotes such practices. The prevalence of
training programmes on ethics standards and codes are unfortunately at a very low
rate, and systems to report and discipline ethical violations could even be qualified as
“quasi absent”. The study also indicates that a small segment of the largest
establishments (above 2,500 employees) have performance evaluations of ethical
conduct as part their appraisal systems. These results show that organisations across
industries will need to embrace a new wave of transformation to foster ethical climate
and culture through senior stakeholder ethical vision, commitment and stewardship,
key ethics related actions (13 emerged as critical for implementation), workforce

413
engagement and approaches that reinforce the enterprise ethical standards and
foundation consistently.
Emerging Organisational Culture and Ethical Organisational Climate Types–
The study shows that the organisational culture within Mauritian business enterprises
is characterised by three main factors, i.e. Achieving Business Goals, People
Consideration and Work Ethics. As regards the prevailing ethical organisational
climate, the present study demonstrates that the corporate world in Mauritius is
characterised by three ethical climate types (Principle-oriented, Benevolence and
Altruism). The former two ethical climate types have been found to be common to
other established theories and studies. However, Altruism appears to be specific to
the context. The emergence of these three ethical climate types somewhat confirms
the existing perception that Mauritians tend to be guided by their principles, cultural
values, norms and law, on one hand, whilst also being inclined to care for the interests
of others.
Prevailing Workplace Pressures – Amongst the various kinds of pressures being
felt in the organisations, ten of them emerged as the most prominent ones that could
influence employees to compromise ethical behaviour and standards. Though these
pressures have been confirmed by a considerable number of the respondents, the
pressure to protect the company’s image comes as the topmost external workplace
pressure. On the other hand, the pressure to protect one’s own/family reputation and
the pressure to progress one’s own career for better pay and living emerge as the
topmost internal pressure facing the individual. Furthermore, the result also indicates
that a considerable number of the respondents felt pressure to compromise ethical
standards to win business deals. Four factors emerged from the confirmatory factor
analysis measuring internal and external workplace pressures (i.e. Prioritisation of
Economic Results, Violations of Ethical Guidelines, Situational Stress and Personal
Situational Stress). Of these, the results indicate that the Prioritisation of Economic
Results emerges as the most impactful workplace pressure factor followed by
Personal Situational Stress. This shows that the ethical stance of people tends to be
compromised when facing economic and reputational pressures.
Ethical Leadership and Decision Making – The study led to the emergence of six
factors characterising the ethical leadership and decision making variable in the local

414
context (i.e. Integrity, Role Clarification, Ethical Guidance and Concern for
Sustainability, Power Sharing, Fairness and People Orientation). As regards the
ethical leadership practices, one third of the respondents felt the pressure to follow
and execute orders from the boss(es) for the latter’s own self-interests. Such demands
are viewed as disproportionate and put the employees into ethical dilemmas in fulfilling
such instructions for their own job’s security. It was also found that employees have
difficulties in making ethical judgements between what action is ethical and what is
not. These conditions were characterised by deficiencies in ethical leadership and
ethical decision making and are likely to influence unhealthy ethical behaviour to
prevail in organisations locally.
Relationships between the Macro-Meso-Micro Level Variables – The study
confirms that all the variables within the research model are correlated at varying
levels and are statistically significant. Most variables are positively correlated except
that the Internal and External Workplace Pressure variable has negative relationships
with the associated study variables. The interrelationships between the variables
demonstrate that they stand and can evolve as an integral unit for determining
organisational citizenship and ethical behaviour in the workplace.
Effects of the Independent and Mediating Variables – Organisational Culture and
Ethical Organisational Climate jointly influence the dependent variables both directly
and indirectly at varying degrees. The study reveals that the two independent variables
have a combined moderate effect on Ethical Leadership and Decision Making
and on Internal and External Workplace Pressures. It was also found that Ethical
Leadership and Decision Making (as a mediating variable) influences Perceived
Employee Performance the most compared to the other two dependent variables of
Organisational Citizenship Behaviour and Employee Ethical Behaviour and Conduct.
The study confirms the influencing role that the mediating variables play in shaping
the ethical and citizenship behavioural patterns within organisations across
hierarchies.
The independent and mediating variables jointly account for more than half of the total
variance in Perceived Employee Performance, one third of the total variance in
Organisational Citizenship Behaviour and one third of the total variance in Employee
Ethical Behaviour and Conduct. It must be noted that the two mediating variables have

415
a statistically insignificant mediating effect specifically between Ethical Organisational
Climate and Employee Ethical Behaviour and Conduct. It has nevertheless been
established that the mediating variables play a vital role in the overall research model
as their indirect effects account for a considerable portion of the total effect on the
dependent micro variables.
Most Impactful Meso Variable - Ethical Leadership and Decision Making emerges
as the meso variable influencing Organisational Citizenship Behaviour and Perceived
Employee Performance the most. As regards Employee Ethical Behaviour and
Conduct, it is mostly influenced by Internal and External Workplace Pressures. This
demonstrates that leaders play an instrumental role in shaping the organisational
citizenship behaviour and performance amongst the employees. Adverse workplace
pressures are likely to fuel ethical deviances and affect employees’ ethical stance and
conduct.
Behavioural Orientation across different Groups – The results also indicate that
different groups (age, socio-economic and industry) have varying perceptions and
behavioural orientation with regards to Organisational Culture, Ethical Leadership and
Decision Making, Internal and External Workplace Pressure and Organisational
Citizenship Behaviour. The way the young and older generation perceives
organisation citizenship behaviour is different. It therefore requires organisations to
pay special attention to group dynamics when developing and steering ethics
programs.
Key Ethics Related Actions (KERAs) – Thirteen KERAs emerged as being critical
for implementation in the local context in view of further strengthening the ethical work
standards and climate. The most prominent ones are:
Promote workplace integrity as part of performance appraisal
Enhance training on standards of workplace integrity
Institutionalise formal process to discipline violations of codes of conduct
Foster a culture based on virtues of transparency, feasibility, discussability
and sanctionability
Leaders to actively foster ethical standards and practice in the workplace

416
An Ethical Climate Model for Organisational Citizenship Behaviour – The study
culminated in establishing a good fit ethical climate model, built on a theoretical and
empirical foundation for promoting organisation citizenship behaviour. It encompasses
key interrelated factors that will contribute towards stimulating the right set of positive
citizenship and ethical behaviours as well as performance amongst employees in the
workplace. The adoption of the three key proposed recommendations will go a long
way towards rendering its application within organisations practically and effectively
as part of an overarching ethics and business strategy. The adoption of a national and
enterprise-wide ethics strategy and their effective implementation will further reinforce
the ethical standards and practices in Mauritius.
5.5.4.3 Key Research Contributions
This study brings a vital contribution to the field of social science at various levels
(theoretical, empirical, business and national) as highlighted below:
(a) Contribution at a theoretical level
The study builds on previous research such as Jeurissen (1997), Dopfer et al. (2004),
Li (2012) and Engelbrecht et al. (2017) and responds to their calls for the adoption of
a new direction in social science research through a macro-meso-micro framework.
The present study of ethics in the workplace was therefore structured on such a
framework which provided precise understanding and new insights as to how ethical
and behavioural context variables are interrelated and influence each other. The study,
in particular, demonstrates how the complexities of ethical climate can be broken down
and their dynamics be studied through macro-meso-micro lenses. The study helped
in bridging existing theoretical gaps and showed how:
The macro level independent variables (Organisational Culture and Ethical
Organisational Climate) are related to the meso level mediating variables
(Ethical Leadership and Decision Making, and Internal and External Workplace
Pressures) and the micro dependent ones (Organisational Citizenship
Behaviour, Employee Ethical Behaviour and Conduct, and Perceived
Employee Performance);
The macro level variables directly influence the micro level dependent ones;

417
The meso level variables interplay within the framework and influence the micro
level dependent variables indirectly; and
The extent of such direct, mediating, and combined effects on the observed
variables.
The study is original as it integrates seven core intrinsically linked components
surrounding organisational culture, ethical organisational climate, leadership,
workplace pressure and behaviour within a single research, and evaluates their
interrelationships and effects through a 3-tier model.
These contributions will help the researchers, industrial and organisational
psychologists and business leaders in better understanding how organisation
citizenship and ethical behaviours and employee performance could be enhanced
within business enterprises.
(b) Contribution at an empirical level
The findings of the study contributed to the development of an empirically tested
Ethical Climate Research Model encapsulating the mediating effects of ethical
leadership and workplace pressures on organisational citizenship behaviour. The
extensive scope of the present research and the depth of its outcomes adds a new
dimension to the ethical and behavioural knowledge base in Mauritius and the larger
research community. Empirical insights on the underlying structures of organisational
culture, ethical organisational climate, ethical leadership, workplace pressure,
organisational citizenship behaviour, employee ethical behaviour and conduct, and
perceived employee performance are henceforth available for the local context. For
instance, the types of prevailing organisational culture and ethical organisational
climate have now been confirmed. Similarly, the challenges faced from an ethical
leadership perspective as well as the nature and intensities of workplace pressures
affecting the ethical stance, behaviour, health, morale and performance of employees
in the local context have been identified and assessed empirically. The key
contributors and ethics related actions to reinforce ethical standards, practices and
organisational citizenship behaviour have also been established in the multi-cultural
and cross-industry context of Mauritius. Furthermore, the perceptions and behavioural
orientation of people in different age, socio-economic and industry groups have also

418
been assessed and found to vary when it comes to organisational culture, ethical
leadership, workplace pressures and organisational citizenship behaviour. Such
empirical insights will go a long way to support the business and research communities
in their quests to curtail ethical deviances through strategic, theoretical, empirical, and
behavioural inputs.
(c) Contribution at a business level
One of the prime underlying goals of the study was to help organisations in addressing
the ever-mounting ethical challenges arising in the business environment, whether
locally or internationally. The theoretical and empirical findings have shed light on new
insights on the prevailing state of ethics and how the ethical challenges could be
addressed over time. To render these technical findings practical for implementation
by the business community, the following contributions in the form of key
recommendations, are being made:
The application of an Ethical Climate Model for Organisational Citizenship
Behaviour – On the basis of the theoretical foundation and empirical findings, a 3-
tier multi-factor Ethical Climate Model for Organisational Citizenship Behaviour has
been derived with good fit that would help organisations across industries in their
strategic purpose of stimulating citizenship behaviour at work, elevating ethical
behaviour, and employee performance enterprise-wide.
The adoption of Key Ethics Related Actions (KERAs) – To support the business
community in devising a comprehensive and effective ethics culture journey and
framework, a set of KERAs deemed critical for implementation has been
recommended to turn the relatively deficient prevailing operating practices into
effective ethics-oriented operating standards. It encompasses various enablers
including the establishment of a Corporate Ethics Office, ethics programs, an
approach to sense and respond to ethical challenges, a process for ethical
discussions, judgement and continuous learning, as well as integrating business
ethics indicators as part of corporate reporting.

419
(d) Contribution at a national level
To reinforce ethical standards and practices nationwide, the adoption of a National
Ethics Strategy is also being recommended. A national drive for institutionalising ethics
standards by key stakeholders (e.g. policymakers, business community, captains of
the industry, public and parastatal bodies, and socio-economic groups) as part of an
enhanced NCCG will further raise ethics as a more prominent and self-standing
principle of the overarching corporate governance and ESG framework.
5.5.5 Way forward for future research
Considering the present findings and patterns therefrom, future research is needed in
areas of Unethical Pro-Organisational Behaviour and Ethical Climate Strength. The
development of a reliable instrument to measure Workplace Pressures will also
necessitate future research attention given present literature gaps.

420
6. REFERENCES
Aaltio-Marjosola, I., & Takala, T. (2000). Charismatic leadership, manipulation and the complexity of organizational life. Journal of Workplace Learning: Employee Counselling Today, 12.
Abbasi, S., Hollman, K., & Murrey, J. (1989). Islamic economics: foundations and practices. International Journal of Social Economics, 16(5), 5–17.
Abbott, G. (1989). The Commonwealth Sugar Agreement as a Model for a New Sugar Protocol.
Abe, N., & Iwasaki, I. (2010). Organisational culture and corporate governance in Russia: A study of managerial turnover. Post-Communist Economies, 22(4), 449–470. https://doi.org/10.1080/14631377.2010.518455
Ackroyd, S., & Fleetwood, S. (2000). Realist perspective on Management and Organisation. Routledge.
Adebanjo, D. (2001). TQM and business excellence: Is there really a conflict? Measuring Business Excellence, 5(3), 37–40.
Adorno, T. W., Adey, G., & Frisby, D. (1976). The positivist dispute in German sociology. Harper & Row.
Agle, B. R. \, & Van Buren, H. (1999). God and Mammon: The Modern Relationship. Business Ethics Quarterly, 9.
Ah-Kion, J., & Bhowon, U. (2017). Leadership and Ethical Decision Making among Mauritian Managers. 22(1).
Ah-Teck, J. C., & Hung, D. (2014). Standing on the shoulders of giants: An ethical Leadership agenda for educational reform in Mauritius. International Journal of Arts & Sciences, 07(03), 355–375.
Alas, R. (2006). Ethics in countries with different cultural dimensions. Journal of Business Ethics, 69(3), 237–247. https://doi.org/10.1007/s10551-006-9088-3
Ali, A., Camp, R., & Gibbs, M. (2000). The Ten Commandments: Perspective, Power and Authority in Organization. Journal of Business Ethics, 26, 351– 361.
Alizadeh, Z., Darvishi, S., Nazri, K., & Emami, M. (2012). Antecedents and Consequences of Organisational Citizenship Behaviour. Interdisciplinary Journal of Contemporary Research in Business, 3(9), 1–12. ijcrb.webs.com
Allen, N. J., & Meyer, J. P. (1990). he measurement and antecedents of affective, continuance and normative commitment to the organisation. Journal of Occupational Psychology, 63.
Alvesson, M. (2002). Understanding Organizational Culture. Sage Publications.

421
Antes, A., Brown, R., Murphy, S., Waples, E., Mumford, M., Connelly, S., & Devenport, D. (2007). Personality and ethical decision-making in research: The role of perceptions of self and others. Journal of Empirical Research on Human Research Ethics, 2, 15–34.
Apriliani, D., Anggraini, R., & Answer, C. (2014). The effects of organisational ethical culture and ethical climate on ethical decision-making of the auditor with self-efficacy as moderating factor. Review of Integrative Business and Economics Research, 4(1), 226–244.
Ardichvili, A., Jondle, D., & Kowske, B. (2010). Dimensions of ethical business cultures: Comparing data from 13 countries of Europe, Asia, and the Americas. Human Resource Development International, 13(3), 299–315.
https://doi.org/10.1080/13678868.2010.483818
Argentero, P., Cortese, C. G., & Ferretti, M. S. (2008). An evaluation of Organizational Citizenship Behavior: Psychometric characteristics of the Italian version of Podsakoff et al.’s Scale. TPM - Testing, Psychometrics, Methodology in Applied Psychology, 15(2), 61–75.
Arjoon, S. (2000). Virtue theory as a dynamic theory of business. Journal of Business Ethics, 28.
Arnaud, A. (2006). A New Theory and Measure of Ethical Work Climate: The Psychological Process Model (PPM) and the Ethical Climate Index (ECIi). Academy of Management Annual Meeting Proceedings, 8(1), E1–E6. https://doi.org/10.5465/AMBPP.2006.27182164
Aronson, E. (2001). Integrating leadership styles and ethical perspectives. Canadian Journal of Administrative Sciences, 18.
Arruda, M. C. (1997). Business ethics in Latin America. Journal of Business Ethics, 14.
Asgarally, I. (2007). Mauritius: An Island of Cultures. Edition Le Printemps Ltee.
Astrachan, J. H., & Shanker, M. C. (2003). Family businesses’ con- tribution to the US economy: A closer look. Family Business Review.
Attorney General’s Office. (1997). Code of Ethics for Barristers.
Avey, J. B., Avolio, B. J., Crossley, C. D., & Luthans, F. (2009). Psychological ownership: Theoretical extensions, measurement and relation to work outcomes. Journal of Organizational Behaviour, 30(2), 173–191.
Avolio, B. J., Hannah, S., Reichard, R., Chan, A., & Walumbwa, F. (2009). 100 years of leadership intervention research. Leadership Quarterly.
Avolio, B., Waldman, D., & Yammarino, F. (1991). Leading in the 1990s: the four Is of transformational leadership. Journal of European Industrial Training, 15(4), 9–16.
422
Avolio, Bruce J., Walumbwa, F. O., & Weber, T. J. (2009). Leadership: Current Theories, Research, and Future Directions. Annual Review of Psychology, 60(1), 421–449. https://doi.org/10.1146/annurev.psych.60.110707.163621
Avolio, J. B., Gardner, W. L., & Walumbwa, F. O. (2007). Authentic Leadership Questionnaire. c:%5CRIS DataStore%5CPerso%5CUnisa%5CLiterature Reviews%5CQuestionnaire - Instrument for Measurement%5CQuestionnaire - Authentic Leadership Questionnaire (ALQ).htm
Awang, Z. (2012). Research Methodology and Data Analysis. Penerbit Universiti Teknologi MARA Press.
Aziz, R. A., & Morita, H. (2016). National culture, organisational culture, total quality management implementation, and performance: An empirical investigation. International Journal of Productivity and Quality Management, 19.
Babin, B. J., Hair, J. F., & Boles, J. S. (2008). Publishing research in marketing journals using structural equation modeling. Journal of Marketing Theory & Practice, 16(4), 279–285.
Bachrach, P., & Baratz, M. (1962). Two Faces of Power. The Americun Political Science Review, 56(4), 947–952.
Badawy, M. R. (1979). Managerial attitudes and need orientations of Mid-Eastern Executive: An empirical cross-cultural analysis. Academy of Management.
Bahcecik, N., & Oztürk, H. (2003). The hospital ethical climate survey in Turkey. JONAS Health Law Ethics Regulations, 5(4), 94–99.
Ball, G. A., Trevino, L. K., & Sims. (1994). Just and unjust punishment: Influences on subordinate performance and citizenship. Academy of Management Journal, 37(2), 299–322.
Bandura, A. (1977). Social learning theory. Prentice-Hall.
Bandura, A. (1986). Social foundations of thought and action: A social cognitive theory. Prentice-Hall.
Banerji, P., & Krishnan, V. R. (2000). Ethical preferences of transformational leaders: An empirical investigation. Leadership and Organization Development Journal, 21(8), 405–413.
Bank of Mauritius. (2018). Bank of Mauritius - History. https://www.bom.mu/about-the-bank/history
Barbuto, J. E., & Wheeler, D. W. (2006). Scale development and construct clarification of servant leadership. Group & Organisation Management, 31(3), 300–326.
Barnett, T. (2001). Dimensions of moral intensity and ethical decision making: An empirical study. Journal of Applied Social Psychology, 31, 1038–1057.
Barnett, T., & Schubert, E. (2002). Perceptions of the Ethical Work Climates and Covenantal Relationships. Journal of Business Ethics, 36, 279–290.

423
Barney, J. B. (1986). Organizational culture: Can it be a source of sustained competitive advantage? Academy of Management Review, 11.
Bass, B. . (1990). Bass & Stogdill’s handbook of leadership. Free Press division of Macmillan, Inc.
Bass, B. . M. (2008). The Bass handbook of leadership: Theory, research, & managerial applications (4th (ed.)). Free Press.
Bass, B. M. (1995). Transformational leadership redux. Leadership Quarterly, 6(4), 463–478.
Bass, B. M. (1998). Transformational Leadership; Industry, Military, and Educational Impact. Lawrence Erlbaum Associates, Incorporated.
Bass, B. M., & Avolio, B. J. (1993). Transformational Leadership and Organizational Culture. Public Administration Quarterly, 17.
Bateman, T. S., & Organ, D. W. (1983). Job satisfaction and the good soldier: The relationship between affect and employee citizenship. Academy of Management Journal, 26(4), 587–595.
Batson, C. D. (2011). What’s wrong with morality? Emotion Review, 3(3), 230–236. https://doi.org/10.1177/1754073911402380
Baylor University. (n.d.). Workplace Ethics Questionnaire. Baylor Business Ethics. https://www.baylor.edu/business/ethics/index.php?id=87726
Beck, J. A., Lazer, W., & Schmidgall, R. (2010). Can an ethical situation be “not a question of ethics”? Journal of Hospitality Marketing and Management, 19(2), 157–170. https://doi.org/10.1080/19368620903455278
Becker, T. E., Billings, R. S., Eveleth, D. M., & Gilbert, N. L. (1996). Foci and bases of employee commitment: Implications for job performance. Academy of Management Journal, 39, 464–482. https://doi.org/http://doi.org/frhrw6
Beiske, B. (2002). Research methods. Uses and limitations of questionnaires, interviews, and case studies. Grin Verlag.
Belenky, M. F., Blythe, M. C., Goldbecker, N. R., & Tarule, J. M. (1986). Women’s ways of knowing: the development of self, voice and mind. Basic Books.
Bentham, J. (1789). An introduction to the principles of morals and legislation. Clarendon Press.
Berenbeim, R. (1987). Corporate ethics. Conference Board, 17(4).
Bertels, T., & Buthmann, A. (2013). Raise the Bar. Quality Progress, 46(8), 28–32.
Betan, E. J. (1997). Toward a hermeneutic model of ethical decision making in clinical practice. Ethics & Behaviour, 7, 347–365.
Bird, F. (1999). Making a difference: Practical ethical leadership in organizations. In Concordia university.

424
Bird, F. B., & Waters, J. A. (1989). The moral muteness of managers. California Management Review, 32, 73–88.
Bishop, W. H. (2013). Defining the Authenticity in Authentic Leadership Defining the Authenticity in Authentic Leadership. Jounal of Values-Based Leadership, 6(1), 1–9.
Black, S. J., & Morrison, A. J. (2014). The Global Leadership Challenge (2nd ed., pp. 46–48). Routledge.
Blanchard, K., & Peale, N. V. (1988). The Power of Ethical Management: Why the ethical way is the profitable way in your life and in your business. William Morrow and Company, INC.
Bligh, M. C., Pearce, C. L., & Kohles, J. C. (2006). The importance of self- and shared leadership in team based knowledge work. A meso-level model of leadership dynamics. Journal of Managerial Psychology, 21(4), 296–318.
Boisjoly, R. P., Curtis, E., & Mellican, E. (1989). Roger Boisjoly and the Challenger Disaster: The Ethical Dimensions. Journal of Business Ethics, 8, 217–230.
Bondy, K. (2009). Isomorphism in the Practice of Corporate Social Responsibility : Evidence of an Institution and its Decline (2009.10; Working Paper Series).
Borsboom, D., & Mellenbergh, G. J. (2004). The Concept of Validity. November. https://doi.org/10.1037/0033-295X.111.4.1061
Bös, Bernhard, Dauber, D., & Springnagel, M. (2011). Measuring organizational culture: An empirical assessment of the Hofstede questionnaire in an Austrian setting Submission to IACCM 2011, at Ruse, Bulgaria. International Association for Contract & Commercial Management, 1985.
Bouckenooghe, D., Zafar, A., & Raja, U. (2015). How Ethical Leadership Shapes Employees’ Job Performance: The Mediating Roles of Goal Congruence and Psychological Capital. Journal of Business Ethics, 129(2), 251–264. https://doi.org/10.1007/s10551-014-2162-3
Bowra, Z. A., Sharif, B., Saeed, A., & Niazi, M. K. (2012). Impact of human resource practices on employee perceived performance in banking sector of Pakistan. African Journal of Business Management, 6(1). https://doi.org/10.5897/ajbm11.2312
Box, S. (1983). Power, Crime and Mystification. Tavistock Publications.
Bredeson, D. (2012). Applied Business Ethics: A Skills-Based Approach (1st (ed.)). South-Western Cengage Learning.
Brewer, E. W., & Clippard, L. F. (2002). Burnout and job satisfaction among student support ser- vices personnel. Human Resource Development Quarterly, 13.
Brooks-Bartlett, J. (2018). Probability concepts explained: Maximum likelihood estimation. https://towardsdatascience.com/probability-concepts-explained-maximum-likelihood-estimation-c7b4342fdbb1

425
Brower, H. H., & Shrader, C. B. (2000). Moral reasoning and ethical climate, Not-for-profit vs. for-profit boards of directors. Journal of Business Ethics, 26, 147–167.
Brown, A. (1995). Organizational culture (2nd ed.). Pitman Publishing.
Brown, J. E. (2002). The Cronbach alpha reliability estimate. Shiken: JALT Testing & Evaluation SIG Newslette, 6(1), 17–18.
Brown, M. E. (2007). Misconceptions of ethical leadership: How to avoid potential pitfalls. Organizational Dynamics, 36, 140–155. https://doi.org/doi:10.1016/j.orgdyn.2007.03.003
Brown, M. E., Trevino, L. K., & Harrison, D. A. (2005). Ethical leadership: A social learning perspective for construct development and testing. Organizational Behavior and Human Decision Processes, 97(2), 117–134. https://doi.org/10.1016/j.obhdp.2005.03.002.
Brown, S., & Leigh, T. W. (1996). A new look at psychological climate and its relationship to job involvement, effort, and performance. Journal of Applied Psychology, 81, 358–368.
Bryman, A. (1992). Charisma and leadership in organizations. Sage.
Bums, J. M. (1978). Leadership. Harper & Row.
Burchill, G., & Hepner Brodie, C. (2005). Voices into choice: Acting on the Voice of the Customer (Oriel Inc (ed.)). Center for Quality Management.
Burke, W. (1982). Organization Development: Principles and Practices. Little, Brown and Company.
Burns, J. M. (1978). Leadership. Harper & Row.
Business Publications Ltd. (2017). The Top 100 Companies 2017 - Mauritius. Business Magazine, La Sentinelle.
Business Publications Ltd. (2018). The Top 100 Companies 2018 - Mauritius. Business Magazine, La Sentinelle.
BusinessDictionary. (2018). National Culture. WebFinance Inc. http://www.businessdictionary.com/definition/national-culture.html
Cambridge Dictionary. (2018). Organisation - Meaning in the Cambridge English Dictionary. Cambridge Dictionary; Cambridge University Press. https://dictionary.cambridge.org/dictionary/english/organization
Cameron, K. S., & Quinn, R. E. (2006). Diagnosing and Changing Organizational Culture - Based on the Competitive Values Framework (Revised Ed). Jossey-Bass.
Campbell, D. T., & Stanley, J. C. (1966). Experimental and quasi designs for research. Rand McNally.
Campbell, J. P., Dunnette, M. D., Lawler, E. E., & Weick, K. E. (1970). Managerial behavior, performance, and effectiveness. McGraw Hill.

426
Carl, D., Gupta, V., & Javidan, M. (2004). Power distance.
Carr-Hill, & Roy, A. (1984). Radicalising survey methodology. Quantity and Quality.
Carroll, A., Brown, J., & Buchholtz, A. (2016). Business & society: ethics and stakeholder management (10th ed.). Cengage Learning.
Carson, J. B., Tesluk, P. E., & Marrone, J. A. (2007). Shared leadership in teams: an investigation of antecedent conditions and performance. Academy of Management Journal.
Carvalho, A. M., Sampaio, P., Rebentisch, E., Carvalho, J. Á., & Saraiva, P. (2017). Operational excellence, organisational culture and agility: the missing link? Total Quality Management and Business Excellence, 3363, 1–20. https://doi.org/10.1080/14783363.2017.1374833
Caughron, J. J., Antes, A. L., Stenmark, C. K., Thiel, C. E., Wang, X., Mumford, M. D., Caughron, J. J., Antes, A. L., Stenmark, C. K., Thiel, C. E., Wang, X., Mumford, M. D., Strategies, S., Making, D., & Caughron, J. J. (2011). Sensemaking Strategies for Ethical Decision Making Sensemaking Strategies for Ethical Decision Making. 8422. https://doi.org/10.1080/10508422.2011.604293
Çelİk, S., Dedeoğlu, B. B., & İnanir, A. (2015). Relationship Between Ethical Leadership , Organizational Commitment and Job Satisfaction at Hotel Organizations. Ege Academic Review, 15(1), 53–63.
Chakraborty, S. K. (1997). Business ethics in India. Journal of Business Ethics, 16(14), 1529–38.
Chambers, J. M., Cleveland, W. S., Kleiner, B., & Tukey, P. . (1983). Graphical Methods for Data Analysis. Duxbury Press.
Chan-Meetoo, C. (2013). Ethical Journalism & Gender-Sensitive Reporting (Issue March).
Chan, K. C., Fung, H. G., & Yau, J. (2010). Business Ethics Research: A Global Perspective. Journal of Business Ethics, 95(1), 39–53. https://doi.org/10.1007/s10551-009-0346-z
Chang, S., & Lee, M. S. (2007). The effects of organizational culture and knowledge management mechanisms on organizational innovation: An empirical study in Taiwan. The Business Review.
Charles, H., & Harrison, R. (2010). Understanding Organisations.
Chatman, J. A., & Barsade, S. G. (1995). Personality, organizational culture, and cooperation: Evidence from a business simulation. Administrative Science Quarterly, 40.
Chatterjee, S., & Pearson, C. (2003). Ethical perceptions of Asian managers: evidence of trends in six divergent national contexts. Business Ethics: A European Review, 12(2), 203–211.

427
Cheung, C., & Chan, C. (2005). Philosophical foundations of eminent Hong Kong Chinese CEOs’ leadership. Journal of Business Ethics, 60.
Chia, A., & Mee, L. (2000). The effects of issue characteristics on the recognition of moral Issues. Journal of Business Ethics, 27, 255–269.
Child, D. (2006). The Essentials of Factor Analysis (3rd (ed.)). Bloomsbury Academic Press.
Chonko, L. (1995). Ethical decision making in marketing. Sage.
Chung, K., Eichenseher, J., & Taniguchi, T. (2008). Ethical perceptions of business students: differences between East Asia and the USA and among ‘Confucian’ cultures. Journal of Business Ethics, 79.
Cicero, M. T., (1812). Tusculanes de Ciceron (J. Bouhier et D'Olivet, Trans.).Nisme: Gaude, J. (Original work published ca. 45 B.C.E)
Ciro, T. (2012). The Global Financial Crisis: Triggers, Responses and Aftermath. Routledge.
Ciulla, J. B. (2005). The state of leadership ethics and the work that lies before us. Business Ethics: A European Review, 14(4), 323–335.
Ciulla, J. B. (2014). Ethics, the heart of leadership (3rd ed.). Praeger.
Clark, M. S., & Mills, J. R. (2011). A theory of communal (and exchange) relationships. In P. A. M. Van Lange, A. W. Kruglanski, & E. T. Higgins (Eds.), Handbook of theories in social psychology Handbook of theories in social psychology. Sage.
CMMI Institute LLC. (2018). What is CMMI? The answer depends on you. http://cmmiinstitute.com/what-is-cmmi
Cohen, J. (1988). Statistical Power Analysis for the Behavioral Science (Routledge (ed.); 2nd ed.). Lawrence Erlbaum Associates, Inc.
Cohen, J. (1992). A power primer. Psychological Bulletin, 112(1), 155–159. https://doi.org/https://doi.org/10.1037/0033-2909.112.1.155
Cohen, L., Manion, L., & Morrison, K. (2011). Research methods in education. Routledge.
Collins, W. A., Maccoby, E. E., Steinberg, L., Hetherington, E. M., & Bornstein, M. H. (2000). Contemporary research on parenting: The case for nature and nurture. American Psychologist, 55.
Colvin, G. (2006). What Makes GE Great? Fortune. http://fortune.com/2006/02/24/what-makes-ge-great/
Competition Competition of Mauritius. (2018). Competition Competition of Mauritius - Our Role. http://www.ccm.mu/English/AboutUs/Pages/ourrole.aspx
Conger, J. A., & Kanungo, R. N. (1988). Charismatic leadership: The elusive factor in organizational effertiveness. Jossey-Bass.

428
Conroy, S. J., & Emerson, T. L. N. (2004). Business Ethics and Religion: Religiosity as a Predictor of Ethical Awareness among Students. Journal of Business Ethics, 50(4).
Coogan, M. (2014). The Ten Commandments: A Short History of an Ancient Text. Yale University Press.
Cooke, R. A., & Rousseau, D. M. (1988). A quantitative approach to the assessment of organisational culture. Group and Organization Studies.
Cooke, R. A., & Szumal, J. L. (2013). Using the Organizational Culture Inventory ® to Understand the Operating Cultures of Organizations Using the Organizational Culture Cultures of Organizations. Handbook of Organizational Culture & Climate.
Cooper, D. R., & Schindler, P. S. (2014). Business Research Methods (12th ed.). Mc Graw Hill Education.
Corder, G. W., & Foreman, D. I. (2009). Nonparametric Statistics for Non-Statisticians: A Step-by-Step Approach. John Wiley & Sons Inc.
Corley, M. C., Elswick, R. K., Gorman, M., & T., C. (2001). Development and evaluation of a moral distress scale. Journal of Advanced Nursing, 33(2), 250–256.
Corporate Leadership Council. (2009). Employee engagement survey and analysis tool (ESAT).
Cottone, R., & Claus, R. E. (2000). Ethical decision-making models: A review of the literature. Journal of Counseling & Development, 78, 275–283.
Craig, S. B., & Custafson, S. B. (1998). Perceived leader integrity scale: An instrument for assessing employee perceptions ofleader integrity. Leadership Quarterly, 9, 127–145.
Crane, A., & Matten, D. (2004). Business ethics: a European perspective. Oxford University Press.
Crosby, P. B. (1979). Quality is free – the art of making quality certain. McGraw-Hill.
Cullen, J. B., Victor, B., & Bronson, J. W. (1993). The ethical climate questionnaire: an assessment of it’s development and validity. Psychological Reports, 73, 667–674.
Cullen, John B, Victor, B., & Bronson, J. W. (1993). Ethical Climate Questionnaire: An Assesment of its Development and Validity. Psychological Reports, 73, 667–674. https://doi.org/10.2466/pr0.1993.73.2.667
Cullia, J. B. (2005). The state of leadership ethics and the work that lies before us. A European Review, 14(4), 323–335.
Cunliffe, A. L. (2009). The philosopher leader: On relationalism, ethics and reflexivity—A critical perspective to teaching leadership. Management Learning, 40(1), 87–101.

429
Dahlgaard-Park, S. M., & Dahlgaard, J. J. (2010). Organizational learnability and innovability: A system for assessing, diagnosing and improving innovations. International Journal of Quality and Service Sciences, 2(2), 153–174.
Daniels, A. C. (2010). Oops! 13 Management Practices That Waste Time and Money (and what to do instead). NACE Journal, 70(3), 16. http://search.proquest.com.ezp.lib.unimelb.edu.au/docview/197915004?accountid=12372%5Cnhttp://sfx.unimelb.hosted.exlibrisgroup.com/sfxlcl41?url_ver=Z39.88-2004&rft_val_fmt=info:ofi/fmt:kev:mtx:journal&genre=unknown&sid=ProQ:ProQ%3Aeducation&atitle=Oops%21
Das, R. K., & Imon, R. A. H. M. (2016). A Brief Review of Tests for Normality. American Journal of Theoretical and Applied Statistics, 5(1), 5. https://doi.org/10.11648/j.ajtas.20160501.12
Davis, M. A., Johnson, N. B., & Ohmer, D. G. (1998). Issue-contingent effects on ethical decision making: a cross-cultural comparison. Journal of Business Ethics, 17(4), 373–389.
Deci, E. L., & Ryan, R. M. (2000). The what and why of goal pursuits: Human needs and the self- determination of behavior. Psychological Inquiry, 11(4).
Deconinck, J. B., Deconinck, M. B., & Moss, H. K. (2016). The Relationship Among Ethical Leadership , Ethical Climate , Supervisory Trust , and Moral Judgment. Academy of Marketing Studies Journal, 20(3), 89–100.
Decoster, J., & Hall, G. P. (1998). Overview of Factor Analysis. Journal of Business Administration and Education, 37(January 1998), 141. https://doi.org/10.2307/2685875
Delaney, J. T., & Huselid, M. A. (1996). The Impact of human resource management practices on perceptions of organizational performance. The Academy of Management Journal, 39(4), 949–969. https://doi.org/10.5465/256718
Deming, W. E. (1986). Out of the crisis. MIT Press.
Denison, D. R. (1990). Corporate Culture and Organisational Effectiveness. Wiley.
Denison, D. R., Haaland, S., & Goelzer, P. (1991). Corporate Culture and Organizational Effectiveness. The Academy of Management Review, 16(1), 203. https://doi.org/10.2307/258613
Denison, D. R., & Mishra, A. (1995). Toward a Theory of Organizational Culture and Effectiveness. Organizational Science, 6(2), 147–239.
Detert, J. R., Treviño, L. K., Burris, E. R., & Andiappan, M. (2007). Managerial modes of influence and couterproductivity in organizations: A longitudinal business unit-level investigation. Journal of Applied Psychology, 92, 993–1005.
Dewe, P., Cox, T., & Michael Leiter. (2003). Coping, Health and Organizations (Series Edi). Taylor & Francis.
Dharmasiri, G. (1992). Fundamentals of Buddist Ethics. Golden Leaves.

430
Dierksmeier, C. (2011). Solomon on the Role of Virtue Ethics in Business. In Humanistic Ethics in the Age of Globaility (pp. 187–188). Macmillan Publishers Limited.
Dimaggio, P. J., & Powell, W. W. (1983). The iron cage revisited: Institutional isomorphism and collective rationality in organizational fields. American Sociological Review, 48(2), 147–160.
Dion, M. (2012). Are ethical theories relevant for ethical leadership? Leadership & Organization Development Journal, 33(1), 4–24. https://doi.org/10.1108/01437731211193098
Douglas, P. C., Davidson, R. A., & Schwartz, B. N. (2001). The effect of organizational culture and ethical orientation on accountants’ ethical judgments. Journal of Business Ethics, 34, 101–121.
Duignan, P. A., & Bhindi, N. (1997). Authenticity in leadership: an emerging perspective. Journal of Educational Administration, 35(3).
Duquette, D. J., & Stowe, A. M. (1993). A performance measurement model for the office of inspector general. The Government Accountants Journal, 42(2), 27.
Durkheim, E. (1895). The Rules of Sociological Method (W. D. Halls & S. Lukes (eds.)). The Free Press.
Durkheim, E. (1897). Suicide : a study in sociology. The Free Press.
Economic Development Board Mauritius. (2018a). Financial Technology (FinTech).
Economic Development Board Mauritius. (2018b). Ocean Economy. http://www.investmauritius.com/investment-opportunities/ocean-economy.aspx
Economic Development Board Mauritius. (2021). Economic Development Board: Why Mauritius. https://www.edbmauritius.org/why-mauritius
Edinger‐Schons, L. M., Lengler‐Graiff, L., Scheidler, S., Mende, G., & Wieseke, J. (2019). Listen to the voice of the customer—First steps towards stakeholder democracy. Business Ethics: A European Review, 29, 510–527. https://doi.org/https://doi.org/10.1111/beer.12252
Edmondson, A. C. (2012). Teaming: How organisations learn, innovate, and compete in the knowledge economy (Jossey-Bass (ed.)).
Edmondson, D. R. (2005). Likert scales: A history. In CHARM (Vol. 12).
EFQM. (2018). European Foundation for Quality Management. http://www.efqm.org/efqm-model/what-is-excellence
Elçi, E., Sener, I., & Alpkan, L. (2013). The impacts of ethical leadership on the antisocial behavior of employees: the mediating role of ethical climate. Journal of Global Strategic Management, 7(2), 57–66.
Eliot, L. (2009). Brain, Blue Brain: How Small Differences Grow into Troublesome Gaps - and What we Can do About it. Mariner Book.
431
Ellis, P. D. (2010). The Essential Guide to Effect Sizes: Statistical Power, Meta-Analysis, and the Interpretation of Research Results. Cambridge University Press.
Engelbrecht, A. S., Wolmarans, J., & Mahembe, B. (2017). Effect of Ethical Leadership and Climate on Effectiveness. SA Journal of Human Resource Management, 15(March), 1–9. https://doi.org/10.4102/sajhrm.v15i0.781
English, S. (2004). Citigroup pays $2.6 billion in WorldCom suit. The Telegraph, May 10.
Ernst, C., Ferrer, A. H., & Zult, D. (2005). The end of the Multi-Fibre Arrangement and its implication for trade and employment The end of the Multi-Fibre Arrangement and its implication for trade and.
ESOMAR. (2020). ESOMAR. https://ana.esomar.org/documents/classification-of-respondents-by-socio-economic-characteristics#
Ethics & Compliance Initiative. (2020). The State of Ethics & Compliance in the Workplace: A Look at Global Trends.
Ethics & Compliance Initiative. (2016). Global Business Ethics Survey TM - Measuring Risk and Promoting Workplace Integrity.
Ethics & Compliance Initiative. (2018a). 2018 Global Benchmark on Workplace Ethics. http://www.ethics.org/research/globalbenchmark
Ethics & Compliance Initiative. (2018b). Measuring the Impact of Ethics & Compliance Programs - Global Business Ethics Survey (Issue June).
Ethics & Compliance Initiative. (2018c). The State of Ethics & Compliance in the Workplace - Global Business Ethics Survey (Issue March).
Ethics Resource Centre. (2012). National business ethics survey ® of fortune 500 ® employees: An Investigation into the State of Ethics at America’s Most Powerful Companies.
Ettlinger, N. (1997). An Assessment of the Small-Firm Debate in the United States. Environment & Planning.
Evan, W. M. (1968). A systems model of organizational climate. Organisational Climate: Explorations of a Concept, Harvard Univesity, 105–124.
Evans, J. (2010). Organizational learning for performance excellence: A study of Branch-Smith Printing Division. Total Quality Management and Business Excellence, 21(3), 225–243.
Evans, J. R., & Jack, E. P. (2003). Validating key results linkages in the Baldrige performance excellence model. The Quality Management Journal.
Falkenberg, L., & Herrenans, I. (1995). Ethical behaviors in organizations directed by the formal or informal systems. Journal of Business Ethics, 14, 133–143.

432
Ferraro, G. (1998). The Cultural Dimension of International Business (3rd ed.). Prentice Hall.
Ferrell, O. C., & Fraedrich, J. (1991). Business ethics: Ethical decision making and cases. Houghton Mifflin College Division.
Fey, C. F., & Denison, D. R. (2003). Organizational culture and effectiveness: can American theory be applied in Russia? Organization Science, 14(6), 615–758.
Fiedler, F. E. (1967). A theory of leadership effectiveness. McGraw-Hil.
Field, A. J. (1979). On the Explanation of Rules using Rational Choice Models. Journal of Economic Issues, 13, 49–72.
Financial Reporting Council. (2018). Code of Ethics. http://frc.govmu.org/English/Pages/pgs/Code-of-Ethics.aspx
Financial Services Commission. (2018). Financial Services Commission - Who we are. https://www.fscmauritius.org/en/about-us/who-we-are
Flamholz, E. G. (1990). Pains: How to Make the Transition from an Entrepreneurship to a Professionally Managed Firm. Jossey-Bass.
Flynn, E. P. (2012). Ethical Lessons of the Financial Crisis. Routledge.
Ford, J. (2006). Discourses of Leadership: Gender, identity and contradiction in a UK public sector organisation. Leadership.
Foreign Affairs. (2017). Mauritius Vision 2030. Innovative and Globally Competitive (Issue February).
Forsyth, D. R. (1980). A Taxonomy of Ethical Ideologies. Journal of Personality and Social Psychology, 39, 175–184.
Frankena, W. K. (1973). Ethics. Prentice-Hall Inc.
Freedman, D. A. (2005). Statistical Models: Theory and Practice. Cambridge University Press.
Frey, B. (2000). The impact of moral intensity on decision making in a business context. Journal of Business Ethics, 26, 181–195.
Fritzsche, D., & Becker, H. (1983). Ethical behavior of marketing managers. Journal of Business Ethics, 2, 291–299.
FTSE Russell. (2019). Industry Classification Benchmark (ICB). FTSE International Limited, December.
Gagné, M., Sharma, P., & De Massis, A. (2014). The study of organizational behaviour in family business. European Journal of Work and Organizational Psychology, 23(5), 643–656. https://doi.org/10.1080/1359432X.2014.906403
Galit, S. (2016). This Is What the Most Successful Entrepreneurs Focus on. Fortune. http://fortune.com/2016/05/29/corporate-culture-success-entrepreneurs/

433
Gao, Y. (2017). Business leaders’ personal values, organisational culture and market orientation. Journal of Strategic Marketing, 25(1), 49–64. https://doi.org/10.1080/0965254X.2015.1076879
Gautschi, F. H., & Jones, T. M. (1998). Enhancing the Ability of Business Students to Recognize Ethical Issues: An Empirical Assessment of the Effectiveness of a Course in Business Ethics. Journal of Business Ethics, 17(2), 205–216.
Gavin, J. R., & Howe, J. G. (1975). Psychological climate: some theoretical and empirical considerations. Behavioral Science, 20, 228–240.
Ghemawat, P., & Reiche, S. (2008). National Cultural Differences and Multinational Business. Globalisation Note Series.
Ghobadian, A., & Gallear, D. (1997). TQM and Organization Size. International Journal of Operations & Production Management, 17, 121–163.
Gibson, C. B., & Birkinshaw, J. (2004). The antecedents, consequences, and mediating role of organizational ambidexterity. Academy of Management Journal, 47.
Gilligan, C. (1977). In a Different Voice : Women’s Conceptions of Self and of Morality. Harvard Educational Review, 47(1972), 481–517. https://doi.org/10.1088/0953-8984/18/49/004
Glaser, S. R., Zamanou, S., & Hacker, K. (1987). Measuring and interpreting organizational culture. Management Communication Quarterly, 1(2), 173–198. https://doi.org/10.1177/0893318987001002003
Glen, S. (2020). StatisticsHowTo.com - Large Enough Sample Condition. https://www.statisticshowto.com/large-enough-sample-condition/
Glick, W. H. (1985). Conceptualizing and measuring organizational and psychological climate: pitfalls in multilevel research. Academy of Management Review, 10, 601–616.
Gogtay, N. J., & Thatte, U. M. (2017). Principles of correlation analysis. Journal of Association of Physicians of India, 65(MARCH), 78–81.
Gouldner, A. W. (1957). Cosmopolitans and locals, Toward an analysis of latent social roles. Administrative Science Quarterly, 2, 281–306.
Gouldner, A. W. (1960). The norm of reciprocity: A preliminary statement. American Sociological Review, 25, 161–178.
Government of Mauritius. (2004). A Roadmap For The Mauritius Sugarcane Industry For The 21st Century. 1–15.
Gray, J. H., Densten, I. L., & Sarros, J. C. (2003). Size Matters: Organisational Culture in Small, Medium, and Large Australian Organisations. Journal of Small Business & Entrepreneurship, 17(1), 31–46. https://doi.org/10.1080/08276331.2003.10593311

434
Green, S., Hassan, F., Immelt, J., Marks, M., & Meiland, D. (2003). In search of global leaders. Harvard Businsess Review, August.
Gregory, J. R. (2007). Psychological testing: History, principles and applications (5th Editio). Pearson Education.
Griffeth, R. W., Hom, P. W., Denisi, A., & Kirchner, W. (2017). A multivariate, multinational comparison of managerial attitude. Academy of Management, 1980(1).
Griffin, A., & Hauser, J. R. (1993). The voice of the customer. Marketing Science, 12(3), 1–27.
Grint, B. (2011). A history of leadership. In The SAGE handbook of leadership. Sage.
Grobler, A. (2016). An adapted measure of ethical climate in organisations – a South African study. 11(1), 1–21.
Grobler, A., & Grobler, S. (2016). Conceptualisation of organisational ethics through the validation of a measurement mode, adopting a MESO approach.
Gunther, M. (2004). Money and Morals at GE. Fortune. https://money.cnn.com/magazines/fortune/fortune_archive/2004/11/15/8191077/index.htm
Habermas, J. (1992). De l’e’thique de la discussion. Cerf.
Haeckel, S. (1999). Adaptive Enterprise: Creating and Lead- ing Sense-And-Respond Organizations. Harvard Business Press.
Hair, J. F., Sarstedt, M., Ringle, C. M., & Mena, J. A. (2012). An assessment of the use of partial least squares structural equation modeling in marketing research. Journal of the Academy of Marketing Science, 40(3), 414–433. https://doi.org/10.1007/s11747-011-0261-6
Hair, Joseph F., Black, W. C., Babin, B. J., & Anderson, R. E. (2014). Multivariate Data Analysis (MVDA). In Pharmaceutical Quality by Design: A Practical Approach (7th Editio). Pearson Education Limited. https://doi.org/10.1002/9781118895238.ch8
Haire, M., Ghiseli, E. E., & Porter, L. W. (1966). Managerial Thinking: An International Study. Wiley.
Hall, E. T. (1976). How cultures collide. Psychology Today, 10(2), 66–74.
Hammersley, M. (2013). What is Qualitative Research? Bloomsburry.
Hannah, S., & Avolio, B. (2010). Moral Potency: Building the Capacity for character-based leadership. Consulting Psychology Journal: Practice and Research, 62(4), 291–310.
Hare, J. (2014). Religion and Morality. Standford Encyclopedia of Philosophy. https://plato.stanford.edu/entries/religion-morality/

435
Harrington, S. (1997). A test of a person issue contingent model of ethical decision making in Organizations. Journal of Business Ethics, 16, 363–375.
Harris, P. H., & Moran, R. T. (1979). Managing Cultural Difference. Gulf Publishing.
Harste, G. (1994). The definition of organisational culture and its historical origins, History of European Ideas. Elesevier Science Ltd, 19(1–3), 3–15. https://doi.org/10.1016/0191-6599(94)90191-0
Hartmann, A. (2006). The role of organizational culture in motivating innovative behaviour in con- struction firms. Construction Innovation, 6(3), 159–172.
Harvard University Press. (1926). Aristotle, Nicomachean Ethics (Loeb Class). Harvard University Press. https://doi.org/10.4159/DLCL.aristotle-nicomachean_ethics.1926
Hatch, M. J., & Schultz, M. (2004). Organisational Identity: A reader. Oxford University Press.
Hauser, R., & Paul, R. (2006). Is service quality and culture: An empirical investigation. Journal of Computer Information Systems, 47(1), 15–22.
Hayes, A. F. (2018). PROCESS Procedure for SPSS (3.4.1). www.afhayes.com
Helms, M. M., & Hutchins, B. A. (1992). Poor quality products: Is their production unethical‘? Management Decision, 30(5), 35–46.
Henson, R. K., & Roberts, J. K. (2006). Use of exploratory factor analysis in published research: Common errors and some comment on improved practice. Educational and Psychological Measurement, 66, 393–416.
Hernandez, L., & Blazer, D. (2006). Genes, Behaviour and the Social Environment: Moving beyond the Nature/Nurture Debate. The National Academies Press.
Hersey, P., & Blanchard, K. H. (1969). Life cycle theory of leadership. Training & Development Journal, 23, 26–34.
Hersey, P., & Blanchard, K. H. (1969b). Management of organisational behaviour: Utilising human resources. Prentice-Hall.
Hersey, P., & Blanchard, K. H. (1996). Great ideas revisited: Revisiting the life-cycle theory of leadership. Training & Development Journal, 50.
Hill, M., Glaser, K., & Harden, J. (1998). A feminist model for ethical decision making. Women & Therapy, 21, 101–121.
Hobbes, T. (1960). Leviathan, or the Matter, Form and Power of Commonwealth Ecclesiastical and Civil. Oxford.
Hofstede, G. (1976). Nationality and espoused values of managers. Journal of Applied Psychology, 61.
Hofstede, G. (1980). Culture’s Consequences: International Differences in Work-related Values. Sage.
436
Hofstede, G., Hofstede, G. J., & Minkov, M. (2010). The Dimensions of National Culture. Hofstede Insights. https://www.hofstede-insights.com/models/national-culture/
Hofstede, G. J. (2015). Culture’s causes: the next challenge. Cross Cultural Management: An International Journal, 22(4), 545–569. https://doi.org/10.1108/CCM-03-2015-0040
Hofstede, G., Neuijen, B., Ohayv, D. D., & Sanders, G. (1990). Measuring Organizational Cultures: A Qualitative and Quantitative Study across Twenty Cases. Administrative Science Quarterly, 35(2), 286–316.
Holbeche, L. (2015). The Agile Organisation: How to build an innovative, sustainable and resilient business. Kogan Page Limited.
Homans, G. C. (1958). Social Behavior as Exchange. American Journal of Sociology, 63(6), 597–606.
Homans, G. C. (1961). Social Behavior: Its Elementary Forms. Harcourt, Brace and World, Inc.
Hood, R. W., Spilka, B., Hunsberger, B., & Gorsuch, R. (1996). The Psychology of Religion: An Empirical Approach. Guildford Press.
Hooker, B. (2000). Ideal code, real world: A rule-consequentialist theory of morality. Oxford University Press.
Hoppe, M. H. (2011). Culture, leadership, and organizations: The GLOBE study of 62 societies. UNITAR E-Journal, 7(1), 1–6. https://doi.org/10.1177/0022022105278546
Houghton Mifflin Harcourt Publishing Company. (2005). The New Dictionary of Cultural Literacy (3rd ed.). Houghton Mifflin Harcourt Publishing Company.
House, R. J., Hanges, P. J., Javidan, M., Dorfman, P. W., & Gupta, V. (2004). Culture, leadership, and organizations: The GLOBE study of 62 societies. (Thousand Oaks (ed.)). Sage.
House, Robert J, & Mitchell, T. R. (1975). Path-Goal Theory of Leadership (Issue April). University of Washington.
Howell, J. M., & Avolio, B. J. (1992). The ethics of charismatic leadership: Submission or liberation. Academy of Management Executive, 6, 43–54.
Hu, T. L., & Bentler, P. M. (1999). Cutoff criteria for fit indices for covariance structure analysis: Conventional criteria versus new alternatives. Structural Equation Modelling. Structural Equation Modelling: A Multidisciplinary Journal, 6(1), 1–55. https://doi.org/https://doi.org/10.1080/10705519909540118
Huang, L., & Paterson, T. A. (2017). Group Ethical Voice. Journal of Management, 43(4), 1157–1184. https://doi.org/10.1177/0149206314546195

437
Huang, M. P., Cheng, B. S., & Chou, L. F. (2005). Fitting in organizational values: the mediating role of person-organization fit between CEO charismatic leadership and employee outcomes. International Journal of Manpower, 26(1), 35–49.
Huey Yiing, L., & Zaman Bin Ahmad, K. (2009). The moderating effects of organizational culture on the relationships between leadership behaviour and organizational commitment and between organizational commitment and job satisfaction and performance. Leadership and Organization Development Journal, 30(1), 53–86.
Huhtala, M., Feldt, T., Hyvönen, K., & Muano, S. (2013). Ethical organisational culture as a context for manager’s personal work goals. Journal of Business Ethics, 114, 265–282.
Huhtala, M., Feldt, T., Lämsä, A. M., Muano, S., & Kinnunen, V. (2011). Does ethical culture of organisations promote managers’ occupational well-being? Investigation indirect links via ethics strain. Journal of Business Ethics, 101, 231–247.
Human Synergetics International. (2017). What is the OCI? Organizational Culture Inventory ® (OCI ® ) The world’s most widely used culture survey accreditation required*. 2017–2018. https://www.humansynergistics.com/docs/default-source/default-document-library/oci_product_info_sheet_v3-1_np.pdf?sfvrsn=340c2345_4
Hume, D. (1983). An Enquiry Concerning the Principles of Morals. Hackett Publishing.
Humphrey, W. (1989). Managing the software process. Addison Wesley Professional.
Hunt, S. D., & Vitell, S. J. (1986). A general theory of marketing ethics. Journal of Macromarketing, 48, 30–42.
Hunt, S. D., Wood, V. R., & Chonko, L. B. (1989). Corporate ethical values and organizational commitment in marketing. Journal of Marketing, 53, 79–90.
Hwang, A., Francesco, A., & Kessler, E. (2003). The relationship between individualism- collectivism, face, and feedback and learning processes in Hong Kong, Singapore, and the United States. Journal of Cross-Cultural Psychology, 34.
IEG The World Bank. (2010). Climate Change and the World Bank Group IEG Study. The International Bank for Reconstruction and Development/Th e World Bank.
Iizuka, Y., & Kaneko, M. (2014). Quality management for sustained success – Its fundamental con- cepts and genuine quality management model. International Conference on Quality Proceedings.
Independent Commission Against Corruption. (2018). About the ICAC. https://www.icac.mu/about-the-icac/

438
Inglehart, R. (1997). Modernization and Post-Modernization: Cultural, Economic, and Political Change in 43 Societies. Princeton University Press.
Inglehart, Ronald, & Welze, C. (2005). Modernization, Cultural Change, and Democracy. Cambridge University Press. https://doi.org/10.1017/CBO9780511790881
Institute of Business Ethics. (2015). Ethics at Work: 2015 Survey of Employees Continental Europe. http://www.ibe.org.uk/userassets/publicationdownloads/ibe_survey_eaw15_europe.pdf
International Organization for Standardization. (2009). ISO 9004:2009 – managing for the sustained success of an organization – A quality management approach.
Ip, P.-K. (2003). Business ethics and a state-owned enterprise in China. Business Ethics: A European Review, 12(1), 64–77.
Irani, Z., Beskese, A., & Love, P. E. (2004). Total quality management and corporate culture: Constructs of organizational excellence. Technovation, 24(8), 643–650.
Islam, G. (2015). Social Identity Theory. Encyclopedia of Critical Psychology, August, 1781–1783. https://en.wikipedia.org/w/index.php?title=Social_identity_theory&oldid=665754002
Ismail Ababaneh, R. (2010). The role of organizational culture on practising quality improvement in Jordanian public hospitals. Leadership in Health Services, 23.
Itani, T. (2012). The Quran Translated to English. http://www.clearquran.com/downloads/quran-in-modern-english.pdf
Ivanhoe, P. J. (2005). Origins of Chinese ethics. In The Blackwell companion to religious ethics. Blackwell. https://doi.org/10.1002/9780470997031
Jackson, D. L., Gillaspy, J. A., & Purc-Stephenson, R. (2009). Reporting Practices in Confirmatory Factor Analysis: An Overview and Some Recommendations. Psychological Methods, 14(1), 6–23. https://doi.org/10.1037/a0014694
Jackson, T. (2001). Cultural values and management ethics: a 10-nation study. Human Relations, 54(10), 1267–1302.
James, L. A., & James, L. R. (1989). Integrating work environment perceptions, explorations into the measurement of meaning. Journal of Applied Psychology, 74, 739–751.
Jamnik, A. (2017). The Challenges of Business Ethics: The Basic Principles of Business Ethics - Ethical Codex in Business. 85–99.
Jensen, S. M., & Luthans, F. (2006). Entrepreneurs as authentic leaders: impact on employees’ attitudes. Leadership & Organization Development Journal, 27.
Jeurissen, R. (1997). Integrating micro, meso and macro levels in business ethics. Ethical Perspectives, 4(2).
439
Jones, T. M. (1991). Ethical decision making by individuals in organizations: An issue-contingent model. Academy of Management Review, 16(2), 366–395.
Joseph, E. E., & Winston, B. E. (2005). A correlation of servant leadership, leader trust, and organizational trust. Leadership & Organization Development Journal, 26(1), 6–22.
Joyce, W. F., & Slocum, J. W. (1979). Climates in organizations. In Organizational behavior and human performance (pp. 317–333).
Julien, P. (1995). New Technologies and Technological Information in Small Business. Journal of Business Venturing, 10.
Kahn, L. (2012). Rule consequentialism and scope. Ethical Theory and Moral Practice, 15, 631–646.
Kaiser, H. F. (1974). An index of factorial simplicity. Psychometrika, 39, 31–36.
Kalshoven, K., Den Hartog, D. N., & De Hoogh, A. H. B. (2011). Ethical leadership at work questionnaire (ELW): Development and validation of a multidimensional measure. The Leadership Quarterly, 22, 51–69. https://doi.org/10.1016/j.leaqua.2010.12.007
Kant, I. (1959). Foundations of the Metaphysics of Morals. Bobbs-Merrill/Library of Liberal Arts.
Kant, I. (1914). The Critique of Judgement (J. H. Bernard, Trans.).London: Macmillan. (Original work published in 1790)
Kantar Group and Affiliates. (2019). Kantar Global. https://www.kantar.com/
Kantar TNS. (2019). Kantar Indian Ocean. https://kantartns.io/
Kanungo, R. N. (2001). Ethical values of transactional and transformational leaders. Canadian Journal of Administrative Sciences, 18.
Kanungo, R. N., & Mendonca, M. (1996). Ethical dimensions of leadership. Sage.
Kaplan, R. S., & Norton, D. P. (2001). The strategy-focused organization: How balanced scorecard companies thrive in the new business environment. Harvard Business School Press.
Kaptein, M. (2008a). Developing and testing a measure for the ethical culture of organizations: The corporate ethical virtues model. Journal of Organizational Behavior, 29(7), 923–947. https://doi.org/10.1002/job.520
Kaptein, M. (2008b). The Relationship between Ethical Culture and Unethical Behavior in Work Groups : Testing the Corporate Ethical Virtues Model Muel Kaptein. SSRN, ERS-2008-037-ORG. https://ssrn.com/abstract=1743316
Kaptein, M. (2009). Ethics programs and ethical culture: A next step in unravelling their multifaceted relationship. Journal of Business Ethics, 89(2), 261–281.

440
Kaptein, Muel. (2011). Understanding unethical behavior by unraveling ethical culture. Human Relations, 64(6), 843–869. https://doi.org/10.1177/0018726710390536
Kelman, H. C., & Hamilton, V. L. (1989). Crimes of obedience: Towards a social psychology of authority and responsibility. Yale University Press.
Kerr, S., & Jermier, J. (1978). Substitutes for leadership: Their meaning and measurement. Organizarional Behavior and Human Perjorrnance, 22, 374–403.
Khavari, K. A., & Harmon, T. M. (1982). The Relationship between the Degree of Professed Religious Belief and Use of Drugs. International Journal of the Addictions, 17.
Khokhar, A. R., & Rehman, M. Z. (2017). Linking Ethical Leadership to Employees ’ Performance : Mediating Role of Organizational Citizenship Behavior and Counterproductive Work Behavior. 11(1), 321–350.
Kidwell, J. M., Stevens, R. E., & Bethke, A. L. (1987). Differences in the Ethical Perceptions Between Male and Female Managers: Myth or Reality? Journal of Business Ethics, 6, 489–493.
King James. (1611). The Holy Bible (King James (ed.); King James).
Kirkcaldy, B., & Furnham, A. (1993). Predictors of beliefs about money. Psychological Reports, 73(3), 1079–1082.
Klontz, B., Britt, S. L., Mentzer, J., & Klontz, T. (2011). Money Beliefs and Financial Behaviors: Development of the Klontz Money Script Inventory. Journal of Financial Therapy, 2(1), 1–22. https://doi.org/10.4148/jft.v2i1.451
Knights, D., & O’Leary, M. (2006). Leadership, ethics and responsibility to the other. Journal of Business Ethics, 67(2).
Koehn, D. (2001). Confucian trustworthiness and the practice of business in China. Business Ethics Quarterly, 11(3).
Kohlberg, L. (1981). The Philosophy of Moral Development. Harper & Row.
Konovsky, M. A., & Pugh, S. D. (1994). Citizenship behavior and social exchange. Academy of Management Journal, 37(3), 656–669.
Koopman, P., Den Hartog, D. N., Konrad, E., & et al. (1999). National Culture and Leadership Profiles in Europe: Some Results From the GLOBE Study. European Journal of Work and Organizational Psychology, 8(4), 503–520. https://doi.org/10.1080/135943299398131
Kotlar, J., & De Massis, A. (2013). Goal setting in family firms: Goal diversity, social interactions, and collective commitment to family- centered goals. Entrepreneurship Theory and Practice.
Kottak, C. P. (2013). Anthropology: Appreciating Human Diversity (15th ed.). Mc Graw Hill International Edition.

441
Kotter, J. P., & Heskett, J. L. (1992). Corporate culture and performance. Free Press.
KPMG. (2005). The US integrity survey.
Kraft, R. J. (1998). Utilizing self-managing teams: Effective behavior of team leaders. Garland Publishing Inc.
Kuo, T., & Tsai, G. Y. (2017). The effects of employee perceived organisational culture on performance: the moderating effects of management maturity. Total Quality Management & Business Excellence, 3363, 1–17. https://doi.org/10.1080/14783363.2017.1302327
Kurtines, W. M. (1986). Moral behavior as rule governed behavior: Person and situation effects on moral decision making. Journal of Personality and Social Psychology, 50, 784–791.
La Porta, R., Lopez-de-Slianze, F., & Shleifer, A. (1999). Corporate Ownership around the World Corporate Ownership Around the World. 54(2), 471–517.
Lacewing, M. (n.d.). Kant’s deontological ethics. Routledge.
Lambert, E., & Hogan, N. (2013). Organisational Citizenship Behaviour Scales.
Lasakova, A., & Remisova, A. (2017). On Organisational Factors that Elicit Managerial Unethical Decision-Making. Ekonomicky Casopis, 65(4), 334–354.
Lashinsky, A. (2011). How Apple Works: Inside the World’s Biggest Startup. Fortune. http://fortune.com/2011/05/09/inside-apple/
Lau, C., & Ngo, H. Y. (2004). The HR system, organizational culture, and product innovation. International Business Review.
Lavelle, J. J. (2010). What motivates OCB? Insights from the volunteerism literature. Journal of Organizational Behavior, 31, 918–923. https://doi.org/10.1002/job.644.
Lawler, E. E., Hall, D. T., & Oldham, G. R. (1974). Organizational climate: relationship to organizational structure, process and performance. Organizational Behavior and Performance, 11, 139–155.
Lawton, A., & Páez, I. (2015). Developing a Framework for Ethical Leadership. Journal of Business Ethics, 130(3), 639–649. https://doi.org/10.1007/s10551-014-2244-2
Lee-Davies, L., Kakabadse, N. K., & Kakabadse, A. (2007). Shared leadership: leading through polylogue. Business Strategy Series, 8.
Lee, O. K., Sambamurthy, V., Lim, K. H., & Wei, K. K. (2015). How does IT ambidexterity impact organizational agility? Information Systems Research, 26.
Lee, Y., & Chao, L. (2011). Alibaba.com CEO resigns in wake of fraud by sellers. Wall Street Journal, Online Edition, February 21.
Leedy, D. P., & Ormrod, E. J. (2010). Practical research: Planning and design (9th Edition (ed.)). Pearson Education International.

442
Leiter, M. P., & Maslach, C. (2003). Areas of Worklife: a Structured Approach To Organizational Predictors of Job Burnout. Research in Occupational Stress and Well Being, 3(03), 91–134. https://doi.org/10.1016/S1479-3555(03)03003-8
Leithwood, K., Jantzi, D., & Steinbach, R. (1999). Changing Leadership for Changing Times. Open University Press.
Leroy, H., Palanski, M., & Simons, T. (2012). Authentic Leadership and Behavioral Integrity as Drivers of Follower Commitment and Performance. Ournal of Business Ethics, 107.
Levinson, H. (1976). Appraisal of What Performance? Harvard Businsess Review. https://hbr.org/1976/07/appraisal-of-what-performance
Lewin, K. (1951). Field theory in social science. Harper and Row.
Lewin, K., Lippitt, R., & White, R. K. (1939). Patterns of aggressive behaviour in experimentally created social climates. Journal of Social Psychology, 10, 271–299.
Lewis, P. V. (1985). Defining ‘business ethics’: Like nailing jello to a wall. Journal of Business Ethics, 4, 377–383.
Li, B. (2012). From a Micro-Macro Framework to a Micro-Meso-Macro Framework (S. H. Christensen, C. Mitcham, B. Li, & Y. An (eds.)). Springer, Philosophy of Engineering and Technology Series. https://doi.org/10.1007/978-94-007-5282-5_2
Li, W., Ardichvili, A., Maurer, M., Wentling, T., & Stuedemann, R. (2007). Impact of Chinese Culture values on knowledge sharing through online communities of practice. International Journal of Knowledge Management, 3.
Lichts, F. O. (2004). A Roadmap For The Mauritius Sugarcane Industry. 1–15.
Lickona, T. (1976). Moral Development and Behavior: Theory, Research and Social Issues. Holt, Rinehart and Winston.
Liker, J. (2004). The Toyota way: 14 management principles from the world’s greatest manufacturer. McGraw-Hill.
Lincoln, S. H, & Holmes, E. K. (2008). A Need to Know: An Ethical Decision-Making Model for Research Administrators. The Journal of Research Administration, 39(1), 41–47. https://doi.org/10.1002/jhbs.20425
Lincoln, Sarah Hope, & Holmes, E. K. (2011). Articles Ethical Decision Making: A Process Influenced by Moral Intensity. Journal of Healthcare, Science and the Humanities, I(1), 55–69.
Lu, C. S., & Lin, C. C. (2014). The Effects of Ethical Leadership and Ethical Climate on Employee Ethical Behavior in the International Port Context. Journal of Business Ethics, 124(2), 209–223. https://doi.org/10.1007/s10551-013-1868-y

443
Ludwig, T. D. (2001). On the necessity of structure in an arbitrary world: Using concurrent schedules of reinforcement to describe response generalization. Journal of Organizational Behavior Management, 21(4), 13–35.
Ludwig, Timothy D., & Frazier, C. B. (2012). Employee Engagement and Organizational Behavior Management. Journal of Organizational Behavior Management, 32(1), 75–82. https://doi.org/10.1080/01608061.2011.619439
Lukes, S. (2005). Power : A Radical View. Crossroads, 6(2), 87–95.
Lund, D. B. (2003). Organizational culture and job satisfaction. Journal of Business & Industrial Marketing.
Lysonski, S., & Gaidis, W. (1991). A Cross-cultural Comparison of the Ethics of Business Students. Journal of Business Ethics, 10(2), 141–150.
Macey, W. H., & Schneider, B. (2008). The meaning of employee engagement. Industrial and Organizational Psychology, 1.
MacIntyre, A. (1981). After Virtue. A Study in Moral Theory. University of Notre Dame Press.
MacIntyre, Alasdair. (1998). A Short History of Ethics: A History of Moral Philosophy from the Homeric Age to the 20th Century. Routledge.
Maesschalck, J. (2004). Measuring Ethics in the Public Sector: An Assessment of the Impact of Ethical Climate on Ethical Decision Making and Unethical Behaviour. In EGPA Annual Conference (Issue September).
Magee, K. C. (2002). The impact of organizational culture on the implementation of performance management. Academy of Management Review.
Man, T. W., Lau, T., & Chan, K. F. (2001). The Competitiveness of Small and Medium Enterprises: A Conceptualization with Focus on Entrepreneurial Competencies. Journal of Business Venturing.
March, J. G. (1991). Exploration and exploitation in organizational learning. Organization Science, 2(1), 71–87.
Marcoulides, G. A. (1998). Modern Methods for Business Research (1st ed.). Psychology Press.
Marsh, H. W., & Hocewar, D. (1986). A New, More Powerful Approach to Multitrait-Multimethod Analyses: An Application of Second-Order Confirmatory Factor Analysis. 1–46.
Martin, K. D., & Cullen, J. B. (2006). Continuities and extension of ethical climate theory: A meta-analysis review. Journal of Business Ethics, 69(2), 175–194.
Martins, N., & Von, der O. (2003). Organisational climate measurement - new and emerging dimensions during a period of transformation. South African Journal of Labour Relations, 27(3), p.41-59. http://reference.sabinet.co.za/webx/access/electronic_journals/labour/labour_v27_n3_a3.pdf

444
Martınez-Costa, M., & Martinez-Lorente, A. R. (2008). Does quality management foster or hinder innovation? An empirical study of Spanish companies. Total Quality Management & Business Excellence, 19(3), 209–221.
Marx, K., & Engels, F. (1945). The Communist Manifesto (S. Moore (ed.)).
Marx, Karl. (1867). Das Kapital : Kritik der politischen Oekonomie. 1, 2557.
Matsunaga, M. (2011). How to Factor-Analyze Your Data Right : Do ’ s, Don ’ ts , and How To ’s. 3(1), 97–110.
Maull, R., Brown, P., & Cliffe, R. (2001). Organisational culture and quality improvement. International Journal of Operations and Production Management, 21(3), 302–326.
Mauritius Bankers Association. (2013). Code of Ethics and of Banking Practice.
Mauritius Institute of Directors. (2018). Mauritius Institute of Directors - Our History. http://www.miod.mu/about-us/our-history
Mauritius Institute of Education. (2011). Code of Ethics: Vol. xlix (Issue 52).
Mauritius Revenue Authority. (2004). Conduct of Conduct and Ethics. August, 43–54.
May, D., & Pauli, K. (2002). The role of moral intensity in ethical decision making. Business & Society, 41, 84–117.
Mayer, D., Kuenzi, M., Greenbaum, R., Bardes, M., & Salvador, R. (2008). How does ethical leadership flow? Test of a Trickle-Down Model. Organisational Behaviour and Human Decision Processes, 108.
Mayer, D., Kuenzi, M., Greenbaum, R., Bardes, M., & Salvador, R. (2009). How low does ethical leadership flow? Test of a tickle-down model. Organisation Behaviour and Human Decision Processes.
Mayer, D. M., Kuenzi, M., Greenbaum, R., Bardes, M., & Salvador, R. B. (2009). How low does ethical leadership flow? Test of a trickle-down model. Organizational Behavior and Human Decision Processes, 108, 1–13.
https://doi.org/10.1016/j.obhdp.2008.04. 002.
McKee, D., Madden, T. M., Kellermanns, F. W., & Eddleston, K. A. (2014). Conflicts in family firms: The good and the bad. In L. Melin, M. Nordqvist, & P. Sharma (Eds.), Handbook of family business. Sage.
McLeaod, S. (2018). Questionnaire. https://www.simplypsychology.org/questionnaires.html
McShane, S., & Von Glinow, M. A. (2010). Organisational Behaviour: Emerging Knowledge and Global Reality (8th Editio). McGraw-Hill International Edition.
Mele, D. (2008). Business ethics: Europe versus America.
445
Menezes, A. C. P. G., Menezes, I. G., Lozado, J. A., & Bastos, A. V. B. (2016). Conception and validation of them Behavioral Intentions Scale of Organizational Citizenship (BISOC). Psicologia: Reflexao e Critica, 29(1). https://doi.org/10.1186/s41155-016-0030-z
Merton, R. K. (1957). Social Theory and Social Structure. Free Press.
Merton, R. K. (1964). Anomie, Anomia and Social Interaction: Context of Deviant Behaviour.
Meyers, C. (2004). Institutional culture and individual behaviour: creating an ethical environment. Science and Engineering Ethics, 10.
Mitonga-Monga, J., & Cilliers, F. (2015). Ethics culture and ethics climate in relation to employee engagement in a developing country setting. Journal of Psychology in Africa, 25(3), 242–249. https://doi.org/10.1080/14330237.2015.1065059
Mo, S. J., Wang, Z. M., Akrivou, K., & Booth, S. (2012). Look up, look around: Is there anything different about team-level OCB in China? Journal of Management & Organization, 18, 833–844.
Mo, S., & Shi, J. (2017). Linking Ethical Leadership to Employees ’ Organizational Citizenship Behavior : Testing the Multilevel Mediation Role of Organizational Concern. 151–162. https://doi.org/10.1007/s10551-015-2734-x
Mom, T. J. M., Van Den Bosch, F. A. J., & Volberda, H. W. (2009). Understanding variation in man- agers’ ambidexterity: Investigating direct and interaction effects of formal structural and personal coordination mechanisms. Organization Science, 20.
Moran, E. T., & Volkwein, J. F. (1992). The Cultural Approach to the Formation of Organizational Climate. Human Relations, 45.
Moreira, M. J. B. ., & Gutierrez, R. H. (2010). Contributions to management maturity models through processes and excellence in management using the PEMM and the MEG. Proceedings of VI National Conference on Excellence in Management.
Morris, B. (1997). He’s Smart. He’s Not Nice. He’s Saving Big Blue. Fortune.
Most, R. (2005). Repository of Questionnaires - Mind Garden Inc. d:%5CPerso%5CUnisa%5CLiterature Reviews%5CQuestionnaire - Instrument for Measurement%5CQuestionnaire - Authentic Leadership Questionnaire (ALQ).htm
Mowday, R., Porter, L., & Steers, R. (1982). Employee - Organization Linkages: The Psychology of Commitment, Absenteeism, and Turnover. Academic Press.
Mulroy, E. A., & Austin, M. J. (2004). Towards a Comprehensive Framework for Understanding the Social Environment : In Search of Theory for Practice. The Haworth Press, Inc., 25–59.

446
Mumford, M., Connelly, S., Brown, R., Murphy, S., Hill, J., Antes, A., & Devenport, L. (2008). A sensemaking approach to ethics training for scientists: Preliminary evidence of training effectiveness. Ethics & Behavior, 18, 315–339.
Mumford, M. D., Murphy, S. T., Connelly, S., Hill, J. H., Antes, A. L., Brown, R. P., & Al., E. (2007). Environmental influences on ethical decision making: Climate and environmental predictors of research integrity. Ethics & Behavior, 17, 337–366.
Munshi, J. (2014). A Method for Constructing Likert Scales. SSRN, October. https://doi.org/10.2139/ssrn.2419366
Naftanaila, I. R., & Cioana, G. (2013). Operational excellence – A key to world-class business per- formance. Studies in Business and Economics.
Nakano, C. (1997). A survey study on Japanese managers’ views of business ethics. Ournal of Business Ethics, 16(12).
Napal, G. (2003). Ethical Decision Making in Business: Focus on Mauritius. Business Ethics: A European Review, 12, 54–63.
Napal, G. (2005). Is bribery a culturally acceptable practice in Mauritius?”. Business Ethics: A European Review, 14(3), 231–249.
National Committee on Corporate Governance. (2016). The National Code of Corporate Governance for Mauritius. http://www.nccg.mu/sites/default/files/files/the-national-code-of-corporate-governance-for-mauritius_2016.pdf
Neck, C. P., & Houghton, J. D. (2006). Two decades of self-leadership theory and research: past developments, present trends, and future possibilities. Journal of Managerial Psychology, 21.
Neubert, M. J., & Roberts, J. A. (2013). The influence of ethical leadership and regulatory focus on employee outcomes. Business Ethics Quarterly, 23, 269–296. https://doi.org/10.5840/beq201323217
Neuman, L. W. (2000). Social Research Methods: Qualitative and quantitative approached. Allyn & Bacon.
Neuman, L. W. (2013). Social Research Methods - Qualitative & Quantitative Approaches (7th ed.). Pearson Education Limited.
Neuman, W. L. (2015). Social Research Methods: Qualitative and Quantitative Approaches (7th ed.). Pearson India Education Services Pvt Ltd.
Neumann, Y., & Reichel, A. (1987). The Development of Attitudes Toward Business Ethics Questionnaire (ATBEQ); Concepts, Dimensions, and Relations to Work Values.
Newman, A., Round, H., Bhattacharya, S., & Roy, A. (2017). Ethical Climates in Organizations: A Review and Research Agenda. Business Ethics Quarterly, 4(October), 1–38. https://doi.org/10.1017/beq.2017.23

447
Ng, E. (2015). L’economie de la diversite. PluriConseil Ltd.
Niemeyer, J., & Cavazotte, F. (2016). Ethical Leadership, Leader-Follower Relationship and Performance: a Study in a Telecommunications Company. RAM. Revista de Administração, 17(2), 67–92. https://doi.org/10.1590/1678-69712016/administracao.v17n2p67-92
Novelskaite, A. (2014). Exploring Ethical Organizational Culture: Validation of Measurement Instrument in Lithuania. Procedia - Social and Behavioral Sciences, 156(April), 186–188. https://doi.org/10.1016/j.sbspro.2014.11.168
Nunnally, J. C., & Bernstein, I. H. (1994). Psychometric Theory (3rd (ed.)). McGraw Hill.
OECD. (2016). Society at a Glance 2016. https://doi.org/10.1787/soc_glance-2014-en
Ogbonna, E., & Harris, L. C. (2000). Leadership style, organizational culture and performance: Empirical evidence from UK companies. International Journal of Human Resource Management, 11.
Okleshen, M., & Hoyt, R. (1996). A cross cultural comparison of ethical perspectives and decision approaches of business students: United States of America versus New Zealand. Journal of Business Ethics, 15(5), 537–549.
Organ, D. W., & Konovsky, M. (1989). Cognitive versus affective determinants of organizational citizenship behavior. Journal of Applied Psychology, 74.
Organ, Dennis W. (1988). Organizational Citizenship Behavior: The Good Soldier Syndrom. Lexington Books.
Padachi, K., Urdhin, H. R., & Ramen, M. (2016). Assessing Corporate Governance Practices of Mauritian Companies. International Journal of Accounting and Financial Reporting, 6(1), 38–71. https://doi.org/10.5296/ijafr.v6i1.9281
Parboteea, P. K., & Cullen, J. B. (2013). Business Ethics. Routledge.
Parboteeah, K. P., Hoegl, M., & Cullen, J. B. (2008). Ethics and religion: An empirical test of a multidimensional model. Journal of Business Ethics, 80(2), 387–398. https://doi.org/10.1007/s10551-007-9439-8
Park, C. H., Song, J. H., & Kim, W. (2015). The Impact of Ethical Leadership on Employees’ In-Role Performance: The Mediating Effect of Employees’ Psychological Ownership.
Parry, K. W., & Proctor, S. B. (2001). Organisational Culture, Integrity and Developing Leadership Capability in the New Zealand Public Sector. Public Sector Journa, 24.
Parsons, T., & Shils, E. A. . (1951). Values and value orientations in the theory of action. Harvard University Press.
Passas, N. (1990). Anomie and Corporate Deviance. Contemporary Crises, 14, 157–178.

448
Pastor, J. C., & Mayo, M. (2008). Transformational leadership among Spanish upper echelons. The role of managerial values and goal orientation. Leadership & Organization Development Journal, 29.
Patterson, M. G., Warr, P. B., & West, M. A. (2004). Organizational climate and company performance: the role of employee affect and employee level. Journal of Occupational and Organizational Psychology, 77, 193–216.
Patterson, Malcolm G, West, M. A., Shackleton, V. J., Dawson, J. F., Lawthom, R., Maitlis, S., Robinson, D. L., Wallace, A. M., Patterson, M. G., West, M. A., Maitlis, S., Robinson, D. L., & Wallaces, A. M. (2005). Validating the organizational climate measure : links to managerial practices, productivity and innovation. Journal of Organisational Behaviour, 26(4), 379–408.
https://doi.org/10.1002/job.312
PE Konsult. (2016). Perceived performance scale (pp. 1–4).
Pearce, C. L., & Conger, J. A. (2003). Shared Leadership: Reframing the Hows and Whys of Leadership. Sage.
Pestonjee, D. M., & Singh, A. P. (1978). Performance Rating Scale. Abhishek Publications.
Peters, T., & Waterman, R. (1981). In search of excellence. Harper and Row.
Phillips, J. J., & Phillips, P. P. (2015). High-Impact Human Capital Strategy : Addressing the 12 Major Challenges Today’s Organizations Face. AMACOM.
Piccolo, R. F., Greenbaum, R., Den Hartog, D. N., & Folger, R. (2010). The relationship between ethical leadership and core job characteristics. Journal of Organisational Behaviour, 31(2–3), 259–278.
Piccolo, R. F., Greenbaum, R., Hartog, D. N. D., & Folger, R. (2010). The relationship between ethical leadership and core job characteristics. Journal of Organizational Behavior, 31, 259–278.
Podsakoff, P. M., Ahearne, M., & Mackenzie, S. B. (1997). Organizational Citizenship and the Quantity and Quality of Work Group Performance. Journal of Applied Psychology, 82(2), 262–270. https://doi.org/10.1037/0021-
9010.82.2.262
Podsakoff, P. M., Mackenzie, S. B., Moorman, R. H., & Fetter, R. (1990). Transformational leader behaviors and their effects on followers’ trust in leader, satisfaction and organizational citizenship behavior. The Leadership Quarterly, 1(2), 107–142.
Podsakoff, Philip M., MacKenzie, S. B., Lee, J. Y., & Podsakoff, N. P. (2003). Common Method Biases in Behavioral Research: A Critical Review of the Literature and Recommended Remedies. Journal of Applied Psychology, 88(5), 879–903. https://doi.org/10.1037/0021-9010.88.5.879
Politis, J. D. (2002). Transformational and transactional leadership enabling (disabling) knowledge acquisition of self-managed teams: the consequences for performance. Leadership & Organization Development Journal, 23(4), 186–197.

449
Prabhupada, A. C. . (1998). The Bhagavad-gita As It Is. In Bhaktivedanta Book Trust International. Bhaktivedanta Book Trust International. https://doi.org/10.1353/mis.2007.0049
Pritchard, R. D., & Karasick, B. W. (1973). The effects of organizational climate on managerial job performance and satisfaction. Organizational Behavior and Human Performance, 9, 126–146.
PwC. (2016). Global Economic Crime Survey 2016. 1–31. https://doi.org/x141
Rafailidis, A., Trivellas, P., & Polychroniou, P. (2017). The mediating role of quality on the relationship between cultural ambidexterity and innovation performance. Total Quality Management & Business Excellence, 28(9–10), 1134–1148.
https://doi.org/10.1080/14783363.2017.1309122
Rallapalli, K. C., Vitell, S. J., & Barnes, J. H. (1998). The influence of norms on ethical judgments and intentions: An empirical study of marketing professionals. Journal of Business Research, 43(3), 157–168.
Ramesh, V., & Goolaup, P. S. (2020). Influence of Organizational Citizenship Behaviour on Mauritian Hospitality Industry employee job-satisfaction: Structural Equation Modelling. International Journal of Psychosocial Rehabilitation, 24(4), 4994–5005.
Rawwas, M. (2001). Culture, personality and morality: a typology of international consumers’ ethical beliefs. International Marketing Review, 18(2), 188–209.
Redding, G. (1976). Some perceptions of psychological needs among managers in South-East Asia.
Reeves, C. A., & Bednar, D. A. . (1994). Defining quality: alternatives and implications. Academy of Management Review, 19(3), 419–445.
Regan, D. (1980). Utilitarianism and cooperarion. Clarendon Press.
Reidenbach, R. E., & Robin, D. P. (1988). Some initial steps toward improving the measurement of ethical evaluations of marketing activities. Journal of Business Ethics, 7, 871–879.
Reidenbach, R. E., Robin, D. P., Phillips, T. J., & Flory, S. M. (1995). Examining the dimension- ality of the ethical decision-making process of certified management accountants. Advances in Accounting, 13, 131–151.
Republic of Mauritius. (2010). Code of Ethics for Public Officers.
Rest, J., & Narvez, D. (1994). Moral Theory in the Professions: Psychology and Applied Ethics. Lawrence Erlbaum Associates, Inc.
Rest, J. R. (1986). Moral development advances in research and theory. Praeger.
Rest, James R., Narvaez, D., Thoma, S. J., & Bebeau, M. J. (1999). DIT2: Devising and Testing a Revised Instrument of Moral Judgment. Journal of Educational Psychology, 91(4), 644–659. https://doi.org/10.1037/0022-0663.91.4.644

450
Results_through_People. (2012). Organizational Culture Assessment Instrument. https://doi.org/10.1017/CBO9781107415324.004
Reynolds, S. (2006). Moral awareness and ethical predispositions: Investigating the role of individual differences in the recognition of moral issues. Journal of Applied Psychology, 91, 233–243.
Ribiere, V. M., & Sitar, A. S. (2003). Critical role of leadership in nurturing a knowledge-supporting culture. Knowledge Management Research & Practice, 1(1), 39–48.
Rice, G. (1999). Islamic ethics and the implications for business. Journal of Business Ethics, 18(4), 345–58.
Rigdon, E. E. (1998). Structural Equation Modelling. In G. A. Marcoulides (Ed.), Modern methods for business research (1st ed., pp. 251–294). Psychology Press.
Rinker, T. (2014). On the Treatment of Likert Data (Issue May, pp. 1–16).
Rioux, S. M., & Penner, L. A. (2001). The cause of organizational citizenship behavior: A motivational analysis. Journal OfApplied Psychology, 86(6), 1306–1314. https://doi.org/10.1037//0021-9010.86.6. 1306.
Robbins, S., & Judge, T. A. (2013). Organisational Behaviour. In Pearson Education Inc. (Ed.), Organisational Behaviour (15th ed., p. 512). Prentice Hall.
Rodrigues, C. A. (1997). Developing expatriates’ cross‐cultural sensitivity: cultures where “your culture’s OK” is really not OK. Journal of Management Development, 16(9), 690–702. https://doi.org/10.1108/02621719710190211
Rogerson, C. M. (2008). Export‐processing industrialisation in Mauritius: The lessons of success. Development Southern Africa, 177–197.
Roman, S., & Munuera, J. L. (2005). Determinants and consequences of ethical behaviour: an empirical study of salespeople. European Journal of Marketing, 39, 473–495.
Ronen, S., & Kraut, A. (1977). Similarities among countries based on employee work values and attitudes. Columbia Journal of World Business, 12(2).
Ronen, S., & Shenkar, O. (1985). Clustering Countries on Attitudinal Dimensions: A Review and Synthesis. Academy of Management Review, 10(3), 435–454. https://doi.org/10.5465/AMR.1985.4278955
Ross, W. D. (1930). The Right and the Good. Clarendon Press, Oxford.
Roth, W. D., & Mehta, J. D. (2002). The Rashomon effect: Combining positivist and interpretivist approaches in the analysis of contested events. Sociological Methods and Research, 31(2), 131–173.
Rousseau, D. M. (1988). The construction of climate in organizational research. American Psychological Association.

451
Rugman, A., & Collinson, S. (2009). International Culture. In International Business (5th ed., pp. 129–158). Prentice Hall.
Ruiz-Palomino, P., & Martinez-Canas, R. (2011). Corporate Ethics And Ethical Behaviour: The Significant Function Of Top Management Role Modelling. Review of Business Information Systems (RBIS), 15(5), 69. https://doi.org/10.19030/rbis.v15i5.6020
S&P Global, & MSCI. (2018). GICS ® Global Industry Classification Standard 2 S&P Global Market Intelligence | MSCI Global Industry Classification Standard 3. 47. www.spglobal.com/marketintelligence.
Sadeghi, A., & Pihie, Z. A. L. (2012). Transformational leadership and its predictive effects on leadership effectiveness. International Journal of Business and Social Science, 3.
Sadeq, A. M. (2002). Waqf, Perpetual Charity and Poverty Alleviation. International Journal of Social Economics, 29, 135–151.
Saks, A. M. (2006). Antecedents and consequences of employee engagement. Journal of Managerial Psychology, 21.
Salkind, N. J. (2004). Statistics for People Who (Think They) Hate Statistics (2nd ed.). SAGE Publications, Inc;
Salverda, T. (2015). The Franco-Mauritian elite: Power and anxiety in the face of change. November.
Sarros, J. C. (2006). Leadership and character. Journal, Leadership & Organisational Development, 27.
Sarros, J. C., & Santora, J. C. (2001). The transformational-transactional leadership model in practice. Leadership & Organization Development Journal, 22.
Sartre, J. P. (1970). L’existentialisme est un humanisme. Nagel.
Sashkin, M., & Rosenbach, W. E. (2013). Organizational Culture Assessment Questionnaire. 1–12. http://cimail15.efop.org/documents/OCAQParticipantManual.pdf
Sauro, J. (2010). Should you use 5 or 7 Point Scales? https://measuringu.com/scale-points/
Schein, E. H. (1985). Organizational culture and leadership: A dynamic view. Jossey-Bass.
Schein, E. H. (2010). Organizational culture and leadership (6th ed.). John Wiley & Sons Inc.
Schein, Edgar. H, & Schein, P. (2017). Organisational Culture and Leadership (5th Editio). John Wiley & Sons Inc.

452
Schell-Busey, N. M. (2009). The deterrent effects of ethics codes for corporate crime: A meta-analysis. ProQuest Dissertations and Theses, February, 168-n/a. http://search.proquest.com/docview/304924318?accountid=14549%5Cnhttp://hl5yy6xn2p.search.serialssolutions.com/?genre=article&sid=ProQ:&atitle=The+deterrent+effects+of+ethics+codes+for+corporate+crime:+A+meta-analysis&title=The+deterrent+effects+of+ethics+
Schmieder-Ramirez, J. (2015). The SPELIT Power Matrix (1st (ed.)). www.booksurge.com.
Schmieder-Ramirez, J., & Mallette, L. (2007). The Spelit Power Matrix: Untangling The Organizational Environment With The Spelit Leadership Tool. BookSurge Publishing.
Schnatterly, K. (2003). Increasing firm value through detection and prevention of white-collar crime. Strategic Management Journal, 24, 587–614.
Schneider, B. (1990a). Organisational climate and culture. Jossey-Bass.
Schneider, B. (1990b). The climate for service: an application of the climate construct.
Schneider, B., & Reichers, A. E. (1983). On the etiology of climates. Personnel Psychology, 36, 19–39.
Schumacker, R. E., & Lomax, R. G. (2004). A Beginner’s Guide to Structural Equation Modeling (2nd ed.). Lawrence Erlbaum Associates, Inc.
Schwartz, S. H. (1992). Universals in the content and structure of values: Theoretical advances and empirical tests in 20 countries. Advances in Experimental Social Psychology, 25, 1–65.
Schwartz, S. H. (1994). Beyond Individualism/Collectivism: New Cultural Dimensions of Values. Sage.
Schweitzer, M. E., Ordonez, L., & Douma, B. (2004). Goal setting as a motivator of unethical behaviour. Academy of Management Journal, 47.
Scott, T., Mannion, R., Davies, H., & Marshall, M. (2003). The quantitative measurement of organizational culture in health care: A review of the available instruments. Health Services Research, 38(3), 923–945. https://doi.org/10.1111/1475-6773.00154
Scott, W. R. (2008). Institutions and Organizations: Ideas and Interests. Sage Publications, Inc.
Seligman, M. E. P. (1991). Learned optimism. Alfred Knopf.
Seliigson, A. L., & Choie, L. (2006). Critical elements of an organizational ethical culture. Ethics Resource Center, 1–24.

453
Serwer, A., & Bonamici, K. (2004). Southwest Airlines: The Hottest Thing in the Sky Through change at the top, through 9/11, in a lousy industry, it keeps winning Most Admired kudos. How? Fortune. http://archive.fortune.com/magazines/fortune/fortune_archive/2004/03/08/363700/index.htm
Shafer, W. E. (2015). Ethical climate, social responsibility, and earnings management. Journal of Business Ethics, 126, 43–60. https://doi.org/http://doi.org/10.1007/s10551-013-1989-3
Sharma, V., & Jain, S. (2014). A Scale for Measuring Organizational Citizenship Behavior in Manufacturing Sector. Pacific Business Review International, 6(8), 57–62.
Shingo Institute. (2018). The Shingo ModelTM is not just another initiative; it is a new way of thinking. https://shingo.org/model
Sibiya, L., Makoni, T., & Van Wyk, R. (2016). Investigating the relationship between ethical climate and psychological capital. Proceedings of 28th Conference of The Southern African Institute of Management Sciences (SAIMS), September, 57–71.
Silverthorne, C. (2004). The impact of organizational culture and person-organization fit on organ- izational commitment and job satisfaction in Taiwan. Leadership & Organization Development Journal, 25(7), 592–599.
Simon, B. M. K., & Goes, J. (2013). Correlational Research. Understanding and Conducting Research in the Health Sciences, 253–284. https://doi.org/10.1002/9781118643624.ch10
Singer, M. (1998). The role of subjective concerns and characteristics of the moral issue in moral considerations. British Journal of Psychiatry, 89, 663–679.
Singhapakdi, A., Vitell, S., & Kraft, K. (1996). Moral intensity and ethical decision-making of marketing professionals. Journal of Business Research, 36, 245–255.
Sirota, D., & Greenwood, J. M. (1971). Understand your overseas workforce. Harvard Businsess Review, 49(1), 53–60.
Skinner, B. F. (1974). About behaviorism. Random House.
Smith, C. A., Organ, D. W., & Near, J. P. (1983). Organizational citizenship behavior: Its nature and antecedents. Journal of Applied Psychology, 68.
Smith, P. (2001). Cultural Theory: An Introduction (21st Centu). Blackwell Publishing. https://books.google.mu/books?id=JFm8IAYu2gUC&pg=PA6&source=gbs_toc_r&cad=3#v=onepage&q&f=false
Smith, P. B., Fischer, R., Vignoles, V. L., & Bond, M. H. (2013). Understanding Social Psychology Across Cultures: Engaging with Others in a Changing World. Sage.

454
Smith, P. B., & Peterson, M. F. (1995). Beyond Value Comparisons: Sources Used to Give Meaning to Management Work Events in Twenty-Nine Countries. In Academy of Management.
Smith, R. E., Wheeler, G., & Diener, E. (1975). Faith Without Work: Jesus People, Resistance to Temptation, and altruism. Journal of Applied Social Psychology, 5, 320–330.
Sousa, F. J. (2010). Meta-theories in Research: Positivism, Post Modernism, and Critical Realism. Social Sciences Competence Centre, University of Madeira, 1–72.
Stare, J., & Klun, M. (2016). An analysis of the ethics infrastructure and ethical climate in Slovenian public administration. NISPAcee Journal of Public Administration and Policy, 9(2), 147–164. https://doi.org/10.1515/nispa-2016-0018
Statistica. (2018). The Statistic Portal. https://www.statista.com/statistics/729017/inflation-rate-in-mauritius/
Statistics Mauritius. (2018). Annual Digest of Statistics 2017 (Vol. 62, Issue October).
Statistics Mauritius, R. of M. (2017a). Digest of Labour Statistics 2016.
Statistics Mauritius, R. of M. (2017b). Republic of Mauritius 2013 Census of Economic Activities (Issue May). http://statsmauritius.govmu.org
Statistics Solutions. (2019). Confirmatory Factor Analysis. https://www.statisticssolutions.com/topic/confirmatory-factor-analysis/
Stock Exchange of Mauritius. (2018). Stock Exchange of Mauritius - At a Glance. http://www.stockexchangeofmauritius.com/sem-at-a-glance
Stone, A. G., Russell, R. . F., & Patterson, K. (2004). Transformational versus servant leadership: a difference in leader focus. Leadership & Organization Development Journal, 25(4), 349–361.
Suhr, D. D. (2006). The basics of structural equation modeling. SAS User Group of the Western Region of the United States (WUSS), 1–19. http://www.lexjansen.com/wuss/2006/tutorials/tut-suhr.pdf
Sullivan, V. E. (1977). A study of Kohlberg’s structural theory of moral development. A critique of liberal social science ideology. Human Development, 20.
Sun, J. P. (2011). Ethical decision ‐ making and ethical responding : an analysis and critique of various approaches through case study. 14(1), 21–45. https://doi.org/10.1080/13603124.2010.497260
Sun, S. (2009). Organizational culture and its themes. International Journal of Business and Management, 3(12).
Tabachnick, B. G., & Fidell, L. S. (1996). Using Multivariate Statistics (3rd ed.). HarperCollins.

455
Tajfel, H., & Turner, J. (1985). The social identity theory of intergroup behavior. Psychology of Intergroup Relations, 2nd Ed., 7–24.
Tanure, B., & Duarte, R. G. (2005). Leveraging competitiveness upon national cultural traits; the management of people in Brazilian companies. International Journal of Human Resource Management, 16(12).
Terre Blanche, M., Durrheim, K., & Painter, D. (2006). Research in practice: Applied methods for the social sciences. University of Cape Town Press.
Tessema, M. T., & Soeters, J. L. (2006). Challanges and practices of HRM in developing countries:testing the HRM-performance link in the Eritrean civil service. International Journal of Human Resources\, 17(1), 86–105.
The Committee on Corporate Governance. (2004). The Report on Corporate Governance for Mauritius. http://www.nccg.mu/multimedia/others/editor/files/Code_of_Corporate_Governance-April 2004.pdf
The Institute For Ethical Leadership. (2007). Ethical Leadership Scales. Institute for Ethical Leadership. http://www.ethicalleadership.com/EthicalLeadershipScales.html
The Institute of Leadership and Management. (2011). Index of Leadership Trust 2011. In ILM and Management Today.
The World Bank Group. (2018). The World Bank Data - Mauritius. https://data.worldbank.org/country/mauritius?view=chart
Tittle, C. R., & Welch, M. R. (1983). Religiosity and Deviance: Toward a Contingency Theory of Constraining Effects. Social Forces, 61(3), 653–682.
Toor, S. R., & Ofori, G. (2009). Ethical leadership: Examining the relationships with full range leadership model, employee outcomes, and organizational culture. Journal of Business Ethics, 90(4), 533–547. https://doi.org/10.1007/s10551-009-0059-3.
Towers Perrin. (2003). Working today: Understanding what drives employee engagement. http://www.keepem.com/doc_files/Towers_Perrin_Talent_2003%28TheFinal%29.pdf
Trading Economics. (2018). Mauritius GDP. https://tradingeconomics.com/mauritius/gdp
Trafford, V., & Leshem, S. (2012). Stepping Stones to Achieving your Doctorate. Mc Graw Hill, Open University Press.
Treanor, J. (2009). FSA fines insurer AON 5.25 million pounds for corruption control failures. Financial Times. https://www.theguardian.com/business/2009/jan/08/insurance

456
Trevino, L. (1990). A Cultural Perspective on Changing and Developing Organizational Ethics. Research in Organization Change and Development, 4, 195–230.
Trevino, L. K. (1986). Ethical decision making in organizations: A person-situation interactionist model. Academy of Management Review, 11, 601–617.
Trevino, L. K., Brown, M., & Hartman, L. P. (2003). A qualitative investigation of perceived executive ethical leadership: Percep- tions from inside and outside the executive suite. Human Relations, 56, 5–37. https://doi.org/10.1177/0018726703056001448.
Trevino, L. K., Butterfield, K. D., & McCabe, D. L. (1998). The ethical context in organizations: Influences on employee attitudes and behaviors. Business Ethics Quarterly, 8, 447–476.
Trevino, L. K., Hartman, L. P., & Brown, M. (2000). Moral person and moral manager: How executives develop a reputation for ethical leadership. California Management Review, 42, 128–142.
Trevino, L. K., & Weaver, G. R. (2003). Managing ethics in business organisations. Stanford University Press.
Trevino, L., & Nelson, K. (2014). Managing business ethics: straight talk about how to do it right. (6th ed.) John Wiley & Sons Inc.
Trevino, L., Weaver, G., Gibson, D., & Toffler, B. (1999). Managing ethics and legal compliance: what works and what hurts. California Management Review, 41(2).
Trochim, & William, M. K. (2006). Descriptive Statistics. Research Methods Knowledge Base.
Trompenaars, F., & Hampden-Turner, C. (1997). Riding the Waves of Culture: Understanding Cultural Diversity in Global Business. Nicholas Brealey.
Tuchman, M. L. (1965). Developmental sequence in small groups. Psychological Bulletin, 63.
Tushman, M. L., & O’Reilly, C. A. (1996). Ambidextrous organizations: Managing evolutionary and revolutionary change. California Management Review, 38(4), 8–29.
Tyler, T. R., & Blader, S. L. (2005). Can business effectively regulate employee conduct? The antecedents of rule following in work settings. Academy of Management Journal, 6, 1143–1158.
Tylor, E. B. (1871a). Primitive Culture: Researches into the development of Mythodology, Philosophy, Religion, Art and Custom. In Oxford University (Vol. 1). https://doi.org/10.1016/0003-6870(73)90259-7
Tylor, E. B. (1871b). Primitive Culture: Researches into the development of Mythodology, Philosophy, Religion, Art and Custom. In Oxford University (Vol. 2). https://doi.org/10.1016/0003-6870(73)90259-7

457
Ulrich, C., O’Donnell, P., Taylor, C., Farrar, A., Danis, M., & Grady, C. (2007). Ethical climate, ethics stress, and the job satisfaction of nurses and social workers in the United States. Social Science and Medicine, 65(8), 1708–1719.
Vagias, W. (2006). Likert-type scale response anchors. Clemson International Institute for Tourism and …, 3–4. https://doi.org/10.1525/auk.2008.125.1.225
Valas, S., & Raghunathan, R. (2018). Assessing Organization Culture – A Review on the OCAI Instrument. Internatonal Conference on Management and Information Systems, 182–188.
Van Dyne, L., & LePine, J. A. (1998). Helping and voice extra-role behaviors: evidence of construct and predictive validity. The Academy of Management Journal, 4(1), 108–119.
Vaughan, D. (1983). Controlling Unlawful Organizational Behavior: Social Structure and Corporate Misconduct. University of Chicago Press.
Vergés, A. (2010). Integrating Contextual Issues in Ethical Decision Making. Ethics and Behaviour, 20(6), 497–507. https://doi.org/10.1080/10508422.2010.521451
Victor, B., & Cullen, J. B. (1987). A theory and measure of ethical climate in organizations. Research in Corporate Social Performance and Policy, 9, 51–71.
Victor, B., & Cullen, J. B. (1988). The Organizational Bases of Ethical Work Climates. Administrative Science Quarterly, 33(1), 101-125. https://doi.org/10.2307/2392857
Victor, B., & Cullen, J. B. (1998). The organisational bases of ethical work climates. Administrative Science Quarterly, 33(1).
Vidaver-Cohen. (1993). Creating and Maitaining Ethical Work Climates: Anomie in the Workplace and Implications for Managing Change. Business Ethics QuarterlyEthics, 3(4), 343–359.
Vidaver-Cohen, D. (1995). Creating Ethical Work Climates, A Socioeconomic Perspective. The Journal of Socio-Economics, 24, 317–343.
Vitell, S. J., & Festervand, T. A. (1987). Business ethics: Conflicts, practices and beliefs of industrial executives. Journal of Business Ethics, 6(2), 111–122.
Vitell, S. J., & Singhapakdi, A. (2008). The Role of Ethics Institutionalization in Influencing Organizational Commitment, Job Satisfaction, and Esprit De Corps. Journal of Business Ethics, 81(2), 343–353.
Walker, H., Symon, G., & Davies, B. (1996). Assessing Organizational Culture: A Comparison of Methods. International Journal of Selection and Assessment, 42(2), 96–105.
Wallach, E. J. (1983). Individuals and organizations: The cultural match. Training Journal, 37.

458
Walumbwa, F. O., Mayer, D. M., Wang, P., Wang, H., Workman, K., & Christensen, A. L. (2011). Linking ethical leadership to employee performance: The roles of leader–member exchange, self-efficacy, and organizational identification. Organizational Behavior and Human Decision Processes, 115(2), 204–213.
Waters, J. A., Bird, F., & Chant, P. D. (1986). Everyday moral issues experienced by managers. Journal of Business Ethics, 5(5), 373–384.
Weaver, G. R., & Agle, B. R. (2002). Religiosity and Ethical Behavior in Organizations: A Symbolic Ethics and Religion 397 Interactionist Perspective. Academy of Management Review, 27(1).
Weber, & Arnaud. (2014). Ethical Work Climate 2014. IABS 2014 Symposium Proposal.
Weber, J., & McGivern, E. (2010). A New Methodological Approach for Studying Moral Reasoning among Managers in Business Settings. Journal of Business Ethics, 92(1), 149–166.
Weber, M. (1922). Economy and Society. University of California Press.
Weick, K. (1995). Sensemaking in organisations. Sage Publications, Inc.
Welfel, E. R. (2006). Ethics in counseling and psychotherapy: Standards, research, and emerging issues (3rd ed.). Thomson Brooks/Cole.
White, L. A. (1959). The Evolution of Culture: The Development of Civilisation to the Fall of Rome. McGraw-Hill.
White, T. I. (1988). Right and Wrong. Prentice Hall.
Wikipedia. (2018). Religion in Mauritius. https://en.wikipedia.org/wiki/Religion_in_Mauritius
Wilmarth, A. (2013). Citigroup: A Case Study in Managerial and Regulatory Failures. Indiana Law Review, 47(1), 69–137. https://doi.org/10.18060/18342
Winer, E. S., Cervone, D., Bryant, J., McKinney, C., Liu, R. T., & Nadorff, M. R. (2016). Distinguishing Mediational Models and Analyses in Clinical Psychology: Atemporal Associations Do Not Imply Causation. Journal of Clinical Psychology, 72(9), 947–955. https://doi.org/10.1002/jclp.22298
Wright, P., Szeto, W. F., & Cheng, L. (2002). Guanxi and professional conduct in China: a management development perspective. International Journal of Human Resource Management, 13(1), 156–182.
Yadav, P., & Punia, B. (2012). Organisational citizenship behaviour: A review of antecedent, correlates, outcomes and future research directions. International Journal of Human Potential Development, 2(2).
Yang, H. L., & Wu, W. P. (2009). The effect of moral intensity on ethical decision making in accounting. Journal of Moral Education, 38(3), 335–351. https://doi.org/10.1080/03057240903101606

459
Yukl, G., Mahsud, R., Hassan, S., & Prussia, G. E. (2013). An Improved Measure of Ethical Leadership. Journal of Leadership & Organizational Studies, 20(1), 38–48. https://doi.org/10.1177/1548051811429352
Yun, S., Cox, J., & Sims, H. P. J. (2006). The forgotten follower: a contingency model of leadership and follower self-leadership. Journal of Managerial Psychology, 21.
Zhang, Z., & Zhu, X. (2012). Empirical analysis of the relationship between organizational culture and organizational performance. National Conference on Information Technology and Computer Science.
Zheng, P., Gray, M. J., Zhu, W., Jiang, G., Zheng, P., & Gray, M. J. (2014). Influence of Culture on Ethical Decision Making in Psychology Influence of Culture on Ethical Decision Making in Psychology. Ethics & Behavior, 24(6), 510–522. https://doi.org/10.1080/10508422.2014.891075
Zhu, W., May, D. R., & Avolio, B. J. (2004a). The impact of ethical leadership behavior on employee outcomes: the roles of psychological empowerment and authenticity. Journal of Leadership & Organizational Studies, 11.
Zhu, W., May, D. R., & Avolio, B. J. (2004b). The Impact of Ethical Leadership Behavior on Employee Outcomes: The Roles of Psychological Empowerment and Authenticity. Journal of Leadership and Organizational Studies, 11(1), 16–26.
Zhu, W., Newman, A., Miao, Q., & Hooke, G. (2013). Revisiting the mediating role of trust on transformational leadership effects: Do different types of trust make a difference? Leadership Quarterly, 24, 94–105.

460
7. APPENDICES
A. Research Questionnaire
The complete research questionnaire is appended as separate file to ease
readability.
B. Information regarding Originality Checking of the Thesis
The Turnitin Digital Receipt was provided, as part of the thesis
documentation pack submitted for examination, as documentary evidence
that this thesis was submitted for originality checking.
An extract of the Match Overview Result was also provided as documentary
evidence of the outcome of the originality checking. The similarity index was
found to be reasonable and acceptable as it falls within the accepted
requirements of originality.