dynamics of bubble growth and detachment from a needle
TRANSCRIPT

J . Fluid Mech. (1993), vol. 251, pp. 1 1 1-145 Copyright 0 1993 Cambridge University Press
111
Dynamics of bubble growth and detachment from a needle
By HASAN N. OGUZ AND ANDREA PROSPERETTI Department of Mechanical Engineering, Johns Hopkins University, Baltimore, MD 2128, USA
(Received 6 January 1993 and in revised form 28 May 1993)
Several aspects of the growth and departure of bubbles from a submerged needle are considered. A simple model shows the existence of two different growth regimes according to whether the gas flow rate into the bubble is smaller or greater than a critical value. These conclusions are refined by means of a boundary-integral potential- flow calculation that gives results in remarkable agreement with experiment. It is shown that bubbles growing in a liquid flowing parallel to the needle may detach with a considerably smaller radius than in a quiescent liquid. The study also demonstrates the critical role played by the gas flow resistance in the needle. A considerable control on the rate and size of bubble production can be achieved by a careful consideration of this parameter. The effect is particularly noticeable in the case of small bubbles, which are the most difficult ones to produce in practice.
1. Introduction The production of bubbles by submerged needles or orifices occurs in a large number
of technical applications including water treatment, metallurgy, and a variety of chemical plants such as perforated plate columns. Other important applications occur in medicine where blood oxygenators are often based on the same principle (Sutherland, Derek & Gordon 1988; Kurusz 1984; Matkovitch 1984). The process has also some connection and resemblance to bubble departure in boiling, which is a major aspect of industrial operations in the power industry and many others (see e.g. Sluyter et al. 1991 ; Wang & Bankoff 1991 and references quoted therein). In laboratory research on multiphase flow and acoustics, it is often necessary to generate small bubbles in a controlled fashion, which sometimes is found to be a maddeningly difficult task. Finally, one might hope that by studying this process some insight could be gained on bubble formation in air-entraining flows, which are themselves of major importance in many areas of technological as well as of environmental concern.
The practical importance of this process and its mechanics, unexpectedly rich in subtleties, have motivated a considerable number of studies (Clift, Grace & Weber 1978; Tsuge & Hibino 1983). A detailed review of the literature up to about 1970 is given by Kumar & Kuloor (1970); this article contains a wealth of experimental facts and data and describes several theoretical models based on force balances expressed in terms of numerically or exactly solvable ordinary differential equations. In all of these simplified models the bubble is taken to grow spherically and the objective is to calculate the volume at its detachment from the needle. It is however known that bubbles are not spherical when they grow, a fact that is crucial for the understanding of the acoustic emissions upon their departure from the needle. Furthermore, methods have been proposed to produce small bubbles by immersing the needle in a flow (Chuang &

112 H . N . Oguz and A . Prosperetti
Goldschmidt 1970; Tsuge, Hibino & Nojima 1981; Jenssen et al. 1991; see also Al-Hayes & Winterton 198l), which also affects sphericity in an essential way. For these reasons, recent work on the problem has emphasized the shapes of the bubbles (Pinczewski 1981; Tan & Harris 1986; Liow & Gray 1988; Longuet-Higgins, Kerman and Lunge 1991; Leighton, Fagan & Field 1991).
The objective of the present study is to examine the shape and volume of detaching bubbles in the regime of moderate growth rates, where the quasi-static analysis of Longuet-Higgins et al. (1991) is invalid. In addition to extensive numerical results, we report on some simple experiments that validate the theory. One of the points that we examine is the production of small bubbles, which proves to be exceedingly difficult to achieve with regularity even under carefully controlled laboratory conditions. We explain the origin of these difficulties and propose some ideas for overcoming them. One of these is the immersion of the needle in a parallel liquid flow, the effects of which are also studied.
2. The physical process Consider a vertical needle in the form of a thin-walled circular cylinder immersed in
a liquid. The base of the needle is connected to a chamber containing gas at a pressure pc . If a bubble is growing, the flow in the needle causes the pressure in the bubble, p E , to be smaller than pc . The liquid pressure p L at the bubble interface is related to p B by
P B = P L -k gw? (1)
where cr is the surface tension coefficient and % the local curvature. Unlike the case considered by Longuet-Higgins et al., here liquid flow effects are important, p L is not uniform, and therefore the surface of the bubble is not a constant-curvature surface in general even though p E is practically uniform and gravity effects weak.
Consider first incipient conditions in which the gas-liquid interface is just outside the needle’s mouth and gas flow is so slow thatp, x pc . As the bubble grows, the interface remains at the needle tip and its radius of curvature decreases, reaching a minimum value equal to the needle radius a. For this to happen, evidently, the chamber pressure must be at least equal to a minimum value given by
P C , min = P , +2gla (2)
where p , is the pressure at the needle’s tip under stagnant conditions. As the bubble radius increases past a, the pressure in the bubble becomes progressively higher than the value needed to ensure quasi-equilibrium of the gas-liquid interface and the bubble growth proceeds dynamically. If the needle radius is very small, this overpressure is large and the further growth takes place very rapidly as if a jet of gas issued from the needle. Thus causes bubbles to be produced in groups, with a strong possibility of coalescence and other irregularities (see e.g. Leighton et al. 1991). This is the root of the basic difficulty in producing small bubbles mentioned before. It is clear that, to avoid the problem, the pressure in the bubble has to begin decreasing very quickly as soon as the bubble starts to grow beyond the radius a. Since this initial growth is very fast, this objective is not easily reached by actively limiting the gas flow. However, it can be reached passively by relying on the pressure drop between the chamber and the needle. It is to examine this point that we now consider a simple model for this process.
In view of the typical needle sizes of interest (of the order of 1 mm or smaller) and of the prevailing flow rates, the flow in the needle can be expected to be laminar and,

Bubble growth and detachment from a needle 113 since the pressure along the needle drops slowly with respect to pc, it can be approximated as nearly parallel, or Poiseuille-like. Hence, locally, we may write
where m is the gas flow rate and pG and pG are the gas viscosity and density. With the assumption of isothermal flow, so that pG = p / g T (with 9 the specific gas constant and T the temperature), and of constant pG, since m is a constant along the needle, we can integrate (3) from the chamber to the bubble to find
m . = n a4p2 , -p i 1 6 1 , ~ ~ WT '
(4)
It will be seen below that the pressure in the bubble falls rather rapidly to a value very close top,. On the basis of this equation we therefore define a characteristic volumetric growth rate by
This quantity is useful to compare different cases as it is a constant solely dependent on the experimental conditions specific to each. For the same reason, it is useful to rewrite (4) in terms of a flow resistance coefficient that groups together parameters characteristic of each growth situation and that we define by
The needle length I appearing in these equations is to be interpreted as an effective, rather than actual, value as a large flow resistance may be achieved by use of a valve or other constriction rather than a very long needle. With (6), equation (4) becomes
This differential equation for the mass of gas in the bubble must be integrated subject to an initial condition m(0) = m,.
When the velocity of the gas issuing from the needle is very high, the gas pressure cannot be taken to be uniform and the bubble shape is affected by the gas momentum (Anagbo, Brimacombe & Wraith 1991). To estimate this effect note that the gas stagnation pressure is of the order of ipG(Q/xa2)2, to be compared with the surface tension overpressure of the order of 2a/a. The two effects are equal for
4n2aa3 t Q = (-) P G
For a needle radius of 1 mm this relation gives Q = 48837 mm3/s and for a = 0.1 mm Q = 1544 mm3/s. These values are near the upper end of the range of Q that we consider and we disregard such effects for simplicity. Further comments on this point are deferred until $5. Hence we assume the pressure p B to be spatially uniform and given by the perfect gas equation of state

114 H . N . Oguz and A . Prosperetti
where V, is the bubble volume and m(t) is obtained from (7), which neglects the small effects of gas diffusion in the liquid. In using this relation we shall assume isothermal conditions. This is a good approximation as long as the bubble remains attached to the needle because the relevant timescale is longer than the thermal diffusion time. When the bubble detaches, however, volume pulsations are excited with a much shorter period and strongly reduced heat transfer rates (see e.g. Prosperetti 1991). We account for these effects in a simplified way by using the adiabatic relation as explained in 34.
To close the mathematical formulation of the problem we need a means of calculating the pressure in the liquid at the surface of the bubble appearing in the normal stress balance (1) and the bubble volume and shape. A numerical approach based on the boundary-integral technique for the evaluation of these quantities for the general axisymmetric case is presented in $4.
3. Approximate model As mentioned in the Introduction several approximate models with different degrees
of complexity have been developed to describe the process of present concern (Kumar & Kuloor 1970). Since we are going to use a fully numerical solution, for the purpose of gaining some physical insight, a simple model is adequate. The one we adopt is based in part on that of Davidson & Schuler (1960).
The bubble is assumed to be spherical and its growth is described by the Rayleigh-Plesset equation
where dots denote time differentiation, R is the bubble radius, p the liquid density, and the bubble internal pressurep, is obtained from (9) with rn given by (7) and V, = ;nR3.
In the discussion that follows an important scale for the bubble radius is the value R, at which buoyancy and surface tension are in balance. Approximating the bubble by a sphere Fritz (1935; see Kumar & Kuloor 1970) found
R, = (iz):. It is only when the bubble has an (equivalent) radius greater than R, that buoyancy is sufficiently strong to detach it from the needle. For relatively rapid growth the bubble radial velocity is approximately (see e.g. Plesset & Prosperetti 1977)
and the timescale tin necessary for R to grow to the value R, under these inertia- dominated conditions is therefore of the order of
Another factor limiting bubble growth, however, is the gas flow rate through the needle. By use of (5 ) we find the following expression for the relevant timescale t,:

Bubble growth and detachment from a needle 115 where VF = 2nR;. When ti, < t,, the limiting growth factor is the gas mass supply rather than inertia. The ratio of these two quantities is
and tends to be small in most cases due to the smallness of a and the moderate value of the pressure difference. This argument indicates that the initial transient, during which surface tension and inertia are important, is normally brief. Assuming that RF >> a, so that the surface tension overpressure in the right-hand side of (10) is negligible, and neglecting the inertia terms in the left-hand side, we find p B x p, . In these conditions the density in the bubble remains very nearly constant so that one expects the greatest part of the growth process to take place at the constant volumetric rate Q given by (5).
As the bubble grows, it is subject to buoyancy and hydrodynamic forces. With the neglect of drag, these reduce to added mass so that one may write
where 2 is the position of the bubble centre with respect to the needle tip. For the added mass coefficient Davidson & Schuler (1960) use 8 to account in an approximate way for the presence of a wall tangent to the growing bubble (see e.g. Milne-Thompson 1960, section 16.31). Here we assume that the needle is much longer than the bubble radius and therefore a standard value $ applicable to a sphere in unbounded liquid is appropriate. With Z(0) = 0 and disregard of the initial bubble volume V,(O) so that VB x Qt, (16) gives
Z(t) = &2. (17)
At the time
the bubble centre has risen above the needle top by an amount equal to its radius
One thus expects a major difference in behaviour according to whether R is smaller or greater than R,. In the first case the gas flow rate is small and the bubble will only detach when R x R,. All bubbles will therefore leave the needle with the same radius irrespective of the gas flow rate. In the second case, on the other hand, the bubble radius at detachment will be proportional to Qa as suggested by (19). The same analysis can be cast in terms of a critical gas flow rate
such that all the bubbles growing at a rate Q < Q,, detach from the needle with a volume V, N VF, while bubbles growing at a faster rate leave the needle with a volume proportional to Q!.
To test these predictions we integrate numerically (10) and (16). Initially, the bubble is assumed to have radius a and internal pressure pc . The integration is carried out up to the point of detachment from the needle. As we shall see from the full boundary

116
8 -
H . N. O&z and A . Prosperetti
l
2 (4
8
f 6 - . . v
2
. . . i . . . . . i . . . . . . . . i . . . . . . . . . . . . . . . . . . . . ' _
L 4
0 25 50 I 5 100 125 Time (ms)
FIGURE 1. Radius (solid line) and position of the centre of the bubble versus time as computed from the spherical approximation of 83. The needle radius is 1 mm,p, = 1.02 bar, p m = 1 bar, and the flow resistance parameter would correspond to a needle equivalent length of 1 m in (a) (Q = 43 826 mm3/s) and 50 m in (b) (Q = 876 m 3 / s ) . Of course, the corresponding flow resistance can be achieved by other means without recourse to such long needles.
integral simulations, when the bubble leaves the needle, the distance from its centre to the needle tip is approximately one needle radius larger than its radius. Therefore we adopt the condition
as the criterion for detachment. As mentioned above, when the flow rate is small, this condition may be met early in the process when the gravitational force is still not sufficiently large to overcome surface tension. To simulate this behaviour approxi- mately, we add the downward surface tension force
Z(t) = R(t) +a (21)
- 2nag (22) to the right-hand side of (16) when Z is greater than R. Figure 1 is a plot of R(t) (solid line) and Z(t) (dotted line) for one case with Q > Q,, and one case with Q < QcT. In the first instance, the growth is relatively fast and, therefore, when 2 = R+a, the radius

Bubble growth and detachment from a needle 117
10-2 loo 10' 102 103
QfQ,
FIGURE 2. The volume of the detached bubble scaled with the static bubble volume V, (see (11)) versus the gas volumetric flow rate non-dimensionalized with respect to the critical value given by (20) for various needle radii. The open symbols are the results of the full numerical simulations and the corresponding parameter values are given in table 1. The black symbols are results obtained from the simplified spherical model of $3, For these, pc ranged between 1.002 and 1.1 bar, I between 0.1 and 10 m, and p , = 1 bar.
is already greater than R, and the surface tension force has a negligible effect on the detachment dynamics. In the second case, however, the motion in the z-direction becomes oscillatory due to the crude step-like action of the surface tension force (22) in the negative z-direction. The full numerical results indicate that, actually, these translational oscillations are an artifact of the crude way in which the effect of surface tension is accounted for by (22).
With the simple model of this section each simulation takes very little computer time and we have carried out a large number of them covering a wide range of parameters. The approximate conclusions drawn from (11) and (20) suggest that, in a plot of the bubble volume at detachment V' normalized by the Fritz volume V, = ;nR$ versus Q/Q,,, the results should fall approximately on a single curve. This is indeed found to be the case as shown in figure 2 where a well-defined straight line with a slope of as predicted by (20) is obtained for Q/Q, , > 1. In this figure the solid symbols have been obtained from the simple model of this section, while the open symbols represent the result of the full numerical simulations to be described below. The parameter values and conditions corresponding to the open symbols are give in table 1. Those for the solid symbols are too numerous to be given in detail. Suffice it to say that p c ranged between 1.0018 and 1 .I bar and 1 between 0.1 and 50 m. The ambient pressure p , was 1 bar in all cases and the needle radii are given on the figure. Evidently, the spherical bubble approximation is not very accurate in the slow-growth regime where the smallness of inertia, which tends to promote sphericity, renders the detailed effects of surface tension and gravity significant. Nevertheless, the constancy of the bubble

118 H. N . Og'uz and A . Prosperetti
a (mm) pc-prn (bar) (m) Q (mm3/4 R, (mm) Q/Q,, v/ v, 0.1 0.0148 0.020 162 1.072 0.5044 1.108 0.1 0.0148 0.010 324 1.121 I .009 1.267 0.1 0.0148 0.006 540 1.146 1.683 1.353 0.1 0.0148 0.003 1080 1.606 3.363 3.729 0.1 0.0148 0.001 3 240 2.558 10.091 15.07
0.27 0.00540 0.04 1559 1.816 2.125 1.997 0.27 0.00541 0.04 1564 1.817 2.132 2.003 0.27 0.00630 0.04 1821 1.913 2.483 2.336 0.27 0.00541 0.01 6254 3.277 8.526 11.75
1 .o 0.001 8 10 391 2.203 0.179 1 0.9597 I .o 0.0200 50 876 2.355 0.401 6 1.1728 1 .o 0.001 8 2.5 1563 2.508 0.7163 1.4172 1 .o 0.001 8 1 3 909 3.023 1.791 1 2.4807 1 .o 0.0020 1 4 344 3.106 1.990 1 2.6908 1 .o 0.0040 2 4 346 3.101 1.9914 2.6780 1 .o 0.0200 10 4382 3.102 2.007 4 2.680 1 1 .o 0.001 8 0.5 7816 3.783 3.581 4.8628 1 .o 0.1000 10 22780 5.822 10.44 17.725 1 .o 0.001 8 10 39 090 7.152 17.91 32.875 1 .o 0.1000 100 227 000 13.71 104.4 231.56
2.0 0.000730 256 99.1 2.5940 0.02546 0.783 0 2.0 0.000730 128 198 2.6384 0.050 89 0.823 9 2.0 0.000730 1 6338 3.0545 1.629 1.278 5
TABLE 1. Parameter values and conditions for the full numerical simulations shown in figure 2
volume predicted by the previous simple argument for Q < Q,, is approximately satisfied if at a level about 10% smaller than the Fritz volume.
4. Mathematical model and numerical method We now describe the mathematical model and the numerical methods used for the
detailed calculation of the bubble shape and volume. We neglect viscous effects and assume the flow to be irrotational so that a velocity
potential exists, u = Vq5, with V2# = 0. For the generation of single bubbles this approximation is justified by the highly transient nature of the process and, indeed, the results are in excellent agreement with experiment as shown in $5. When a chain of closely spaced bubbles is generated, however, an error is introduced by the neglect of wake effects. Nevertheless, in this case also the results are good, as shown below.
We use the Bernoulli integral to express pL, the pressure on the liquid side of the bubble surface, and substitute it into the normal stress balance equation (1) to find the following expression for the rate of change of the potential of a numerical fluid particle on the bubble surface :
where g is the gravity vector and x is the position vector of the surface particle. As in the approximate model of the previous section, the bubble internal pressure p B is given by (9) with m(t) calculated from (7). On the surface of the needle in contact with the liquid the normal fluid velocity vanishes,
n.V# = 0. (24)

Bubble growth and detachment from a needle 119
To limit the number of parameters of the model, we neglect the base of the needle so that no other boundaries exist. In practice, this amounts to assuming the length of the needle to be much greater than the radius of the bubbles. The Laplace equation subject to the Dirichlet condition arising from the time integration of (23) and to the Neumann condition (24) constitutes a mixed boundary value problem for the velocity potential q5 that will be solved numerically by a boundary integral method as described below. With 4 known, the position of the interface is calculated by integrating in time
for each surface particle. This basic description of the mathematical model must be complemented by a few
details. In the first place, we assume that axial symmetry prevails so that the needle is parallel to the acceleration of gravity. This prevents us from studying such situations as the shearing of a bubble off the needle by a cross-flow, or the detachment from a non-vertical needle. On the other hand, the resulting simpler calculation enables us to carry out a more exhaustive exploration of parameter space.
Secondly, again for simplicity, the needle wall is assumed to have zero thickness. The calculation is started with the bubble surface attached to the needle mouth. In some rapid-growth cases, the bubble surface bows outward and the angle 0 between its tangent at the contact line and the outer wall of the needle decreases. Whenever this angle becomes less than 90°, the bubble surface is moved downward away from the needle tip so as to restore the 90" angle. As the growth slows down, gravity pulls the bubble upward and the angle tends to increase. It is nevertheless kept at 90" by again displacing the contact line - this time upward - until it returns to the needle mouth, where it remains until the bubble has grown and detached. In some cases, we continue the calculation past this point and it may happen that a small piece of interface at the root of the bubble 'snaps' back towards the needle. Again we maintain a 90" angle by displacing the line of contact into the needle until the pressure is sufficient to push it back toward the mouth. This '90"-rule' is a simple approximation to the contact-angle hysteresis phenomenon that has the advantage of not involving specific material properties. In any event, these displacements of the contact line occur in only a few cases and affect only short fractions of the bubble's life, so that one would not expect significant differences from the use of other values for the advancing and receding contact angles.
The potential problem is solved by a version of the boundary integral method that is virtually the method of choice for time-dependent, potential free-surface flows (see e.g. Guerri, Lucca & Prosperetti 1982; Blake, Tain & Doherty 1986, 1987; Oguz & Prosperetti 1989, 1990).
For the problem at hand we have found no special stability concerns and therefore we use the simpler version of the method outlined, for example, in Oguz & Prosperetti (1989) rather than the more elaborate one of Oguz & Prosperetti (1990).
We introduce a cylindrical coordinate system ( I , z) with the z-axis coincident with that of the needle. The liquid is bounded by the bubble surface S, and by the needle outer (and possibly inner) wall, denoted by S,. These surfaces are represented by their traces in the meridian ( r , 2)-plane. On the bubble surface the potential is know from the time integration of (23), and differentiation along the surface furnishes the tangential component of the liquid velocity. On the needle, the normal velocity is fixed by (24). It therefore remains to determine the normal component of the velocity on the bubble surface, and the tangential component (or the value of the potential) on the needle wall.

120 H. N . Oguz and A . Prosperetti
FIGURE 3. Illustration of the geometry near the circle of contact of the bubble surface S, and the needle S, and of the quantities appearing in (28).
For both purposes we resort to Green’s identity written for the generic boundary point X = (R, Z ) . After integration over the ignorable angular variable, we find (see e.g. Jaswon & Symm 1977)
J sl3 J siv
Here rPn denotes the normal derivative of $ along the normal directed away from the liquid and r(s), z(s) are the coordinates of the integration point along the surface. The functions G and H are obtained from the angular integration of the Green’s function 1X-xl-l and its normal derivative and are given by
2r a K(m) H(R, Z , r, z ) = 2r K(m) G(R, Z , r, z) = -- n: A; ’ x an ~t ’ (27)
where A = ( R + r ) 2 + ( Z - z ) 2 , m = 4rR/A,
and K is the complete elliptic integral of the first kind. In writing (26) it has been assumed that a well-defined tangent to the surface exists at X. This is true at all points except possibly at the point C of contact of the bubble surface with the needle. For this special point, q5 in the left-hand side of (26) must be multiplied by O/z, where 6’ is the (positive) angle between the needle wall and the tangent to the bubble interface measured in the liquid. The point C must be treated in a special way also in that it belongs simultaneously to S, and S,. Since the interface cannot completely detach from the needle, C can only move up and down the needle so that the boundary condition (24)’ with n the normal to the needle wall, must apply to it. But since it also belongs to S,, for consistency, the component of the velocity tangential and normal to the bubble surface at C must also add up to a zero velocity in the direction normal to the needle wall, so that (figure 3)
n,-V$(,-sinOt.V$I, = 0, (28)

Bubble growth and detachment from a needle 121
where t is the tangent vector oriented away from the needle. The calculation of the tangential derivative of 4 along S, involves the value of the potential at C, which is itself unknown. This circumstance requires an iterative procedure to satisfy (28). As explained before, the angle 0 is constrained to be greater than, or equal to, :n as long as the point C is at the needle mouth, ad it is constrained to equal in at any other location.
calculating the integral From a knowledge of q5n on S, the bubble volume
PB = 27~ S,, q5n r ds.
growth rate is obtained by
(29)
The numerical implementation of the procedure is quite standard and here we only present the essential information. The bubble boundary is initially represented by 5-10 points depending on the complexity of the initial shape. As the bubble grows, more points are added so as to preserve the initial resolution. We limit the total number to 80, which several numerical experimental experiments have shown to be sufficient. Along the needle wall, the discretization is comparable to that along the bubble surface near the mouth, but gradually becomes coarser farther away. We use a total of 20 points arranged so as to cover a length equal to 30 needle diameters. Beyond this point, the integral is truncated. We have conducted the usual convergence tests and found that the discretizations adopted were sufficient for a good accuracy.
The bubble surface coordinates R and 2, the potential 4, and its normal derivative $n, are defined at the discrete boundary points. Cubic splines are used for a continuous interpolation of these quantities. The spline parameter is taken to be the linear distance between two neighbouring points, a procedure which, according to our past experience (Oguz & Prosperetti 1989, 1990), yields an excellent approximation to the surface. For the unknown quantities, q5n over S, and q5 over S,, we use a linear piecewise approximation to the spline parameter. By numerically evaluating the integrals in (26) with the six-point Gauss-Legendre quadrature formula, we form a linear system of equations for q5n over S , and 4 over S, that is solved by L-U decomposition.
Some of the integrals resulting from the discretization of (26) contain a logarithmic singularity that is handled in a particularly efficiently manner as follows. Consider the identity
I = f ( x ) log (x) dx = V(X) -f(O)] log (x) dx -f(O). (30) I: 1: The first integral is non-singular and can be evaluated by any standard technique. When Gaussian quadrature is employed, rearranging some terms, we find
(31) 1 m m I = Z f ( X i ) Wi log xi -f(O) 1 + 2 wi log xi ,
1=1 [ i-1
where the xi are the quadrature points and the wi the quadrature weights. It is apparent that the quantity in square brackets would not be present if the standard Gaussian quadrature formula were used to calculate the original singular integral, and therefore it may be considered as a correction to the error incurred in using this formula for the calculation. For instance, for m = 6, this error is
6
l+~ lOg(x , )w , =0.1126107. i=l
5
(32)
FLM 257

122 H. N . Oguz and A . Prosperetti
With this remark, from (31) it is seen that one can use the standard Gaussian quadrature formula in both the regular and singular cases, provided the correction embodied in the last term of (31) is added in the latter one. This procedure is superior to other techniques since the sequence of the calculation is the same in both situations and the integrand does not have to be modified as suggested by the identity (30) in the singular cases. The integrals (29) are also calculated by means of cubic splines and Gaussian quadrature.
In the numerical examples discussed in the following sections the calculation is started with a hemispherical bubble at the mouth of the needle.
Time integration of the Bernoulli equation (23) and of the bubble surface position (25) is carried out by an implicit second-order scheme based on the trapezoidal rule. Because of this implicitness and of the corner condition (28) already discussed above, iterations are necessary at each time step. Usually, less than 10 iterations are necessary for the maximum correction to become less than 0.1 %. The numerical results indicate that the residual error does not accumulate in time.
Usually the time-integration step is limited by the presence of short, high-frequency capillary waves that, although unimportant for the description of the process, must be resolved for a successful computation. If As is the minimum distance between surface nodes, the period of these oscillations is of the order of (Asla): times a capillary timescale defined by
The time step used in the integration is based on the maximum rate of variation of the surface values of q5, on the velocity of the surface points, and on the gas mass flow rate, and normally ranges between 0.01 t, and 0.02 t,.
There are cases, however, in which other scales shorter than t , render the problem stiff. One such situation typically arises in the early stages of the growth process when the numerical error in the representation of the free surface causes slight inaccuracies in the evaluation of the bubble volume and volume growth rates, which result in high- frequency, small-amplitude volume pulsations. The problem could possibly be take care of by increasing the resolution of the free surface, but this would introduce even shorter capillary waves and constrain the time step to an unreasonable degree. To circumvent this difficulty, we have recourse to an approximate model in which the gas is treated as incompressible. This method is reasonable because, in this early stage, the growth rate is slow and the pressure differencep, _pB very small so that the gas density is indeed very nearly constant. To implement this idea, we use (4) assuming pG = const. to find
(33) t, = (pa3/a)!
which, with vB obtained from the boundary-integral method, furnishes pB directly, bypassing the equation of state (9). The order of magnitude of the period of volume oscillations can be estimated from Minnaert's formula (see e.g. Plesset & Prosperetti 1977) with an equivalent radius and is
(3 5 )
When the time step would be greater than tvol, we switch to the incompressible formulation.
Another such situation arises when the flow resistance parameter (6) is very small.

Bubble growth and detachment from a needle 123
FIGURE 4. Comparison between the bubble shapes calculated in the present study (top) and the experimental ones published in figure 19 of Longuet-Higgins et al. (1991) (reproduced with permission (bottom). The inner needle radius is 2 mm, p c = 1.00073, p m = 1 bar, 1 = 128 mm. Time in ms. The gas flow parameter Q defined in ( 5 ) in this case is 198 mm3/s.
To see the origin of this difficulty, in (4) we let p; -pk x 2pc(pc -pB) and eliminate pB using (9) to find
where (37)
is a timescale for the gas mass flow rate. When t , is very small, e.g. for large-diameter or very short needles, this becomes the controlling timescale. However, in such situations, ps is very close to p c so that the previous incompressible approximation is again appropriate.
We have run numerous tests to assure ourselves that the details of the switching between the full formulation and the incompressible approximation had a negligible
5-2

124
-800 -600 -400 -200 0
Time (ms)
FIGURE 5. Time evolution of the different components of the system energy for the case of figure 4: -, total energy; - - -, kinetic energy, (38); ---, gravitational potential energy, (39); -. - ., surface tension energy; ---, pressure energy, (40).
impact on the final results as well as on the time evaluation of the most important quantities such as the total energy.
The last aspect of the numerical procedure that needs to be addressed is the detachment of the bubble. During the calculation we monitor the minimum distance of the free surface from the axis of symmetry, which we refer to as the neck radius. When the distance becomes equal to elu, with el 4 1 an adjustable parameter, the bubble is detached as follows. The two points above and below the neck where the free surface is at distances e2u from the axis, with c e2 < 1 are located. These points are joined to the symmetry axis by means of circular arcs with zero slope on the axis and matching slopes where they join the surface. The potential on these arcs is taken to be constant, so that its tangential gradient on the axis vanishes. The procedure is carried out instantaneously, and therefore it is necessary to reset the velocities of the surface points to continue the time integration. The radial velocity is interpolated linearly proportional to the radial distance from the axis. The axial velocity is taken to be constant. For the examples presented here we have used el = 0.1, c2 = 0.2. Numerical tests have revealed minimal sensitivity to these parameters and the comparison with experiment to be described below is quite favourable. Furthermore, the system’s energy is conserved quite accurately by the algorithm. These tests, and the fact that any such procedure would necessarily contain some degree of arbitrariness, suggest that there would be little reason for attempting to improve on the above technique.
After the detachment of a bubble, the gas region consists of disjoint volumes. For the one attached to the needle the isothermal pressure-volume relation is used as explained before. However, for the detached gas bubble, the adiabatic pressure-volume

Bubble growth and detachment from a needle 125
FIGURE 6(a). For caption see page 131.
relation is used with an adiabatic index y = 1.4. This procedure neglects thermal damping effects.
5. Comparison with experiment To validate the computational procedure and its implementation we now simulate
numerically two experimental examples of bubble growth and detachment. The first one has been published by Longuet-Higgins et al. (1991) and is for the quasi-static growth and detachment from a 4 mm diameter needle. The second experiment has been done in our laboratory with a finer needle but under conditions of relatively rapid growth.

126 H. N . Oguz and A . Prosperetti
FIGURE 6(b) . For caption see page 131.
Figure 4 reproduces in the lower part of figure 19 in Longuet-Higgins et al. (1991) and compares the observed bubble shapes with the corresponding ones computed in this study. To obtain these results we adjusted the flow resistance parameter Bf defined in (7) so as to match the observed detachment time. This led to the choice p c = 1.00073 bar, p , = 1 bar, pG = 1.81 x g/cm s, and T = 20 "C, a = 2 mm, 1 = 6.4 m. Actually, in this case of very slow growth, the values of these quantities are not important as the process depends on the combination gf rather than on them individually. The gas flow resistance was increased by inserting a valve in the gas line rather than by using a long needle, and the value of 1 quoted above must be understood as an equivalent length.
The agreement of computed and observed bubble shapes is remarkably good. In

Bubble growth and detachment from a needle 127
FIGURE 6(c) . For caption see page 131.
particular, the capillary waves that are excited by the detachment process are reproduced quite accurately. It should be noted that, in the experiment, the bubble is observed slightly from below, and also that the photographs cannot show the inward curvature of the bubble base after pinch-off predicted by the calculation.
Figure 5 shows, for this simulation, the time evolution of the different contributions to the energy of the system. Time is in ms, while energies are non-dimensionalized with respect to ga2 which equals 2.912 x lo-' J in this case. The kinetic energy is obtained from

128 H . N . Oguz and A . Prosperetti
FIGURE 6(d). For caption see page 131.
the excess capillary energy is a(,", - 2na2), the gravitational potential energy is
EG = -ips lsB z x - n dS, (39)
(recall that the mouth of the needle corresponds to z = 0), and the pressure energy (which equals the negative of the work done on the system) is

Bubble growth and detachment from a needle 129
FIGURE 6(e) . For caption see page 131
The total energy is normalized by subtracting out the initial energy, and the degree to with which this total energy remains zero gives an indication of the accuracy of the computation. The point of detachment is clearly identifiable due to the rapid growth of the kinetic, capillary, and potential contributions. If the volume of the detached bubble is plotted versus time, it is found that the amplitude of the oscillations decreases in spite of the absence of damping effects in the pressure-volume relation. This is due to the exchange of energy with the gas pocket still attached at the needle mouth.
For a second example we ran an experiment using a 40 mm long needle with an inner diameter of 0.54 mm and an outer diameter of 0.9 mm in a 0.1 x 0.1 m2 Plexiglas container. The needle was connected by a 1.60 m long, 5-6 mm internal-diameter tube

130 H. N . Oguz and A . Prosperetti
FIGURE 6 0 . For caption see facing page.
to a precision valve connected to the laboratory’s compressed air line regulated down to approximately 1 bar. The tip of the needle was submerged at a depth of 0.15 m. On the basis of (2) we then estimate the threshold pressure to initiate growth to be approximately 2 kPa above ambient. The pressure in the air line was not measured directly, but we can infer that it was quite close to this value since it was observed that single bubbles or groups of two-three bubbles were emitted together with an appreciable delay between events. This behaviour implies that the minute pressure decrease in the line due to the removal of the corresponding amount of gas was sufficient to bring p c below the value (2). High-speed films of the bubble growth and departure were taken at 2000 frames per second. After the experiment, it was realized

Bubble growth and detachment from a needle 131
FIGURE 6. Comparison between experimental and calculated bubble shapes for a 40mm long, 0.27 mm inner radius needle. Here pc = 1.020 11, p , = 1.0147 bar. Times in ms. The calculation was stopped at t = 4.5 ms, but some of the subsequent experimental bubble shapes are also shown. The gas flow parameter Q defined in (5) in this case is 1564 mm3/s.
that the needle was approximately 2" inclined to the vertical, which introduces a slight asymmetry not present in the numerical simulation.
We show in the left-hand part of figure 6 several frames of a sequence in which three bubbles successively grow and detach from the needle. The computation was carried out only up to near the end of the growth of the second bubble, which required approximately 10000 time steps. Comparison between predicted and observed bubble shapes after 9.5 and 13 ms shows the formation of a thin gap between the growing

132 H. N. Oguz and A . Prosperetti
FIGURE 7. Time evolution of the different components of the system energy for the case of figure 6: -, total energy; - - -, kinetic energy, (38); ---, gravitational potential energy, (39); -.-., surface tension energy; ---, pressure energy, (40).
second bubble and the bottom of the departing first bubble. This gap is not as thin in the simulation, which probably indicates the importance of viscous effects neglected in the model. This circumstance, and the increased cost of the computation due both to the increasing time and the increasing number of discretization points, suggested to terminate the simulation at this point. The calculation was otherwise quite stable and numerically well-behaved. To obtain these results the resistance parameter 9? was computed on the basis of the geometric data of the needle and the chamber pressure p c was set 1.020 11 bar above p , = 1.0147 bar. We ran a simulation also for pc = 1.020095 bar, which represents a variation of a factor of 7 in pc-pm -2a/a, finding identical results.
As in the previous case, the computational results are in remarkable agreement with experiment. The time history of the different contributions to the system’s energy up to the point of detachment of the first bubble is show in figure 7. The twenty-fold difference in the ordinate scale with figure 5 shows how strongly the present growth process differs from the previous one. Nevertheless, as before, the growth is basically the result of a balance between pressure and capillary energies in spite of the faster rate.
For this case the nominal gas volumetric flow rate based on (5) is Q = 1564 mm3/s. The formula (8) gives Q = 6866 mm3/s, so that gas momentum effects are not completely negligible. Nevertheless, from the agreement between experiment and computation, they cannot be very important. The photos show, however, a small bump opposite the needle which is possibly due to the impinging gas jet.
To give an idea of the importance of the flow resistance offered by the needle we show in figure 8 a comparison of the height (upper panel) and maximum horizontal width of the first bubble as a function of time for the actual needle length of 40 mm

Bubble growth and detachment from a needle 133
Time (ms)
-30 - 20 -10 0 10 Time (ms)
FIGURE 8. Comparison of calculated (-) and experimental (0) results for the height and width of the bubble of figure 7. The dashed line is the theoretical result for a 10mm long needle and demonstrates the importance of the gas flow resistance.
used in the experiment and for a hypothetical 10 mm long needle. The dots are data measured from the frames of the high-speed film after digitizing on 512 x 512 pixel images. The needle diameter provided the reference length. With a shorter needle the bubble grows substantially faster, and the resulting relative translational flow between its centre of volume and the surrounding liquid causes a pronounced ‘fattening’ of the equatorial region. The experimental bubble height is somewhat higher than the simulated one, possibly the effect of a weak circulatory flow set up in the tank by the previous bubbles or the gas momentum previously mentioned.
The favourable results of these comparisons with experiment give confidence in the accuracy of the method and its predictions which it is interesting to illustrate further.
6. Stabilization of bubble growth The reasons preventing the generation of small bubbles from small needles or orifices
unless special precautions are taken were discussed in $2. It was however pointed out

134
2.4
W
m .z 1.6 a E c,
c( 8 .* 9 w" 0.8 s
H. N . Oguz and A. Prosperetti
Needle length /
6 mm 10 mm 20 mm
_ - --
0 10 20 30 40 Time (ms)
FIGURE 9. Equivalent radius of the detaching bubble for various gas flow rates in a 0.1 mm radius needle; pc = 1.0295, p , = 1.0147 bar. The values of the gas flow parameter Q corresponding to the various needle lengths are, from bottom to top, 162, 324, 540, 1080, 3240 mm3/s.
that the viscous resistance in the air supply system could be used to stabilize the process and release small bubbles with an accurate control of their size and frequency. We now demonstrate this effect.
Figure 9 shows as a function of time the equivalent radius
of bubbles growing out of a 0.1 mm radius needle for several values of the coefficient Br This quantity was varied by varying the needle length 1 and keeping all the other parameters constant with pc = 1.0295 bar, p , = 1.0147 bar. The curves terminate at the point at which the bubble detaches. It can be seen that it is possible to have more than a factor of 2 variation in the radius of the bubble produced by the same needle subject to the same pressure difference as 1 varies between 1 and 20mm. The corresponding bubble shapes during growth for 1 = 1, 6, and 20 mm are shown in figure 10. In the first case, figure lO(a), I = 1 mm, the growth is very rapid and inertia plays an important role. The surface of the bubble initially moves downward away from the needle exit until the bubble is pulled up by buoyancy. The centre-of-volume velocity relative to the liquid is appreciable, which causes the bubble horizontal diameter to increase. In the other two cases the bubble appearance is quite different and, although the growth times differ by a factor of 3, the detachment radius is very similar as argued in $3 and illustrated in figure 2.
Figures 1 1 and 12 show the results of similar calculations for a larger needle, a = 1 mm but a much higher flow resistance that, in terms of needle length, would correspond to 1 = 0.5 m (figure 12a) and 10 m (figure 12b). In practice, such large

Bubble growth and detachment from a needle
(4
135
FIGURE lO(u, 6). For caption see next page.

136 H . N . Oguz and A . Prosperetti
FIGURE 10. Growth sequences for some of the bubbles of figure 9. (a) I = 1 mm, Q = 3240 mm3/s; (b) 1 = 6 mm, Q = 540 mm3/s; (c) I = 20 mm, Q = 162 mm3/s. In the first case, due to the rapidity of the growth, the contact line initially moves down along the needle.
resistances would be more easily provided with a suitable constriction at the base of the needle than with a very long and thin gas duct. Note that Z/a4 = lo4 mm-3 both for a = 1 mm, and 2 = 10 m and a = 1 mm, so that the flow resistances in the two cases are comparable.
The point of these examples is to emphasize the strong effect of the parameter gf on the bubble growth and detachment size, and indicates that optimization to suit specific needs is possible.
There are two other physical aspects of bubble production that we have not touched upon so far, but that could also be controlled by exploiting the flow resistance coeficient. The first one is the effect of the chamber volume, documented by several researchers (see e.g. Kumar & Kuloor 1970; Marmur & Rubin 1976; Tsuge & Hibino 1983), but apparently not fully understood. While in part this effect may be due to the flow rate into the bubble, and is therefore intertwined with the role played by gf, we believe that a major component is the presence of acoustic waves in the chamber, possibly excited by the pressure pulse associated with the bubble detaching from the needle. The orders of magnitude that derive from this hypothesis are consistent with observation. Clearly, a suitably large value of Bf would be beneficial in dampening out the influence of these acoustic waves.
Secondly, a sort of interference among several needles or orifices fed by a single chamber is observed (see e.g. Titomanlio, Rizzo & Acierno 1976). Again we believe that the source of this behaviour is to be found in acoustic waves in the chamber, the

0 40 80 120 160 200 Time (ms)
FIGURE 11. Equivalent radius of the detaching bubble for various gas flow rates in a 1 mm radius needle; p c = 1.0165, p , = 1.0147 bar. The values of the gas flow parameter Q corresponding to the various needle lengths are, from bottom to top, 391, 1564, 3909, 7816, 39086 mm3/s.
effect of which could be suppressed by the individual feeding of the needles through suitably large resistances.
As a final point, we consider the process by which the gas neck connecting the bubble to the needle collapses to a point and the bubble is released. During this stage the radius of curvature of the neck in the meridian plane is much larger than that in a plane orthogonal to the symmetry axis so that the situation, locally, is similar to that of a radially collapsing cylinder, i.e. a two-dimensional sink. On the other hand, at some distance from this region, to leading order the flow must resemble that of a three- dimensional sink. One might therefore anticipate that the actual behaviour would share some characteristics of both a two- and a three-dimensional sink. The asymptotic time dependence for the latter case is readily found from the Rayleigh-Plesset equation (10) by substituting R cc (to - t)”, with to the point of total collapse. By keeping the right-hand side constant, which assumes an inertia-dominated flow, it is readily found that, to balance the leading-order singularity, it is necessary that 01 = g. For the two- dimensional sink flow, as is well known, the argument cannot be made as clear-cut as the sink solution of the two-dimensional Laplace equation is proportional to the logarithm of the distance from the axis and, therefore, cannot be made to vanish at infinity. However, if one assumes an outer surface of radius L‘, a development parallel to that leading to the derivation of the Rayleigh-Plesset equation leads to
(ss’+s”log-++s~ 1-- =-, z * ( 3 Pm-PB P
where now the radius of the cylindrical cavity has been denoted by S and the notation

138 H. N . Oguz and A . Prosperetti
FIGURE 12. Growth sequences for some of the bubbles of figure 11. (a) 1 = 0.5 m, Q = 7816 mm3/s; (b) I = 10 m, Q = 391 mm3/s. The flow resistances provided by the needle lengths 1 quoted can of course be achieved by other means.
is otherwise similar to that of (10). As S- t 0 with S + 00, the most singular term is the one containing the logarithm and, preceding as before, we find the asymptotic behaviour S cc (to - t);, as given by Longuet-Higgins et al. (1991) on the basis of a somewhat different argument.
We can test these simple predictions by plotting the numerically computed minimum radius of the gas neck as a function of time near the instant of bubble detachment. A

Bubble growth and detachment from a needle
10-2 lo-'
.....
.....
..... J
; .....
i
- /- . 5
. ,..I.# .. , +.*
..............
100 10'
139
to- t
FIGURE 13. Neck radius as a function of ( t o - t ) for a 2mm radius needle and pc = 1.00073, p , = 1 bar: -, I = 2 m, - - -, 1 = 128 m, ---, 1 = 265 m (as usual, these must be understood as equivalent lengths). The upper solid line has a slope of +, corresponding to a two-dimensional sink flow, and the lower solid line one of i, as for a three-dimensional sink flow.
few examples are shown in figure 13 where the upper and lower solid lines correspond to (to - t): and (to - t); respectively. The computed results, indicated by the other lines, conform to the previous expectations.
7. The effect of an imposed flow The preceding analysis has shown that, for a given needle, the smallest bubble that
can be produced has a radius of the order of the Fritz radius (1 1) but not smaller. Since this is proportional to a+, exceedingly small needles - or orifices - are needed for very small bubbles. This approach evidently encounters difficulties associated with the manufacturing of such thin needles, their fragility, and the increased probability of occlusion. In addition, the quasi-static production of bubbles is necessarily slow, which cuts down on the allowable rate. For these reasons we have studied the possibility of decreasing the bubble size and increasing the bubble formation rate by imposing an upward flow parallel to the needle. This technique could also be useful for the generation of small bubbles in reduced gravity. Some experimental results of this process has been published by Chuang & Goldschmidt (1970), who pointed out the importance of viscous drag forces. Here these are neglected, and therefore our results will tend to overestimate the volume of the detaching bubbles.
The mathematical model is the same as that outlined in 94 with the only exception that the least velocity potential is now taken to be
4T = UZ+$, (43)

I40 H . N . Oguz and A . Prosperetti
FIGURE 14. Growth sequences of bubbles from a 1 mm radius needle immersed in an upward liquid flow with velocity of 0.5 m/s in (a), and 1 m/s in (b). p c = 1.0165, pm = 1.0147 bar, 1 = 0.5 m, Q = 7816 mm3/s.
where U is the imposed velocity, and the boundary integral method is applied to the calculation of the disturbance potential @ rather than the total potential &.
Two examples of the results are given in figures 14(a) and 14(b) for a needle with a radius of 1 mm and a length of 0.5 m (or equivalent gas flow resistance), with U = 0.5 and 1.0 m/s respectively. These cases may be compared with figure 12 showing the
Bubble growth and detachment from a needle 141
t 1 0 50 100 150 200
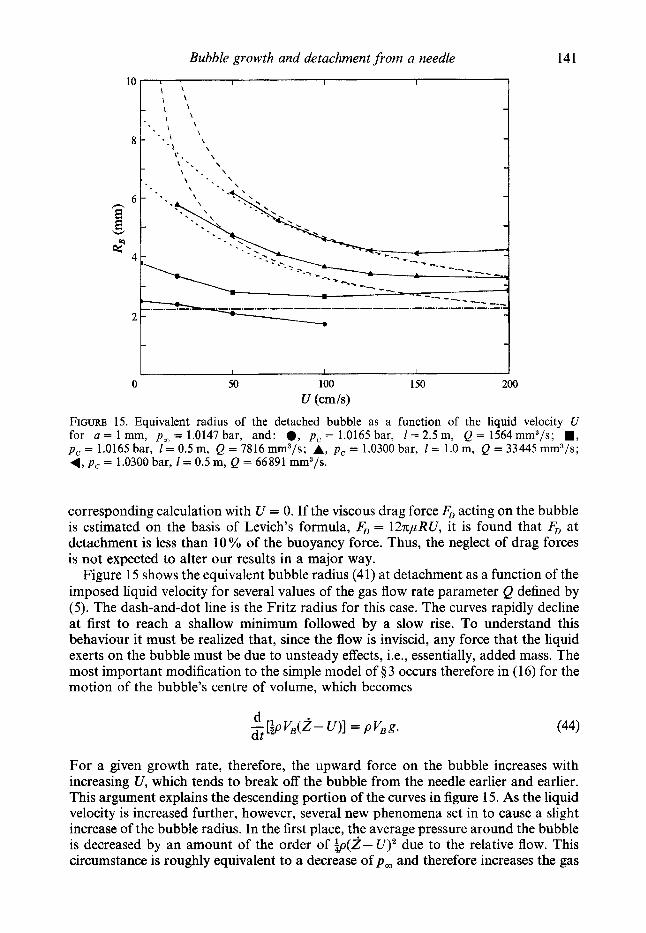
U (cmh) FIGURE 15. Equivalent radius of the detached bubble as a function of the liquid velocity U for a = 1 mm, p , = 1.0147 bar, and: 0 , p c = 1.0165 bar, 1 = 2.5m, Q = 1564mm3/s; ., p c = 1.0165 bar, 1 = 0.5 m, Q = 7816 mm3/s; A, p c = 1.0300 bar, 1 = 1.0 m, Q = 33445 mm3/s; 4, p c = 1.0300 bar, 1 = 0.5 m, Q = 66891 mm’/s.
corresponding calculation with U = 0. If the viscous drag force FD acting on the bubble is estimated on the basis of Levich’s formula, FD = 127c,uuRU, it is found that FD at detachment is less than 10% of the buoyancy force. Thus, the neglect of drag forces is not expected to alter our results in a major way.
Figure 15 shows the equivalent bubble radius (41) at detachment as a function of the imposed liquid velocity for several values of the gas flow rate parameter Q defined by (5) . The dash-and-dot line is the Fritz radius for this case. The curves rapidly decline at first to reach a shallow minimum followed by a slow rise. To understand this behaviour it must be realized that, since the flow is inviscid, any force that the liquid exerts on the bubble must be due to unsteady effects, i.e., essentially, added mass. The most important modification to the simple model of 4 3 occurs therefore in (16) for the motion of the bubble’s centre of volume, which becomes
For a given growth rate, therefore, the upward force on the bubble increases with increasing U, which tends to break off the bubble from the needle earlier and earlier. This argument explains the descending portion of the curves in figure 15. As the liquid velocity is increased further, however, several new phenomena set in to cause a slight increase of the bubble radius. In the first place, the average pressure around the bubble is decreased by an amount of the order of +p(Z- U ) 2 due to the relative flow. This circumstance is roughly equivalent to a decrease of p , and therefore increases the gas

142 H . N . O&z and A . Prosperetti
FIGURE 16. The shapes of bubbles about to detach from a 0.1 mm radius needle with p c = 1.0295, p , = 1.0147 bar for different liquid velocities U and needle lengths I (or gas flow rates Q). The first row is for U = 0, the second one for U = 0.3 m/s, and the third one for U = 0.6 m/s. The needle length in the first column is I = 1 mm (Q = 3210mms/s), in the second one I = 6mm (Q = 539 mm3/s), and in the third one I = 20 mm (Q = 162 mm3/s).
flow rate. Secondly, the force on the bubble becomes so strong that the neck is rapidly pulled, which prevents it from collapsing and releasing the bubble. A similar phenomenon for the analogous case of a liquid thread is discussed by Frankel & Weihs (1985). Although the new gas arriving from the needle is used in part to fill up the elongating neck, the bubble remains attached somewhat longer than before and therefore has more time to grow. Eventually, this decrease in the growth rate reduces the added mass effect, the stretching of the stem decreases, and a breakup occurs near the bubble, where the stretching is least.
These qualitative considerations may be made somewhat more quantitative by a

Bubble growth and detachment .from a needle 143
simple argument similar to those used in $3. If, again, one uses the approximation of a constant growth rate, (44) gives, in place of (17),
z=- ;g t= +ut. (45) With the substitution 2 = R, which is approximately valid at the time of bubble detachment, and grcR3 = Qt, this equation may be recast in the form
4nR2 U 3Q
where R is the detachment radius for U = 0 given by (19) and K is an order-one constant introduced to account in a crude way for the many approximations implicit in this model. The dotted lines in figure 15 have been obtained with K = 1.35 and show a quantitative agreement of this relation with the descending portion of the curves for the two largest values of Q. For the smaller growth rates the agreement is less satisfactory. An approximation to the root of (46) valid for large U is (dashed lines)
R Z (EE), - (47)
which is in reasonable agreement with the dotted lines of figure 15. As the liquid velocity increases, the line corresponding to the smallest growth rate
in figure 15 dips below the Fritz radius thus demonstrating the possibility of producing small bubbles in this way. The effect is minor for this example, but becomes much stronger for a smaller needle radius as shown in figure 16 for a = 0.1 mm. This figure is a composite showing the detaching bubble for different values of the flow velocity U and gas duct length 1 (or gas flow rate Q). The squares have a side of 1Oa = 1 mm, the liquid velocity, from top to bottom, equals 0,0.3, and 0.6 m/s, and the gas volumetric flow rates are, from left to right, 3210, 539, and 162 mm3/s. For p c = 102.95 kPa and p , = 100.00 kPa these values correspond to needle lengths of 1, 6, and 20 mm respectively. The number in the left-hand corner of each frame indicates the calculated detachment time in ms. This figure is interesting on several grounds. In the first place, it demonstrates the wide latitude that is available for a given needle size. This fact clearly opens the way to the optimization of the system’s design to suit specific needs. Secondly, since the Fritz radius for this case is 1.04 mm, approximately equal to the side of one square, it graphically demonstrates the possibility of producing bubbles substantially smaller than this value, such as the one in the lower right-hand corner, and at much higher rates.
8. Conclusions We have studied the production of gas bubbles from submerged vertical needles
under conditions in which dynamic effects are important. The model contains several idealizations, and notably the neglect of viscous effects, but the boundary-integral numerical results have been shown to be in remarkable agreement with experiment.
It has been found that the use of suitable flow resistances in the gas line permits an excellent control over the size of the released bubbles. A further degree of control can be gained by immersing the needle in a parallel upward flow. An example of the wide range of bubble sizes available with the same needle diameter but different liquid flow velocities and gas flow rates is illustrated in figure 16. The existence of different growth regimes has also been found and demonstrated in figure 2.

144 H. N . Oguz and A . Prosperetti
We believe that the results described here are of practical use for the reliable production of small bubbles at high rates, which is of importance in many applications in science and technology, but which has always proven to be a difficult task.
The authors wish to thank D. L. Hitt for his assistance in filming the experiment with a high-speed motion picture camera and Professor Longuet-Higgins for permission to reproduce figure 19 of his 1991 paper. This study has been supported by the Underwater Acoustics Program of the Office of Naval Research and by the National Science Foundation under grant CTS-8 9 18 144.
R E F E R E N C E S AL-HAYES, R. A. M. & WINTERTON, R. H. S. 1981 Bubble diameter on detachment in flowing
liquids. Intl J. Heat Mass Transfer 24, 223-230. ANAGBO, P. E., BRIMACOMBE, J. K. & WRAITH, A. E. 1991 Formation of ellipsoidal bubbles at a free-
standing nozzle. Chem. Engng Sci. 46, 781-788. BLAKE, J. R., TAIB, B. B. & DOHERTY, G. 1986 Transient cavities near boundaries. Part 1. Rigid
boundary. J . Fluid Mech. 170, 479497. BLAKE, J. R., TAIB, B. B. & DOHERTY, G. 1987 Transient cavities near boundaries. Part 2. Free
surface. J . Fluid Mech. 181, 197-212. CHUANG, S. C. & GOLDSCHMIDT, V. W. 1970 Bubble formation due to a submerged capillary tube
in quiescent and coflowing streams. Trans. ASME D : J. Basic Engng 92, 705-71 1. CLIFT, R., GRACE, J . R. & WEBER, M. E. 1978 Bubbles, Drops and Particles. Academic. DAVIDSON, J. F. & SCHULER, B. 0. G. 1960 Bubble formation at an orifice in an inviscid liquid.
FRANKEL, 1. & WEIHS, D. 1985 Stability of a capillary jet with linearly increasing axial velocity (with
FRITZ, W. 1935 Berechnung des maximale Volume von Dampfblasen. Phys. Z . 36, 379-384. GUERRI, L., LUCCA, G. & PROSPERETTI, A. 1982 A numerical method for the dynamics of non-
spherical cavitation of bubbles. In Proc. Second Intl Colloq. on Drops and Bubbles (ed. Le Croissette), pp. 175-181. Jet Propulsion Laboratory, Pasadena.
JASWON, M. A. & SYMM, G. T. 1977 Integral Equation Methods in Potential Theory and Elastostatics. Academic.
JENSSEN, B. M., EKKER, M., BRUBAKK, A. 0. & SIRA, A. 1991 Method for producing gas bubbles for use in air-embolism studies. Med. Biol. Engng Comput. 29, 104-108.
KUMAR, R. & KULOOR, N. R. 1970 The formation of bubbles and drops. Adv. Chem. Engng 8, 256368.
KURUSZ, M. 1984 Gaseous micro emboli: sources, causes and clinical considerations. In Proc. AAMI 19th Annual Meeting: Abstracts on the Application of Technology to Health Care, Apr 14-18, 1984 Washington, D.C., p. 44.
LEIGHTON, T. G., FAGAN, K. J. & FIELD, J. E. 1991 Acoustic and photographic studies of injected bubbles. Eur. J. Phys. 12, 77-85.
LIOW, J. L. & GRAY, N. B. 1988 A model of bubble growth in wetting and non-wetting liquids. Chem. Engng Sci. 43, 3129-3139.
LONGUET-HIGGINS, M. S., KERMAN, B. R. & LUNDE, K. 1991 The release of air bubbles form an underwater nozzle. J . Fluid Mech. 230, 365-390.
MARMUR, A. & RUBIN, E. 1976 A theoretical model for bubble formation at an orifice submerged in an inviscid liquid. Chem. Engng Sci. 31, 453463.
MATKOVITCH, V. I. 1984 Microbubble detection in blood. In Proc. 37th Annual Con$ on Engineering in Medicine and Biology 1984, Bethesda, MD, vol. 26, p. 196.
MILNE-THOMSON, L. M. 1960 Theoretical Hydrodynamics. Macmillan. OBuz, H. N. & PROSPERETTI, A. 1989 Surface-tension effects in the contact of liquid surfaces.
J. FIuid Mech. 203. 149-171.
Trans. Inst. Chem. Engrs 38, 335-342.
application to shaped charges). J. Fluid Mech. 155, 289-307.

Bubble growth and detachment from a needle 145
OBUZ, H. N. & PROSPERETTI, A. 1990 Bubble entrainment by the impact of drops on liquid surfaces.
PINCZEWSKI, W. V. 1981 The formation and growth of bubbles at a submerged orifice. Chem. Engng
PLESSET, M. S . & PROSPERETTI, A. 1977 Bubble dynamics and cavitation. Ann. Rev. Fluid Mech. 7,
PROSPERETTI, A. 1991 The thermal behaviour of oscillating gas bubbles. J . FZuidMech. 222,587-616. SLUYTER, W. M., SLOOTEN, P. C., COPRAJJ, C. A. & CHESTERS, A. K. 1991 The departure size of
pool-boiling bubbles from artificial cavities at moderate and high pressures. Zntl J . Multiphase
SUTHERLAND, K. M., DEREK, D. T. & GORDON, L. S. 1988 Independent control of blood gas poz and
TAN, R. B. H. & HARRIS, I. J. 1986 A model for non-spherical bubble growth at a single orifice.
TITOMANLIO, G., RIZZO, G. & ACIERNO, D. 1976 Gas bubble formation from submerged orifices -
TSUGE, H. & HIBINO, S. 1. 1983 Bubble formation from an orifice submerged in liquids. Chem. Engng
TSUGE, H., HIBINO, S. I. & NOJIMA, Y. 1981 Volume of a bubble formed at a single submerged orifice
WANG, Z. & BANKOFF, S. G. 1991 Bubble growth on a solid wall in a rapidly-depressurizing liquid
J. Fluid Mech. 219, 143-179.
Sci. 36, 405411.
145-185.
Flow, 17, 153-158.
pcoz in a bubble oxygenator. Clin. Phys. Physiol. Meas. 9, 97-105.
Chem. Engng Sci. 41, 3175-3182.
“simultaneous bubbling” from two orifices. Chem. Engng Sci. 31, 403-404.
Commun. 22, 63-79.
in flowing liquid. Intl Chem. Engng 21, 630-636.
pool. Intl J . Multiphase Fbw 17, 425-437.