dynamiccouplingandallostericnetworksinthe ... how do distal functional sites responsible for gpcr,...
TRANSCRIPT

Dynamic Coupling and Allosteric Networks in the � Subunitof Heterotrimeric G Proteins*□S
Received for publication, November 12, 2015, and in revised form, December 14, 2015 Published, JBC Papers in Press, December 24, 2015, DOI 10.1074/jbc.M115.702605
Xin-Qiu Yao‡1, Rabia U. Malik§¶1, Nicholas W. Griggs�, Lars Skjærven**, John R. Traynor�, Sivaraj Sivaramakrishnan¶,and Barry J. Grant‡2
From the Department of ‡Computational Medicine and Bioinformatics, §Cell and Developmental Biology, and �Pharmacology,University of Michigan, Ann Arbor, Michigan 48109, the **Department of Biomedicine, University of Bergen, 5020 Bergen, Norway,and the ¶Department of Genetics, Cell Biology, and Development, University of Minnesota, Minneapolis, Minnesota 55455
G protein � subunits cycle between active and inactive con-formations to regulate a multitude of intracellular signaling cas-cades. Important structural transitions occurring during thiscycle have been characterized from extensive crystallographicstudies. However, the link between observed conformations andthe allosteric regulation of binding events at distal sites criticalfor signaling through G proteins remain unclear. Here wedescribe molecular dynamics simulations, bioinformatics anal-ysis, and experimental mutagenesis that identifies residuesinvolved in mediating the allosteric coupling of receptor, nucle-otide, and helical domain interfaces of G�i. Most notably, wepredict and characterize novel allosteric decoupling mutants,which display enhanced helical domain opening, increased ratesof nucleotide exchange, and constitutive activity in the absenceof receptor activation. Collectively, our results provide a frame-work for explaining how binding events and mutations can alterinternal dynamic couplings critical for G protein function.
Heterotrimeric G proteins are key mediators of intracellularsignaling pathways that control diverse cellular processes rang-ing from movement and division to differentiation and neuro-nal activity (1). G proteins consist of three subunits: G�, G�,and G�. Bound with GDP, G� forms an inactive complex withits G�� subunit partners. Interaction with activated receptor(GPCR)3 promotes the exchange of GDP for GTP on G� and itsseparation from G��. Both isolated G� and G�� can then bindand activate or inhibit downstream effectors. GTP hydrolysisdeactivates G�, which subsequently reassociates with G��completing the cycle. This cycle is further regulated by twoclasses of additional proteins called regulators of G protein sig-
naling. These function as either GTPase-activating proteins(which promote GTP hydrolysis) or GDP dissociation inhibi-tors (GDIs, which hinder exchange of GDP for GTP) (2).Important conformational transitions occurring at each stageof this regulated cycle have been characterized from extensivecrystallographic studies. These include GDP, GTP analogue,G��, GTPase-activating protein, GDI and most recently GPCRbound complex structures of G�. However, the link betweenthe observed conformations and the atomic level mechanismsinvolved in coupling receptor association, G protein activation,and effector interaction remain unclear.
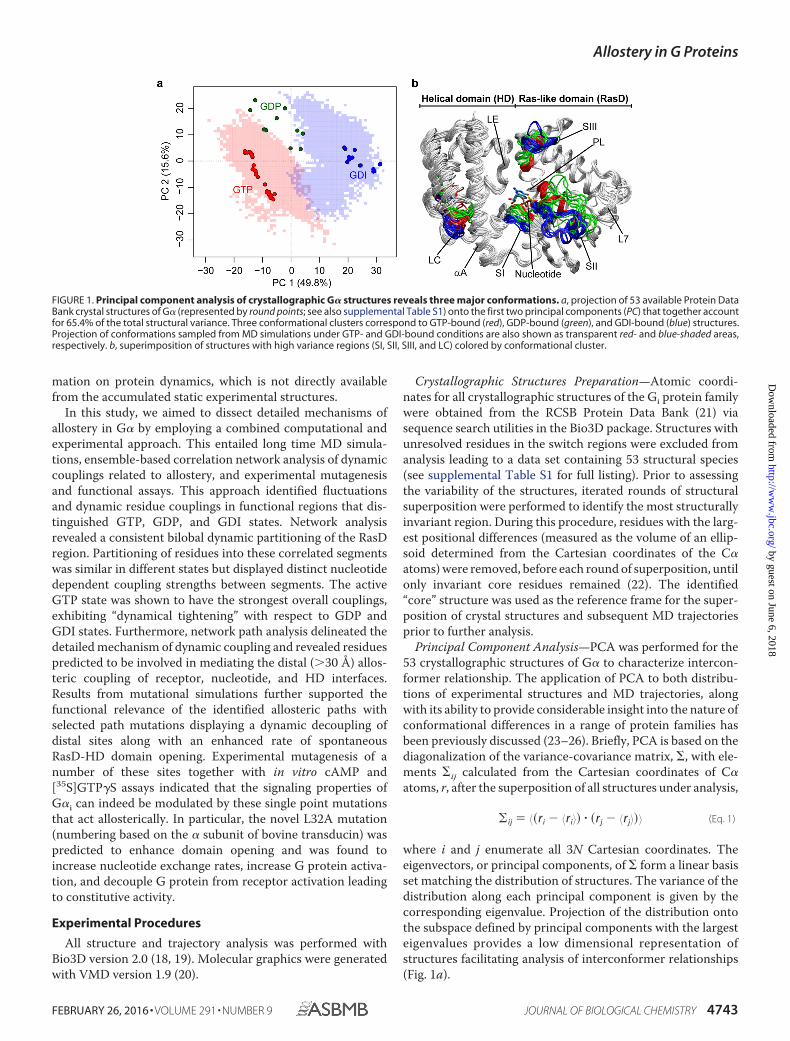
All G� proteins consist of a catalytic GTP binding Ras-likedomain (termed RasD) and a heterotrimeric G protein specifichelical domain (HD). Recent principal component analysis(PCA) of 53 available G� crystallographic structures identifiedthree major conformationally distinct groups (Fig. 1 and Ref. 3).These groups correspond to structures with bound GTP ana-logues, GDP, and GDI (red, green, and blue points in Fig. 1a,respectively). The major variation in the accumulated struc-tures is the concerted displacements of three nucleotide-bind-ing site loops termed the switch regions (SI, SII, and SIII), aswell as a relatively small scale (�10°) rotation of the constituentHD and RasD regions. A much larger (127°) clam-shell likedisplacement of the HD with respect to RasD was reportedrecently in the crystallographic structure of G�s (the � subunitof the stimulatory G protein for adenylyl cyclase) in complexwith G�� and the �2 adrenergic receptor (4). This conforma-tional change, which effectively exposes the otherwise buriednucleotide binding site, has been linked to GPCR-mediatednucleotide exchange (4). Evidence for domain opening has alsobeen obtained from recent electron microscopy (5), doubleelectron-electron resonance analysis (6), hydrogen-deuteriumexchange mass spectrometry (7), biochemical analysis (8), andmolecular dynamics (MD) simulations (3, 9, 10). In addition,the structure of Rasmussen and co-workers (7) together withmass spectrometry results also confirm that both N-terminal�1 strand and C-terminal �5 helix are major interaction sitesfor receptors. This supports the previously suggested role ofthese regions in coupling receptor binding and nucleotide dis-sociation activities (11–17). Despite these advances, criticalquestions remain unanswered: How do the distinct conforma-tions evident in the accumulated structures interconvert? Andcritically, how do distal functional sites responsible for GPCR,nucleotide, and partner protein binding allosterically coordi-nate their activities? Addressing these questions requires infor-
* This work was supported by University of Michigan, National Institutes ofHealth Grants R01-GM105646 (to S. S.) and R01-DA039997 (to J. R. T.), andAmerican Heart Association Predoctoral Fellowship 14PRE18560010 (toR. U. M.). The authors declare that they have no conflicts of interest withthe contents of this article. The content is solely the responsibility of theauthors and does not necessarily represent the official views of theNational Institutes of Health.
□S This article contains supplemental Table S1 and S2.1 These authors contributed equally to this work.2 To whom correspondence may be addressed: 100 Washtenaw Ave., 2017
Palmer Commons Bldg., Ann Arbor, MI 48109-2218. Tel.: 734-647-3113;E-mail: [email protected].
3 The abbreviations used are: GPCR, G protein-coupled receptor; GDI, GDPdissociation inhibitor; RasD, Ras-like domain; HD, helical domain; PCA,principal component analysis; MD, molecular dynamics; A1R, adenosine 1receptor; Fsk, forskolin; PTX, pertussis toxin; GTP�S, guanosine 5�-3-O-(thio)triphosphate; PL, P-loop.
crossmarkTHE JOURNAL OF BIOLOGICAL CHEMISTRY VOL. 291, NO. 9, pp. 4742–4753, February 26, 2016
© 2016 by The American Society for Biochemistry and Molecular Biology, Inc. Published in the U.S.A.
4742 JOURNAL OF BIOLOGICAL CHEMISTRY VOLUME 291 • NUMBER 9 • FEBRUARY 26, 2016
by guest on June 6, 2018http://w
ww
.jbc.org/D
ownloaded from
mation on protein dynamics, which is not directly availablefrom the accumulated static experimental structures.
In this study, we aimed to dissect detailed mechanisms ofallostery in G� by employing a combined computational andexperimental approach. This entailed long time MD simula-tions, ensemble-based correlation network analysis of dynamiccouplings related to allostery, and experimental mutagenesisand functional assays. This approach identified fluctuationsand dynamic residue couplings in functional regions that dis-tinguished GTP, GDP, and GDI states. Network analysisrevealed a consistent bilobal dynamic partitioning of the RasDregion. Partitioning of residues into these correlated segmentswas similar in different states but displayed distinct nucleotidedependent coupling strengths between segments. The activeGTP state was shown to have the strongest overall couplings,exhibiting “dynamical tightening” with respect to GDP andGDI states. Furthermore, network path analysis delineated thedetailed mechanism of dynamic coupling and revealed residuespredicted to be involved in mediating the distal (�30 Å) allos-teric coupling of receptor, nucleotide, and HD interfaces.Results from mutational simulations further supported thefunctional relevance of the identified allosteric paths withselected path mutations displaying a dynamic decoupling ofdistal sites along with an enhanced rate of spontaneousRasD-HD domain opening. Experimental mutagenesis of anumber of these sites together with in vitro cAMP and[35S]GTP�S assays indicated that the signaling properties ofG�i can indeed be modulated by these single point mutationsthat act allosterically. In particular, the novel L32A mutation(numbering based on the � subunit of bovine transducin) waspredicted to enhance domain opening and was found toincrease nucleotide exchange rates, increase G protein activa-tion, and decouple G protein from receptor activation leadingto constitutive activity.
Experimental Procedures
All structure and trajectory analysis was performed withBio3D version 2.0 (18, 19). Molecular graphics were generatedwith VMD version 1.9 (20).
Crystallographic Structures Preparation—Atomic coordi-nates for all crystallographic structures of the Gi protein familywere obtained from the RCSB Protein Data Bank (21) viasequence search utilities in the Bio3D package. Structures withunresolved residues in the switch regions were excluded fromanalysis leading to a data set containing 53 structural species(see supplemental Table S1 for full listing). Prior to assessingthe variability of the structures, iterated rounds of structuralsuperposition were performed to identify the most structurallyinvariant region. During this procedure, residues with the larg-est positional differences (measured as the volume of an ellip-soid determined from the Cartesian coordinates of the C�atoms) were removed, before each round of superposition, untilonly invariant core residues remained (22). The identified“core” structure was used as the reference frame for the super-position of crystal structures and subsequent MD trajectoriesprior to further analysis.
Principal Component Analysis—PCA was performed for the53 crystallographic structures of G� to characterize intercon-former relationship. The application of PCA to both distribu-tions of experimental structures and MD trajectories, alongwith its ability to provide considerable insight into the nature ofconformational differences in a range of protein families hasbeen previously discussed (23–26). Briefly, PCA is based on thediagonalization of the variance-covariance matrix, �, with ele-ments �ij calculated from the Cartesian coordinates of C�atoms, r, after the superposition of all structures under analysis,
� ij � ��ri � �ri�� � �rj � �rj��� (Eq. 1)
where i and j enumerate all 3N Cartesian coordinates. Theeigenvectors, or principal components, of � form a linear basisset matching the distribution of structures. The variance of thedistribution along each principal component is given by thecorresponding eigenvalue. Projection of the distribution ontothe subspace defined by principal components with the largesteigenvalues provides a low dimensional representation ofstructures facilitating analysis of interconformer relationships(Fig. 1a).
FIGURE 1. Principal component analysis of crystallographic G� structures reveals three major conformations. a, projection of 53 available Protein DataBank crystal structures of G� (represented by round points; see also supplemental Table S1) onto the first two principal components (PC) that together accountfor 65.4% of the total structural variance. Three conformational clusters correspond to GTP-bound (red), GDP-bound (green), and GDI-bound (blue) structures.Projection of conformations sampled from MD simulations under GTP- and GDI-bound conditions are also shown as transparent red- and blue-shaded areas,respectively. b, superimposition of structures with high variance regions (SI, SII, SIII, and LC) colored by conformational cluster.
Allostery in G Proteins
FEBRUARY 26, 2016 • VOLUME 291 • NUMBER 9 JOURNAL OF BIOLOGICAL CHEMISTRY 4743
by guest on June 6, 2018http://w
ww
.jbc.org/D
ownloaded from

Molecular Dynamics Simulations—MD simulations wereperformed with AMBER12 (27) and corresponding force fieldff99SB (28). Additional parameters for guanine nucleotideswere taken from Meagher et al. (29). The Mg2�GDP-boundtransducin crystal structure (Protein Data Bank code 1TAG)was employed as the starting model for GDP-bound simula-tions. The Mg2�GTP�S structure (Protein Data Bank code1TND) was used as the starting model for GTP-bound simula-tions. The sulfur atom (S1�) in the GTP�S was replaced withthe corresponding oxygen (O1�) of GTP. In addition, GDP-bound G�i/GoLoco motif complex structure (Protein DataBank code 1KJY) was employed as the starting model for GDI-bound simulations. These structures were identified as clusterrepresentatives from PCA. In all systems, Arg and Lys wereprotonated, whereas Asp and Glu were deprotonated. The pro-tonation states for His residues were determined based on aninspection of the residues local environment and their pKa val-ues as calculated by PROPKA (30). Simulation structures weresolvated in a truncated cubic box of pre-equilibrated TIP3Pwater molecules, which extended 12 Å in each dimension fromthe surface of the solute. Sodium counter ions (Na) wereadded to neutralize the systems. Additional ions were notadded to mimic physiological ionic strength. This may have theeffect of accentuating electrostatic interactions. Energy mini-mization was performed in four stages, with each stage employ-ing 500 steps of steepest decent followed by 1500 steps of con-jugate gradient. First, minimization for solvent only wasperformed with fixed positions of protein and ligand atoms.Second, side chain and ligand were relaxed with backbone stillfixed. Third, all protein and ligand atoms were relaxed withfixed solvent. Fourth, all atoms were free to move without anyrestraint. Following minimization, 10 ps of MD simulation wasperformed to heat the system from 0 to 300 K under constantvolume periodic boundary conditions. A further 1 ns of equili-bration simulation was performed at constant temperature(T 300 K) and constant pressure (p 1 bar). Subsequent80-ns production phase MD was then performed under thesame conditions as equilibration. For both energy minimiza-tion and MD simulations, the particle mesh Ewald summationmethod was adopted to treat long range electrostatic interac-tions. In addition, an 8 Å cutoff was used to truncate the shortrange nonbonded van der Waals’ interactions. Additional oper-ational parameters for MD included a 2-fs time step, removal ofthe center of mass motion every 1000 steps and update of thenonbonded neighbor list every 25 steps. All hydrogen atomswere constrained using the SHAKE algorithm.
Correlation Network Construction—Network analysis of cor-related motions was employed to identify protein segmentswith coupled dynamics. A weighted network graph was con-structed where each node represents an individual residue andthe weight of the connection between nodes, i and j, representstheir respective cross-correlation value, cij (31). This well estab-lished cross-correlation approach is based on linear atomic dis-placements during the course of simulations. Our evaluation ofmore recently developed nonlinear mutual information ofdihedral angle changes (32, 33) indicated that prohibitively lon-ger simulation and analysis time were likely required for thegeneration of robust networks (data not shown). We used a
network construction method similar to that introduced byLuthey-Schulten and co-workers (34). However, instead ofemploying a [4.5 Å] contact map of non-neighboring residuesto define network edges (that are then weighted by a singlecorrelation matrix), our network edges were constructed basedon the minimum C�-C� cross-correlation value between allresidues across five replicate simulations. Specifically, cross-correlations were calculated for each trajectory after mass-weighted superposition. Network edges were added for (i) res-idue pairs with �cij� � 0.6 in all simulations and (ii) residuessatisfying �cij� � 0.6 in at least one simulation and with a C�-C�distance dij � 10 Å for at least 75% of total simulation frames.Edge weights were calculated as �log(��cij��), where ���denotes the average across simulations. Networks constructedwith a cij cutoff between 0.5 and 0.7 yielded equivalent networkswith similar community structure (data not shown). This pro-cedure was found to reduce potentially false positive couplingsthat exist when using only a single trajectory, as well as mini-mize the arbitrary exclusion of consistent strong couplings thatare just beyond a given distance cutoff.
Network Community and Centrality Analysis—For each cor-relation network, hierarchical clustering was performed to gen-erate aggregate nodal clusters, or communities, that are highlyintraconnected but loosely interconnected, using a between-ness clustering algorithm similar to that introduced by Girvanand Newman (35). However, instead of using the partitionwith the maximum modularity score, as is common withunweighted networks, we took the partition closest to the max-imal modularity value that resulted in the smallest number ofoverall communities (i.e. the earliest high scoring partition).This avoided the common situation where many small commu-nities with equally high scoring modularity values were gener-ated. Using this approach networks under different statesshowed a largely consistent community partition, with differ-ences localized to the nucleotide binding P-loop (PL), SI, SII,and �1 regions that were observed to repartition between majorcommunities in the different states (data not shown). Consen-sus communities that abstracted these regions to new separatecommunities to facilitate further comparisons were derivedfrom partitioning these regions at the boundaries of theirknown conserved sequence motifs. Intercommunity correla-tions were then calculated as the sum of the mean correlationvalues across simulation replicates associated with all the inter-community edges. A standard t test was also performed to mea-sure the significance of the mean difference between intercom-munity correlations of distinct states.
Node centralities that assess the density of connections pernode were calculated as follows,
xi �1
� jGAijxj (Eq. 2)
where xi is the centrality of node i, Aij is the ijth entry of theadjusted adjacent matrix A, is a constant to be determined,and G indicates all nodes. Aij is not 0 if node i and j are linked,and it is equal to e�wij, where wij is the edge weight. SolvingEquation 2 for every i (i � G) is equivalent to finding the eigen-values and eigenvectors of matrix A. Node centralities can then
Allostery in G Proteins
4744 JOURNAL OF BIOLOGICAL CHEMISTRY VOLUME 291 • NUMBER 9 • FEBRUARY 26, 2016
by guest on June 6, 2018http://w
ww
.jbc.org/D
ownloaded from

be obtained from the eigenvector with the largest eigenvalue,after scaling all entries with the largest entry set to be 1.
Network Path Analysis—Given a pair of nodes treated as“source” and “sink,” respectively, optimal (shortest) and subop-timal (close to but longer than optimal) connecting networkpaths were identified using the algorithm in Ref. 36. Five hun-dred paths were collected for each source/sink pair in each net-work. Comparative path length distributions indicating thestrength of correlated motions under distinct conditions werethen calculated. In addition, normalized node degeneracy, i.e.the fraction of the number of paths going through each node,was calculated. Residues with high node degeneracy (�0.1 or 50paths) in any network were specified as “on-path” residues andwere subjected to further analysis including, for select cases,mutagenesis simulations and experimental characterization.
Molecular Cloning—cDNA for human adenosine A1 recep-tor (A1R) and G�i2 isoform 1 were acquired from DNASU Plas-mid Repository and Open Biosystems, respectively. N-terminalFlag-tagged G�i2 or A1R-G�i2 fusions and N-terminal mCeru-lean-tagged G�i2 were cloned into pBiex1 and pCDNA5/FRTplasmids, respectively. A1R and G�i2 were fused together usingthe previously described SPASM technique (37). Briefly, A1R-G�i2 fusions were cloned from N to C terminus as follows: A1R,mCitrine, ER/K linker, mCerulean, and G�i2. Repeating (Gly-Ser-Gly)4 sequences were inserted in between domains toensure rotational freedom. G�i2 and G�t (Bos taurus) residueswere aligned to identify the conserved Leu32, Phe195, andAsp333 residues in G�i2. L36A, F200L, or D338A mutations inG�i2 were induced via PCR using oligonucleotide-directedmutagenesis (QuikChange site-directed mutagenesis kit; Strat-agene). All constructs were confirmed via sequencing.
Mammalian Cell Culture—HEK293T-Flp-in (Invitrogen)cells were cultured in DMEM supplemented with 10% FBS(v/v), 4.5 g/liter D-glucose, 1% GlutaMAX, 20 mM HEPES, pH7.5, at 37 °C in a humidified atmosphere at 5% CO2. The cellswere plated at �30% confluence into 6-well tissue culturedtreated dishes. 16 –20 h later, the cells were transfected withindicated construct using XtremeGene HP DNA transfectionreagent. Where indicated, 24 h post-transfection, cells wereincubated with 100 ng/ml pertussis toxin (PTX) for 20 –24 h.Experiments were conducted when fusions or mCerulean-G�i2constructs expressed predominately at the plasma membranewith minimal internal localization as evaluated at 20 and 40 magnification on a Nikon tissue culture microscope with fluo-rescence detection. Experiments were performed at equivalentfusion expression at a cell density of 2 106 cells/ml. Fusionexpression was quantified by measuring mCitrine and mCeru-lean fluorescence by exciting cells at 490 and 430 nm, respec-tively. Excitation and emission bandpass were correspondinglyset to 8 and 4 nm. For mCerulean tagged G�i2 experiments, thecells were harvested at similar wild type and mutant G�i2expression levels. It should be noted that wild type, F195L, andD333A expressed twice as much as L32A mutant as indicatedby mCerulean fluorescence counts. Fusion integrity was evalu-ated by measuring mCitrine to mCerulean emission ratio. Thisratio was held between 1.7 and 2.1 because mCitrine is twice asbright as mCerulean. All fluorescence measurements were con-
ducted using FlouroMax-4 fluorometer (Horiba Scientific) inan optical glass cuvette.
Quantification of cAMP Levels—Protocol was conducted aspreviously described using the cAMP Glo luminescence basedassay (Promega) (38). Briefly, 28 –30 h post-transfection, thecells were spun down (300 g, 3 min), resuspended at 1 106
cells/ml in PBS solution supplemented with 0.02% glucose and800 �M ascorbic acid and aliquoted into 96-well round bottomopaque microplates. The cells were treated with 0.25 mM
3-isobutyl-1-methylxanthine, 1 �M forskolin, or 10 �M forsko-lin in the presence or absence of A1R agonist (12.5 nM N6-cy-clopentyladenosine) for 5 min at 37 °C. After incubation withindicated compounds, the cells were lysed, and protocol wasfollowed according to the manufacturer’s recommendations.Luminescence was recorded using a microplate luminometer(SpectraMax M5; Molecular Devices). cAMP levels (relativeluminescence units) were calculated by subtracting theuntransfected untreated background from the indicated condi-tions. Each experiment had four repeats per condition and wasrepeated at least three times (n � 12).
Insect Cell Culture and Protein Purification—Sf9 cells werecultured and maintained in suspension with shaking at 28 °C inSf900-II medium (Life Technologies) containing 1% Antibiotic-Antimycotic (Life Technologies). Constructs were transientlytransfected into Sf9 cells using Escort IV transfection reagent(Sigma-Aldrich) in antibiotic-free medium. The cells werelysed 3 days post-transfection in HEPES lysis buffer (20 mM
HEPES, pH 7.5, 0.5% Igepal, 4 mM MgCl2, 200 mM NaCl, 7%sucrose, 5 mM DTT, 50 �g/ml PMSF, 5 �g/ml aprotinin, 5�g/ml leupeptin). Lysates were clarified by ultracentrifugation(175,000 g, 4 °C, 45 min) and bound to anti-FLAG M2 affinityresin (Sigma-Aldrich). Resin was washed with HEPES washbuffer (20 mM HEPES, pH 7.5, 150 mM KCl, 5 mM MgCl2, 5 mM
DTT, 50 �g/ml PMSF, 5 �g/ml aprotinin, 5 �g/ml leupeptin)and eluted using FLAG peptide (Sigma-Aldrich). Protein con-centration and integrity were assessed by SDS-PAGE and Coo-massie staining in comparison to BSA standards.
Nucleotide Exchange and [35S]GTP�S Incorporation—Bind-ing of [35S]GTP�S to purified G�i protein was based on themethod outlined in Ref. 39. Briefly, the assay mixture contained0.5 �g of purified G�i protein in TED buffer (20 mM Tris-HCl,pH 7.4, 1 mM DTT, 1 mM EDTA, 0.1 mM MgCl2) with 2 �M
GTP�S and 0.1 nM [35S]GTP�S, unless otherwise stated, in atotal volume of 200 �l. Experiments were performed at roomtemperature (25 °C), unless stated otherwise, and 50-�l sam-ples were withdrawn and diluted 1:4 in ice-cold TED buffer tostop the reaction at various time points. Aliquots were vacuum-filtered through GF/C filters, and the amount of bound radio-activity was quantified by scintillation counting. Data were ana-lyzed using GraphPad Prism as one-phase association curves.
Results
GTP-, GDP-, and GDI-bound States Display Distinct Flex-ibilities and Dynamic Couplings in Known FunctionalRegions—Five 80-ns MD simulations for each state (GTP, GDP,and GDI totaling 1.2 �s; see “Experimental Procedures”)revealed residue fluctuations that clearly distinguished states(Fig. 2a). Specifically, the SI, SII, and SIII regions were found to
Allostery in G Proteins
FEBRUARY 26, 2016 • VOLUME 291 • NUMBER 9 JOURNAL OF BIOLOGICAL CHEMISTRY 4745
by guest on June 6, 2018http://w
ww
.jbc.org/D
ownloaded from

be more flexible in GDP and GDI states than in the GTP state.Conversely, a more flexible L7 region (the loop between �3 and�5) was apparent for the GTP state only. The possible role of L7in receptor binding has been suggested by both crystallographicstudies (4) and mutagenesis experiments (40). Furthermore,fluctuation analysis revealed a more rigid HD region in the GDIstate, with fluctuations at multiple sites predicted to be smallerin the GDI state than those in either GTP or GDP state.
MD derived residue-residue couplings also clearly distin-guished GTP, GDP, and GDI states (Fig. 2, b and c). This anal-ysis revealed that the GTP state had significantly stronger cou-plings in the PL and switch regions, whereas the GDI state haduniquely strong couplings around the region between RasD(SIII) and HD (the loop between �D and �E, or LE) and theregion between �A and SI (Fig. 2, b and c). It is important tonote that results from a simple difference contact map analysisof trajectories did not reveal the full extent of the dynamic cou-pling difference reported here (data not shown). This highlightsthe importance of employing dynamic coupling analysis to pro-vide additional context for the interpretation of both global andlocal structural dynamic changes of potential functional rele-vance. In the next section, we further dissect these apparentdynamic couplings with network analysis to obtain insight intopotential mechanisms of long range dynamic coupling in G� ofrelevance to allostery.
Correlation Network Analysis Further Characterizes State-specific Dynamic Couplings and Reveals the Intrinsic Dynami-cal Modularity of G�—For each state, a weighted correlationnetwork graph was constructed from the MD simulationresults. Each node of the graph represented an individual resi-due, and the weight of the connection between nodes was pro-portional to their respective correlation value calculated frommultiple replicate MD simulations. To reduce noise, i.e. “falsepositive” couplings that may exist only in a single trajectory, weinspected the robustness of each coupling over multiple simu-lation trajectories and constructed an ensemble-averaged net-work with each edge representing only significant residue-res-idue correlations present in the entire simulation set for a givenstate (see “Experimental Procedures”). Eight highly connectednetwork regions are evident in Fig. 3a. This analysis assesses thedensity of connections per node (i.e. node centrality) and high-lights six regions in RasD and two regions in HD with a com-paratively high level of coupling. Within RasD, these six regionscan be equally partitioned into two major groups with theboundary located near L5 (the loop between �2 and �4). Thesecorrespond to the two major lobes reported first for Ras itselfusing structural and evolutionary sequence analysis (24). Lobe1, which includes all switch regions and the N-terminal half ofthe �-sheet, is highly conserved across distinct Ras isoforms,whereas lobe 2, which includes �3-�5 and the C-terminal half
FIGURE 2. State-specific residue fluctuations and dynamic couplings in G� from molecular dynamic simulations. a, ensemble averaged fluctuationanalysis reveals structural regions with significantly distinct flexibilities in GTP (red), GDP (green), and GDI (blue) states. Sites with a p value � 0.05 are highlightedwith a light gray background on the main plot. Short vertical tick lines on the top axis indicate the location of nucleotide binding site residues. Marginal black andgray rectangles indicate the location of major � helix and � strand secondary structure elements. b and c, state-specific residue couplings. Difference correlationvalues between GTP and GDP (b) and between GTP and GDI (c) states are shown. Major regions displaying distinct couplings are indicated with red (GTP) andblue (GDI) labels. Note that no major GDP specific couplings were evident from comparison with GTP (b) or GDI (data not shown) states.
Allostery in G Proteins
4746 JOURNAL OF BIOLOGICAL CHEMISTRY VOLUME 291 • NUMBER 9 • FEBRUARY 26, 2016
by guest on June 6, 2018http://w
ww
.jbc.org/D
ownloaded from
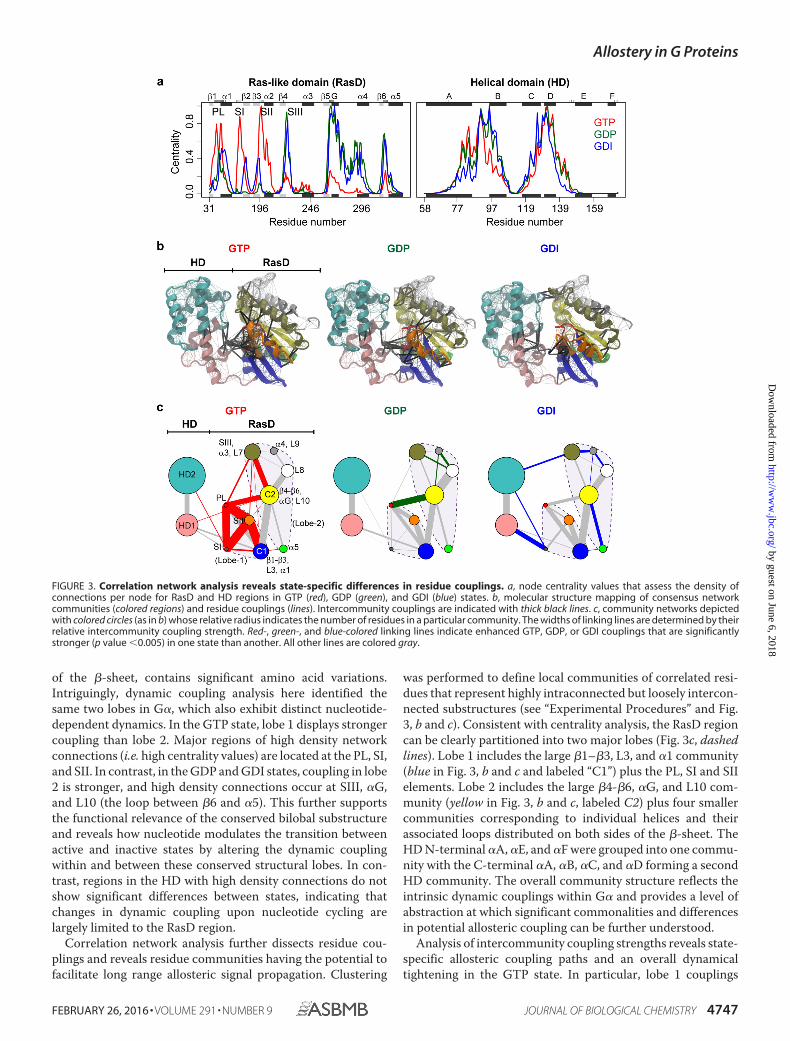
of the �-sheet, contains significant amino acid variations.Intriguingly, dynamic coupling analysis here identified thesame two lobes in G�, which also exhibit distinct nucleotide-dependent dynamics. In the GTP state, lobe 1 displays strongercoupling than lobe 2. Major regions of high density networkconnections (i.e. high centrality values) are located at the PL, SI,and SII. In contrast, in the GDP and GDI states, coupling in lobe2 is stronger, and high density connections occur at SIII, �G,and L10 (the loop between �6 and �5). This further supportsthe functional relevance of the conserved bilobal substructureand reveals how nucleotide modulates the transition betweenactive and inactive states by altering the dynamic couplingwithin and between these conserved structural lobes. In con-trast, regions in the HD with high density connections do notshow significant differences between states, indicating thatchanges in dynamic coupling upon nucleotide cycling arelargely limited to the RasD region.
Correlation network analysis further dissects residue cou-plings and reveals residue communities having the potential tofacilitate long range allosteric signal propagation. Clustering
was performed to define local communities of correlated resi-dues that represent highly intraconnected but loosely intercon-nected substructures (see “Experimental Procedures” and Fig.3, b and c). Consistent with centrality analysis, the RasD regioncan be clearly partitioned into two major lobes (Fig. 3c, dashedlines). Lobe 1 includes the large �1–�3, L3, and �1 community(blue in Fig. 3, b and c and labeled “C1”) plus the PL, SI and SIIelements. Lobe 2 includes the large �4-�6, �G, and L10 com-munity (yellow in Fig. 3, b and c, labeled C2) plus four smallercommunities corresponding to individual helices and theirassociated loops distributed on both sides of the �-sheet. TheHD N-terminal �A, �E, and �F were grouped into one commu-nity with the C-terminal �A, �B, �C, and �D forming a secondHD community. The overall community structure reflects theintrinsic dynamic couplings within G� and provides a level ofabstraction at which significant commonalities and differencesin potential allosteric coupling can be further understood.
Analysis of intercommunity coupling strengths reveals state-specific allosteric coupling paths and an overall dynamicaltightening in the GTP state. In particular, lobe 1 couplings
FIGURE 3. Correlation network analysis reveals state-specific differences in residue couplings. a, node centrality values that assess the density ofconnections per node for RasD and HD regions in GTP (red), GDP (green), and GDI (blue) states. b, molecular structure mapping of consensus networkcommunities (colored regions) and residue couplings (lines). Intercommunity couplings are indicated with thick black lines. c, community networks depictedwith colored circles (as in b) whose relative radius indicates the number of residues in a particular community. The widths of linking lines are determined by theirrelative intercommunity coupling strength. Red-, green-, and blue-colored linking lines indicate enhanced GTP, GDP, or GDI couplings that are significantlystronger (p value �0.005) in one state than another. All other lines are colored gray.
Allostery in G Proteins
FEBRUARY 26, 2016 • VOLUME 291 • NUMBER 9 JOURNAL OF BIOLOGICAL CHEMISTRY 4747
by guest on June 6, 2018http://w
ww
.jbc.org/D
ownloaded from

including PL/SI, PL/SII, SI/SII, and SII/C1 are significantlyenhanced in the active GTP state and weakened or absent in theinactive GDP and GDI states (Fig. 3c, red edges). Interlobe cou-plings to SIII (�3) and C2 are also significantly enhanced in theGTP state. In contrast intralobe 2 couplings, including SIII/L8,�4/L8, and �4/C2 are stronger in the GDP state than those inthe GTP and GDI states (Fig. 3c, green edges). Also noteworthyare the significantly stronger HD to RasD couplings evident forthe GDI state (Fig. 3c, blue edges). These state-specific dynam-ical coupling differences are robust to variations of networkmodel parameters and have potential implications for thenucleotide-dependent modulation of long range signal propa-gation. However, detailed dissection of these potential path-ways and the residues involved can be better addressed with themore fine-grained path analysis approach described belowtogether with targeted mutagenesis studies aimed at assessingtheir functional significance.
Network Path Analysis Reveals Distinct Features of GTP-,GDP-, and GDI-modulated Couplings of Distal FunctionalSites—Given a pair of residues, termed source and sink, 500suboptimal connecting coupling paths through each networkwere calculated. Path lengths were computed as a summationover the weights of traversed edges. Shorter paths representstronger dynamic coupling. Source and sink pairs were chosenthat represent receptor binding site to nucleotide �-phosphate(�-Pi) binding site (Ile339/Gly198) and receptor binding site tothe RasD-HD interface (Lys31/Asp146 and Ile339/Lys266; Fig. 4and supplemental Table S2). Note that both RasD-HD interfaceresidues, Asp146 and Lys266, were chosen based on the experi-mental observation that significantly enhanced mobilityaround LE and �G occurred after G� activation (7). The firstpair of residues is located at the C terminus of �5 and the �-Picoordinating SII region, respectively. For the GTP state, calcu-lated paths predominantly traversed the lobe 1 �-strands (�1,�2, and �3), whereas in the GDP and GDI states the dominantpaths involved �5, �1, and L10 from lobe 2 (Fig. 4a). Examiningthe distributions of path lengths indicated that the GTP statehad much shorter overall paths (Fig. 4b). This is indicative of
the apparent dynamical tightening of the lobe 1 region in theactive state evident from network community analysis (Fig. 3, band c). Paths from receptor coordinating �1 (Lys31) to theRasD-HD interface (Asp146) displayed differing favored routesin distinct states. In the GTP network, paths mainly traversed �1,�3, SI, and PL, whereas in the GDI network, the traversed regionsextended to �2 but excluded PL (Fig. 4c). In the GDP network, thetraversing region was mainly �1, �3, PL, and �1 (Fig. 4c). More-over, the path length distributions show that the GTP state hadmuch shorter paths than either GDP or GDI state, again demon-strating the dynamical tightening of the active state (Fig. 4d). Pathanalysis from receptor coordinating �5 (Ile339) to RasD-HD inter-face (Lys266) revealed a common major route through �5-L10-�G(supplemental Table S2) and similar path length distributionsacross GTP, GDP, and GDI states (data not shown). This indicatesthat the �1-HD pathway is more dynamic during G protein cyclingand potentially more sensitive to external modulations such assmall molecule binding and point mutations.
Normalized network node degeneracy, which characterizesthe percentage of total paths that traverse a given node,revealed that many high degeneracy residues are also highlyconserved in sequence (supplemental Table S2). Furthermore,previous in vitro mutagenesis of predicted on-path residues(occurring on �10% of total paths) indicates that many arefunctionally relevant. In particular, point mutations of residuesfrom SI (Arg174 and Thr177), �3 (Phe192), L10 (Cys321), and �5(Asn327, Val328, Phe330, Val331, Phe332, Asp337, Ile338, and Ile339)have shown significantly altered basal and receptor-catalyzednucleotide exchange rates (13, 17, 41, 42). All of these residues arecharacterized as playing a prominent role in coupling paths linkingreceptor-binding and domain-binding interfaces (i.e. high nodedegeneracy values; supplemental Table S2). Below we explorefurther how perturbations, introduced via point mutations, canpotentially affect these apparent coupling networks.
On Path Mutations Promote Domain Opening and DisruptLong range Couplings Linked to Receptor-catalyzed NucleotideExchange—Five replicate 80-ns GTP-bound MD simulationsand subsequent network analysis were performed on each of
FIGURE 4. State-specific coupling from receptor to nucleotide and helical domain interfaces. a, suboptimal paths linking�5 and SII for GTP (red), GDP (green), andGDI (blue) states. Line thickness scales with relative path length within a state with the shortest path rendered as the thickest line. Source and sink residues Ile339 andGly198 are labeled and rendered in stick representation. The bottom panels magnify path regions and have residues with high (�0.5) node degeneracy (proportion ofpaths traversing a given node) colored on the protein cartoon. b, probability density distribution of path lengths between�5 (Ile339) and SII (Gly198). c and d, suboptimalpaths between �1 and the RasD-HD interface (with source/sink pair Lys31/Asp146) and corresponding probability density distribution of path lengths. See alsosupplemental Table S2 for details of path analysis from receptor coordinating �5 to the RasD-HD interface (with source/sink pair Ile339/Lys266).
Allostery in G Proteins
4748 JOURNAL OF BIOLOGICAL CHEMISTRY VOLUME 291 • NUMBER 9 • FEBRUARY 26, 2016
by guest on June 6, 2018http://w
ww
.jbc.org/D
ownloaded from

five mutant variants: L32A, F195L, F332A, D333A and I339A.These positions were highlighted by path analysis as contribut-ing to the coupling of receptor, nucleotide and HD bindinginterfaces. The highly conserved �5 residue Ile339 and �1 resi-due Leu32 were identified as key mediators of GTP specific cou-plings between �5 and the �-sheet (Fig. 4a and supplementalTable S2). The �3 residue Phe195 was predicted to participate inthe coupling paths between �1 and the RasD-HD interface(supplemental Table S2). We note that a leucine substitution atan equivalent position in G�i2 has been reported to be associ-ated with ventricular tachycardia (43). The conserved residuePhe332 in �5 was identified to participate in the paths between�5 and RasD-HD interface (supplemental Table S2), and sub-stitution of an equivalent position in G�11 has been reported tobe associated with hypocalcemia (44). The importance ofPhe332 on nucleotide exchange has also been demonstrated inboth in vitro experiments and computational energetic analysis(13, 17, 45, 46). The �5 residue Asp333 is solvent-exposed andnot directly involved in contact with other structural elementsoutside of �5 but is predicted here to be a prominent on-pathsite (supplemental Table S2).
Our MD simulations of L32A, F332A, and I339A showed asubstantial effect on the rate of RasD-HD domain opening. Spe-cifically, these mutants displayed a 200-fold more populatedopen conformation than wild type during equivalent simula-tions (Fig. 5a). These mutants also displayed C�-based rootmean square deviation from the initial structure of up to 5– 6 Å,because of this relative domain opening. Interestingly, theD333A mutant simulations under the same conditions dis-played a similar level of domain opening to that of wild type,whereas F195L showed a more moderate level of enhanceddomain opening (Fig. 5a). Network path analysis indicated thatthe mutants with the most perturbed coupling paths (D333Aand F195L) displayed the least domain opening events. Con-versely, mutants with relatively unperturbed coupling paths(L32A, F332A, and I339A) displayed enhanced opening. Thissuggests that mutations mimicking the effect of receptor bind-ing may utilize wild type-like coupling paths for eliciting theirallosteric effect on domain opening. Detailed inspection furtherrevealed that only D333A and F195L mutations displaced on-path residues, most notably the SI region, leading to elongatedpath lengths. Collectively, these results indicate that both pathanalysis and subsequent mutant simulations are required forprediction of the structural dynamic effects of mutation. Ourpredictions parallel previous in vitro experimental measure-ments of enhanced spontaneous nucleotide exchange rates formutations equivalent to F332A and I339A (13, 17). The currentresults indicate that enhanced domain opening can lead toenhanced nucleotide exchange. However, currently very little isknown experimentally about the potential allosteric role oreffect of mutations at sites Leu32 and Asp333.
G�i Signaling Properties Are Modulated by the Predicted Sin-gle Point Mutations That Act Allosterically—To examine theeffect of our potential receptor-decoupling G�i mutants, weexperimentally assayed cAMP levels in HEK293 cells using therecently described SPASM GPCRs construct (see “Experimen-tal Procedures” and Ref. 37). Briefly, adenosine type 1 receptor(A1R) was fused to the N terminus of wild type or mutant G�i
using the SPASM module. At equivalent expression levels, mea-surements were performed in the presence and absence of theadenylyl cyclase activator, forskolin (Fsk), and adenosine recep-tor agonist, N6-cyclopentyladenosine in live cells (Fig. 5c). Asexpected, Fsk addition increased cAMP levels compared withbasal for all systems. However, the relative magnitude of thisincrease differs between mutants and wild type (Fig. 5c, dashedbars), as does the relative reduction of Fsk-stimulated cAMPlevels upon agonist addition (Fig. 5c, dashed versus filled bars).Treatment with Fsk alone resulted in a 1.6, 1.2, 0.4, and �0.3-fold increase in cAMP levels for wild type, F195L, D333A, andL32A mutants, respectively, compared with untransfected cells(Fig. 5c, dashed bars). The reduced basal cAMP levels forD333A and L32A compared with untransfected and wild typeindicate an enhanced level of Gi activity for these mutants evenin the absence of receptor stimulation (agonist free conditions;Fig. 5c, open bars). Furthermore, for L32A agonist addition hadlittle effect on Fsk-stimulated cAMP levels indicating that thismutant, and to a lesser extent D333A, are constitutively activeand do not require agonist stimulated receptor to exert theireffect on adenylyl cyclase. The constitutive activities of L32Aand D333A were also supported by independent PTX experi-ments. PTX inhibits GPCR-mediated activation of Gi (47). ThecAMP levels for D333A and L32A mutants were much lowerthan that for wild type even after PTX inhibition (Fig. 5, d ande). We note that D333A displays more moderate activity thanL32A in the absence of receptor agonist (Fig. 5c). This is con-sistent with its predicted reduced domain opening activity rel-ative to L32A (Fig. 5a). However, it is important to note that ouraccessible simulation time (5 80 ns) likely provides only apartial characterization of these rare events for such mutants.In such cases, enhanced sampling methods, such as acceleratedMD, may provide additional insight as we have previously dem-onstrated (3).
Binding of the nonhydrolyzable GTP analogue [35S]GTP�S(48) to G�i was used to compare nucleotide binding to L32Aand WT. Steady state levels of [35S]GTP�S binding were thesame in both L32A and WT, but the rate of association at 25 °Cwas faster in the L32A (t1⁄2 12.9 � 2.6 min) than the WT (t1⁄2 19.1 � 2.5 min; p 0.04, paired t test) (Fig. 5f). In an additionalexperiment at 37 °C using 0.4 nM [35S]GTP�S, rates of associa-tion were faster, but a similar difference was seen between L32A(t1⁄2 1.8 min) and WT (t1⁄2 5.3 min). These results are con-sistent with both cAMP assays (Fig. 5c) and MD simulations(Fig. 5a) and reveal the faster GTP binding kinetics of L32A.
Discussion
Our extensive MD simulations predicted nucleotide-depen-dent modes of motion and internal dynamic coupling of func-tional regions including SI, SII, SIII, PL, and HD. Correlationnetwork analysis characterized the conserved bilobal dynamicsubstructure of RasD reminiscent of that observed in Ras itself.Nucleotide turnover led to a modulation of the couplingbetween these substructures with an overall dynamical tighten-ing in the GTP state and enhanced HD-RasD couplings in theGDI state. Network path analysis and subsequent mutant sim-ulations highlighted residues of potential importance for thecoordination of receptor and nucleotide-binding site to the
Allostery in G Proteins
FEBRUARY 26, 2016 • VOLUME 291 • NUMBER 9 JOURNAL OF BIOLOGICAL CHEMISTRY 4749
by guest on June 6, 2018http://w
ww
.jbc.org/D
ownloaded from

RasD-HD interface. In particular, the on-path mutation D333Adisplayed disrupted dynamic coupling between distal func-tional sites, whereas L32A, F332A, and I339A led to anenhanced helical domain opening. Experimental characteriza-tion of D333A and L32A revealed constitutive activity in theabsence of receptor supporting the functional relevance ofthese allosteric mutations. Mutations of the additionally high-lighted Phe332 and Ile339 have been shown previously to resultin enhanced spontaneous rates of nucleotide exchange (13, 17).
Recent alanine scanning mutagenesis and thermostabilityassays by Sun et al. (46) identified clusters of hydrophobic res-
idues that confer differential stability to GDP-, GTP�S-, andrhodopsin-bound G�i1. In particular, residues in �5 (mostnotably Phe336, which is equivalent to our Phe332), �1 (includ-ing Ile49, Gln52, and Met53), and �1 (Leu38 equivalent to Leu34,which is a neighboring residue to our Leu32) were found toconfer greater thermal stability to GDP- and GTP�S-boundstates. Importantly, F336A was revealed to be the only substi-tution that resulted in both loss of stability and altered nucleo-tide binding kinetics. Using independent biophysical modeling,we report here that this substitution results in increaseddomain opening rates. This provides a clear structural
FIGURE 5. Computational and experimental mutagenesis of on path residues. a, fraction of domain opening events observed relative to WTsimulations for L32A, F195L, F332A, D333A, and I339A. The same WT simulation protocols and network analysis methods were implemented for allmutant simulations. Domain opening was detected whenever the minimum C�-C� distance between LE (on the HD side) and SIII (on RasD) exceeded10 Å in the cumulative 5 80-ns simulations. Control refers to a set of five separately performed WT simulations. Note that all simulations werestructurally stable as indicated by standard geometric analysis (data not shown). b, probability density distribution of path lengths from receptorcoordinating �1 (Lys31) to RasD-HD interface (Asp146) in WT and mutants. c, cAMP levels for the WT and mutant A1R-G�i fusions for indicated conditionsin live HEK293 cells (Untransfected (UN), 10 �M Fsk, and 12.5 nM N6-cyclopentyladenosine (CPA, A1R agonist)). d and e, cAMP levels for HEK293 cellsexpressing WT or mutant mCerulean labeled G�i, treated without (d) or with (e) forskolin (10 �M Fsk) in the presence or absence of PTX. PTX treatmentinhibits WT but not D333A and L32A activity, indicating that the latter display receptor-independent constitutive activity. f, representative time courseof [35S]GTP�S binding to purified WT and L32A mutant G�i. n.s.b., nonspecific binding.
Allostery in G Proteins
4750 JOURNAL OF BIOLOGICAL CHEMISTRY VOLUME 291 • NUMBER 9 • FEBRUARY 26, 2016
by guest on June 6, 2018http://w
ww
.jbc.org/D
ownloaded from

dynamic perspective consistent with the previous findingthat this mutation increases the rate of nucleotide release(17). In a similar manner, we report that the novel L32Amutation results in enhanced helical domain opening,increased nucleotide binding rates, and constitutive activityin the absence of receptor.
Using differential contact analysis of G� crystal structuresubsets, Flock et al. (49) recently suggested that structural con-tacts between �1 and �5 act as a “hub” for G� allosteric activa-tion. In this model, activation is mediated by the breaking ofcontacts between �5 and �1, leading to an increased flexibilityof �1 that promotes GDP release. The allosteric importance of�5 was also highlighted in recent long time scale MD simula-tions by Dror et al. (10). These simulations suggested that �5displacement upon receptor binding results in an increasedflexibility of the �6-�5 loop. This loop, located at the N termi-nus of �5, coordinates the guanosine moiety of a bound nucle-otide. Interestingly, Flock et al. state that residues contactingthe guanosine moiety, including the �6-�5 “are not extensivelyreorganized during G� activation.” In both the Flock et al. andDror et al. models, �5 acts as the primary initial conduit ofinformation transfer between the receptor and nucleotidebinding sites. The models differ in that Dror et al. propose thatflexibility differences of the �6-�5 loop complete the connec-tion to the guanosine moiety, whereas Flock et al. propose thatincreased �1 dynamics is the primary determinant of allostericcoupling. Our path analysis results support the importance of�5 in general and the �6-�5 loop in particular (Dror et al.model). However, we provide new evidence for a dominantalternate allosteric coupling route through �1 that directly linksfrom receptor to the phosphate coordinating P-loop. Both theC-terminal of �5 and the N-terminal �1 are known GPCRbinding interfaces. The increased dynamics of both regionsupon receptor binding were also evident in earlier hydrogen/deuterium exchange data (7). Moreover, our analysis of thestructural dynamic effects of mutations in these regionsreveals the novel role of �1 together with �2, �3, P-loop, andSI in the regulation of domain opening that is critical fornucleotide exchange.
More frequent RasD-HD domain separation has previouslybeen suggested to underlie the self-activation of the G proteinGPA1 from Arabidopsis thaliana (9). GPA1 is permanentlyactivated, has enhanced nucleotide exchange rates, and displaysenhanced domain opening in simulations relative to G�i.Intriguingly, investigations of chimeric proteins establishedthat the HD �A helix of GPA1 is almost entirely responsiblefor this enhanced activation. We note that the �A helix spansthe two major HD communities (Fig. 3, b and c) and that per-turbations to �A have the potential to effect dynamic couplingsin the entire HD region. Collectively, our mutational analysisand the GPA1 chimeric analysis indicate that sites distant fromregions involved in binding to receptors, effectors, and nucleo-tides can perturb the structural dynamics and function of Gproteins.
Our results indicate that network analysis of dynamic cou-plings from multiple replicate MD simulations is a promisingmethod to delineate features of protein allostery. Similar net-work approaches have been successfully applied to a number
of important biological systems (3, 34, 50 –54). The majorimprovement in our current implementation versus our previ-ous work (3, 52, 53) and that of others is the use of manymultiple replicate trajectories instead of results from singlesimulations. This reduces statistical errors in the calculatedcross-correlation matrix and resulting correlation network andimportantly allows for a more robust statistical assessment ofwithin state and between state dynamic coupling differences. Itis important to note that this widely applicable approach pro-vides structural and dynamic insights that are not immediatelyavailable from accumulated crystal structures or individualpairs of trajectories. Furthermore, combining this approachwith targeted computational and experimental mutagenesislays the foundation for dissecting the dynamic consequences ofdisease-associated mutations and the potential generality ofallosteric coupling mechanisms in related GTPase and ATPasesystems.
Author Contributions—B. J. G., X.-Q. Y., S. S., and J. R. T. designedthe study. X.-Q. Y. and B. J. G. performed and analyzed the MD sim-ulations. R. M. and N. W. G. performed and analyzed the experi-ment. X.-Q. Y., B. J. G., and L. S. developed methods for the compu-tational modeling and analysis. All authors reviewed the results andwrote the manuscript.
Acknowledgments—We thank Drs. G. Scarabelli and J. Tesmer forvaluable discussions.
References1. Neves, S. R., Ram, P. T., and Iyengar, R. (2002) G protein pathways. Science
296, 1636 –16392. Sprang, S. R. (1997) G protein mechanisms: insights from structural anal-
ysis. Annu. Rev. Biochem. 66, 639 – 6783. Yao, X.-Q., and Grant, B. J. (2013) Domain-opening and dynamic coupling
in the �-subunit of heterotrimeric G proteins. Biophys. J. 105, L08 –104. Rasmussen, S. G., DeVree, B. T., Zou, Y., Kruse, A. C., Chung, K. Y.,
Kobilka, T. S., Thian, F. S., Chae, P. S., Pardon, E., Calinski, D., Mathiesen,J. M., Shah, S. T., Lyons, J. A., Caffrey, M., Gellman, S. H., Steyaert, J.,Skiniotis, G., Weis, W. I., Sunahara, R. K., and Kobilka, B. K. (2011) Crystalstructure of the �2 adrenergic receptor-Gs protein complex. Nature 477,549 –555
5. Westfield, G. H., Rasmussen, S. G., Su, M., Dutta, S., DeVree, B. T., Chung,K. Y., Calinski, D., Velez-Ruiz, G., Oleskie, A. N., Pardon, E., Chae, P. S.,Liu, T., Li, S., Woods, V. L., Jr., Steyaert, J., Kobilka, B. K., Sunahara, R. K.,and Skiniotis, G. (2011) Structural flexibility of the G�s �-helical domainin the �2-adrenoceptor Gs complex. Proc. Natl. Acad. Sci. U.S.A. 108,16086 –16091
6. Van Eps, N., Preininger, A. M., Alexander, N., Kaya, A. I., Meier, S., Meiler,J., Hamm, H. E., and Hubbell, W. L. (2011) Interaction of a G protein withan activated receptor opens the interdomain interface in the � subunit.Proc. Natl. Acad. Sci. U.S.A. 108, 9420 –9424
7. Chung, K. Y., Rasmussen, S. G., Liu, T., Li, S., DeVree, B. T., Chae, P. S.,Calinski, D., Kobilka, B. K., Woods, V. L., Jr., and Sunahara, R. K. (2011)Conformational changes in the G protein Gs induced by the �2 adrenergicreceptor. Nature 477, 611– 615
8. Jones, J. C., Duffy, J. W., Machius, M., Temple, B. R., Dohlman, H. G., andJones, A. M. (2011) The crystal structure of a self-activating G protein �subunit reveals its distinct mechanism of signal initiation. Sci. Signal. 4,ra8
9. Jones, J. C., Jones, A. M., Temple, B. R., and Dohlman, H. G. (2012) Dif-ferences in intradomain and interdomain motion confer distinct activa-tion properties to structurally similar G� proteins. Proc. Natl. Acad. Sci.U.S.A. 109, 7275–7279
Allostery in G Proteins
FEBRUARY 26, 2016 • VOLUME 291 • NUMBER 9 JOURNAL OF BIOLOGICAL CHEMISTRY 4751
by guest on June 6, 2018http://w
ww
.jbc.org/D
ownloaded from

10. Dror, R. O., Mildorf, T. J., Hilger, D., Manglik, A., Borhani, D. W., Arlow,D. H., Philippsen, A., Villanueva, N., Yang, Z., Lerch, M. T., Hubbell, W. L.,Kobilka, B. K., Sunahara, R. K., and Shaw, D. E. (2015) Structural basis fornucleotide exchange in heterotrimeric G proteins. Science 348,1361–1365
11. Oldham, W. M., and Hamm, H. E. (2008) Heterotrimeric G protein acti-vation by G-protein-coupled receptors. Nat. Rev. Mol. Cell Biol. 9, 60 –71
12. Iiri, T., Herzmark, P., Nakamoto, J. M., van Dop, C., and Bourne, H. R.(1994) Rapid GDP release from Gs� in patients with gain and loss ofendocrine function. Nature 371, 164 –168
13. Marin, E. P., Krishna, A. G., and Sakmar, T. P. (2001) Rapid activation oftransducin by mutations distant from the nucleotide-binding site: evi-dence for a mechanistic model of receptor-catalyzed nucleotide exchangeby G proteins. J. Biol. Chem. 276, 27400 –27405
14. Kapoor, N., Menon, S. T., Chauhan, R., Sachdev, P., and Sakmar, T. P.(2009) Structural evidence for a sequential release mechanism for activa-tion of heterotrimeric G proteins. J. Mol. Biol. 393, 882– 897
15. Preininger, A. M., Funk, M. A., Oldham, W. M., Meier, S. M., Johnston,C. A., Adhikary, S., Kimple, A. J., Siderovski, D. P., Hamm, H. E., andIverson, T. M. (2009) Helix dipole movement and conformational varia-bility contribute to allosteric GDP release in G�i subunits. Biochemistry48, 2630 –2642
16. Thaker, T. M., Sarwar, M., Preininger, A. M., Hamm, H. E., and Iverson,T. M. (2014) A transient interaction between the phosphate binding loopand switch I contributes to the allosteric network between receptor andnucleotide in G�i1. J. Biol. Chem. 289, 11331–11341
17. Kaya, A. I., Lokits, A. D., Gilbert, J. A., Iverson, T. M., Meiler, J., andHamm, H. E. (2014) A conserved phenylalanine as relay between the �5helix and the GDP binding region of heterotrimeric Gi protein � subunit.J. Biol. Chem. 289, 24475–24487
18. Grant, B. J., Rodrigues, A. P., ElSawy, K. M., McCammon, J. A., and Caves,L. S. (2006) Bio3d: an R package for the comparative analysis of proteinstructures. Bioinformatics 22, 2695–2696
19. Skjaerven, L., Yao, X. Q., Scarabelli, G., and Grant, B. J. (2014) Integratingprotein structural dynamics and evolutionary analysis with Bio3D. BMCBioinformatics 15, 399
20. Humphrey, W., Dalke, A., and Schulten, K. (1996) VMD: visual moleculardynamics. J. Mol. Graph. 14, 33–38
21. Berman, H. M., Westbrook, J., Feng, Z., Gilliland, G., Bhat, T. N., Weissig,H., Shindyalov, I. N., and Bourne, P. E. (2000) The Protein Data Bank.Nucleic Acids Res. 28, 235–242
22. Gerstein, M., and Altman, R. B. (1995) Average core structures and vari-ability measures for protein families: application to the immunoglobulins.J. Mol. Biol. 251, 161–175
23. Caves, L. S., Evanseck, J. D., and Karplus, M. (1998) Locally accessibleconformations of proteins: multiple molecular dynamics simulations ofcrambin. Protein Sci. 7, 649 – 666
24. Gorfe, A. A., Grant, B. J., and McCammon, J. A. (2008) Mapping thenucleotide and isoform-dependent structural and dynamical features ofRas proteins. Structure 16, 885– 896
25. Grant, B. J., McCammon, J. A., Caves, L. S., and Cross, R. A. (2007) Mul-tivariate analysis of conserved sequence-structure relationships in kine-sins: coupling of the active site and a tubulin-binding sub-domain. J. Mol.Biol. 368, 1231–1248
26. van Aalten, D. M., Conn, D. A., de Groot, B. L., Berendsen, H. J., Findlay,J. B., and Amadei, A. (1997) Protein dynamics derived from clusters ofcrystal structures. Biophys. J. 73, 2891–2896
27. Case, D. A., Darden, T. A., Cheatham, T. E. I. I. I., Simmerling, C. L.,Wang, J., Duke, R. E., Luo, R., Walker, R. C., Zhang, W., Merz, K. M.,Roberts, B., Hayik, S., Roitberg, A., Seabra, G., Wails, J., Goetz, A. W.,Kolossvary, I., Wong, K. F., Paesani, F., Vanicek, J., Wolf, R. M., Liu, J.,Wu, X., Brozell, S. R., Steinbrecher, T., Gohlke, H., Cai, Q., Ye, X.,Hsieh, M. J., Cui, G., Roe, D. R., Mathews, D. H., Seetin, M. G., Salo-mon-Ferrer, R., Sagui, C., Babin, V., Luchko, T., Gusarov, S., Kova-lenko, A., and Kollman, P. A. (2012) AMBER 12, University of Califor-nia, San Francisco, CA
28. Hornak, V., Abel, R., Okur, A., Strockbine, B., Roitberg, A., and Sim-merling, C. (2006) Comparison of multiple Amber force fields and
development of improved protein backbone parameters. Proteins 65,712–725
29. Meagher, K. L., Redman, L. T., and Carlson, H. A. (2003) Development ofpolyphosphate parameters for use with the AMBER force field. J. Comput.Chem. 24, 1016 –1025
30. Li, H., Robertson, A. D., and Jensen, J. H. (2005) Very fast empirical pre-diction and rationalization of protein pKa values. Proteins 61, 704 –721
31. Ichiye, T., and Karplus, M. (1991) Collective motions in proteins: a cova-riance analysis of atomic fluctuations in molecular dynamics and normalmode simulations. Proteins 11, 205–217
32. Dubay, K. H., Bothma, J. P., and Geissler, P. L. (2011) Long-range intra-protein communication can be transmitted by correlated side-chain fluc-tuations alone. PLoS Comput. Biol. 7, e1002168
33. Wu, S., Jun Lee, C., and Pedersen, L. G. (2014) Analysis on long-rangeresidue-residue communication using molecular dynamics. Proteins 82,2896 –2901
34. Sethi, A., Eargle, J., Black, A. A., and Luthey-Schulten, Z. (2009) Dynamicalnetworks in tRNA:protein complexes. Proc. Natl. Acad. Sci. U.S.A. 106,6620 – 6625
35. Girvan, M., and Newman, M. E. (2002) Community structure in social andbiological networks. Proc. Natl. Acad. Sci. U.S.A. 99, 7821–7826
36. Yen, J. Y. (1971) Finding K shortest loopless paths in a network. Manage-ment Science Series A-Theory 17, 712–716
37. Malik, R. U., Ritt, M., DeVree, B. T., Neubig, R. R., Sunahara, R. K., andSivaramakrishnan, S. (2013) Detection of G protein-selective G protein-coupled receptor (GPCR) conformations in live cells. J. Biol. Chem. 288,17167–17178
38. Gabriel, D., Vernier, M., Pfeifer, M. J., Dasen, B., Tenaillon, L., andBouhelal, R. (2003) High throughput screening technologies for directcyclic AMP measurement. Assay Drug Dev. Technol. 1, 291–303
39. Slepak, V. Z., Wilkie, T. M., and Simon, M. I. (1993) Mutational analysis ofG protein � subunit Go� expressed in Escherichia coli. J. Biol. Chem. 268,1414 –1423
40. Grishina, G., and Berlot, C. H. (2000) A surface-exposed region of Gs� inwhich substitutions decrease receptor-mediated activation and increasereceptor affinity. Mol. Pharmacol. 57, 1081–1092
41. Nishina, H., Nimota, K., Kukimoto, I., Maehama, T., Takahashi, K.,Hoshino, S., Kanaho, Y., and Katada, T. (1995) Significance of Thr182 inthe nucleotide-exchange and GTP-hydrolysis reactions of the � subunit ofGTP-binding protein Gi2. J. Biochem. 118, 1083–1089
42. Thomas, T. C., Schmidt, C. J., and Neer, E. J. (1993) G-protein �o subunit:mutation of conserved cysteines identifies a subunit contact surface andalters GDP affinity. Proc. Natl. Acad. Sci. U.S.A. 90, 10295–10299
43. Lerman, B. B., Dong, B., Stein, K. M., Markowitz, S. M., Linden, J., andCatanzaro, D. F. (1998) Right ventricular outflow tract tachycardia due toa somatic cell mutation in G protein subunit �i2. J. Clin. Invest. 101,2862–2868
44. Nesbit, M. A., Hannan, F. M., Howles, S. A., Babinsky, V. N., Head, R. A.,Cranston, T., Rust, N., Hobbs, M. R., Heath, H., 3rd, and Thakker, R. V.(2013) Mutations affecting G-protein subunit �11 in hypercalcemia andhypocalcemia. N. Engl. J. Med. 368, 2476 –2486
45. Alexander, N. S., Preininger, A. M., Kaya, A. I., Stein, R. A., Hamm, H. E.,and Meiler, J. (2014) Energetic analysis of the rhodopsin-G-protein com-plex links the �5 helix to GDP release. Nat. Struct. Mol. Biol. 21, 56 – 63
46. Sun, D., Flock, T., Deupi, X., Maeda, S., Matkovic, M., Mendieta, S., Mayer,D., Dawson, R. J., Schertler, G. F., Babu, M. M., and Veprintsev, D. B.(2015) Probing G�i1 protein activation at single-amino acid resolution.Nat. Struct. Mol. Biol. 22, 686 – 694
47. Locht, C., Coutte, L., and Mielcarek, N. (2011) The ins and outs of pertus-sis toxin. FEBS J. 278, 4668 – 4682
48. Harrison, C., and Traynor, J. R. (2003) The [35S]GTPgammaS bindingassay: approaches and applications in pharmacology. Life Sci. 74, 489 –508
49. Flock, T., Ravarani, C. N., Sun, D., Venkatakrishnan, A. J., Kayikci, M.,Tate, C. G., Veprintsev, D. B., and Babu, M. M. (2015) Universal allostericmechanism for G� activation by GPCRs. Nature 524, 173–179
50. Vanwart, A. T., Eargle, J., Luthey-Schulten, Z., and Amaro, R. E. (2012)Exploring residue component contributions to dynamical network mod-els of allostery. J. Chem. Theory Comput. 8, 2949 –2961
Allostery in G Proteins
4752 JOURNAL OF BIOLOGICAL CHEMISTRY VOLUME 291 • NUMBER 9 • FEBRUARY 26, 2016
by guest on June 6, 2018http://w
ww
.jbc.org/D
ownloaded from
51. Gasper, P. M., Fuglestad, B., Komives, E. A., Markwick, P. R., and McCam-mon, J. A. (2012) Allosteric networks in thrombin distinguish procoagu-lant vs. anticoagulant activities. Proc. Natl. Acad. Sci. U.S.A. 109,21216 –21222
52. Scarabelli, G., and Grant, B. J. (2013) Mapping the structural and dy-namical features of kinesin motor domains. PLoS Comput. Biol. 9,
e100332953. Scarabelli, G., and Grant, B. J. (2014) Kinesin-5 allosteric inhibitors un-
couple the dynamics of nucleotide, microtubule, and neck-linker bindingsites. Biophys. J. 107, 2204 –2213
54. Guo, J., Pang, X., and Zhou, H.-X. (2015) Two pathways mediate interdo-main allosteric regulation in Pin1. Structure 23, 237–247
Allostery in G Proteins
FEBRUARY 26, 2016 • VOLUME 291 • NUMBER 9 JOURNAL OF BIOLOGICAL CHEMISTRY 4753
by guest on June 6, 2018http://w
ww
.jbc.org/D
ownloaded from

Sivaraj Sivaramakrishnan and Barry J. GrantXin-Qiu Yao, Rabia U. Malik, Nicholas W. Griggs, Lars Skjærven, John R. Traynor,
Proteins Subunit of Heterotrimeric GαDynamic Coupling and Allosteric Networks in the
doi: 10.1074/jbc.M115.702605 originally published online December 24, 20152016, 291:4742-4753.J. Biol. Chem.
10.1074/jbc.M115.702605Access the most updated version of this article at doi:
Alerts:
When a correction for this article is posted•
When this article is cited•
to choose from all of JBC's e-mail alertsClick here
Supplemental material:
http://www.jbc.org/content/suppl/2015/12/24/M115.702605.DC1
http://www.jbc.org/content/291/9/4742.full.html#ref-list-1
This article cites 53 references, 16 of which can be accessed free at
by guest on June 6, 2018http://w
ww
.jbc.org/D
ownloaded from